
Accuracy between 2D Photography and Dual-Structured Light 3D Facial Scanner for Facial Anthropometry: A Clinical Study
 , and
, and
Abstract
:1. Introduction
2. Materials and Methods
2.1. Participant Selection
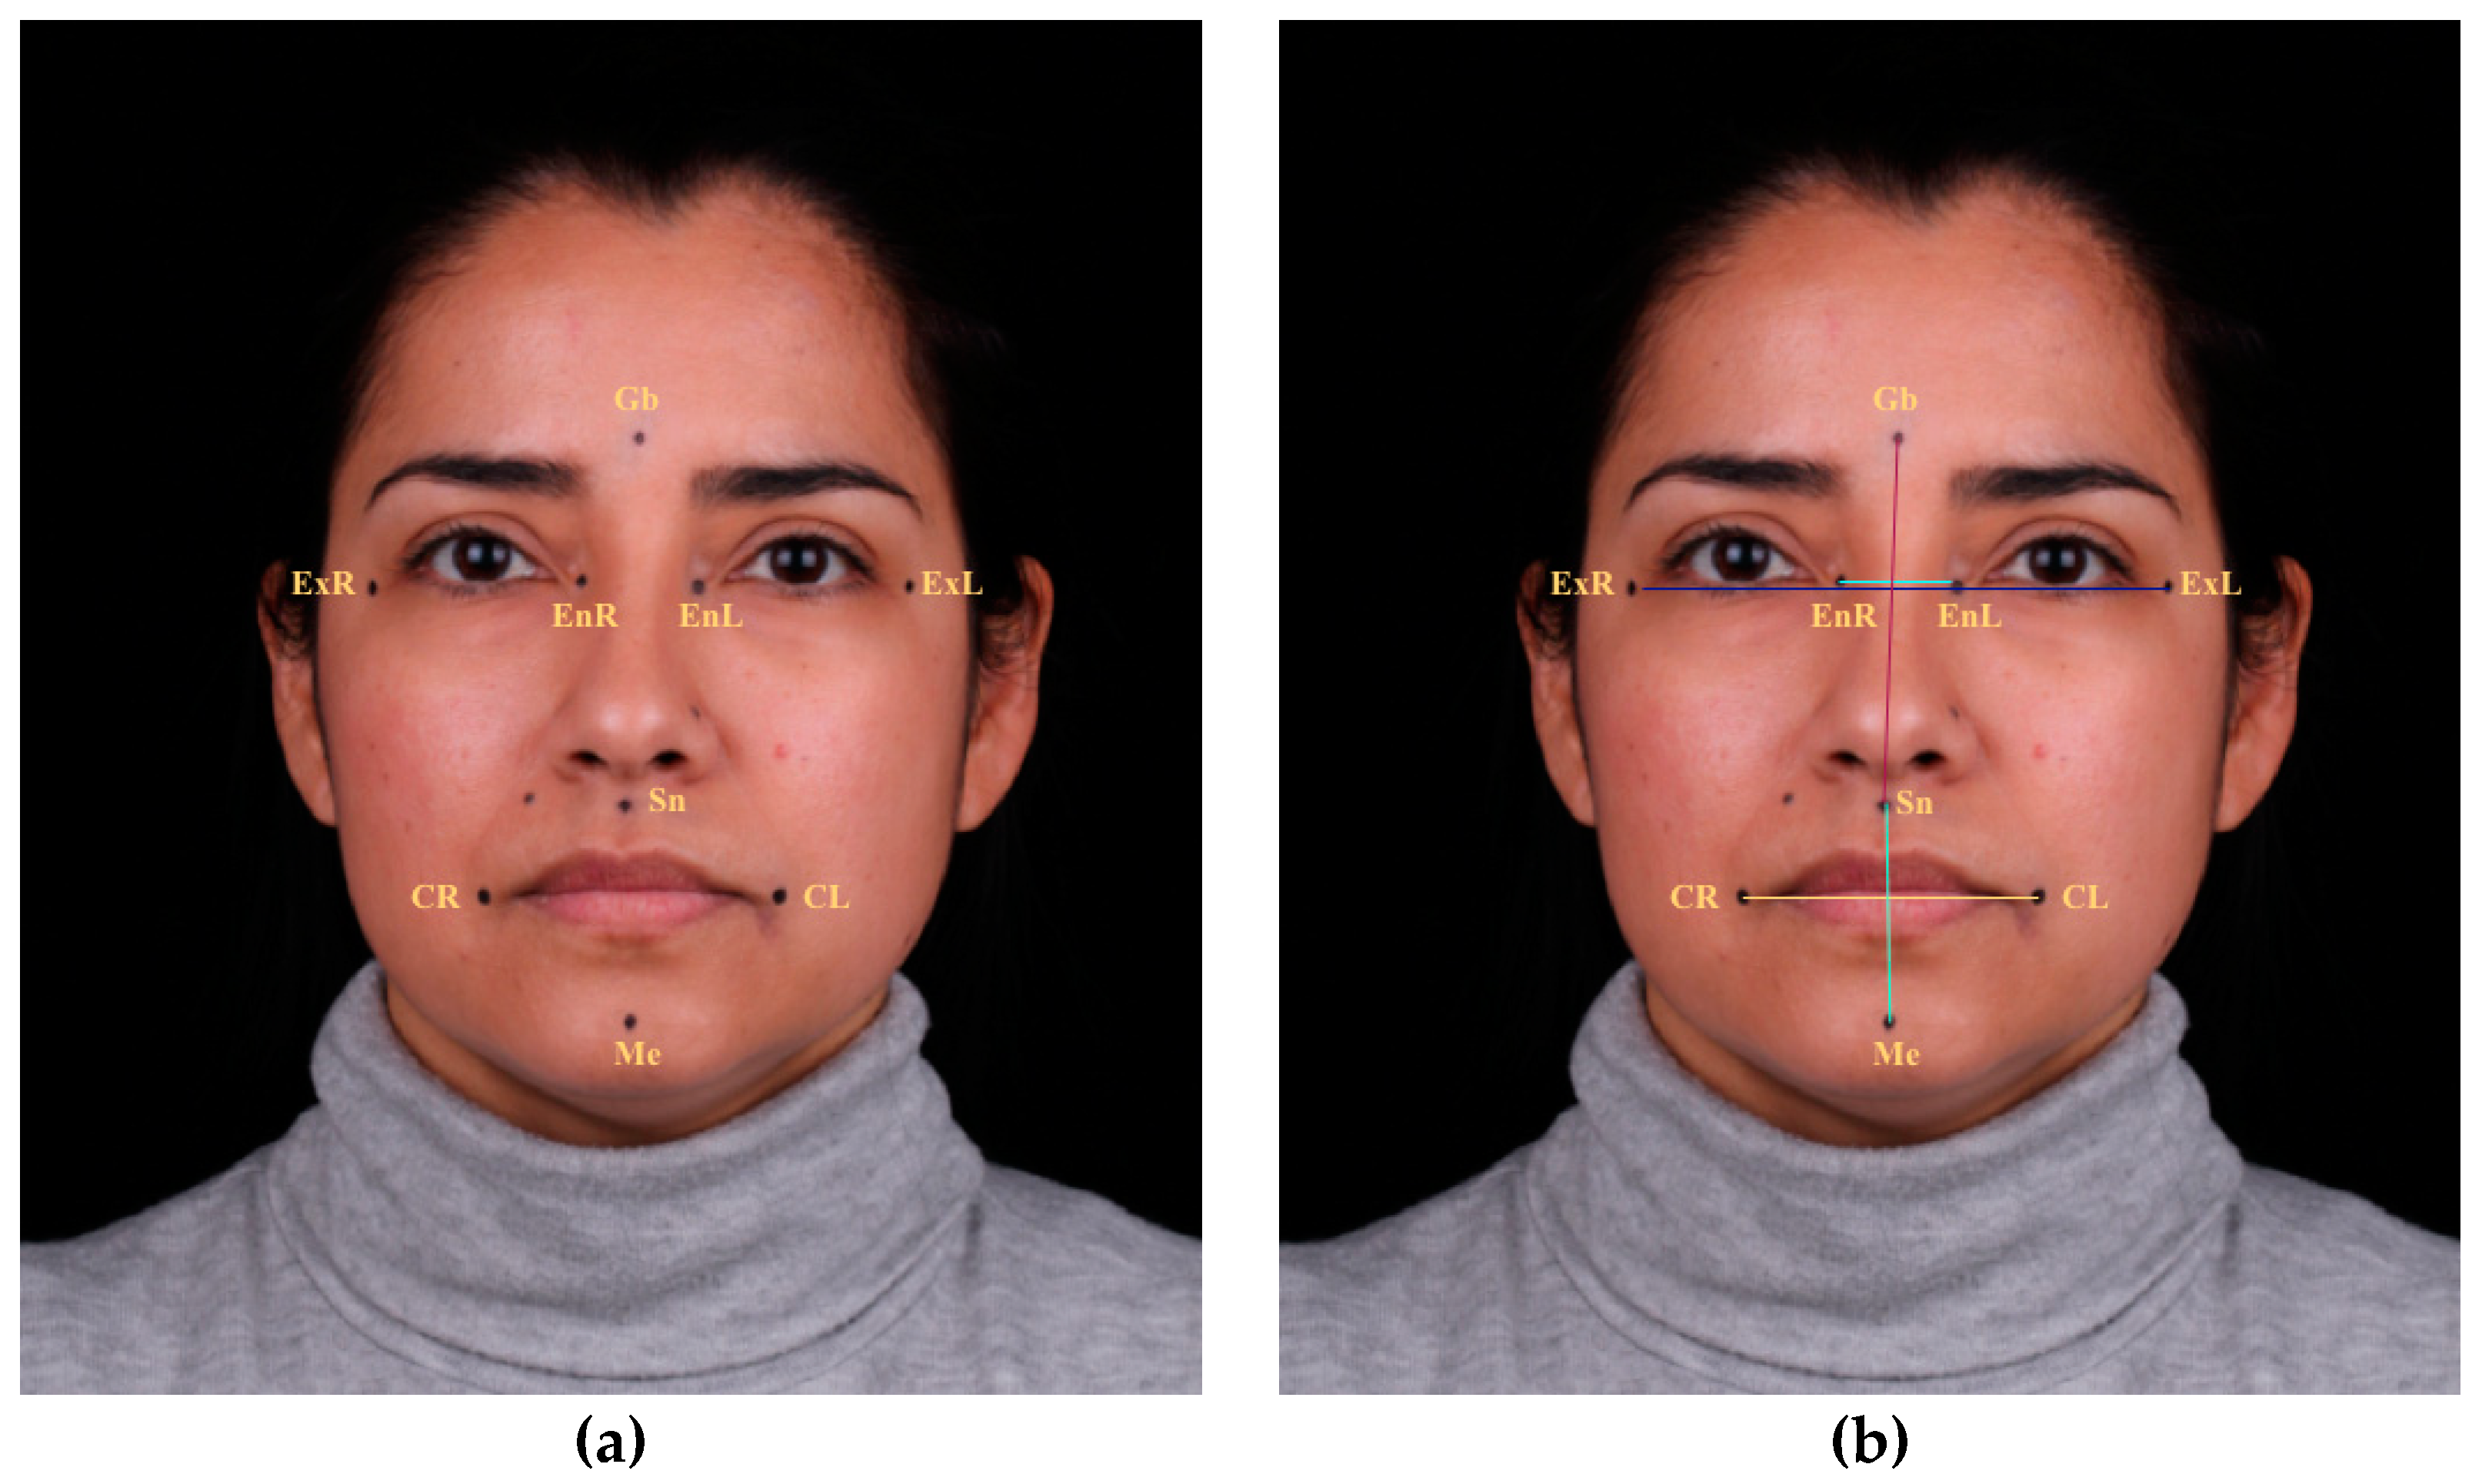
2.2. Soft Tissue Landmarks and Linear Measurements
2.3. Measurements Conditions
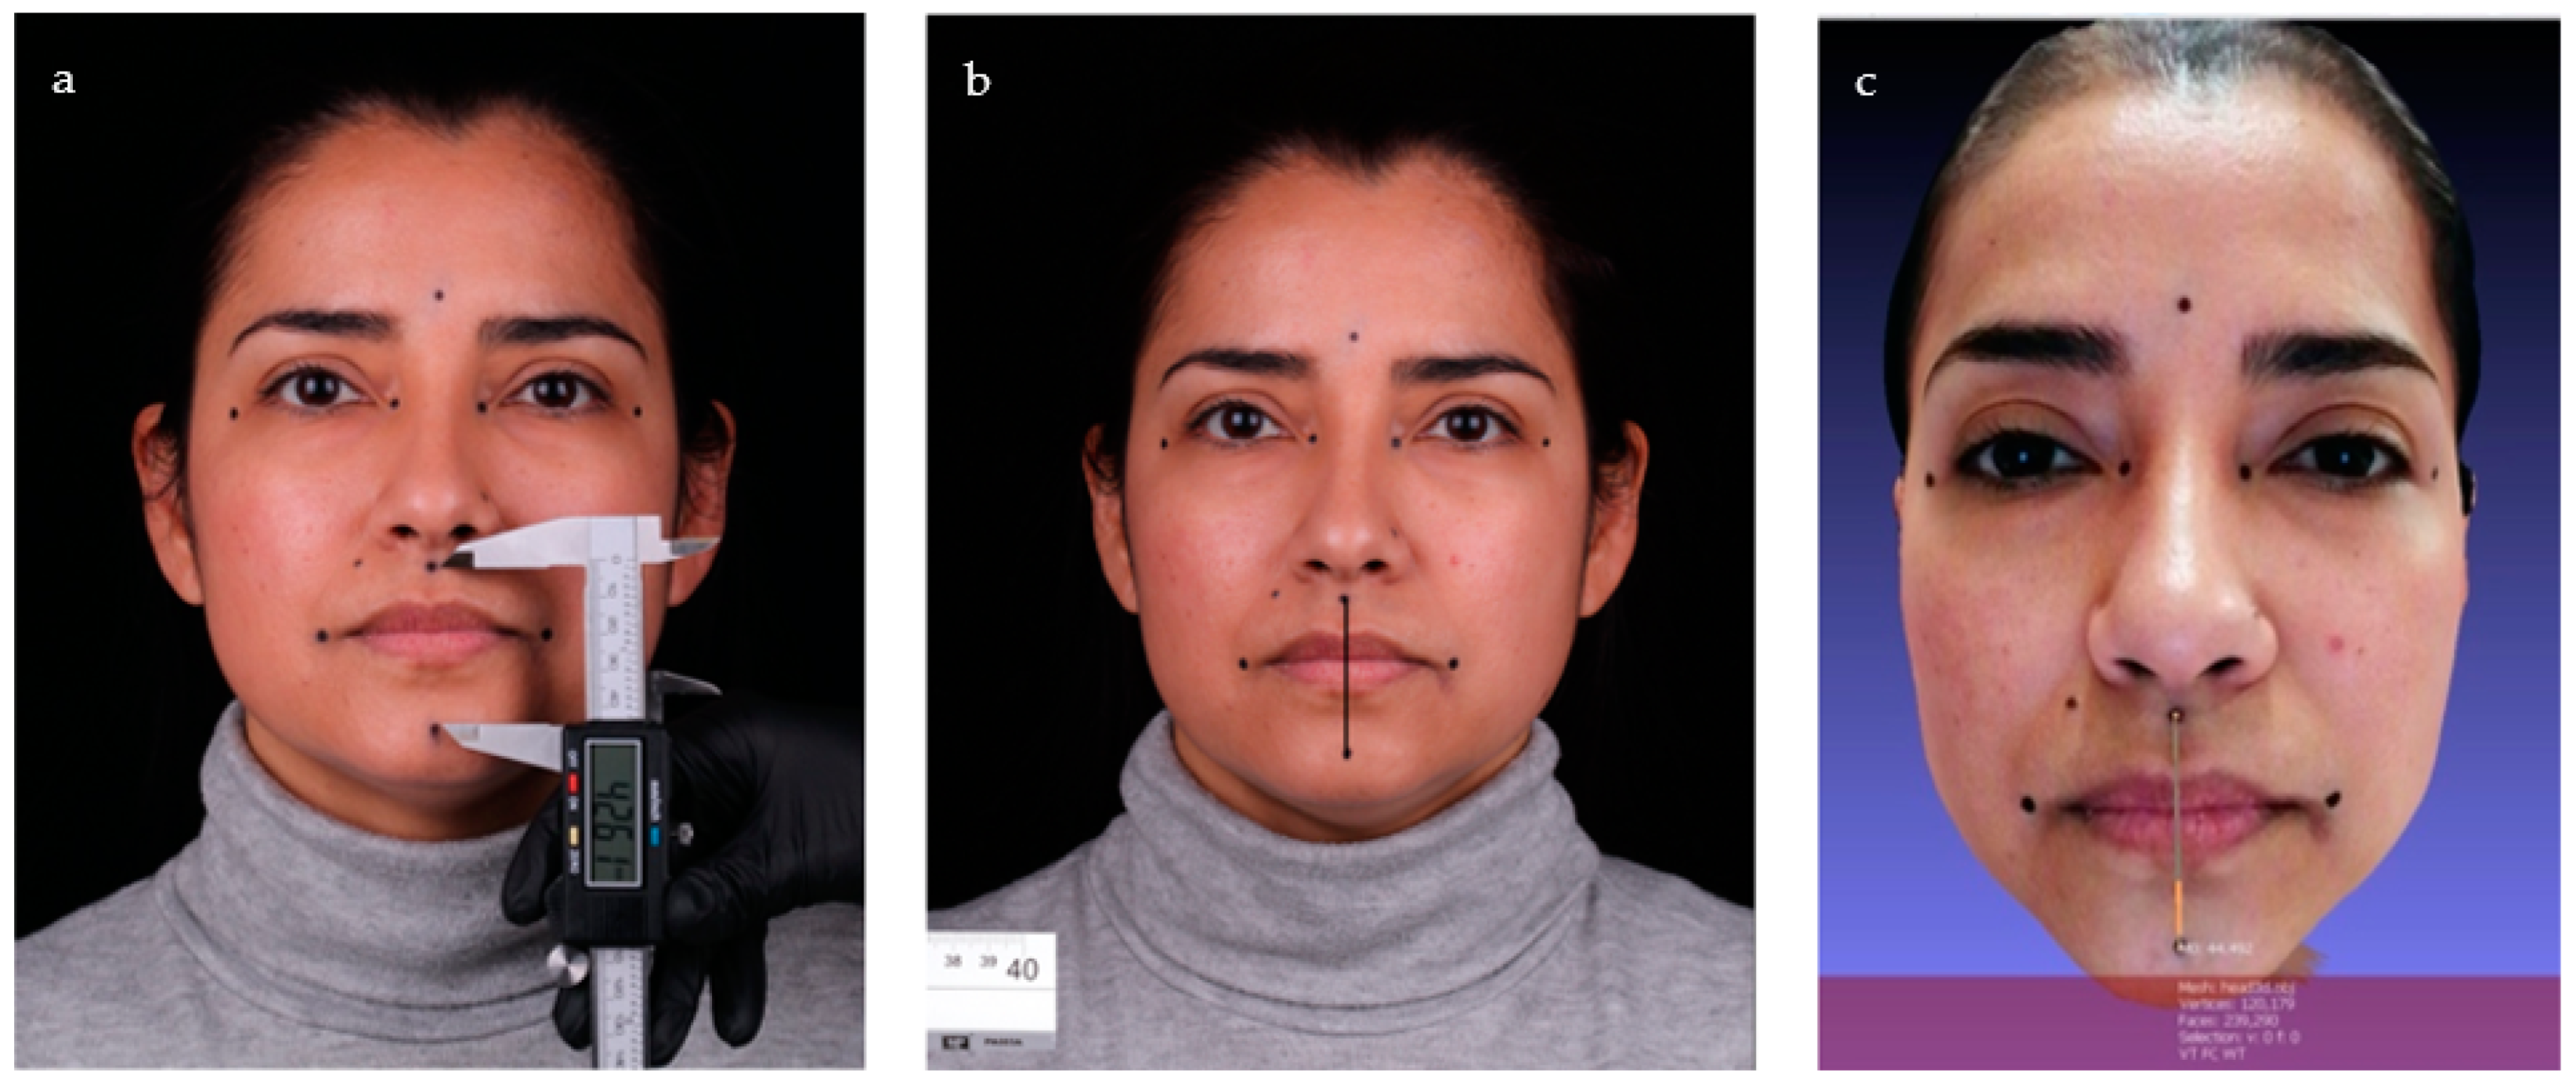
2.4. Manual Method
2.5. Two-Dimensional Method
2.6. Thee-Dimensional Method
2.7. Statistical Analysis
3. Results
4. Discussion
5. Conclusions
- The dual-structured light facial scanner (3D method) used in this study can be considered an accurate method for the reproduction of facial soft tissues, with clinically acceptable values in both relaxed and contracted facial muscle conditions.
- The 2D method using photography was found to be inaccurate for the reproduction of facial soft tissues, as the values obtained were not clinically acceptable.
Author Contributions
Funding
Institutional Review Board Statement
Informed Consent Statement
Data Availability Statement
Conflicts of Interest
References
- Piedra-Cascón, W.; Meyer, M.J.; Methani, M.M.; Revilla-León, M. Accuracy (Trueness and Precision) of a Dual-Structured Light Facial Scanner and Interexaminer Reliability. J. Prosthet. Dent. 2020, 124, 567–574. [Google Scholar] [CrossRef] [PubMed]
- Anas, I.Y.; Bamgbose, B.O.; Nuhu, S. A Comparison between 2d and 3d Methods of Quantifying Facial Morphology. Heliyon 2019, 5, 01880. [Google Scholar] [CrossRef] [PubMed]
- Franco de Sá Gomes, C.; Libdy, M.R.; Normando, D. Scan Time, Reliability and Accuracy of Craniofacial Measurements Using a 3D Light Scanner. J. Oral Biol. Craniofac. Res. 2019, 9, 331–335. [Google Scholar] [CrossRef] [PubMed]
- Beaumont, C.A.A.; Knoops, P.G.M.; Borghi, A.; Jeelani, N.U.O.; Koudstaal, M.J.; Schievano, S.; Dunaway, D.J.; Rodriguez-Florez, N. Three-Dimensional Surface Scanners Compared with Standard Anthropometric Measurements for Head Shape. J. Craniomaxillofac. Surg. 2017, 45, 921–927. [Google Scholar] [CrossRef] [PubMed]
- Millar, B. Esthetic Rehabilitation in Fixed Prosthodontics: Esthetic Analysis—A Systematic Approach to Prosthetic Treatment Volume 1. Br. Dent. J. 2005, 198, 654. [Google Scholar] [CrossRef]
- Coachman, C.; Calamita, M.A.; Sesma, N. Dynamic Documentation of the Smile and the 2d/3d Digital Smile Design Process. Int. J. Periodontics Restor. Dent. 2017, 37, 183–193. [Google Scholar] [CrossRef]
- Jreige, C.S.; Kimura, R.N.; Segundo, Â.R.T.C.; Coachman, C.; Sesma, N. Esthetic Treatment Planning with Digital Animation of the Smile Dynamics: A Technique to Create a 4-Dimensional Virtual Patient. J. Prosthet. Dent. 2022, 128, 130–138. [Google Scholar] [CrossRef]
- Gallardo, Y.N.R.; Salazar-Gamarra, R.; Bohner, L.; De Oliveira, J.I.; Dib, L.L.; Sesma, N. Evaluation of the 3D Error of 2 Face-Scanning Systems: An in Vitro Analysis. J. Prosthet. Dent. 2021, 129, 630–636. [Google Scholar] [CrossRef]
- Pellitteri, F.; Brucculeri, L.; Spedicato, G.A.; Siciliani, G.; Lombardo, L. Comparison of the Accuracy of Digital Face Scans Obtained by Two Different Scanners. Angle Orthod. 2021, 91, 641–649. [Google Scholar] [CrossRef]
- Ye, H.; Lv, L.; Liu, Y.; Liu, Y.; Zhou, Y. Evaluation of the Accuracy, Reliability, and Reproducibility of Two Different 3D Face-Scanning Systems. Int. J. Prosthodont. 2016, 29, 213–218. [Google Scholar] [CrossRef]
- Kim, S.-H.; Jung, W.-Y.; Seo, Y.-J.; Kim, K.-A.; Park, K.-H.; Park, Y.-G. Accuracy and Precision of Integumental Linear Dimensions in a Three-Dimensional Facial Imaging System. Korean J. Orthod. 2015, 45, 105–112. [Google Scholar] [CrossRef]
- Liu, J.; Zhang, C.; Cai, R.; Yao, Y.; Zhao, Z.; Liao, W. Accuracy of 3-Dimensional Stereophotogrammetry: Comparison of the 3dMD and Bellus3D Facial Scanning Systems with One Another and with Direct Anthropometry. Am. J. Orthod. Dentofac. Orthop. 2021, 160, 862–871. [Google Scholar] [CrossRef]
- Karatas, O.H.; Toy, E. Three-Dimensional Imaging Techniques: A Literature Review. Eur. J. Dent. 2014, 8, 132–140. [Google Scholar] [CrossRef]
- ISO 5725-1. Accuracy (Trueness and Precision) of Measurement Methods and Results e Part 1: General Principles and Definitions. Available online: https://www.iso.org/obp/ui/#iso:std:iso:5725:-1:ed-1:v1:en (accessed on 5 April 2020).
- EN 12464-1. Light and Lighting—Lighting of Work Places—Part 1: Indoor Work Places. Available online: https://www.en-standard.eu/csn-en-12464-1-light-and-lighting-lighting-of-work-places-part-1-indoor-work-places/ (accessed on 27 April 2020).
- Liu, S.; Srinivasan, M.; Mörzinger, R.; Lancelle, M.; Beeler, T.; Gross, M.; Solenthaler, B.; Fehmer, V.; Sailer, I. Reliability of a Three-Dimensional Facial Camera for Dental and Medical Applications: A Pilot Study. J. Prosthet. Dent. 2019, 122, 282–287. [Google Scholar] [CrossRef]
- Ma, L.; Xu, T.; Lin, J. Validation of a Three-Dimensional Facial Scanning System Based on Structured Light Techniques. Comput. Methods Programs Biomed. 2009, 94, 290–298. [Google Scholar] [CrossRef]
- Knoops, P.G.M.; Beaumont, C.A.A.; Borghi, A.; Rodriguez-Florez, N.; Breakey, R.W.F.; Rodgers, W.; Angullia, F.; Jeelani, N.U.O.; Schievano, S.; Dunaway, D.J. Comparison of Three-Dimensional Scanner Systems for Craniomaxillofacial Imaging. J. Plast. Reconstr. Aesthet. Surg. 2017, 70, 441–449. [Google Scholar] [CrossRef]
- Aung, S.C.; Ngim, R.C.K.; Lee, S.T. Evaluation of the Laser Scanner as a Surface Measuring Tool and Its Accuracy Compared with Direct Facial Anthropometric Measurements. Br. J. Plast. Surg. 1995, 48, 551–558. [Google Scholar] [CrossRef]
- Weinberg, S.M.; Naidoo, S.; Govier, D.P.; Martin, R.A.; Kane, A.A.; Marazita, M.L. Anthropometric Precision and Accuracy of Digital Three-Dimensional Photogrammetry: Comparing the Genex and 3dMD Imaging Systems with One Another and with Direct Anthropometry. J. Craniofac. Surg. 2006, 17, 477–483. [Google Scholar] [CrossRef]
- Lincoln, K.P.; Sun, A.Y.T.; Prihoda, T.J.; Sutton, A.J. Comparative Accuracy of Facial Models Fabricated Using Traditional and 3D Imaging Techniques: Comparative Accuracy of Facial Models. J. Prosthodont. 2016, 25, 207–215. [Google Scholar] [CrossRef]
- Amornvit, P.; Sanohkan, S. The Accuracy of Digital Face Scans Obtained from 3D Scanners: An In Vitro Study. Int. J. Environ. Res. Public Health 2019, 16, 5061. [Google Scholar] [CrossRef]
- Lübbers, H.-T.; Medinger, L.; Kruse, A.; Grätz, K.W.; Matthews, F. Precision and Accuracy of the 3dMD Photogrammetric System in Craniomaxillofacial Application. J. Craniofac. Surg. 2010, 21, 763–767. [Google Scholar] [CrossRef] [PubMed]
- Akan, B.; Akan, E.; Şahan, A.O.; Kalak, M. Evaluation of 3D Face-Scan Images Obtained by Stereophotogrammetry and Smartphone Camera. Int. Orthod. 2021, 19, 669–678. [Google Scholar] [CrossRef] [PubMed]
- Gibelli, D.; Dolci, C.; Cappella, A.; Sforza, C. Reliability of Optical Devices for Three-Dimensional Facial Anatomy Description: A Systematic Review and Meta-Analysis. Int. J. Oral Maxillofac. Surg. 2020, 49, 1092–1106. [Google Scholar] [CrossRef] [PubMed]
- Aynechi, N.; Larson, B.E.; Leon-Salazar, V.; Beiraghi, S. Accuracy and Precision of a 3D Anthropometric Facial Analysis with and without Landmark Labeling before Image Acquisition. Angle Orthod. 2011, 81, 245–252. [Google Scholar] [CrossRef] [PubMed]
- Weinberg, S.M.; Scott, N.M.; Neiswanger, K.; Brandon, C.A.; Marazita, M.L. Digital Three-Dimensional Photogrammetry: Evaluation of Anthropometric Precision and Accuracy Using a Genex 3D Camera System. Cleft Palate Craniofac. J. 2004, 41, 507–518. [Google Scholar] [CrossRef]
- Xu, Y.; Frank, K.; Kohler, L.; Ehrl, D.; Alfertshofer, M.; Giunta, R.E.; Moellhoff, N.; Cotofana, S.; Koban, K.C. Reliability of 3-Dimensional Surface Imaging of the Face Using a Whole-Body Surface Scanner. J. Cosmet. Dermatol. 2022, 21, 1464–1470. [Google Scholar] [CrossRef]
- Bartella, A.K.; Laser, J.; Kamal, M.; Krause, M.; Neuhaus, M.; Pausch, N.C.; Sander, A.K.; Lethaus, B.; Zimmerer, R. Accuracy of Low-Cost Alternative Facial Scanners: A Prospective Cohort Study. Oral Maxillofac. Surg. 2022, 27, 33–41. [Google Scholar] [CrossRef]

| Coding | Landmarks | Description |
|---|---|---|
| Sn–Gb | Subnasale–Glabella | Vertical linear measurement from glabella to subnasale |
| Sn–Me | Subnasale–Menton | Vertical linear measurement from subnasale to menton |
| EnR–EnL | Endocanthion right– Endocanthion left | Transverse linear measurement from endocanthion right and left |
| ExR–ExL | Exocanthion right– Exocanthion left | Transverse linear measurement from exocanthion right and left |
| CR–CL | Chelion right– Chelion left | Transverse linear measurement of mouth width |
| Manual Group | 2D Group | 3D Group | |||||||
|---|---|---|---|---|---|---|---|---|---|
| Interlandmark-Measurement | Mean | Min–Max | SD | Mean | Min–Max | SD | Mean | Min–Max | SD |
| Sn–Gb | 72.09 | 63.22–90.77 | 5.45 | 75.40 | 65.54–91.36 | 5.72 | 72.65 | 66.01–89.30 | 5.21 |
| Sn–Me | 43.04 | 33.59–50.71 | 3.54 | 44.57 | 34.84–56.11 | 4.13 | 44.29 | 36.94–50.70 | 3.15 |
| EnR–EnL | 24.53 | 20.40–31.42 | 2.28 | 25.22 | 19.87–34.61 | 3.19 | 24.17 | 20.70–31.32 | 2.28 |
| ExR–ExL | 106.30 | 93.22–120.23 | 5.66 | 108.74 | 92.17–132.01 | 8.54 | 105.77 | 92.47–118.95 | 5.52 |
| CR–CL | 60.29 | 45.47–71.52 | 4.84 | 62.77 | 49.25–78.07 | 6.02 | 59.97 | 49.86–71.34 | 4.59 |
| Manual Group | 2D Group | 3D Group | |||||||
|---|---|---|---|---|---|---|---|---|---|
| Interlandmark-Measurement | Mean | Min–Max | SD | Mean | Min–Max | SD | Mean | Min–Max | SD |
| Sn–Gb | 68.59 | 61.61–83.31 | 4.77 | 70.57 | 61.53–86.06 | 5.50 | 68.62 | 61.79–83.00 | 4.88 |
| Sn–Me | 50.04 | 36.44–60.62 | 4.83 | 52.66 | 42.58–63.39 | 5.21 | 51.02 | 41.73–61.57 | 4.36 |
| EnR–EnL | 24.44 | 20.28–30.81 | 2.45 | 25.30 | 20.70–34.43 | 3.10 | 24.15 | 20.94–31.14 | 2.21 |
| ExR–ExL | 106.62 | 93.75–120.22 | 5.79 | 109.20 | 95.06–130.58 | 8.44 | 106.72 | 95.20–119.85 | 5.95 |
| CR–CL | 71.58 | 56.42–88.62 | 5.93 | 76.01 | 63.04–91.51 | 6.58 | 71.59 | 58.81–84.94 | 5.34 |
| MIP | SP | |||||||||||
|---|---|---|---|---|---|---|---|---|---|---|---|---|
| 2D Group | 3D Group | 2D Group | 3D Group | |||||||||
| Interlandmark-Measurement | MSE (SD) | t-test | p | MSE (SD) | t-test | p | MSE (SD) | t-test | p | MSE (SD) | t-test | p |
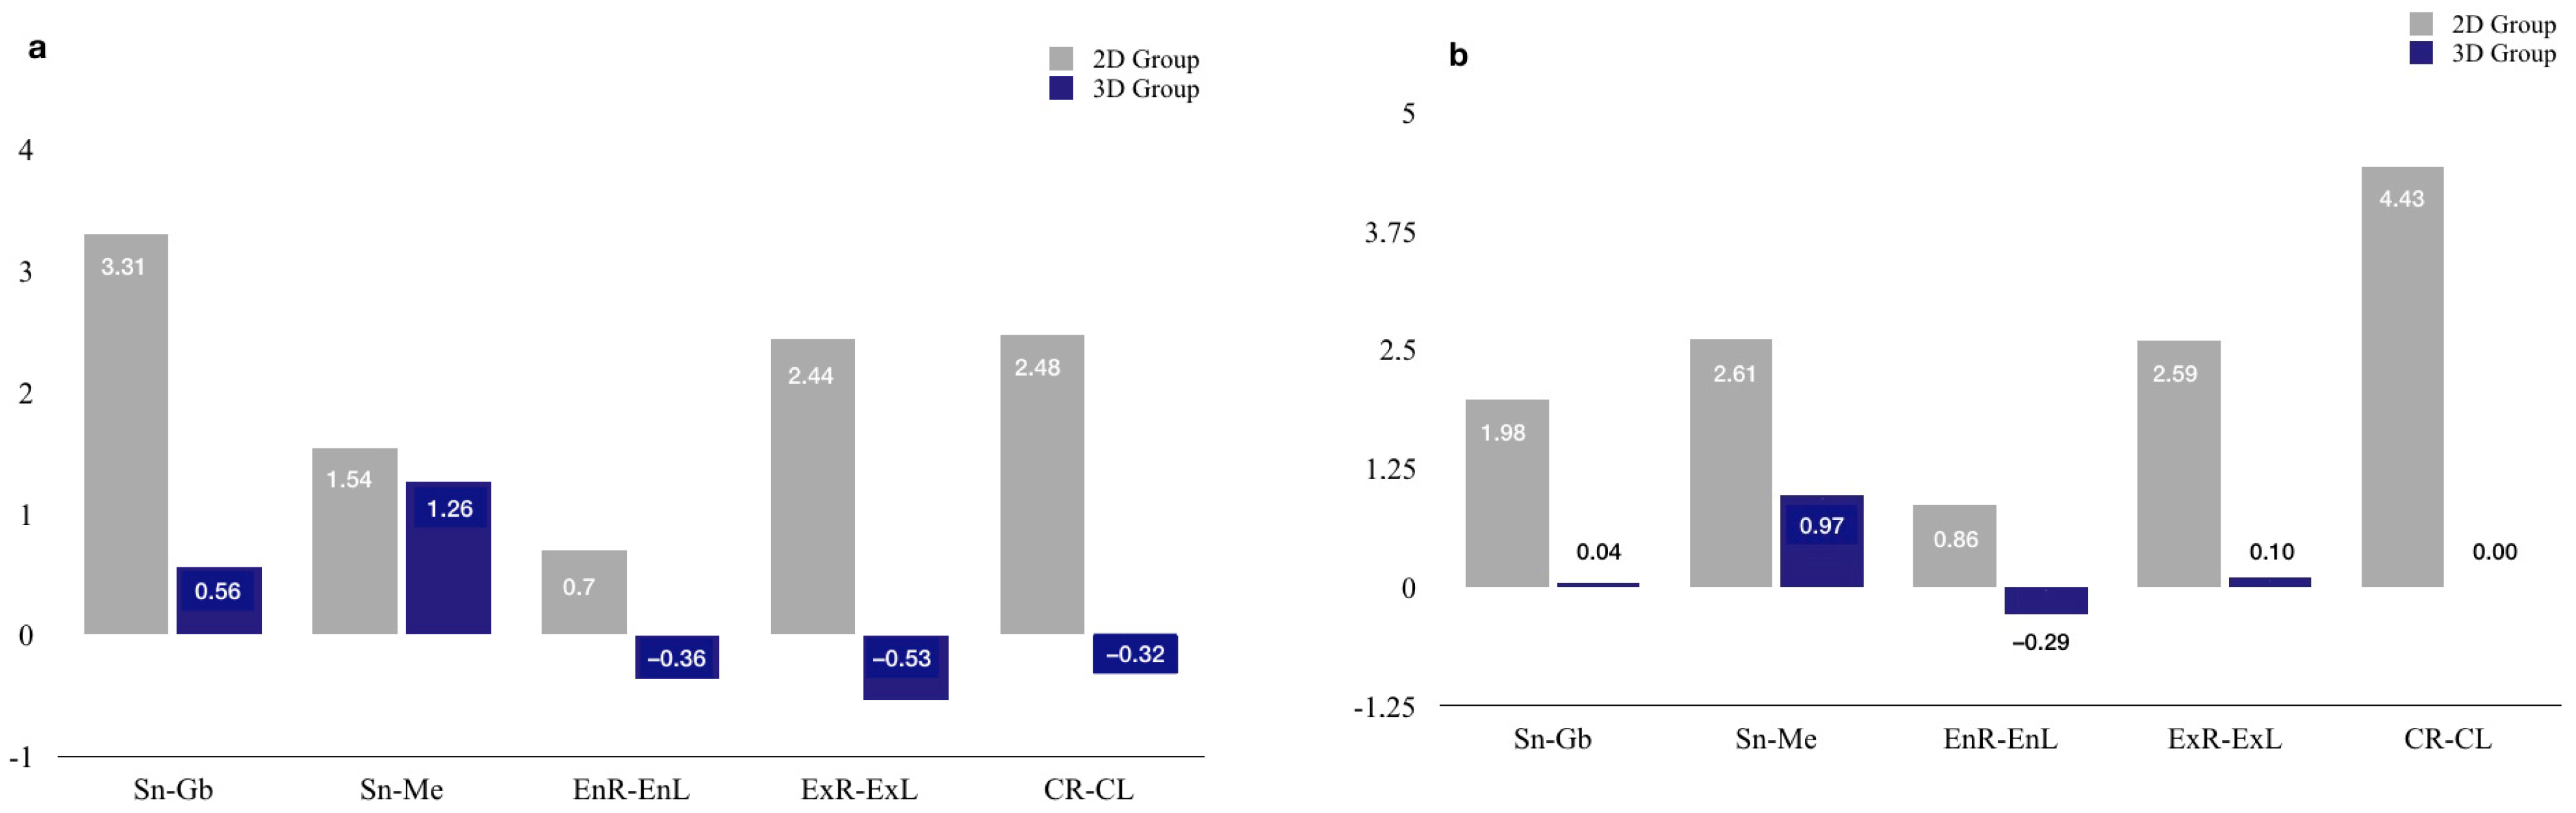
| Sn–Gb | 3.31 (3.99) | 6.43 ** | 0.000 | 0.56 (1.65) | 2.60 * | 0.012 | 1.98 (3.93) | 3.99 ** | 0.000 | 0.04 (1.42) | 0.20 NS | 0.845 |
| Sn–Me | 1.54 (3.14) | 3.79 ** | 0.000 | 1.26 (1.74) | 5.58 ** | 0.000 | 2.61 (3.72) | 5.44 ** | 0.000 | 0.97 (2.84) | 2.65 * | 0.010 |
| EnR–EnL | 0.70 (1.55) | 3.47 ** | 0.001 | −0.36 (0.90) | −3.07 ** | 0.003 | 0.86 (1.36) | 4.91 ** | 0.000 | −0.29 (0.99) | 2.24 * | 0.029 |
| ExR–ExL | 2.44 (4.74) | 3.98 ** | 0.000 | −0.53 (2.24) | −1.83 NS | 0.072 | 2.59 (4.36) | 4.60 ** | 0.000 | 0.10 (2.27) | 0.36 NS | 0.724 |
| CR–CL | 2.48 (3.49) | 5.50 ** | 0.000 | −0.32 (1.71) | −1.46 NS | 0.151 | 4.43 (4.96) | 6.92 ** | 0.000 | 0.00 (2.65) | 0.01 NS | 0.993 |
| MIP | SP | |||||||||
|---|---|---|---|---|---|---|---|---|---|---|
| MSE | t-Test | Effect Size R2 | MSE | t-Test | Effect Size R2 | |||||
| Interlandmark-Measurement | 2D-Group | 3D-Group | t-test | p | 2D Group | 3D Group | t-test | p | ||
| Sn–Gb | 3.31 | 0.56 | 4.94 ** | 0.000 | 0.171 | 1.98 | 0.04 | 3.60 ** | 0.001 | 0.099 |
| Sn–Me | 1.54 | 1.26 | 0.61 NS | 0.544 | 0.003 | 2.61 | 0.97 | 2.71 ** | 0.008 | 0.059 |
| EnR–EnL | 0.70 | −0.36 | 4.54 ** | 0.000 | 0.149 | 0.86 | −0.29 | 5.29 ** | 0.000 | 0.192 |
| ExR–ExL | 2.44 | −0.53 | 4.38 ** | 0.000 | 0.140 | 2.59 | 0.10 | 3.92 ** | 0.000 | 0.115 |
| CR–CL | 2.48 | −0.32 | 5.58 ** | 0.000 | 0.209 | 4.43 | 0.00 | 6.10 ** | 0.000 | 0.240 |
Disclaimer/Publisher’s Note: The statements, opinions and data contained in all publications are solely those of the individual author(s) and contributor(s) and not of MDPI and/or the editor(s). MDPI and/or the editor(s) disclaim responsibility for any injury to people or property resulting from any ideas, methods, instructions or products referred to in the content. |
© 2023 by the authors. Licensee MDPI, Basel, Switzerland. This article is an open access article distributed under the terms and conditions of the Creative Commons Attribution (CC BY) license (https://creativecommons.org/licenses/by/4.0/).
Share and Cite
Cascos, R.; Ortiz del Amo, L.; Álvarez-Guzmán, F.; Antonaya-Martín, J.L.; Celemín-Viñuela, A.; Gómez-Costa, D.; Zafra-Vallejo, M.; Agustín-Panadero, R.; Gómez-Polo, M. Accuracy between 2D Photography and Dual-Structured Light 3D Facial Scanner for Facial Anthropometry: A Clinical Study. J. Clin. Med. 2023, 12, 3090. https://doi.org/10.3390/jcm12093090
Cascos R, Ortiz del Amo L, Álvarez-Guzmán F, Antonaya-Martín JL, Celemín-Viñuela A, Gómez-Costa D, Zafra-Vallejo M, Agustín-Panadero R, Gómez-Polo M. Accuracy between 2D Photography and Dual-Structured Light 3D Facial Scanner for Facial Anthropometry: A Clinical Study. Journal of Clinical Medicine. 2023; 12(9):3090. https://doi.org/10.3390/jcm12093090
Chicago/Turabian StyleCascos, Rocío, Laura Ortiz del Amo, Francisco Álvarez-Guzmán, José Luis Antonaya-Martín, Alicia Celemín-Viñuela, Diego Gómez-Costa, Mónica Zafra-Vallejo, Rubén Agustín-Panadero, and Miguel Gómez-Polo. 2023. "Accuracy between 2D Photography and Dual-Structured Light 3D Facial Scanner for Facial Anthropometry: A Clinical Study" Journal of Clinical Medicine 12, no. 9: 3090. https://doi.org/10.3390/jcm12093090