Author Contributions
Conceptualization, J.J., Q.L. and X.W.; software, T.J.; validation, T.J., J.J. and X.W.; formal analysis, T.J.; investigation, Y.W. and T.J.; writing—original draft preparation, T.J.; writing—review and editing, T.J.; supervision, J.J. and Q.L.; project administration, J.J. All authors have read and agreed to the published version of the manuscript.
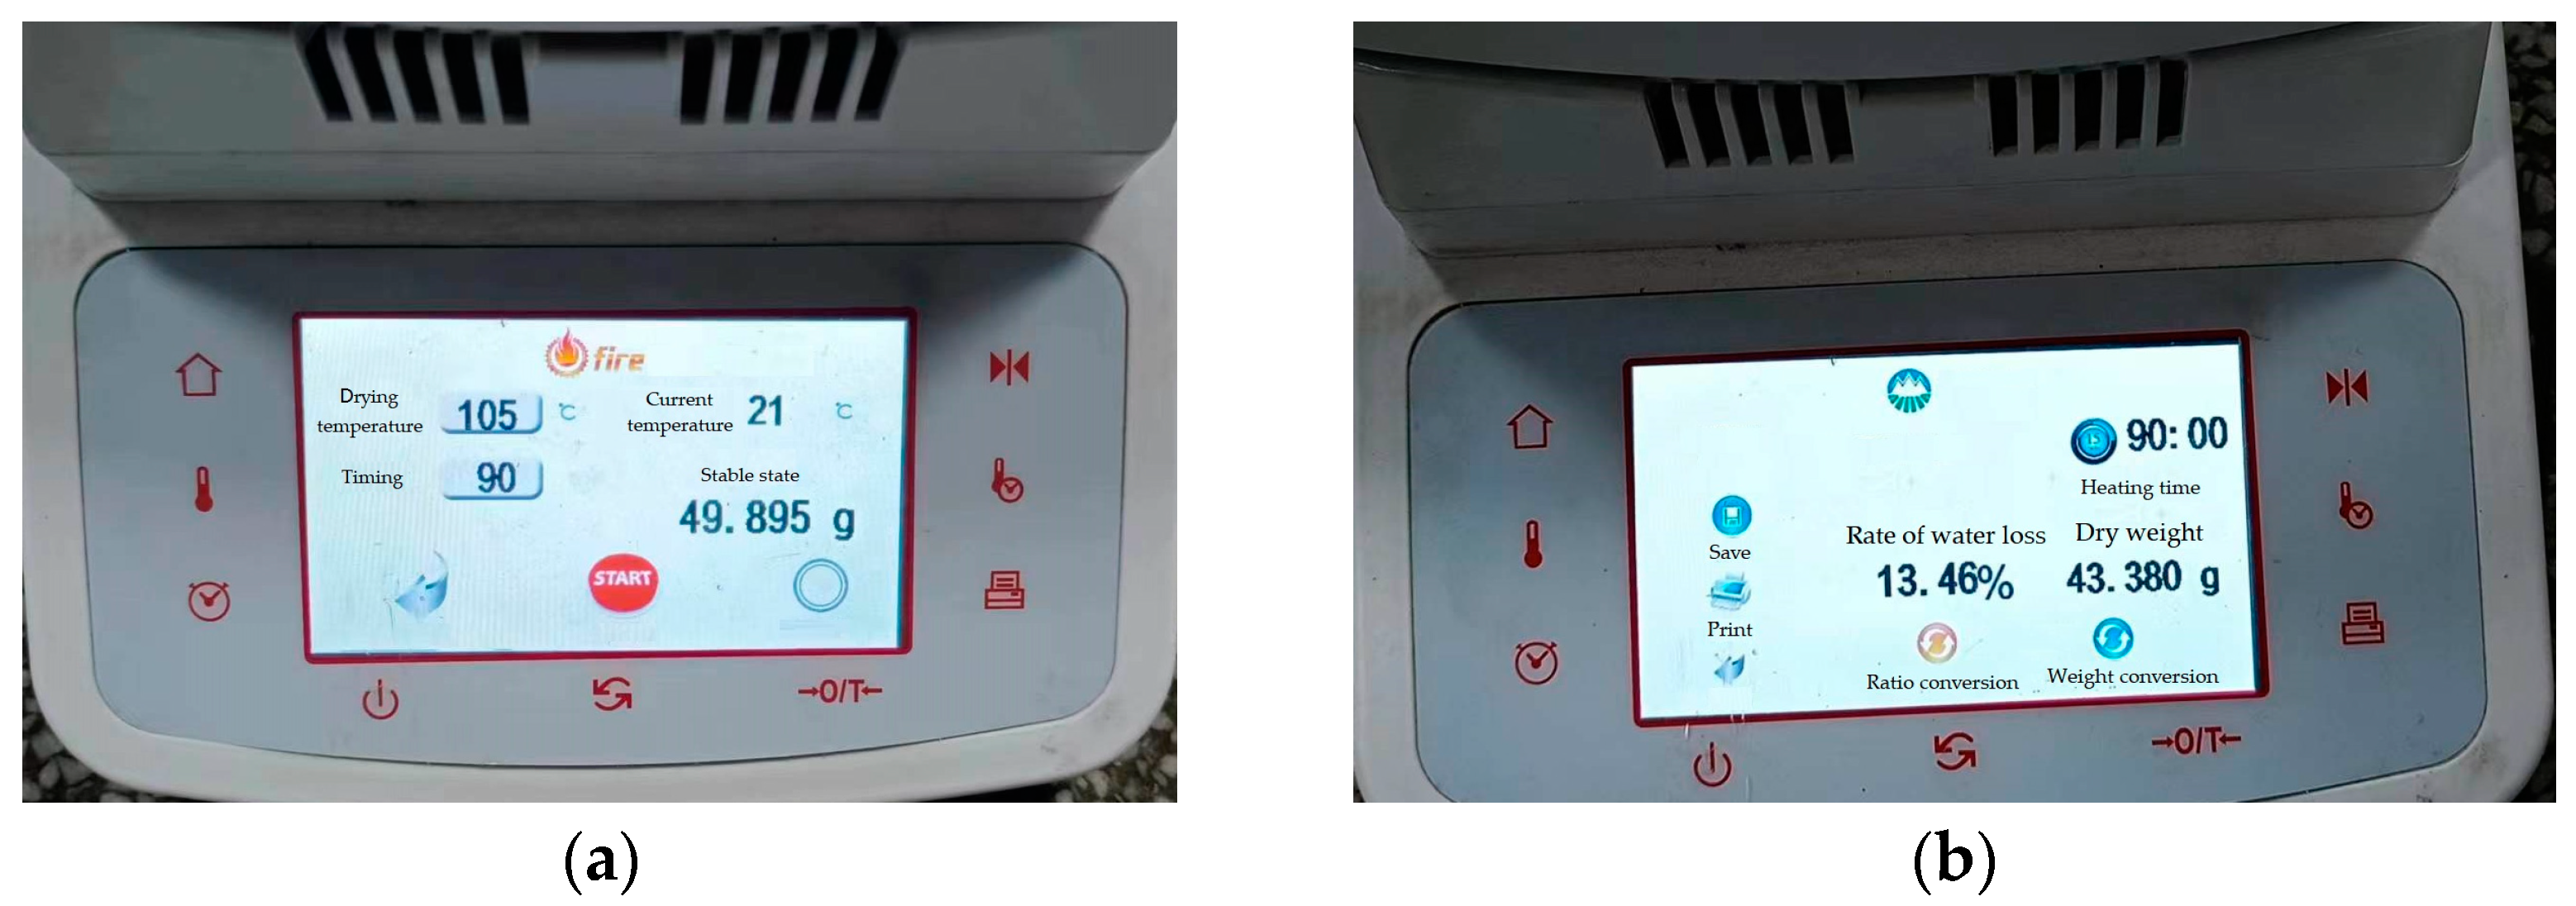
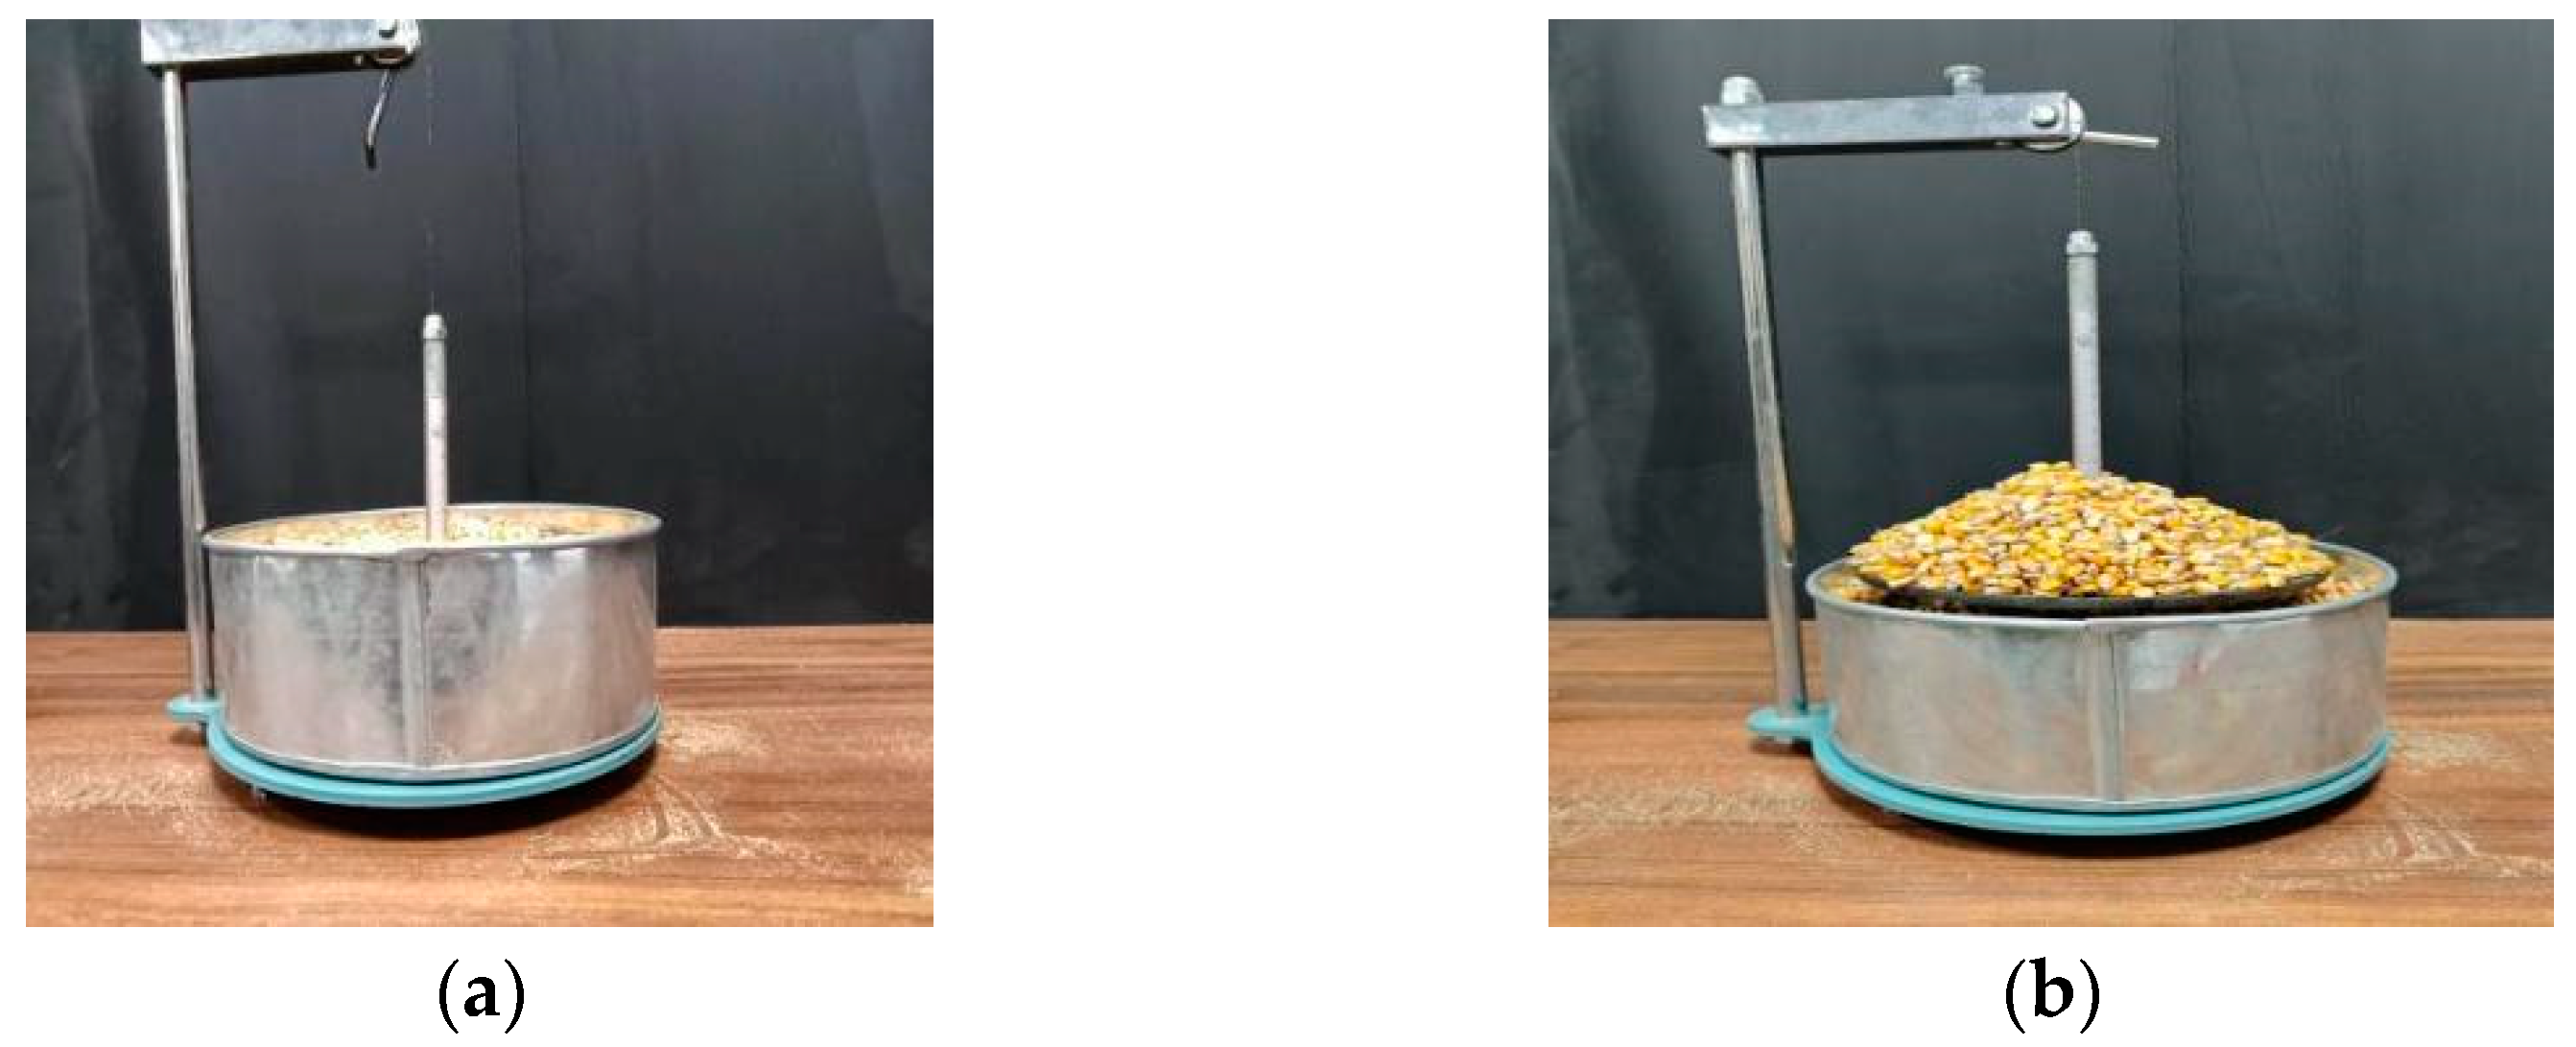
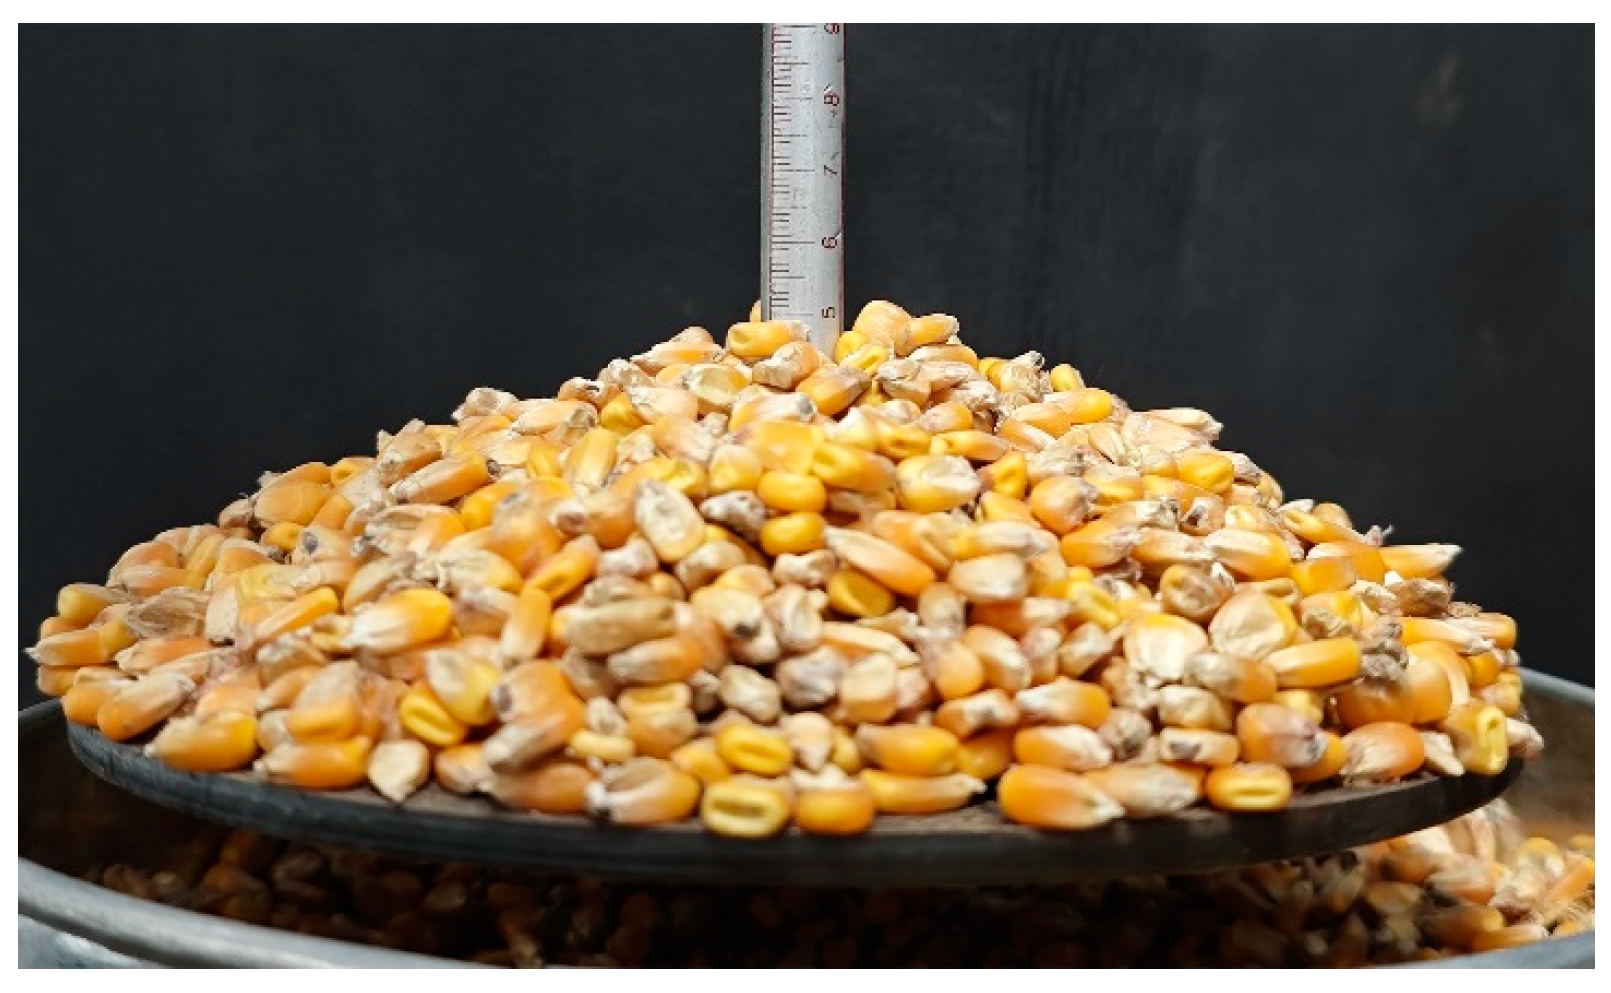
Figure 1.
Determination of moisture content in maize kernels. The setting (a) and the result (b).
Figure 1.
Determination of moisture content in maize kernels. The setting (a) and the result (b).
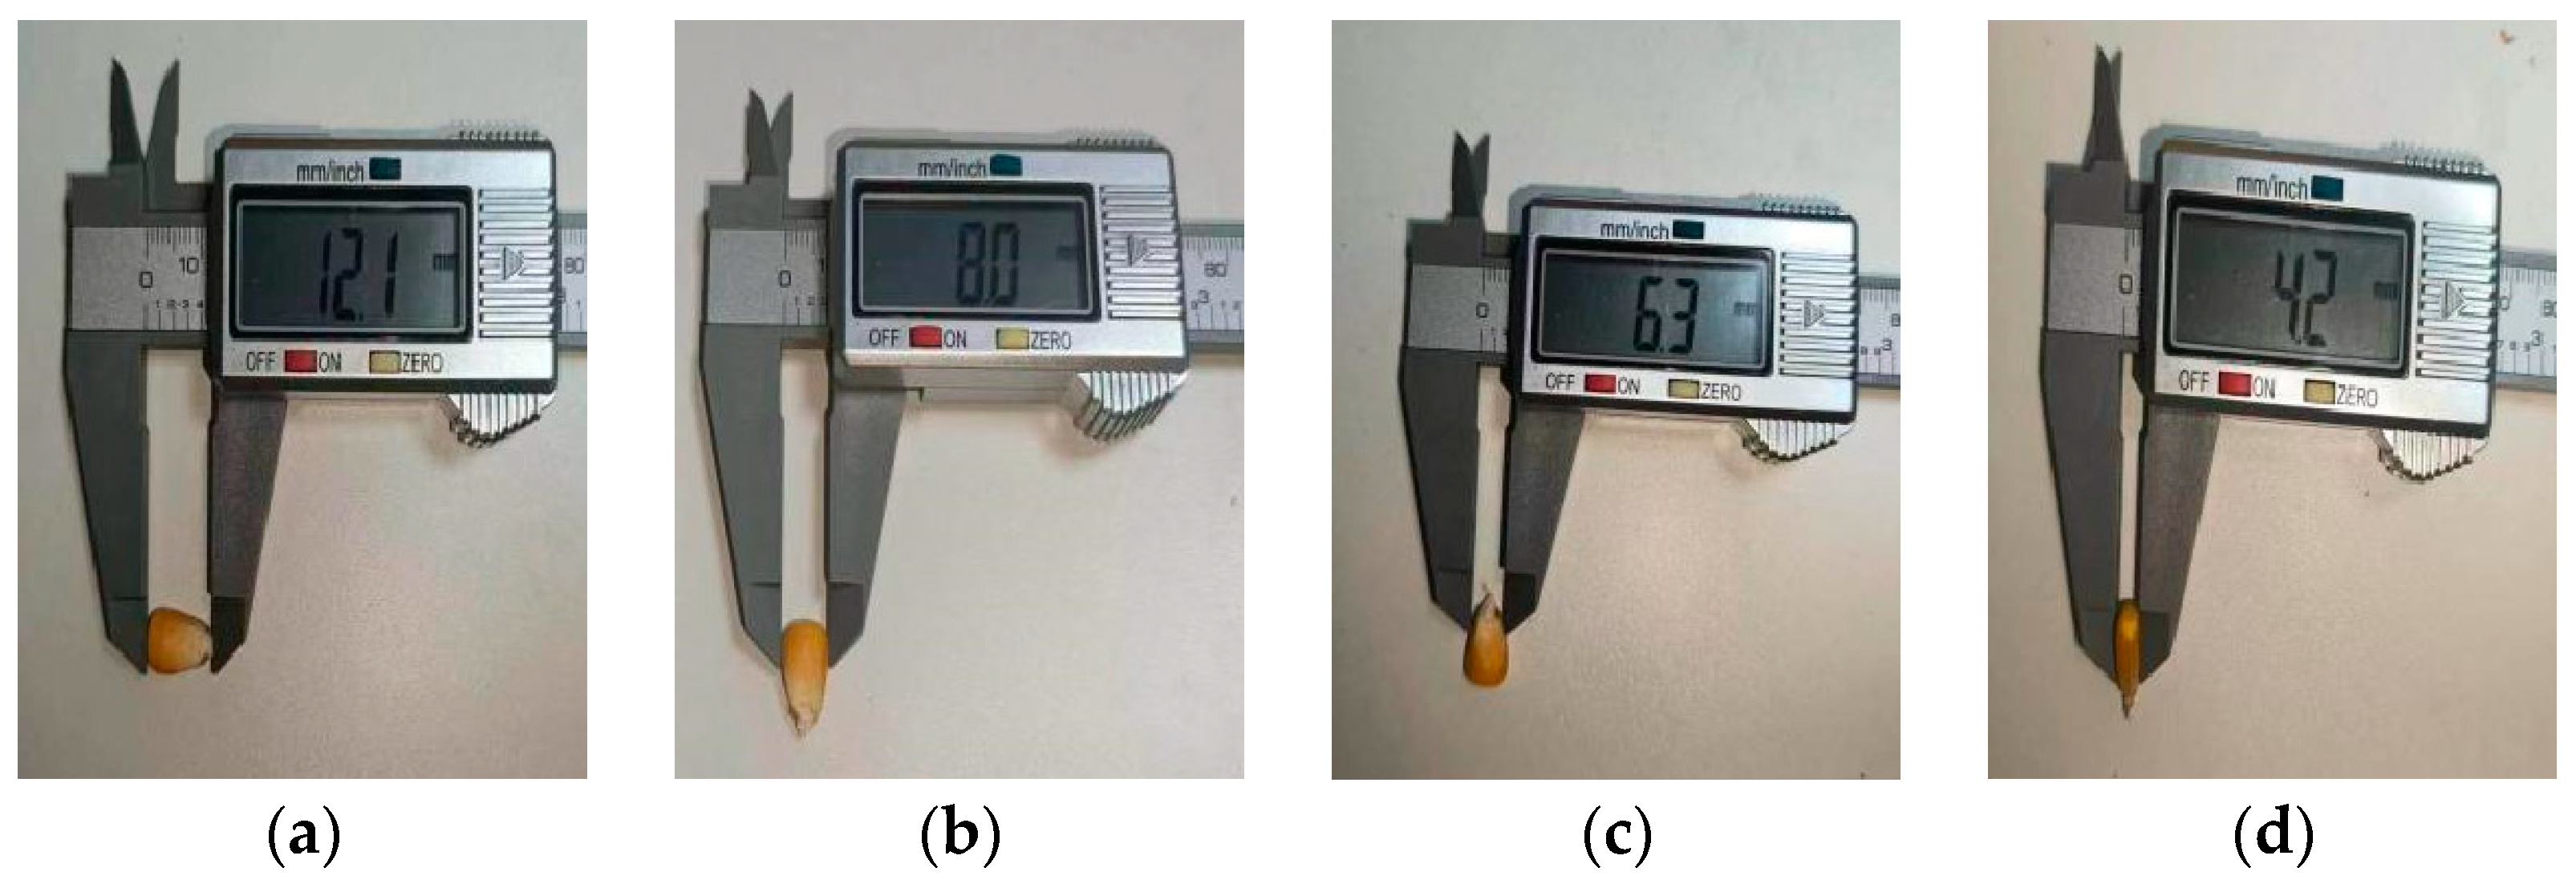
Figure 2.
The measurement process of maize total length (a), upper width (b), lower width (c), and thickness (d).
Figure 2.
The measurement process of maize total length (a), upper width (b), lower width (c), and thickness (d).
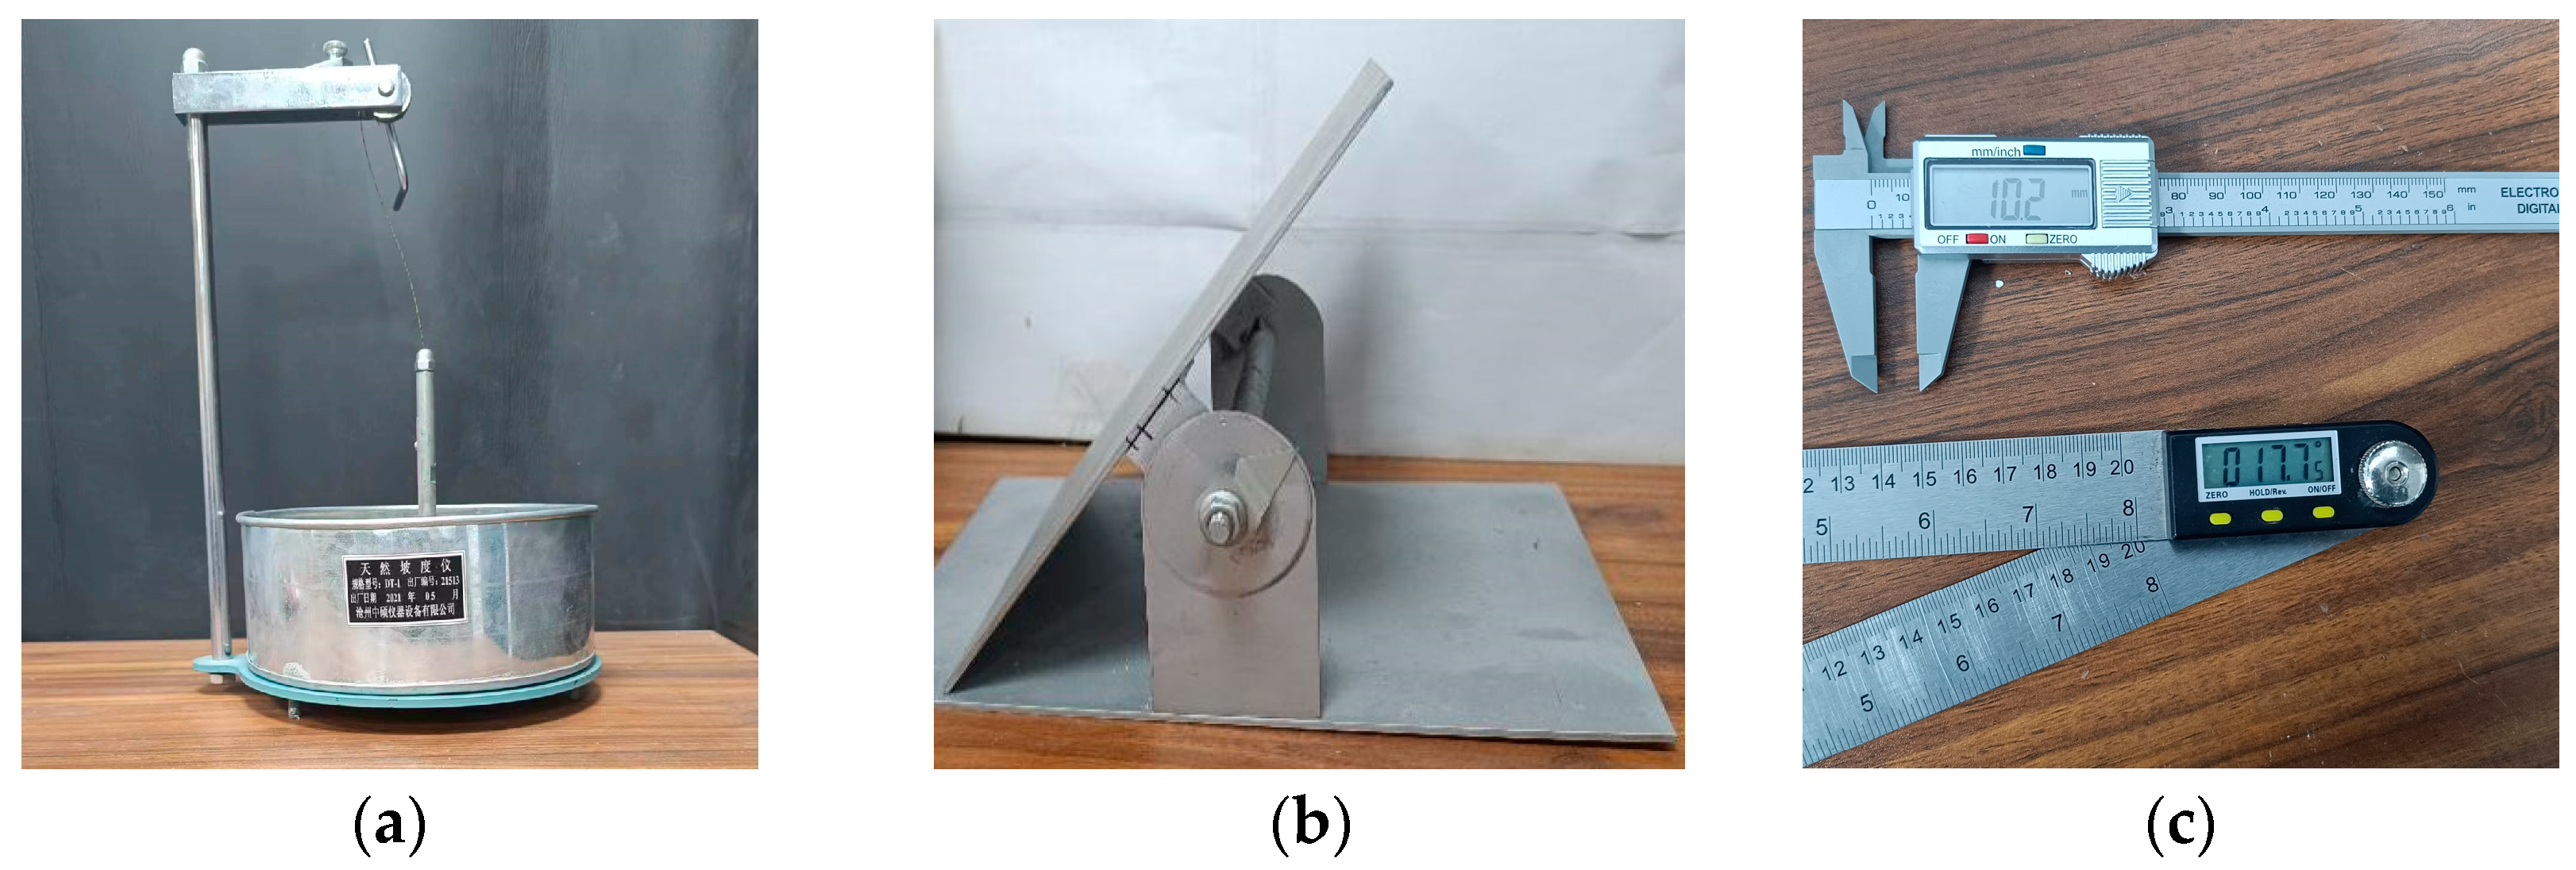
Figure 3.
The test equipment consist of a DT-1 natural slope meter (a), electronic vernier caliper and inclined plate (b), and digital protractor (c) for the slope sliding method and slope rolling method.
Figure 3.
The test equipment consist of a DT-1 natural slope meter (a), electronic vernier caliper and inclined plate (b), and digital protractor (c) for the slope sliding method and slope rolling method.
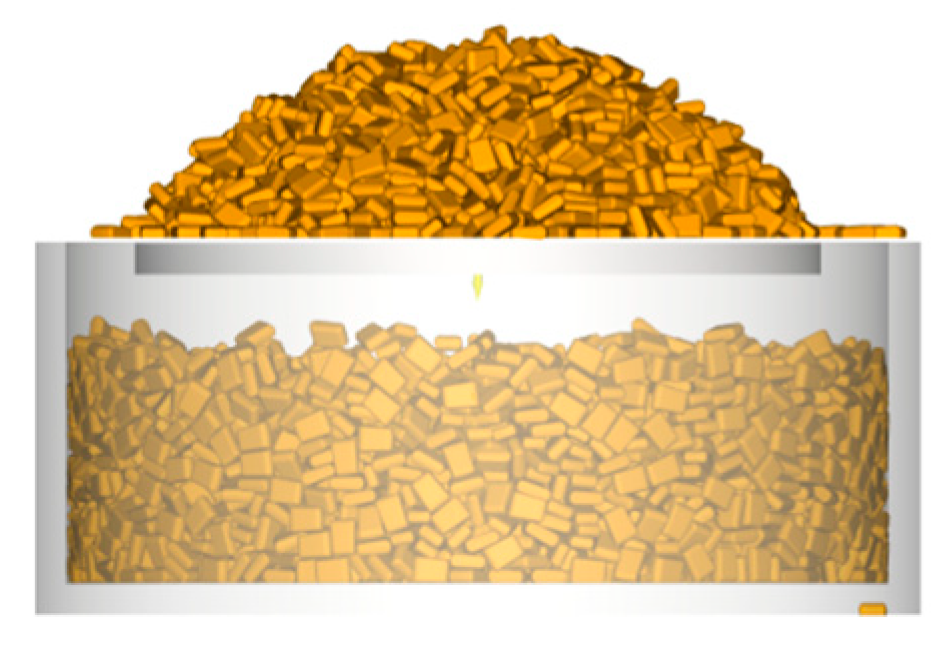
Figure 5.
The test process of the real stacking angle. The initial state (a) and final state (b).
Figure 5.
The test process of the real stacking angle. The initial state (a) and final state (b).
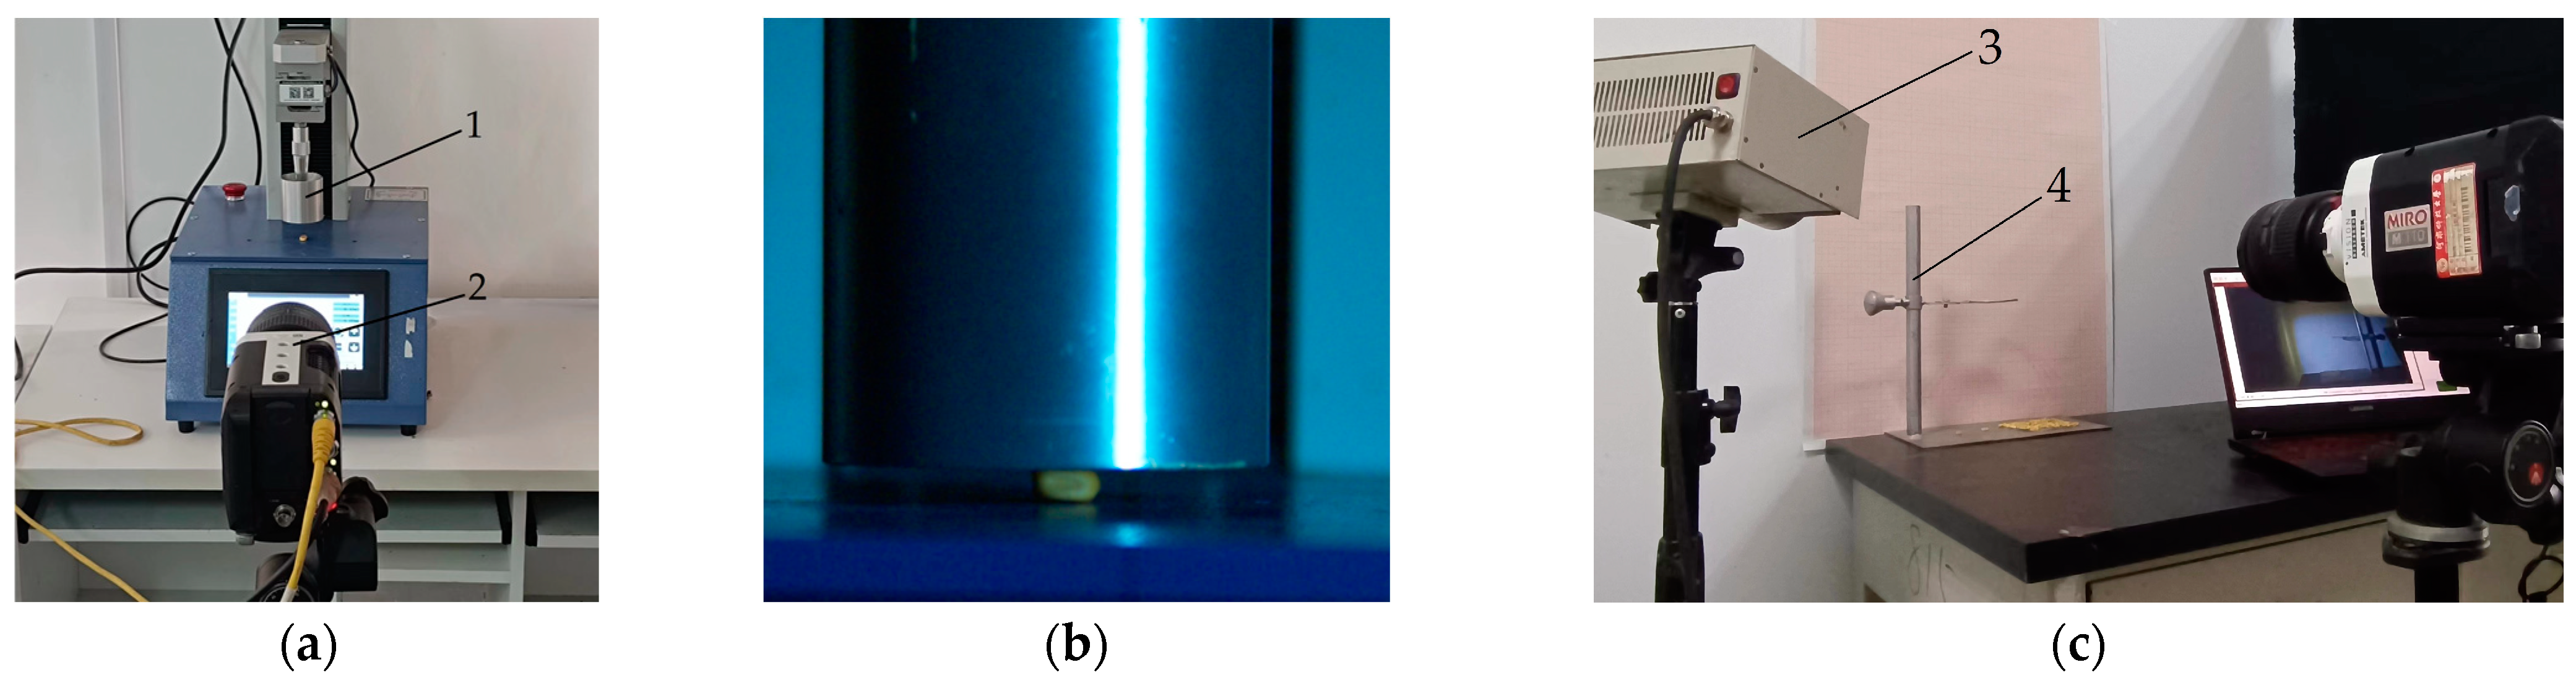
Figure 6.
The measurement process of some parameters. The Poisson’s ratio of the kernel (a), the Young’s modulus of the kernel (b) and the recovery coefficients (c). 1. Texture analyzer; 2. High-speed camera; 3. Fill light; 4. The stand.
Figure 6.
The measurement process of some parameters. The Poisson’s ratio of the kernel (a), the Young’s modulus of the kernel (b) and the recovery coefficients (c). 1. Texture analyzer; 2. High-speed camera; 3. Fill light; 4. The stand.
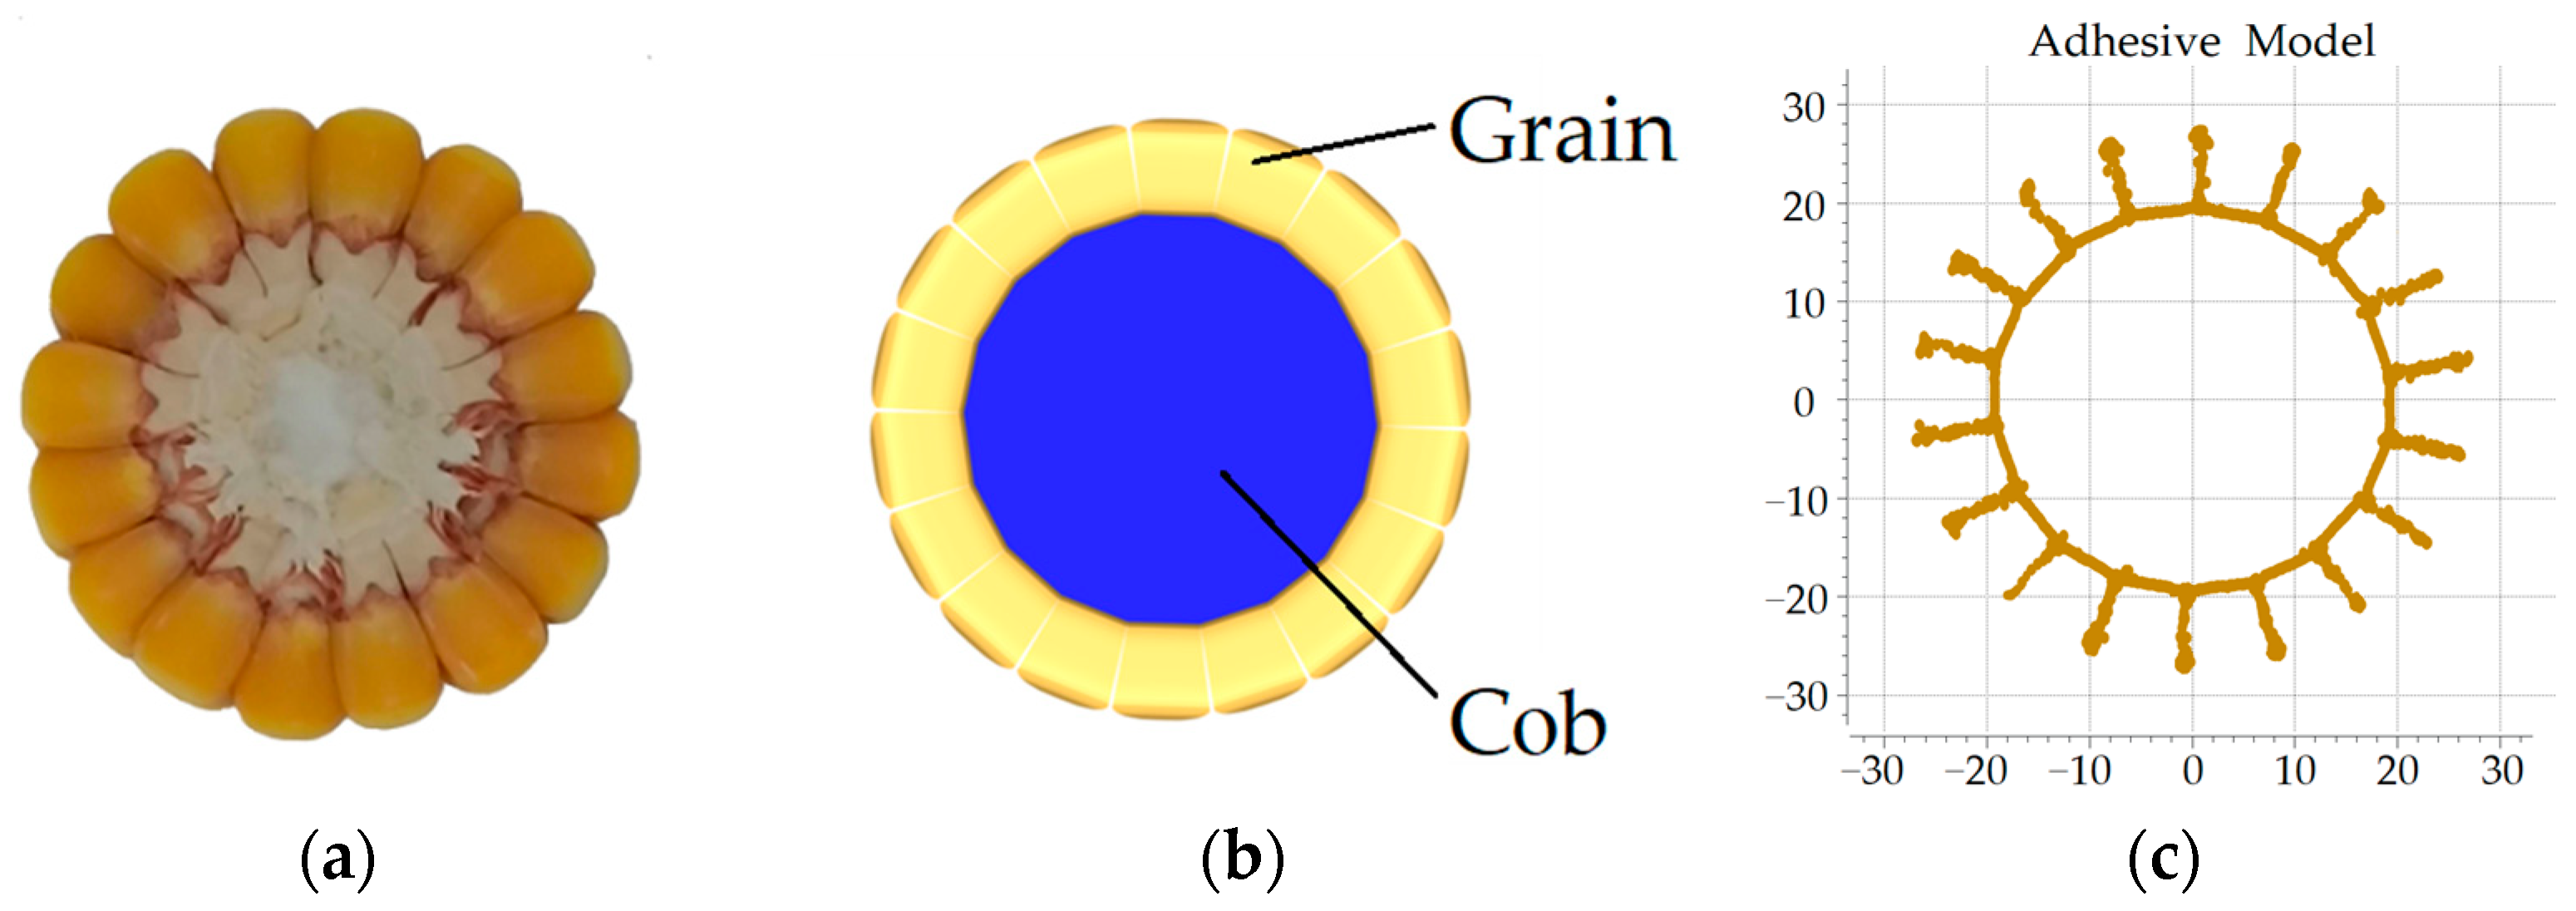
Figure 7.
The actual maize image (a), the combination model of grain and cob (b), and the adhesive force model (c).
Figure 7.
The actual maize image (a), the combination model of grain and cob (b), and the adhesive force model (c).
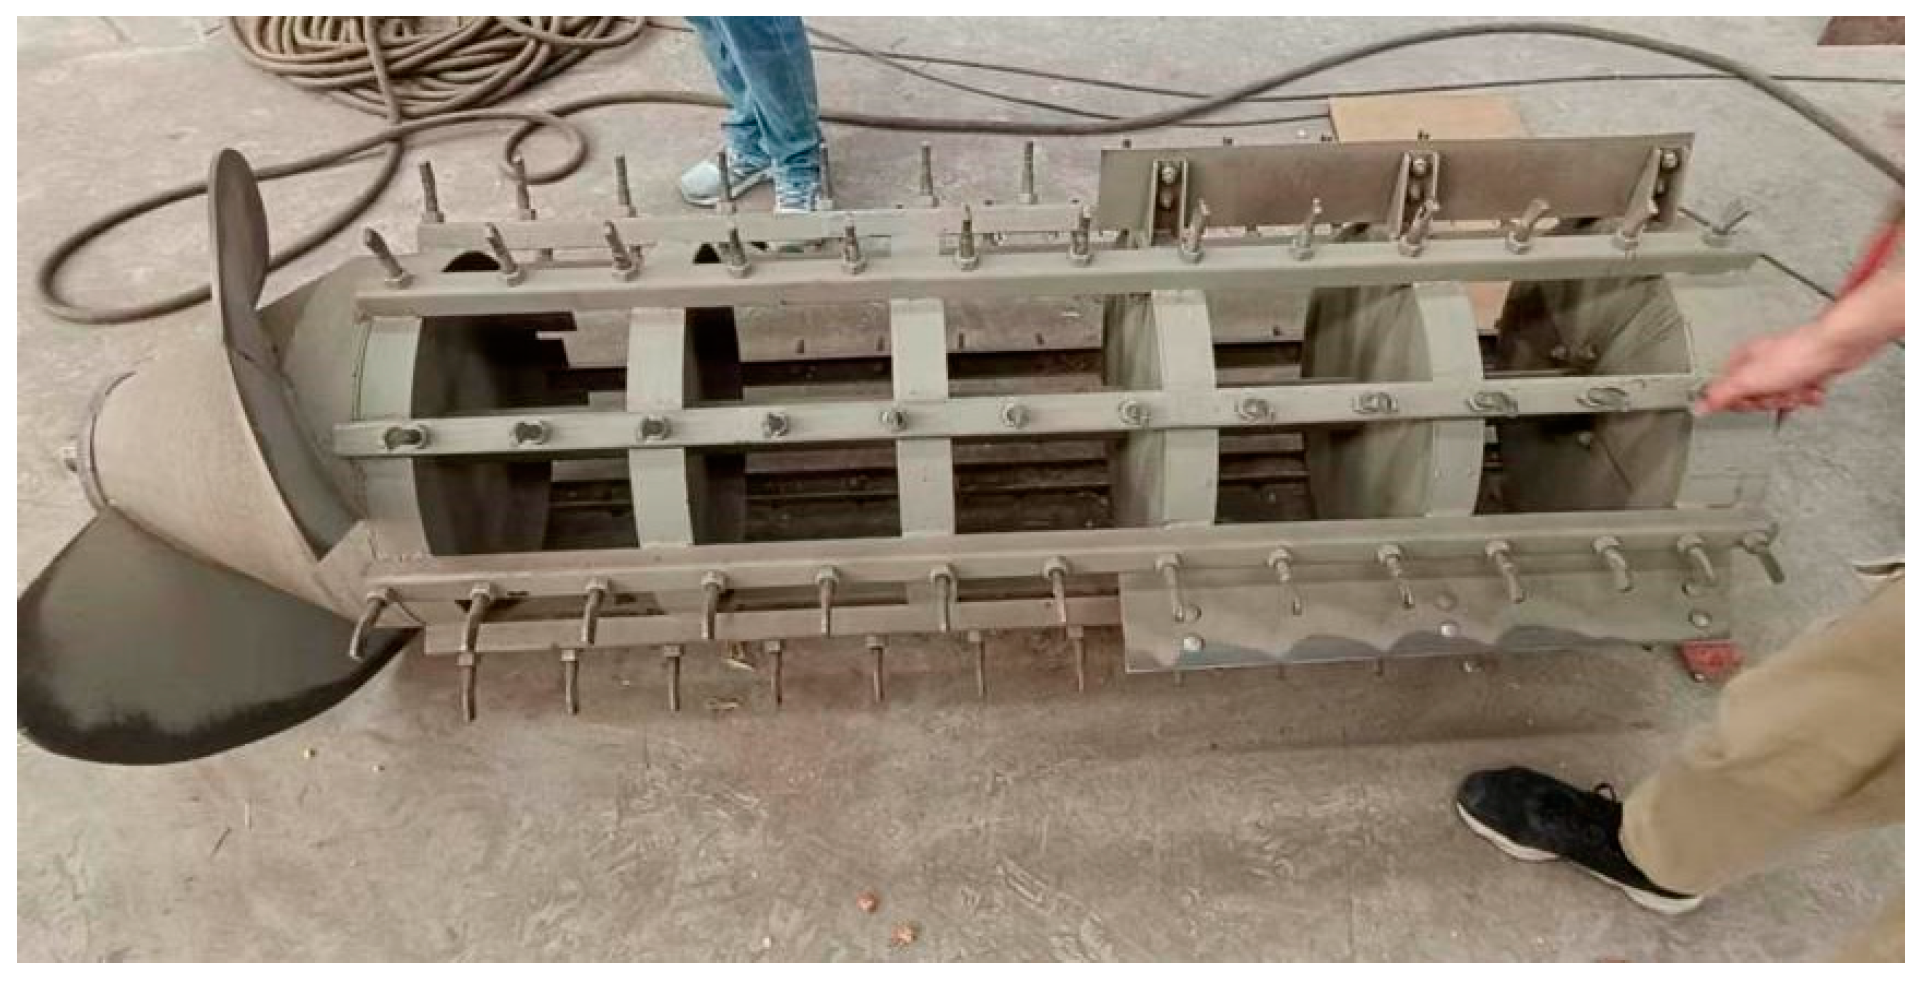
Figure 8.
The actual threshing cylinder.
Figure 8.
The actual threshing cylinder.
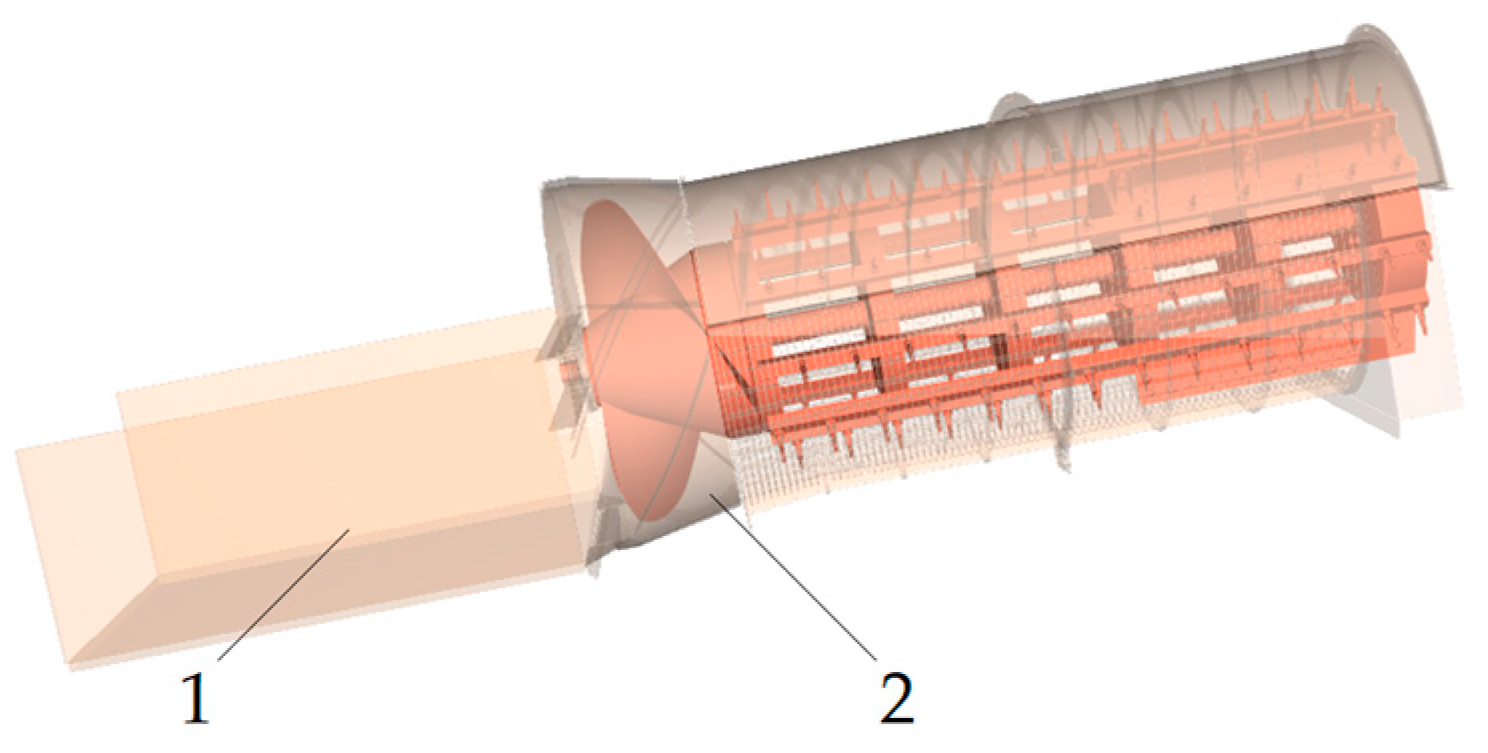
Figure 9.
The single longitudinal axial flow threshing device model. 1. Conveyor belt; 2. Threshing device.
Figure 9.
The single longitudinal axial flow threshing device model. 1. Conveyor belt; 2. Threshing device.
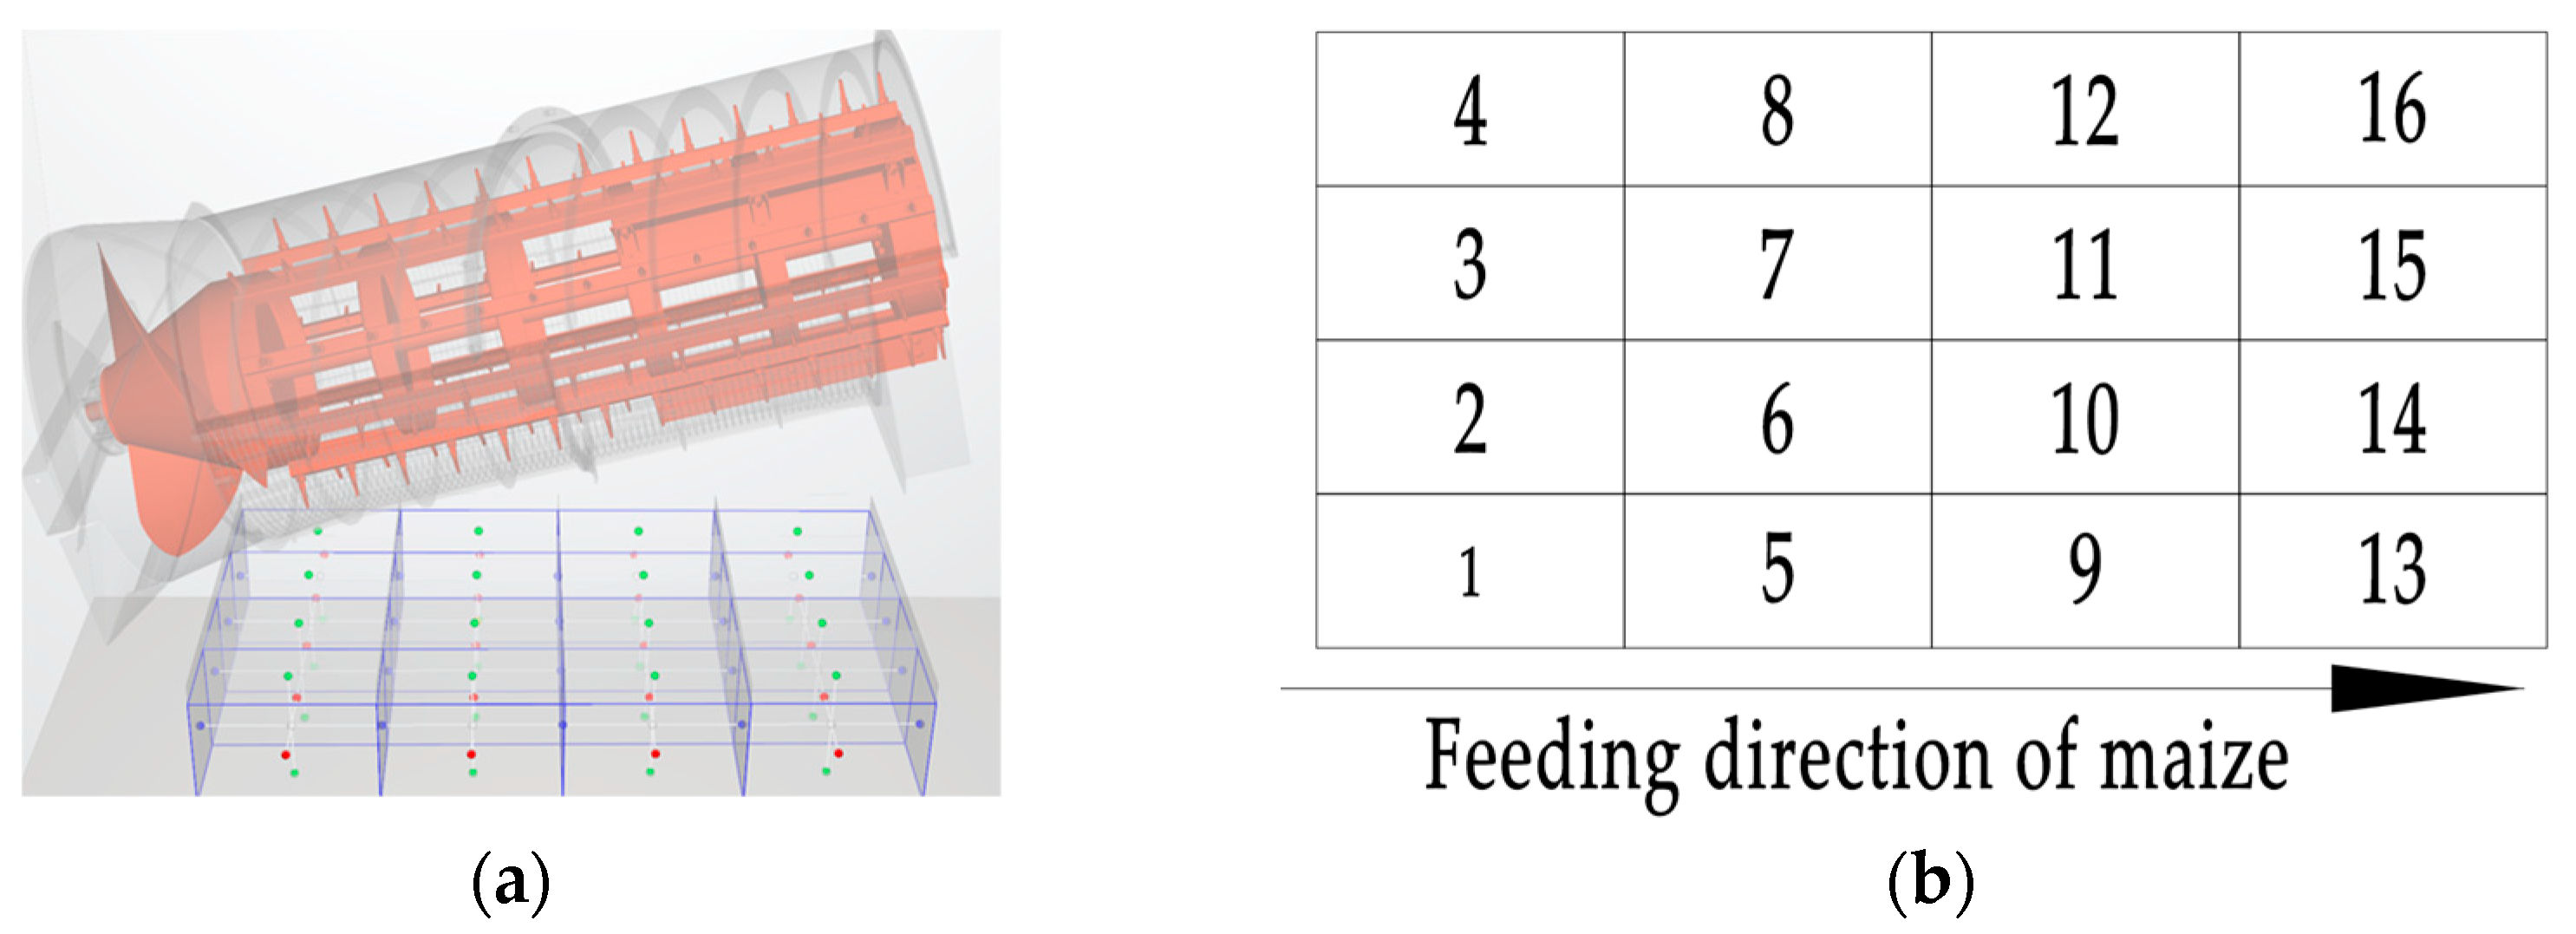
Figure 10.
The 4 × 4 equal-area segmentation granary: (a) overall schematic diagram; (b) the vertical view.
Figure 10.
The 4 × 4 equal-area segmentation granary: (a) overall schematic diagram; (b) the vertical view.
Figure 11.
The result of the actual stacking angle test.
Figure 11.
The result of the actual stacking angle test.
Figure 12.
The result of the first test.
Figure 12.
The result of the first test.
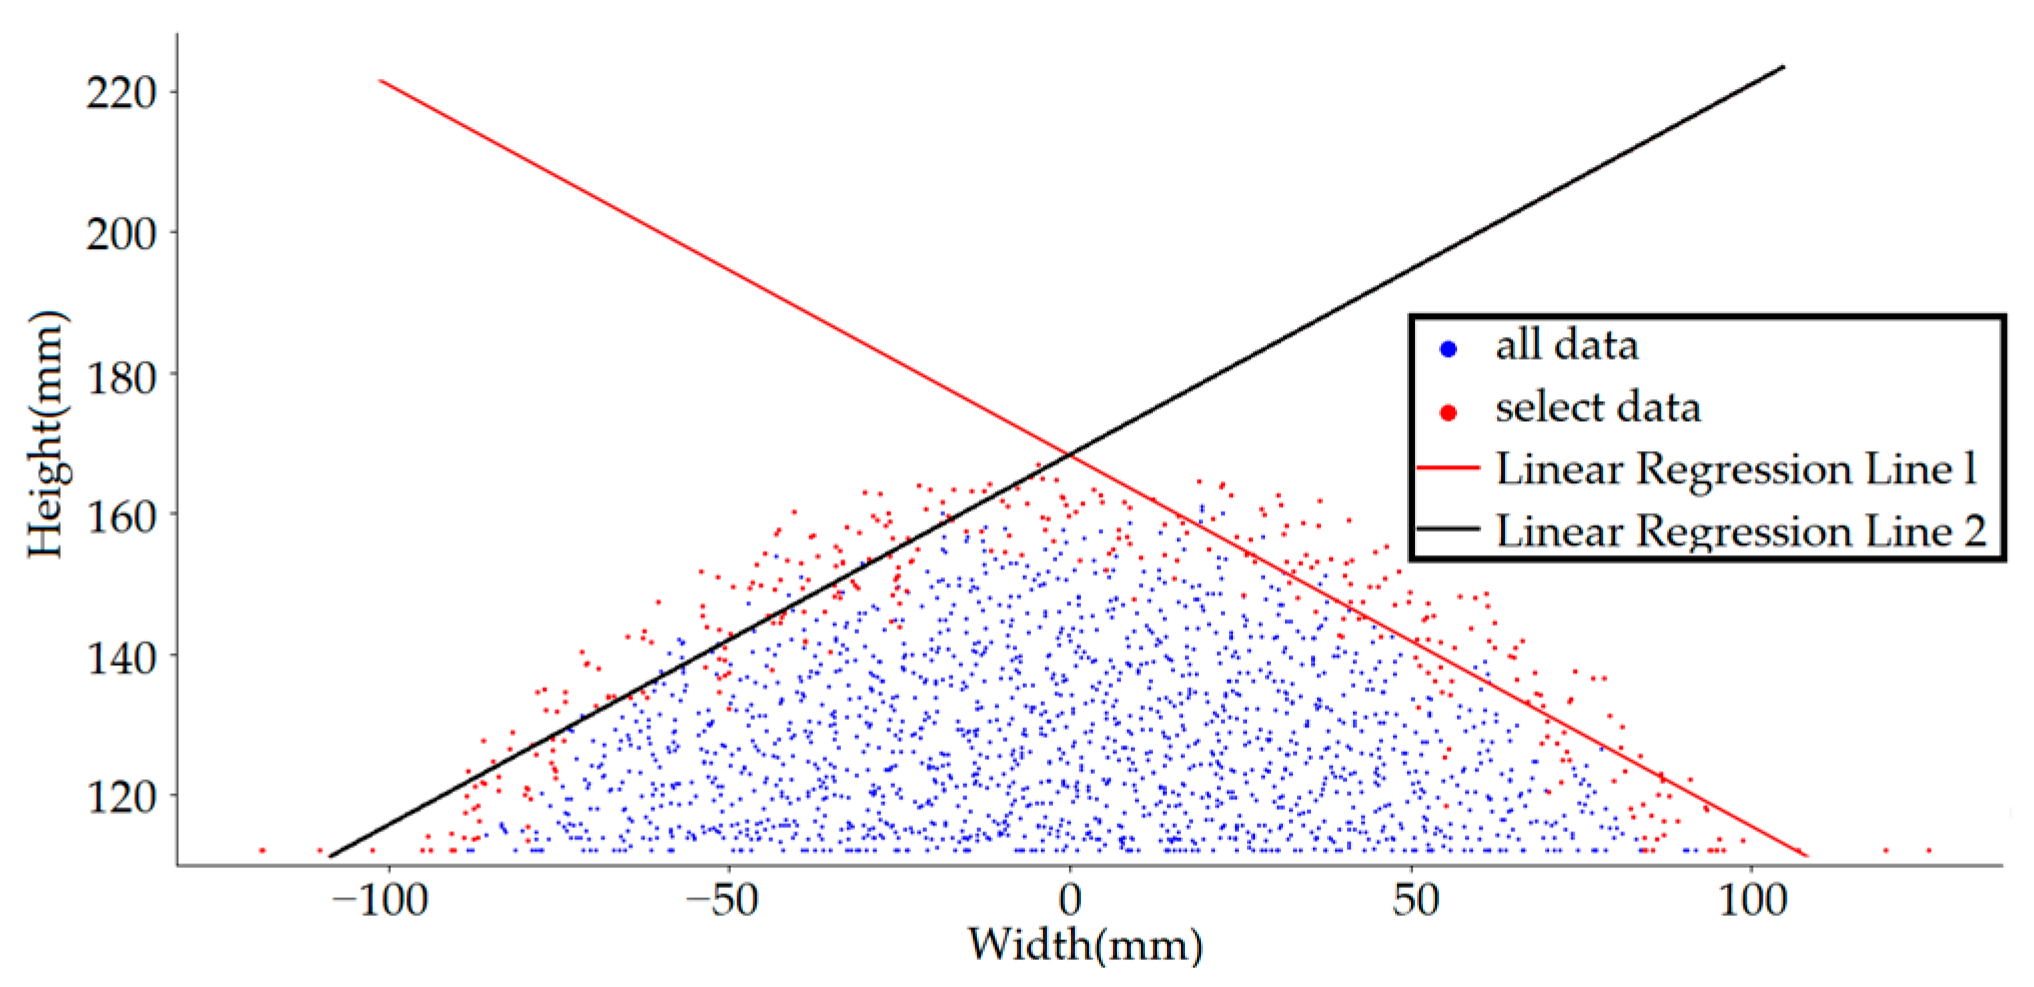
Figure 13.
The linear analysis of the first test.
Figure 13.
The linear analysis of the first test.
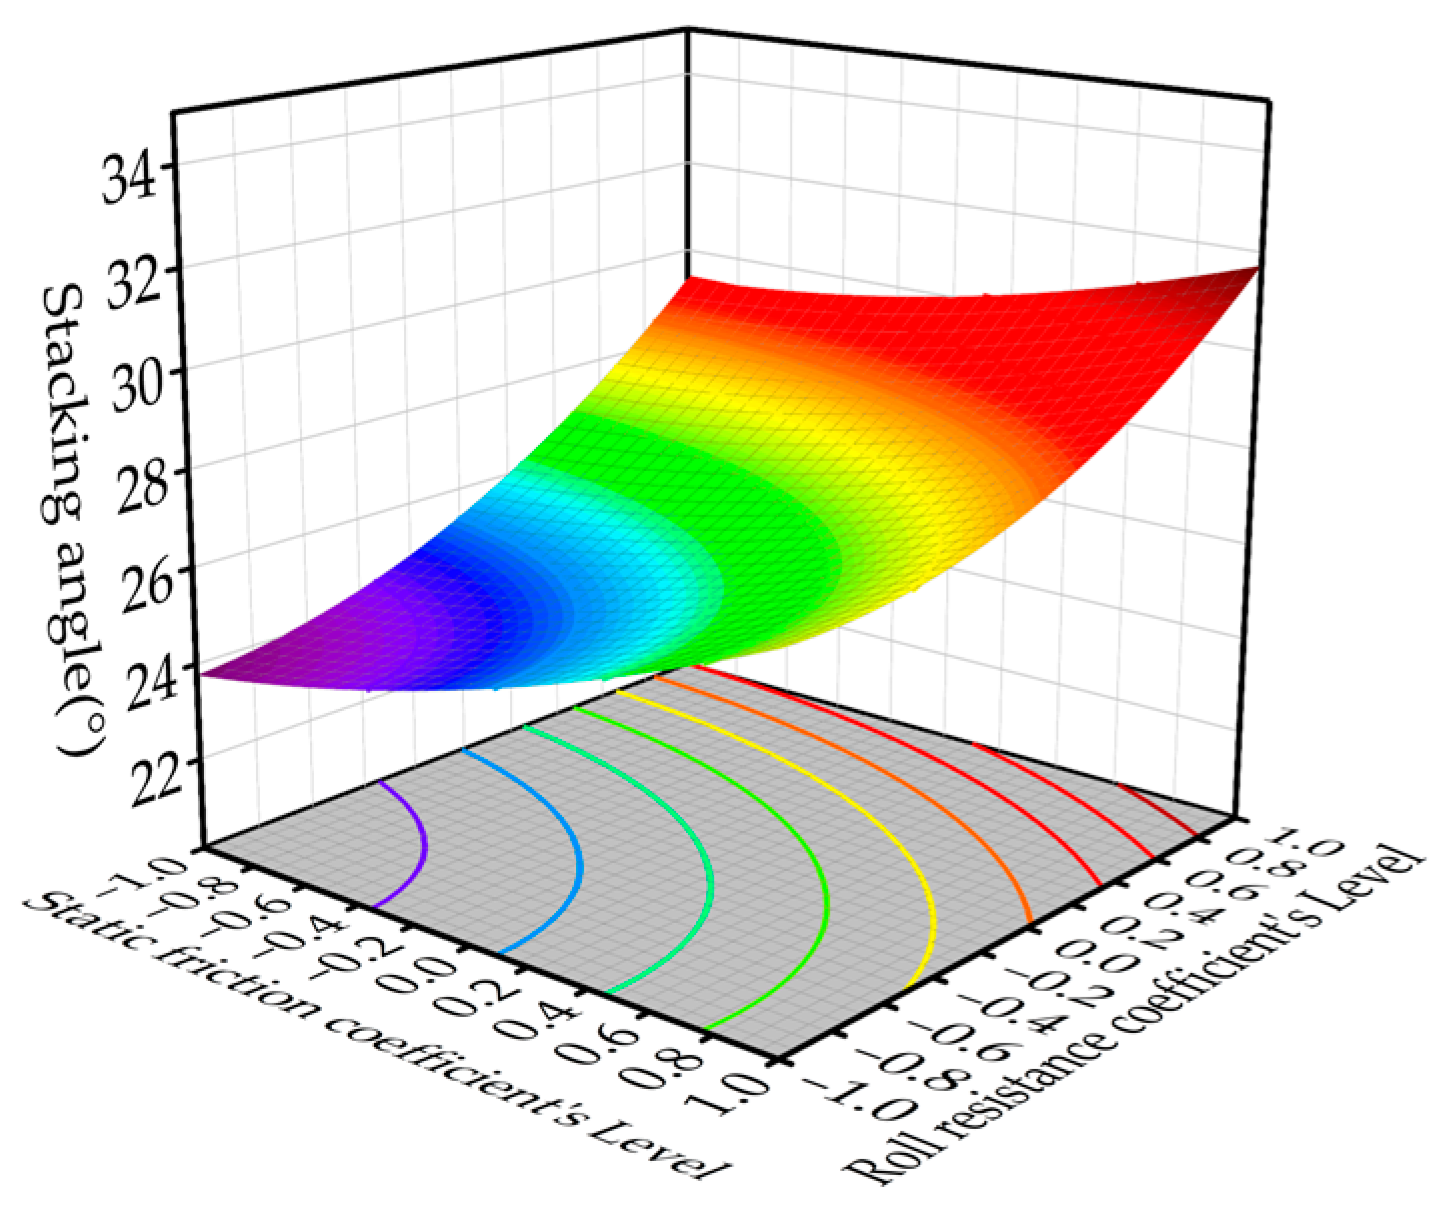
Figure 14.
The response surface of the influence of A and B on the stacking angle.
Figure 14.
The response surface of the influence of A and B on the stacking angle.
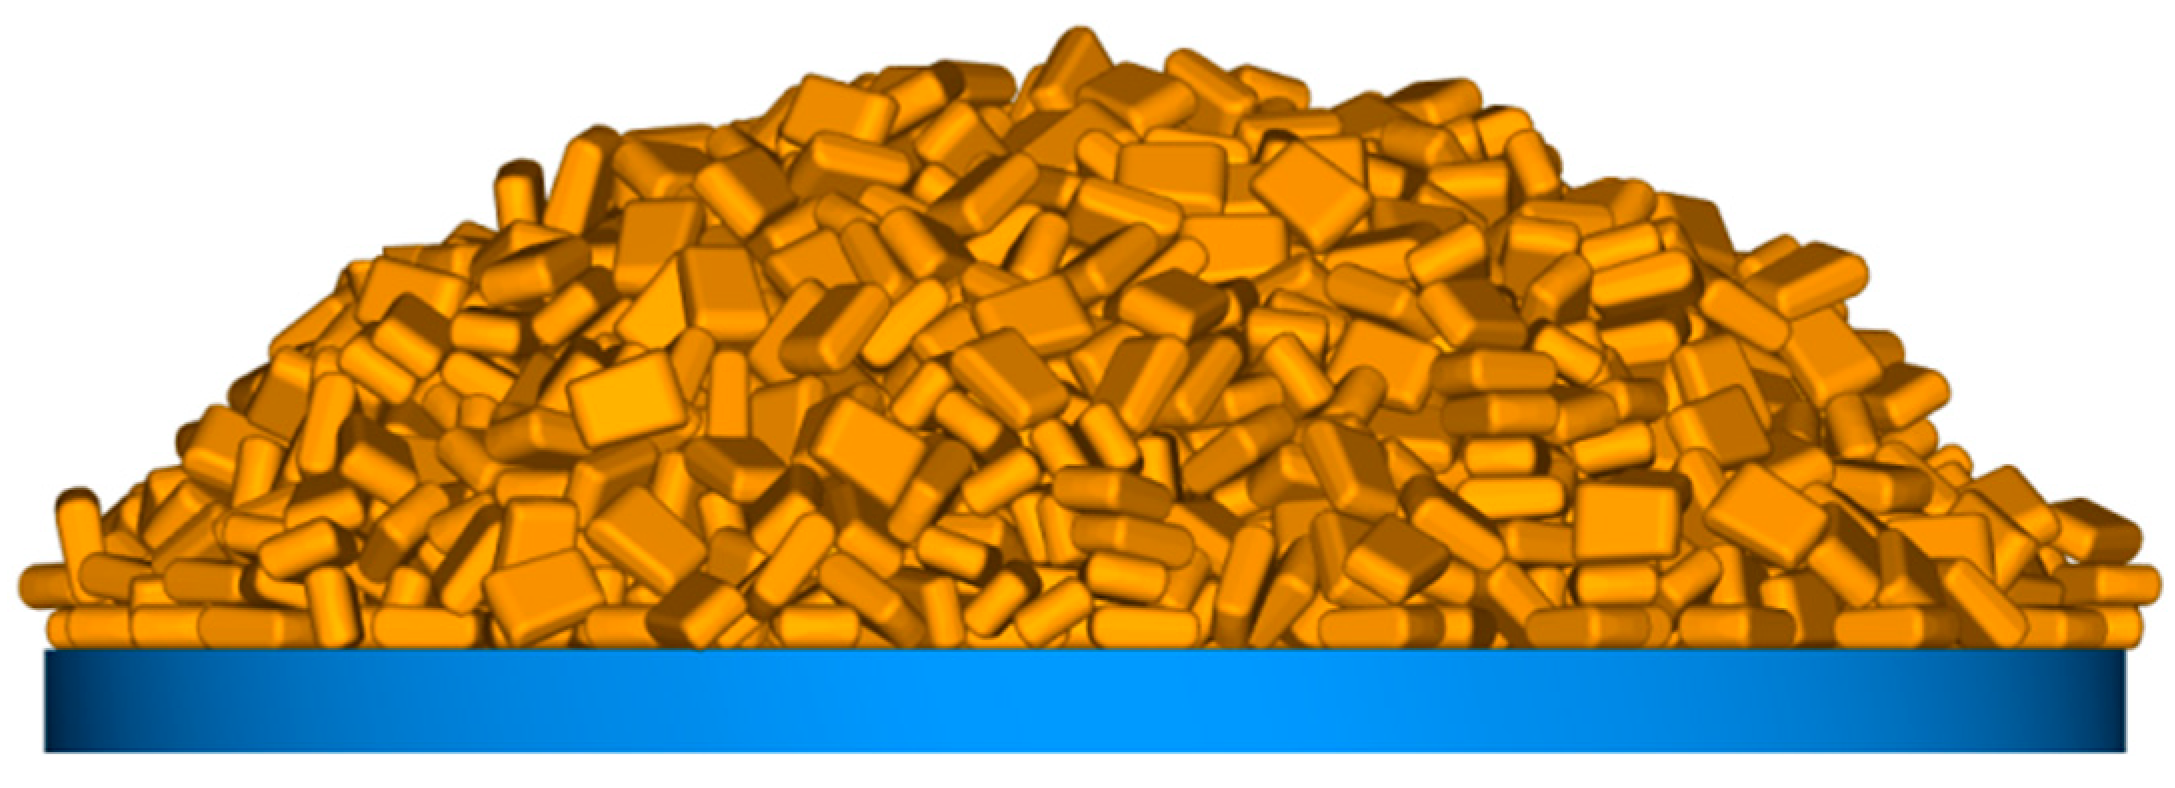
Figure 15.
The test of the optimal calibration parameter.
Figure 15.
The test of the optimal calibration parameter.
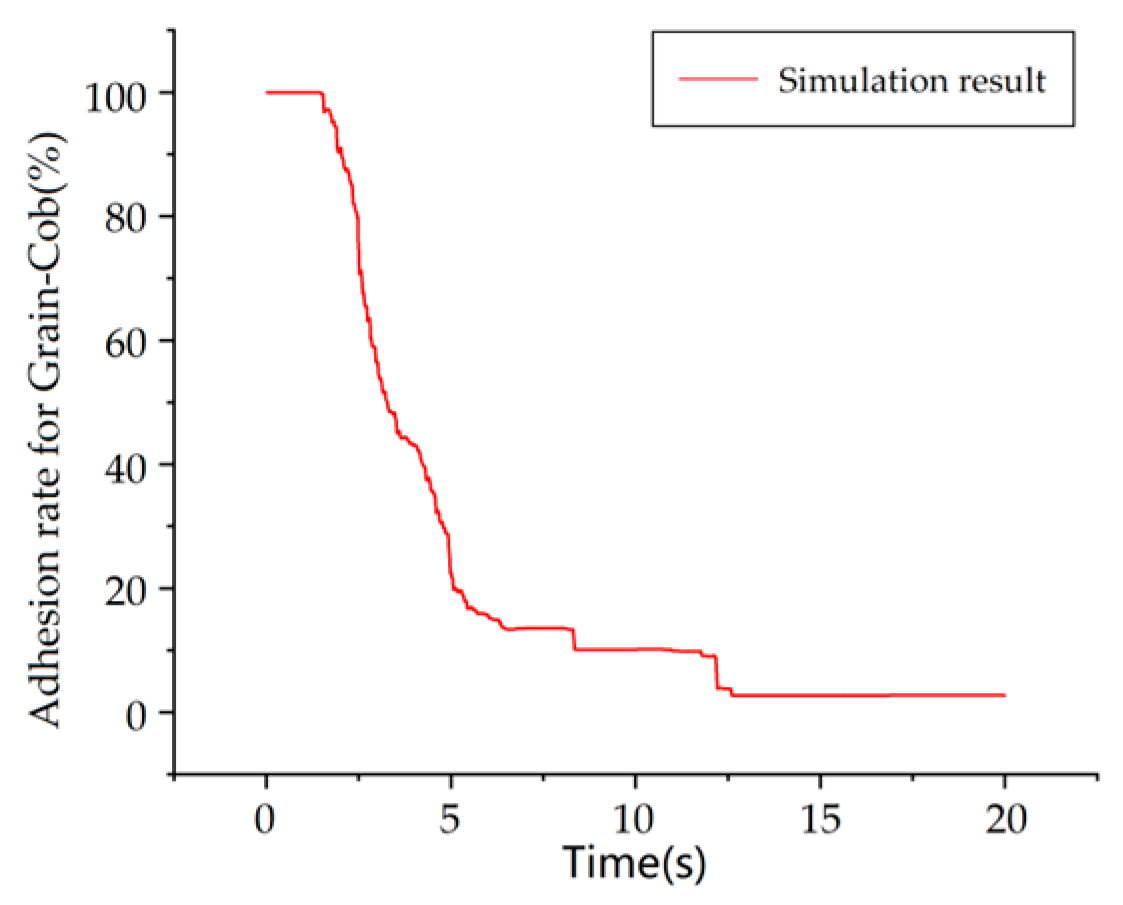
Figure 16.
The adhesion rate of maize kernels–cob model.
Figure 16.
The adhesion rate of maize kernels–cob model.
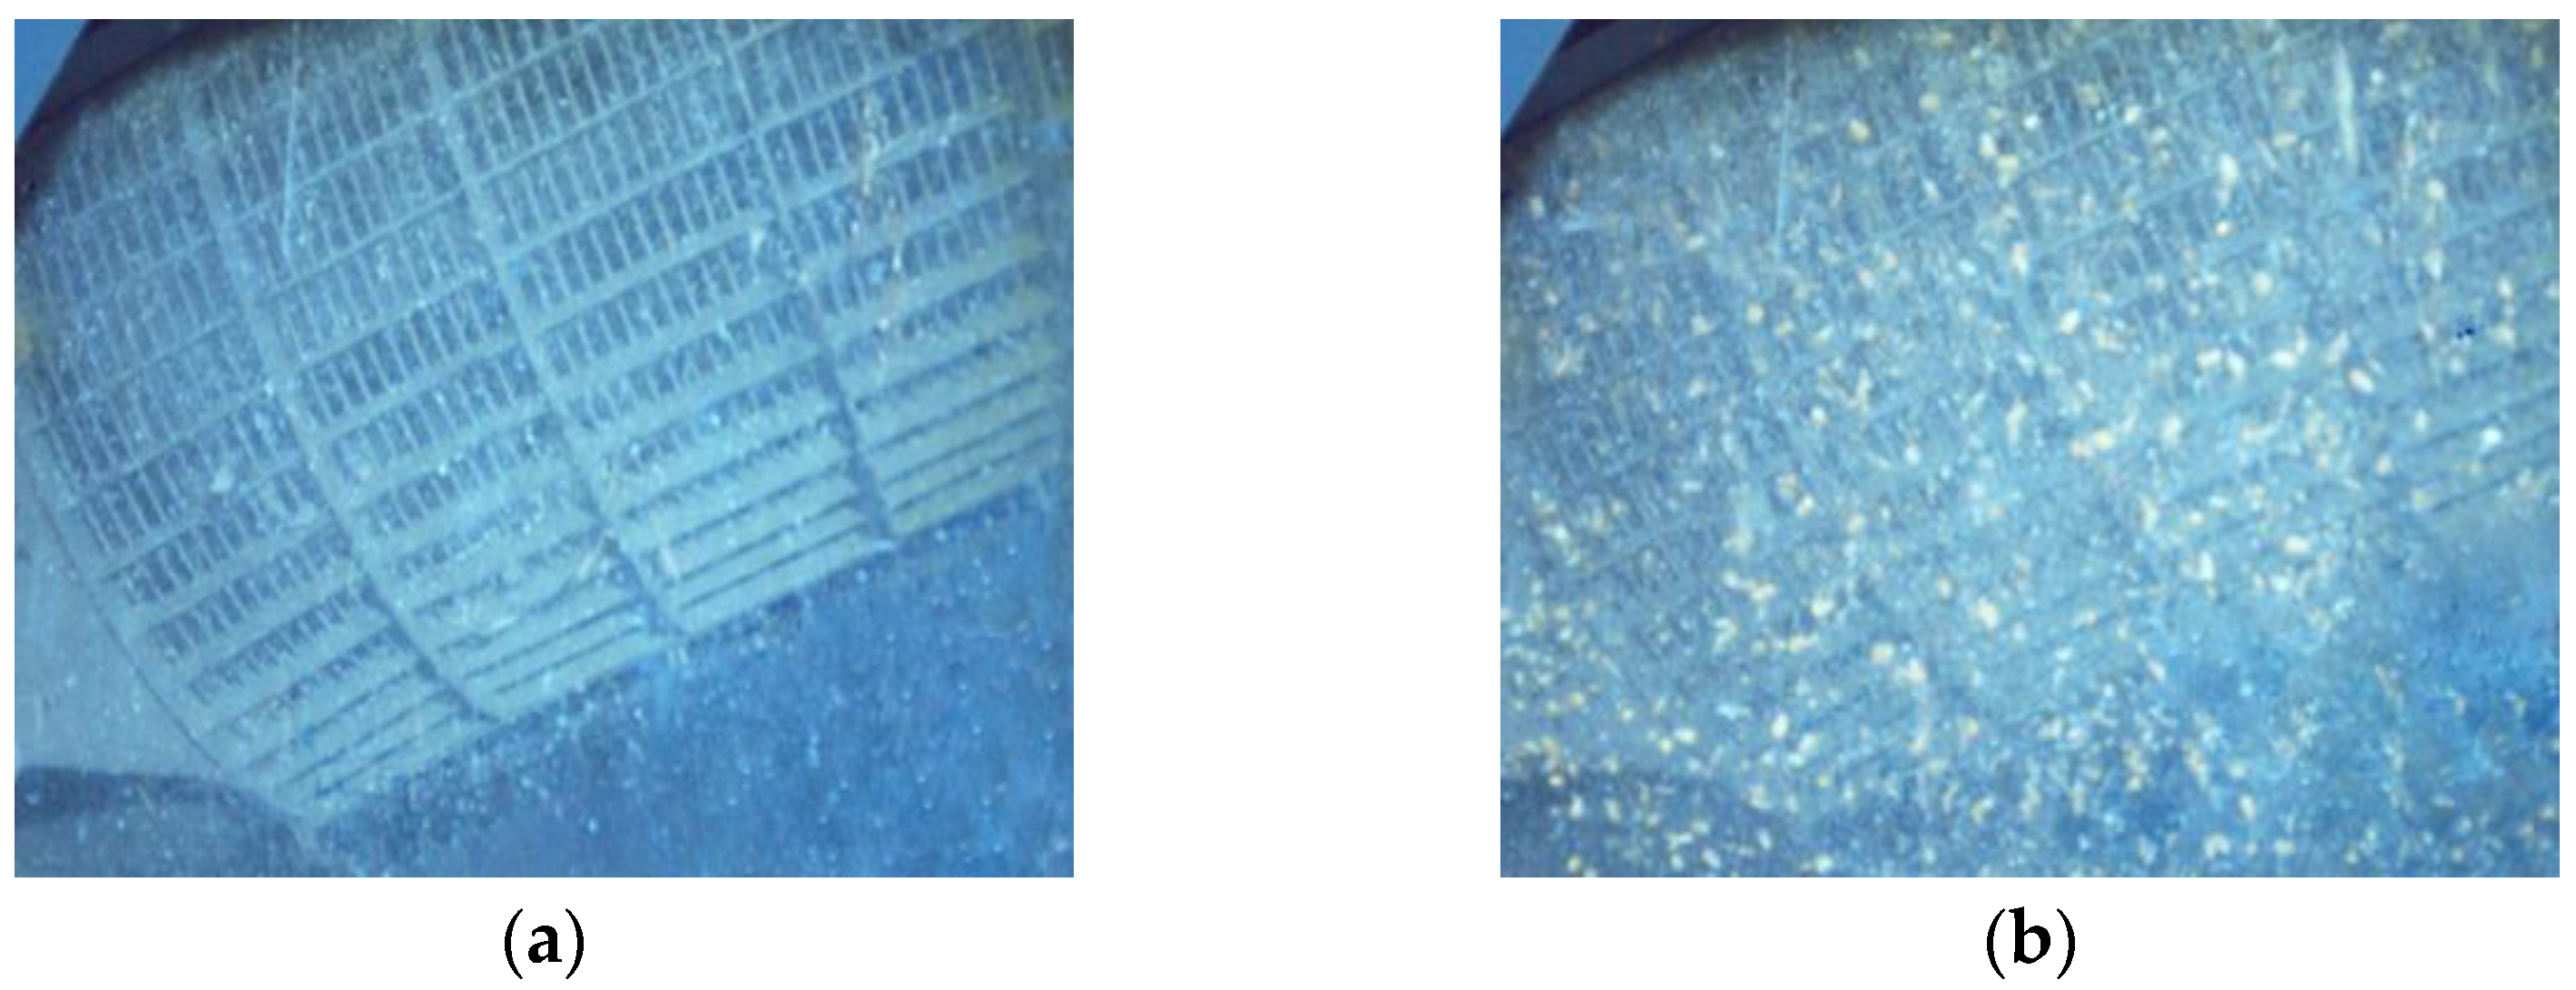
Figure 17.
The actual test process of maize threshing. (a). Threshing at 2 s (b). Threshing at 8 s.
Figure 17.
The actual test process of maize threshing. (a). Threshing at 2 s (b). Threshing at 8 s.
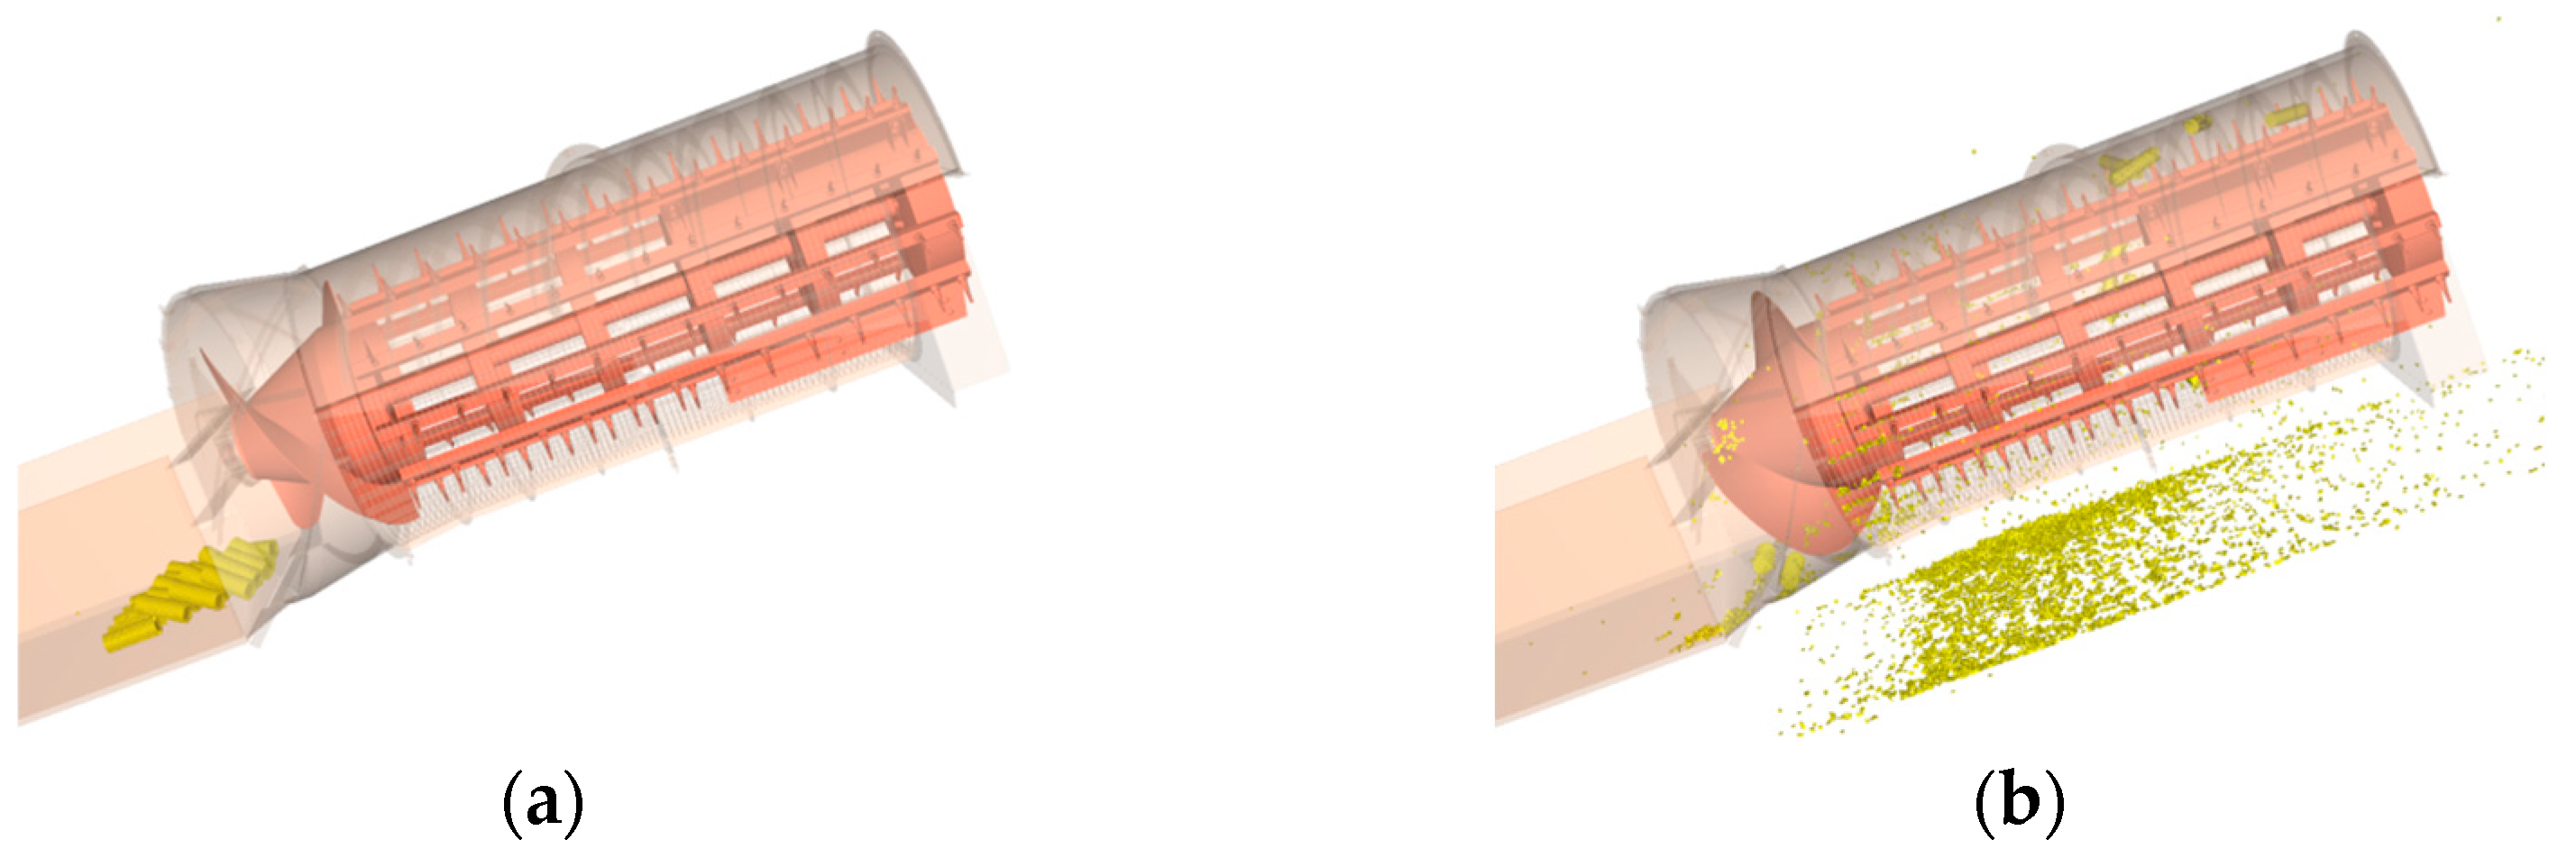
Figure 18.
The simulation test process of maize threshing. (a). Threshing at 2 s (b). Threshing at 8 s.
Figure 18.
The simulation test process of maize threshing. (a). Threshing at 2 s (b). Threshing at 8 s.
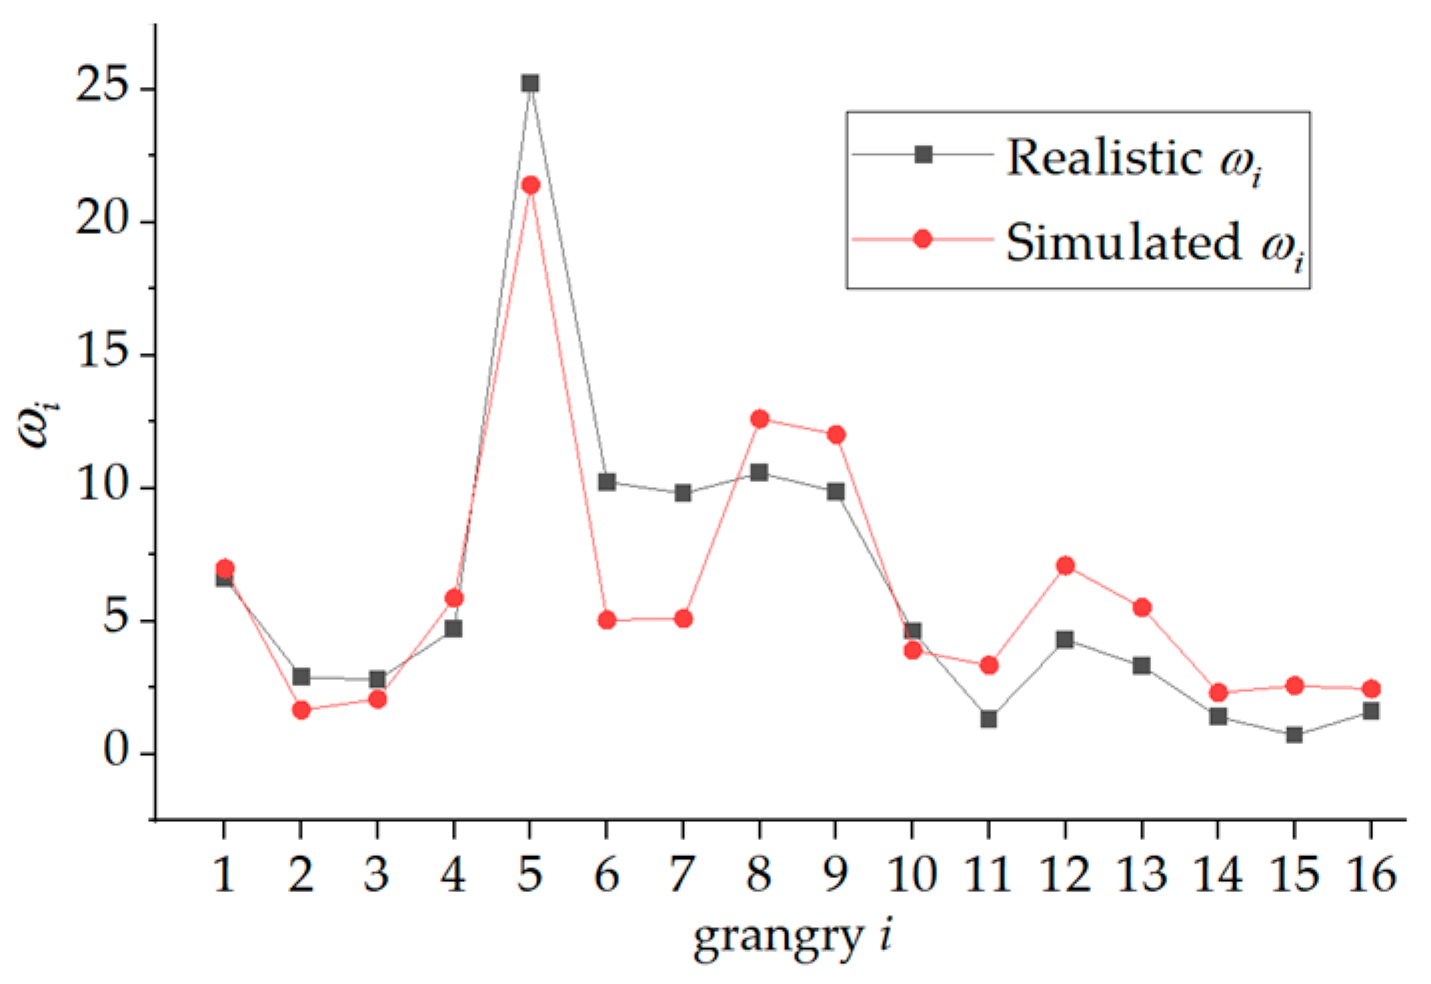
Figure 19.
The point line image of the actual–simulation test.
Figure 19.
The point line image of the actual–simulation test.
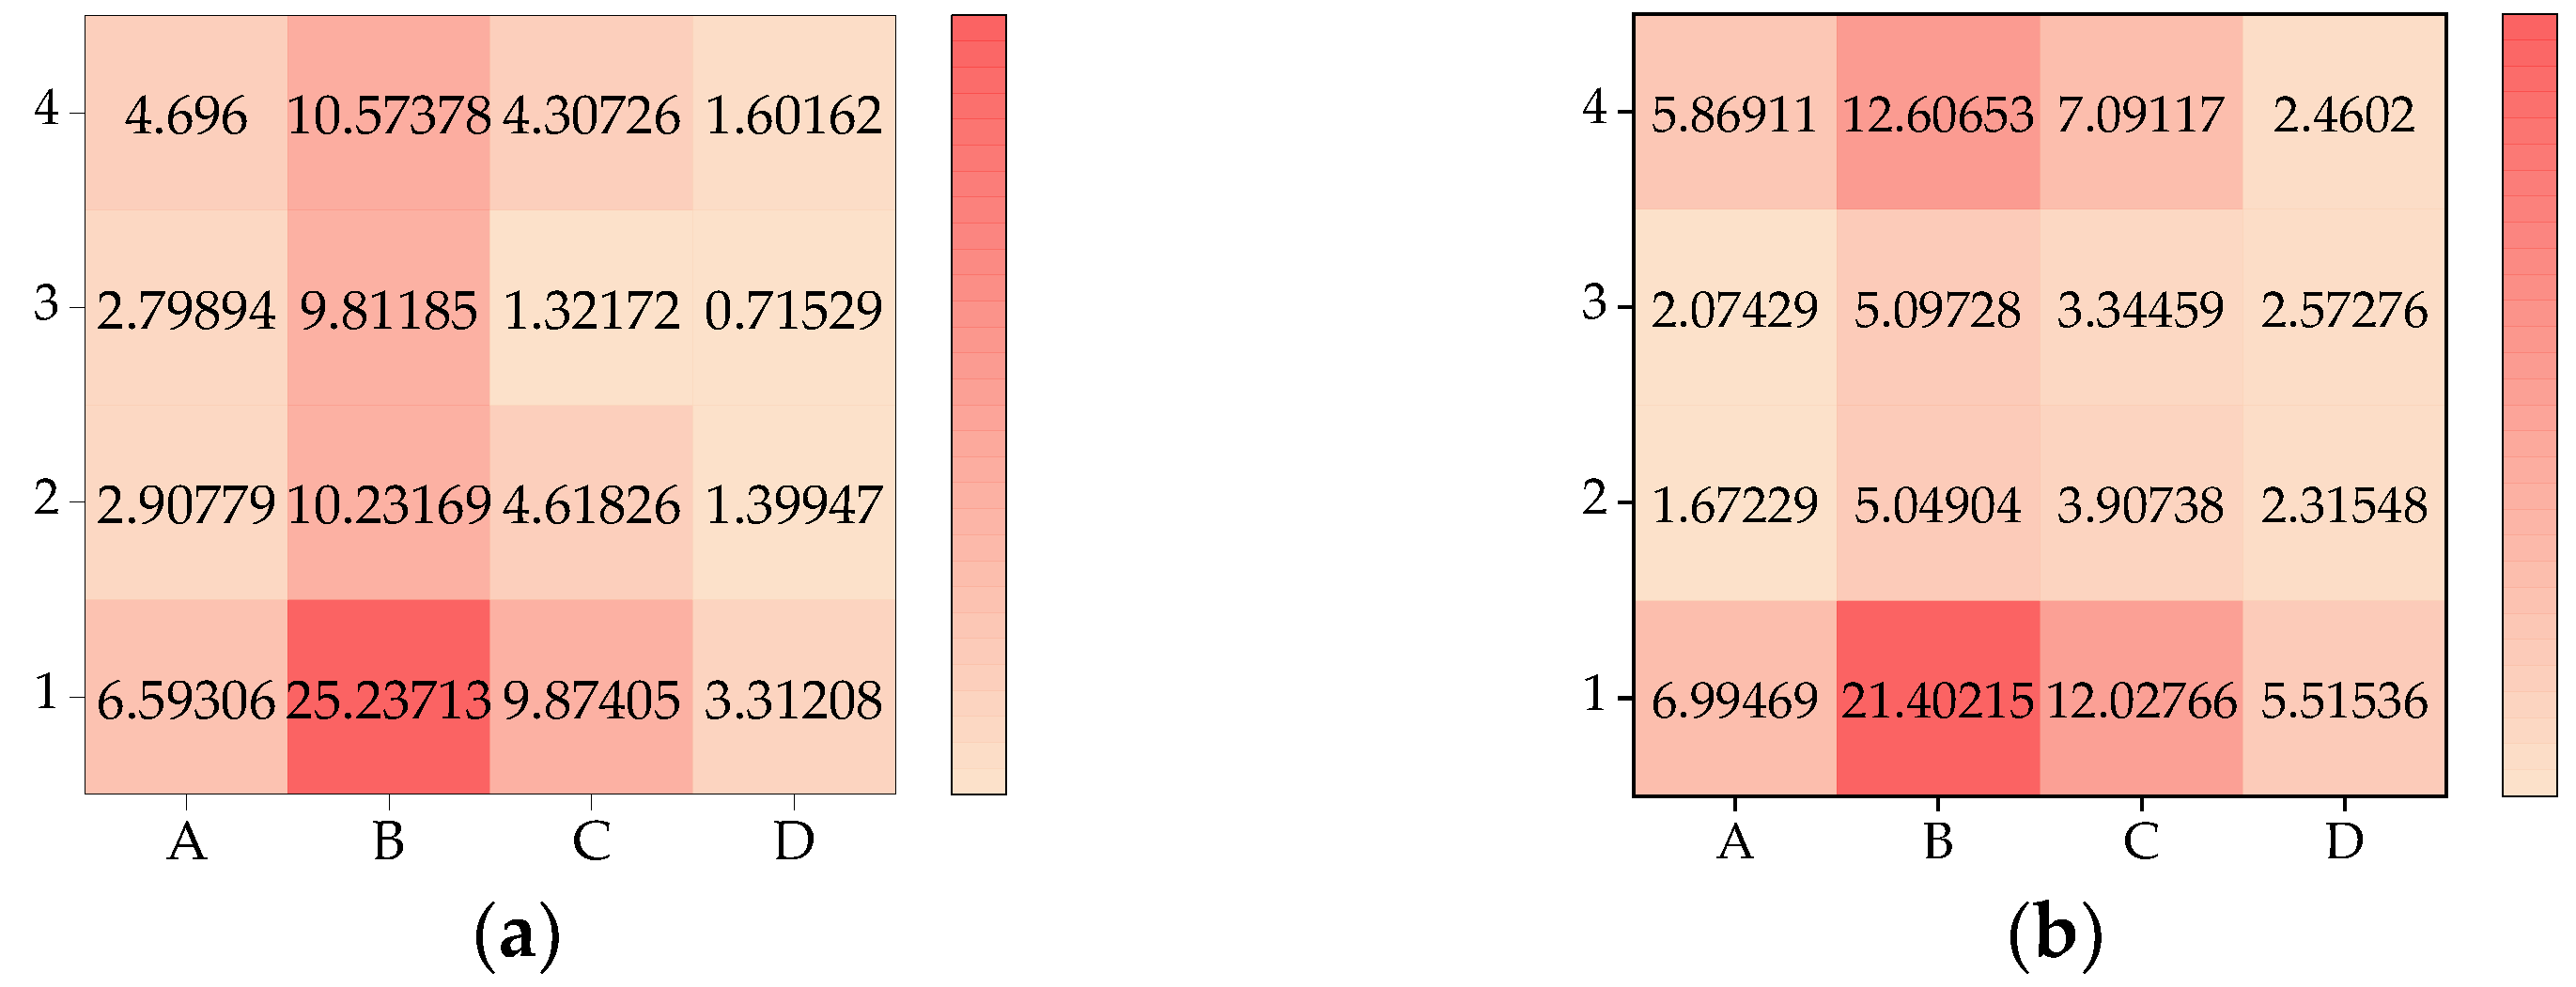
Figure 20.
The heat maps of the actual results (a) and the simulation results (b).
Figure 20.
The heat maps of the actual results (a) and the simulation results (b).
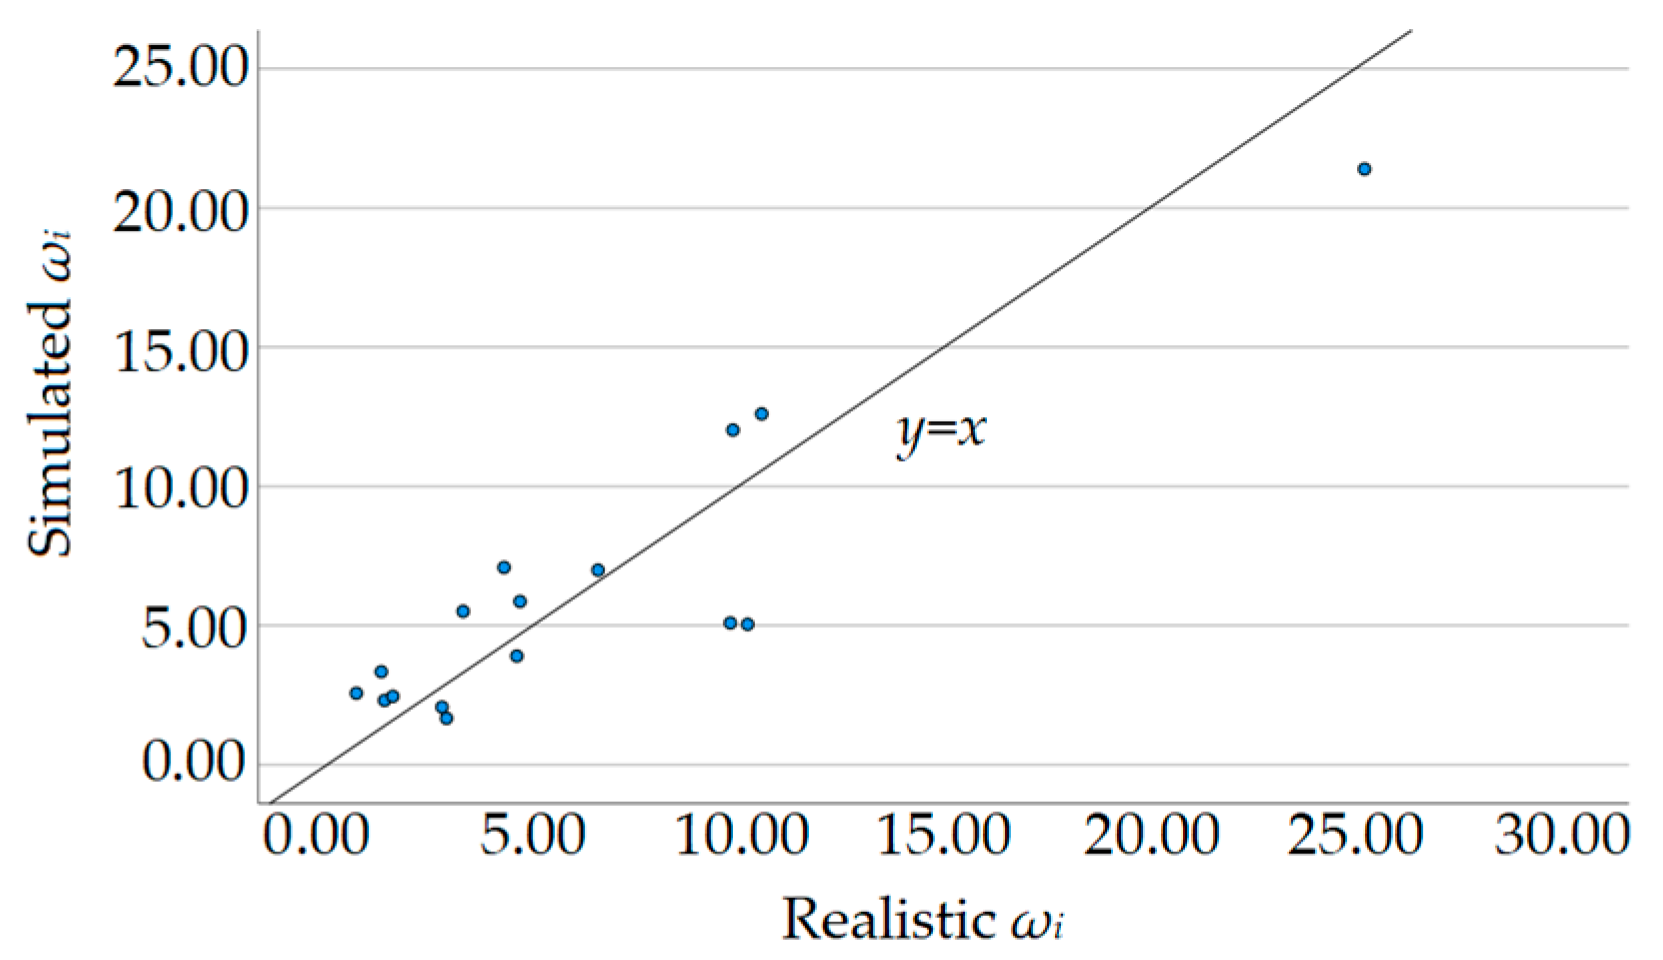
Figure 21.
The scatterplot of the relationship between the actual results and simulation results.
Figure 21.
The scatterplot of the relationship between the actual results and simulation results.
Table 1.
The classification of maize grain shape.
Table 1.
The classification of maize grain shape.
| Grain Shape | Grain Numbers | Proportion |
|---|
| horse-tooth | 162 | 81% |
| truncated triangular pyramid | 23 | 11.50% |
| ellipsoidal cone | 4 | 2% |
| spheroid | 3 | 1.50% |
| irregular | 3 | 1.50% |
| broken | 5 | 2.5% |
Table 2.
The results of maize measurement.
Table 2.
The results of maize measurement.
| Size | Average (mm) |
|---|
| Total length | 11.1 |
| Upper width | 8.1 |
| Lower width | 7 |
| Thickness | 4.5 |
Table 3.
The determination of the static friction coefficient.
Table 3.
The determination of the static friction coefficient.
| Results | Static Friction Coefficient |
|---|
| Maximum | 0.67 |
| Minimum | 0.46 |
| Average | 0.56 |
| Standard deviation | 0.06 |
Table 4.
The determination of the roll friction coefficient.
Table 4.
The determination of the roll friction coefficient.
| Results | Roll Resistance Coefficient |
|---|
| Maximum | 0.133 |
| Minimum | 0.070 |
| Average | 0.104 |
| Standard deviation | 0.021 |
Table 5.
The settings of relevant parameters.
Table 5.
The settings of relevant parameters.
| Parameters | Value |
|---|
| Poisson’s ratio of kernel | 0.4 |
| Young’s modulus of kernel | 116.91 MPa |
| Kernel density | 1197 Kg/m3 |
| Kernel–Kernel recovery coefficient | 0.233 |
| Kernel–Steel recovery coefficient | 0.6 |
| Static friction coefficient of kernel–steel | 0.46 |
| Poisson’s ratio of steel plate | 0.29 |
| Young’s modulus of steel plate | 206 GPa |
| Steel plate density | 8000 Kg/m3 |
Table 6.
The level of the two factors in the simulation test.
Table 6.
The level of the two factors in the simulation test.
| Level | Static Friction Coefficient | Roll Resistance Coefficient |
|---|
| −1 | 0.41 | 0.054 |
| 0 | 0.56 | 0.104 |
| 1 | 0.71 | 0.154 |
Table 7.
The simulation parameters of the machine working in the threshing process.
Table 7.
The simulation parameters of the machine working in the threshing process.
| Parameters | Value |
|---|
| Rotational speed of threshing cylinder | 400 Rpm |
| Conveying speed of conveyor belt | 0.8 m/s |
| Maize feeding amount | 10 Kg/s |
| Simulation duration | 20 s |
Table 8.
The results of the actual stacking angle test.
Table 8.
The results of the actual stacking angle test.
| Results | Gauge Reading (mm) | Stacking Angle (DEG) |
|---|
| Average | 52.4 | 27.646 |
| Standard deviation | 2.32 | 1.040 |
Table 9.
The final stacking angle results of the simulation test.
Table 9.
The final stacking angle results of the simulation test.
| Std | Static Friction
A | Dynamic Friction
B | Stacking Angle (DEG) |
|---|
| 1 | 1 | −1 | 27.75 |
| 2 | 0 | −1 | 25.5 |
| 3 | 0 | 0 | 24.8 |
| 4 | 1 | 0 | 28.1 |
| 5 | −1 | −1 | 23.3 |
| 6 | −1 | 0 | 26.7 |
| 7 | 0 | 0 | 23.9 |
| 8 | −1 | 1 | 29.1 |
| 9 | 1 | 1 | 31.8 |
| 10 | 0 | 1 | 30.1 |
| 11 | 0 | 0 | 28.2 |
| 12 | 0 | 0 | 27.9 |
| 13 | 0 | 0 | 26.9 |
Table 10.
The results of the model analysis of variance.
Table 10.
The results of the model analysis of variance.
| Source | Sum of Squares | df | Mean Square | F-Value | p-Value | Significance |
|---|
| Model | 57.2 | 5 | 11.44 | 5.03 | 0.0284 | * |
| A | 14.57 | 1 | 14.57 | 6.4 | 0.0392 | * |
| B | 35.28 | 1 | 35.28 | 15.5 | 0.0056 | ** |
| AB | 0.5256 | 1 | 0.5256 | 0.2309 | 0.6455 | - |
| A² | 0.7513 | 1 | 0.7513 | 0.33 | 0.5836 | - |
| B² | 3.79 | 1 | 3.79 | 1.67 | 0.2379 | - |
| Residual | 15.94 | 7 | 2.28 | | | - |
| Lack of fit | 1.4 | 3 | 0.4678 | 0.1288 | 0.9381 | - |
| Pure error | 14.53 | 4 | 3.63 | | | |
| Cor total | 73.13 | 12 | | | | |
Table 11.
The ratio of the mass in each granary to the total mass.
Table 11.
The ratio of the mass in each granary to the total mass.
| Granary i | i | i |
|---|
| 1 | 6.59 | 6.99 |
| 2 | 2.91 | 1.67 |
| 3 | 2.80 | 2.07 |
| 4 | 4.70 | 5.87 |
| 5 | 25.24 | 21.40 |
| 6 | 10.23 | 5.05 |
| 7 | 9.81 | 5.10 |
| 8 | 10.57 | 12.61 |
| 9 | 9.87 | 12.03 |
| 10 | 4.62 | 3.91 |
| 11 | 1.32 | 3.34 |
| 12 | 4.31 | 7.09 |
| 13 | 3.31 | 5.52 |
| 14 | 1.40 | 2.32 |
| 15 | 0.72 | 2.57 |
| 16 | 1.60 | 2.46 |
Table 12.
The calculation process of the Wilcoxon signed-rank test.
Table 12.
The calculation process of the Wilcoxon signed-rank test.
| Granary i | i | i | d | | |
|---|
| 1 | 6.59 | 6.99 | 0.4 | 1 | - |
| 2 | 2.91 | 1.67 | −1.24 | - | −7 |
| 3 | 2.8 | 2.07 | −0.73 | - | −3 |
| 4 | 4.7 | 5.87 | 1.17 | 6 | - |
| 5 | 25.24 | 21.4 | −3.84 | - | −14 |
| 6 | 10.23 | 5.05 | −5.18 | - | −16 |
| 7 | 9.81 | 5.1 | −4.71 | - | −15 |
| 8 | 10.57 | 12.61 | 2.04 | 10 | - |
| 9 | 9.87 | 12.03 | 2.16 | 11 | - |
| 10 | 4.62 | 3.91 | −0.71 | - | −2 |
| 11 | 1.32 | 3.34 | 2.02 | 9 | - |
| 12 | 4.31 | 7.09 | 2.78 | 13 | - |
| 13 | 3.31 | 5.52 | 2.21 | 12 | - |
| 14 | 1.4 | 2.32 | 0.92 | 5 | - |
| 15 | 0.72 | 2.57 | 1.85 | 8 | - |
| 16 | 1.6 | 2.46 | 0.86 | 4 | - |
| Total | | | | | |


