Abstract
This study explored the elemental, isotopic, and chemometric profiles of Montepulciano d’Abruzzo grapes to ensure the safety and quality of wines produced under the Protected Designation of Origin (PDO) label. Essential nutrients, such as K, P, Ca, Mg, and Fe, were quantified alongside toxic elements, like Hg, Pb, Cd, and As, to evaluate the potential health impacts and compliance with food safety standards. Isotopic analysis provided a powerful tool for geographical authentication, essential for verifying the grapes’ PDO status and preventing market fraud. Chemometric techniques, including Principal Component Analysis (PCA) and Multivariate Classification Methods, were employed to interpret complex datasets, enabling the identification of unique patterns and clusters that signify quality attributes and possible contamination. The study’s findings not only enhance the traceability and authentication processes essential for PDO labels but also offer valuable insights into the safety and quality management of Montepulciano d’Abruzzo grapes, addressing the implications for growers, regulators, and consumers, thereby supporting sustainable viticulture and robust quality control in global wine production.
1. Introduction
The safety and quality of wine grapes are paramount to the viticulture industry, influencing the economic viability of wine production, consumer perception, and global market trends [1,2,3,4]. Montepulciano d’Abruzzo, a Protected Designation of Origin (PDO) wine, is renowned for its distinctive flavour and quality, derived from the unique terroir of the Abruzzo region in Italy [5]. This research’s aim is to explore the elemental, isotopic, and chemometric profiles of Montepulciano d’Abruzzo grapes, a crucial step in assessing their safety and quality and, thus, the safety and quality of the wine they produce [6].
Montepulciano d’Abruzzo is not just a wine; it is a significant contributor to Italy’s economy and a symbol of consumer satisfaction. It ranks among Italy’s most prolific and popular red wines, contributing significantly to the region’s economy. The annual production of Montepulciano d’Abruzzo encompasses approximately 36 million bottles, with vineyards spanning over 10,000 hectares across the Abruzzo region [6]. This substantial output necessitates stringent quality and safety measures to uphold the PDO standards and satisfy consumer expectations worldwide.
Given a combination of increasing environmental challenges and stringent food safety standards, grapes’ elemental composition can provide critical information regarding plant health, the impact of environmental pollution and agronomic practices, and aid their provenance [7].
For this reason, this study aims to perform the analysis of twenty-five elements (Al, As, B, Ba, Ca, Cd, Co, Cr, Cu, Fe, Hg, K, Li, Mg, Mn, Mo, Na, Ni, P, Pb, S, Se, Si, Sr and Zn, measured by HR-ICP-MS) and five isotopic ratios (208Pb/206Pb, 207Pb/206Pb, 206Pb/204Pb, 208Pb/207Pb and 87Sr/86Sr, measured by MC-ICP-MS) in grapes from Monteuplciano d’Abruzzo PDO chain [8,9,10,11].
Grapes are known to be a powerful source of essential nutrients for human nutrition, such as K, P, Ca, Mg and Fe. These elements play a key role in the cells’ function, fluid balance, tissue formation, muscle and nerve functions and oxygen transport. On the other hand, grapes may accumulate toxic elements, such as Hg, Pb (harmful, especially to children), Cd (kidney toxicity) and As (originating mainly from the groundwater and toxic to human health) [12].
Additionally, isotopic analysis offers a powerful tool for geographical authentication, helping to prevent fraud and confirm the grapes’ PDO status. This method leverages the unique isotopic signatures that grapes acquire from their environment, including the soil, water, and climate conditions specific to their growing location. The isotopic signature is influenced by water source, climate, Photosynthesis Pathways, soil and fertilisation. Therefore, it may be a fingerprint for specific agricultural products, such as grapes. By comparing the isotopic ratios of a sample with known regional isotopic signatures, it may be possible to verify the claimed origin of grape-derived products like wine. This is particularly useful in the wine industry, where the geographical origin can significantly affect the market value and authenticity of the product. Moreover, this technique can also assist in quality control by ensuring consistency in the geographic sourcing of grapes for a particular brand or label [12,13].
Chemometric techniques are utilised to interpret the complex datasets these analyses generate, providing a holistic understanding of grape quality and safety metrics [14].
Techniques such as Principal Component Analysis (PCA) and Multivariate Classification Methods (LDA and QDA) are used to interpret food safety and product quality data. These methods help identify patterns or clusters in data, predict quality attributes, and detect anomalies or impurities that could indicate adulteration/contamination [15,16,17].
This study employs a comprehensive analytical approach to examine the Montepulciano d’Abruzzo PDO chain. Integrating elemental, isotopic and chemometric analyses allows us to construct a detailed profile of the grape’s quality parameters and to assess food safety. The data gathered contribute to the scientific community’s understanding of viticultural practices and enhance the traceability and authentication processes essential to maintaining the integrity of PDO labels.
Furthermore, this study offers valuable insights into the food safety and quality management of Montepulciano d’Abruzzo grapes. It addresses the implications for growers, regulators and consumers, enhancing the knowledge necessary for sustainable viticulture and robust quality control in global wine production.
2. Materials and Methods
2.1. Chemicals and Reagents
Nitric acid (HNO3, Sigma-Aldrich Chemie Gmbh, Munich, Germany), hydrogen fluoride (HF, 48%, Merck, Darmstadt, Germany) and hydrogen peroxide (H2O2, Merck) used in this work were of analytical grade. Water used was de-ionised Milli-Q water (Millipore, Bedford, MA, USA) purified by reverse osmosis followed by ion-exchange cartridges. Pre-packed 2 mL columns with Sr-Spec resin (Eichrom Technologies LLC 1955 University Lane, Lisle, IL, USA) were used as supplied. For instrumental mass-bias correction, NIST SRM 987—Strontium Carbonate and NIST SRM 981—Common Lead Isotopic Standards (both from National Institute of Standards and Technology, Gaithersburg, MD, USA) were used. For controlling the accuracy and precision of the analytical methods, NIST SRM 1547 Peach Leaves (National Institute of Standards and Technology, Gaithersburg, MD, USA), a certified reference material (CRM), was included and processed throughout the entire procedure (digestion, separation and analysis).
2.2. Instrumentation
All measurements of element concentrations were performed by double-focusing sector field ICP-MS ELEMENT XR (Thermo Scientific, Bremen, Germany) equipped with an introduction system consisting of a demountable quartz torch with 1.5 mm i.d. sapphire injector, platinum capacitive de-coupling shield, nickel sampler cone, high sensitivity ‘X-type’ skimmer cone and PFA spray chamber with two gas inlet ports (Cetac Technologies, Omaha, NE, USA), micro-concentric PolyPro nebuliser and FAST SD2 auto-sampler (ESI, Perkin-Elmer, Santa Clara, CA, USA) equipped with a six-port valve and a 1.5 mL sample loop filled and rinsed by vacuum suction. Methane addition to the plasma was used to decrease the formation of oxide-based spectral interferences, improve sensitivity for elements with high first ionisation potentials and to minimise matrix effects [18]. Operating conditions and measurement parameters for concentration measurements were as in a previous study [13]. Strontium and lead isotope ratio measurements were performed by NEPTUNE PLUS (Thermo Scientific, Bremen, Germany) MC-ICP-MS. Cup configurations used and operating conditions and measuring parameters are given in Rodushkin et al. (2010) [18]. A laboratory UltraWave single reaction chamber microwave digestion system (Milestone, Sovisole, Italy) was used for sample digestions.
2.3. Sample Preparation and Analysis
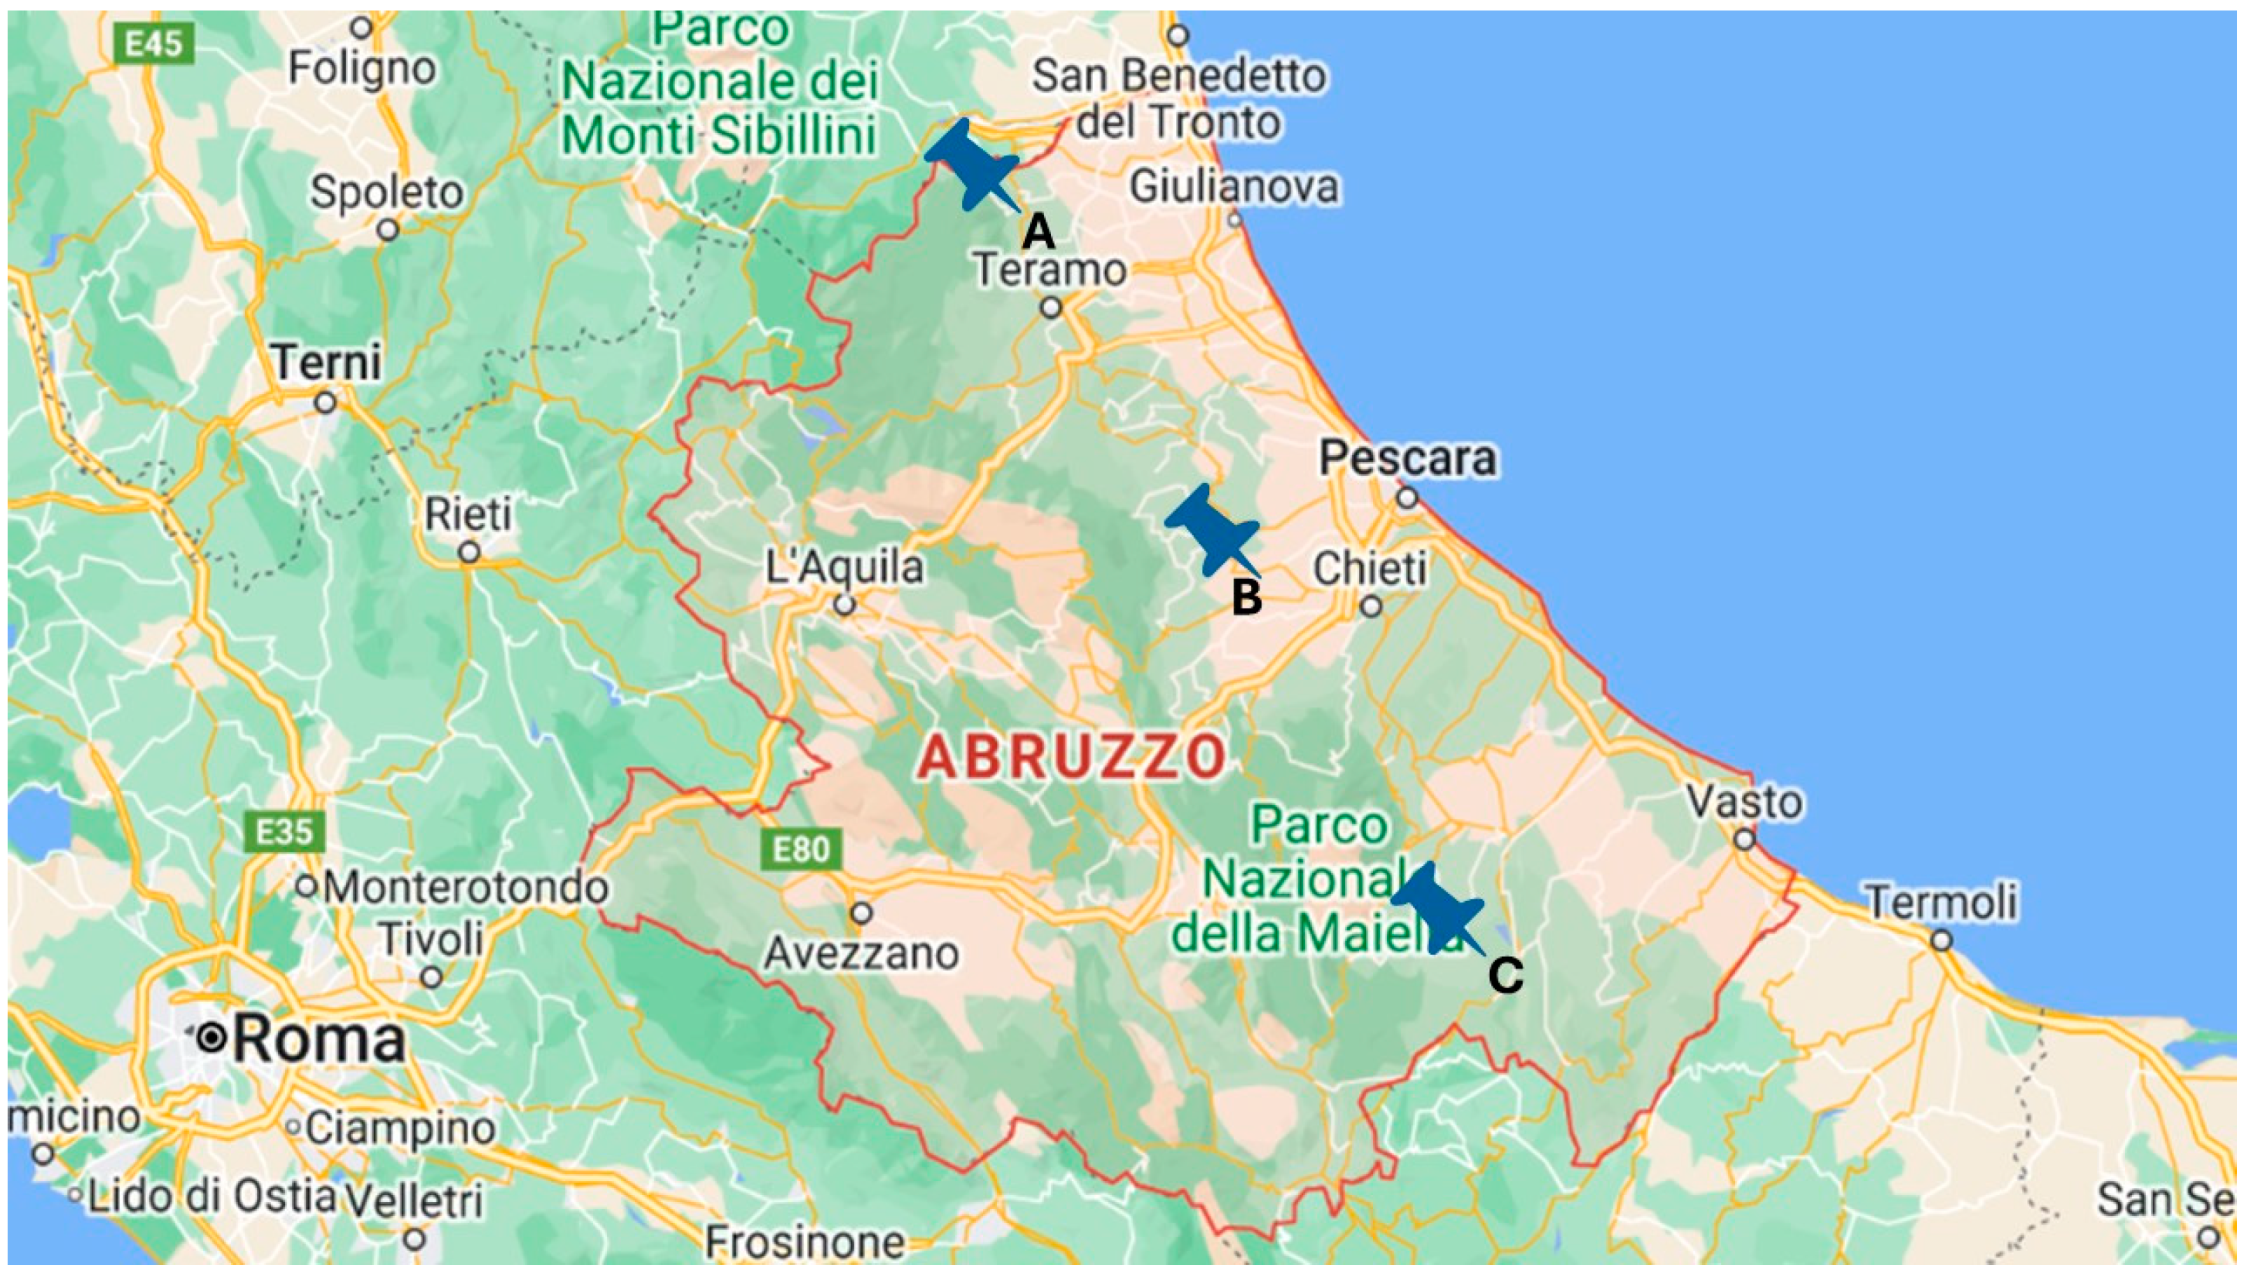
Twelve grape samples of Montepulciano variety from three different winemakers in the Abruzzo region, producing Montepulciano d’Abruzzo PDO wine, were collected into acid-washed plastic vials during 2020–2021 (Figure 1). Each sample comprised 50 individual berries from several plants from the same vineyard. Four samples were collected from each producer, representing four different vineyards in the same location. All the producers selected used organic practices for soil management, and they were chosen to represent the Abruzzo region geographically (one from the north, one from the centre and one from the south). The grapes were sampled during harvest, choosing acinus of 2–2.5 g with blue-black-coloured epicarps. Therefore, the total weight of each sample was 100–125 g. Samples were stored and transported frozen at −18 °C. All measurements of element concentrations and isotope ratios were performed at ALS Scandinavia AB laboratory (Luleå, Sweden). To allow for uniform blind handling, on arrival to laboratory, all samples were given a laboratory code number. Sample preparation was performed in Class 10,000 clean laboratory areas by personnel wearing cleanroom attire. General precautions detailed by Rodushkin et al. (2010) [18] were taken to minimize contamination. In order to reduce risk of sample contamination during homogenization, entire sample material was used for analysis. The samples were first thawed at room temperature followed by addition of concentrated HNO3 (1:1, v/m) and pre-digestion for 48 h inside a fume hood at room temperature, resulting in pale-yellow solution. Ten mL aliquots of these solution were placed in acid-washed Teflon vials; 0.02 mL of HF was added followed by MW-assisted digestion for 60 min at 210 °C in UltraWave system, resulting in transparent, colourless solutions. Part of this digest was further diluted with MQ-water for HR-ICP-MS analysis, while the rest was used for column separation of Sr and Pb followed by isotope ratio measurements by MC-ICP-MS. Details on separation procedure as well as on operation conditions and measurement parameters are reported elsewhere [15,16].

Figure 1.
Geographical distribution of selected winemakers sampled. Producer A is from Teramo province, producer B is from Pescara province and producer C is from Chieti province.
2.4. Analytical Validation
Summary of figures of merit of analytical methods used for multi-elemental analysis is provided in Table 1. The limits of detection (LOD) and limits of quantification (LOQ) for different matrices were calculated, in three lots, ten times the standard deviation for element’s concentrations detected in preparation blanks (n > 10).

Table 1.
Figures of merit of analytical method.
The accuracy of the data was assessed by analyses of the CRM and presented as mean recoveries calculated as ratio of ICP-SFMS results to certified, indicative or information values, where such values were available. Method reproducibility was evaluated from replicate preparation/analysis of samples and CRMs and, as a rule, was better than 10% RSD for elements presented in tested matrixes at concentrations 10-times above respective LODs (Table 1). Isotope ratios obtained in CRM are provided in Table 2. Reproducibility for Sr and Pb isotope ratio measurements was, as a rule, better than 0.005% RSD.
Table 2.
Isotope ratios obtained for CRMs.
2.5. Statistical Analysis
Analysis of variance (ANOVA) and mean comparison by Tukey’s honest significant difference (HSD) for the unequal number of samples at the 5% level were performed using JMP 17.1 Pro (SAS Institute, Cary, NC, USA. Decisional trees, Principal Component Analysis (PCA) and classification models (LDA and QDA) were performed with JMP 17.1 Pro. Before the chemometric assessment, an autoscaling pre-treatment was carried out in a data matrix [15,16,17].
3. Results and Discussion
3.1. Multi-Element Analysis
The results of twenty-five elements (Al, As, B, Ba, Ca, Cd, Co, Cr, Cu, Fe, Hg, K, Li, Mg, Mn, Mo, Na, Ni, P, Pb, S, Se, Si, Sr and Zn) determined in the grape samples are reported in Table 3. The table shows a significant variation in the concentrations of elements among different producers. To highlight the significant differences, a Tukey Honest Significant Differences (HSD) test was carried out on the data, and the results are also reported in Table 3.
Table 3.
Multi-element analysis of grape samples, expressed in ppb. Samples connected by different letters in a row are statistically different by the HSD Tukey test.
Most of the analysed elements did not show significant differences between the producers studied, except for Ba, Hg, Li, Mg, Mn, P and Zn.
Barium and Hg were the only elements with a statistically different concentration in the three producers. For Ba, a high concentration was found in the B producer (760 ± 56.6 ppb), followed by the C (418 ± 104 ppb) and A (129 ± 42.2 ppb) producers. Barium is a naturally occurring element found in the earth’s crust, and it can be detected in grapes and other agricultural products. While often present in trace amounts due to its ubiquity in the environment, Ba in grapes typically originates from the soil where the vines grow. Grapes, like many plants, absorb minerals and other elements from the soil through their roots, which can include barium [19,20].
Also, Hg, a toxic heavy metal, showed the same trend; indeed, it had the highest concentration in the B producer (0.784 ± 0.0969 ppb), followed by the C (0.5 ± 0.0644 ppb) and A (0.264 ± 0.0777 ppb) producers. As Ba can be absorbed by grapevine roots and accumulate in the fruits, its presence depends on atmospheric deposition from industrial emissions and the application of contaminated fertilizers or pesticides.
The winemaker with the most characteristic patterns was A. Indeed, samples from the A producer presented the lowest concentration of Mg, Mn, P and Zn. These elements are essential nutrients for grapes, playing significant roles both in the growth of grapevines and in the nutritional value of the grapes themselves. Furthermore, the concentration of these elements in grapes depends largely on the magnesium content of the soil in which the vines are cultivated.
Magnesium is a key component of chlorophyll and plays a crucial role in the photosynthesis process in grapevines. Adequate levels of Mg in the soil help ensure healthy vine development and optimal fruit production. For humans, consuming Mg-rich foods like grapes can contribute to various health benefits, including improved bone health, better cardiovascular function and enhanced metabolic processes [21,22].
Manganese is crucial for enzyme activation and plays a part in chlorophyll synthesis, which is essential for photosynthesis. This mineral also contributes to protecting plants against oxidative stress. For humans, Mn is important for bone development, metabolism and the regulation of blood sugar levels [23,24].
Phosphorus plays a pivotal role in various plant processes, including energy transfer, photosynthesis and nutrient movement within the vine. In grapes, P helps in the development of roots and the overall vigour of the vine, which can influence not only the health and sustainability of the vineyard but also the taste and nutritional quality of the grapes. Adequate P in the diet is also important for human health, contributing to bone strength and cellular repair [25,26,27].
Zinc plays a vital role in several key functions, including enzyme activity, protein synthesis and the regulation of growth hormones. Adequate Zn levels are necessary to maintain the structural integrity and health of plants, ensuring proper leaf development and resistance to disease. For humans, Zn is equally important; it supports immune function, DNA synthesis and cell division. Zn-rich foods like grapes help maintain a healthy immune system, promote wound healing and support normal growth [28,29].
Thus, the presence of these elements in grapes supports the vines’ vitality and offers nutritional advantages to consumers.
On the other hand, the B producer showed the highest concentration of Li. Lithium, although not commonly discussed as a nutrient in plant biology, can be present in trace amounts in grapes. Found naturally in many types of soil, Li concentrations in agricultural products depend largely on their levels in the environment where the plants are grown. In human nutrition, Li is known for its roles in neurological functions, often used in managing mood disorders such as bipolar disorder. Its presence in grapes, while typically very low, reflects the plant’s ability to absorb various elements from its surroundings. The exact impact of Li on grapevine health and grape quality is less understood and not as thoroughly researched as other minerals. However, the trace amounts found in grapes and other fruits are considered safe and non-toxic for human consumption. This minor presence adds to the complex matrix of nutrients and minerals contributing to the health benefits of consuming various fruits and vegetables [30,31,32].
Moreover, according to Commission Regulation (EU) 2023/915, the maximum level of Pb in fruit is 100 ppb and 50 ppb for Cd. All the samples analysed were under the legal limit. Cadmium and Pb in fruits can originate from various sources, posing significant health concerns due to their toxicity. These heavy metals can enter fruit crops through contaminated soil, as they are elements that can persist in the environment from past industrial activities, such as mining, smelting and using phosphate fertilisers. Water sources contaminated with these metals can also lead to their accumulation in fruits. Additionally, atmospheric deposition from industrial emissions can contaminate the surface of fruits or the soil in which they grow [33,34,35,36,37,38]. Therefore, the low concentration of the samples analysed indicates the high level of safety for human health. These findings reflect the good quality of the grapes used in the Montepulciano d’Abruzzo supply chain.
In addition, it is noteworthy that, to the best of our knowledge, this is the first time that a multi-element characterisation has been performed on Montepulciano d’Abruzzo grapes. For these reasons, it is impossible to compare our results with those in the literature. Furthermore, our results should be used as reference points for future Montepulciano d’Abruzzo PDO grape analyses.
3.2. Isotopic Analysis
Five isotopic ratios (208Pb/206Pb, 207Pb/206Pb, 206Pb/204Pb, 208Pb/207Pb and 87Sr/86Sr,) were determined in the grape samples. The results are reported in Table 4. Also, the results of the HSD Tukey test performed on data are reported in Table 4.
Table 4.
Isotopic ratios of grape samples. Samples connected by different letters in a row are statistically different by the HSD Tukey test.
In this case, producer A also showed the most characteristic pattern. Indeed, it shows a statistically different result from other producers for 208Pb/206Pb and 207Pb/206Pb.
Furthermore, a partial difference was also noted for 208Pb/207Pb and 87Sr/86Sr isotopic ratios. This denotes a peculiarity in the geographical origin of this producer. Isotopic ratios can be used to determine the geographical origin of foods. Strontium, for example, is present in the soil and is absorbed by plants; consequently, it passes through the food chain. Since the isotopic ratio of 87Sr/86Sr varies according to the geological composition of the region, analysing this ratio can indicate where specific foods, such as wines, cereals, fruits and vegetables, come from [39,40,41,42,43].
Moreover, to the best of our knowledge, this is the first time this kind of characterisation has been performed on the Montepulciano d’Abruzzo grapes. Therefore, these results should be used as a benchmark for further studies and to confirm the PDO grape provenience.
3.3. Chemometric Assessment
The analytical results of isotopes and elemental determination highlighted the specific markers for different winemakers, especially producer A. Various chemometric tools, such as Principal Component Analysis (PCA) and linear discriminant analysis (LDA), were applied to the data matrix to enhance characterisation.
Principal Component Analysis (PCA) was performed to highlight the natural grouping of samples. Autoscaling pre-treatment was carried out on the dataset to exclude the variance related to the different measurement units. The scores and loadings plot of the unsupervised PCA are reported in Figure 2.

Figure 2.
Principal Component Analysis for grape samples data. The scores plot is on the left, and the loading plot is on the right.
The first two PCs explained 64% of the total variance. It can be highlighted as an early grouping of samples. The samples from the A producer appeared clearly grouped in the left quadrants of the plots on PC1, while a partial grouping appeared for the other producers on PC2. It is possible to highlight the contribution of variables in the PC1 and PC2 (Figure 3). On PC1, the more influent variables (>0.8) were 208Pb/206Pb, Mg, Mn, S, P, 207Pb/206Pb, while on PC2, the only variable more influent was Ni.
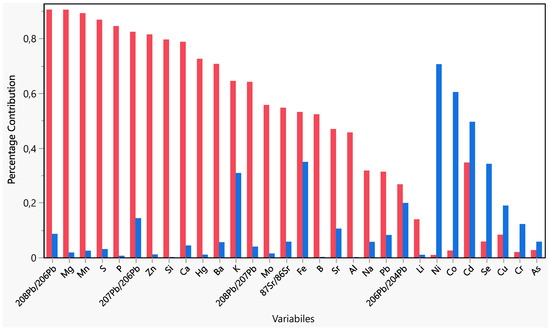
Figure 3.
Variables’ contribution on PC1 (red) and PC2 (blue).
Since it was impossible to identify specific variables that affected the grouping of samples based on the producer, a selection of variables was carried out. For this purpose, the selection was conducted by matching the results of the decisional trees method and the Tukey HSD test. The decisional trees method was reported as significant for the sample differentiation of the following variables: 207Pb/206Pb, 208Pb/207Pb, Cd, 87Sr/86Sr, 208Pb/206Pb, Mo, Cr, S, As, Li, Hg, Mg, Ba, Ni, Se, Ca, Mn, Al, B, Co, Cu, Fe, K, Na, P, Pb, 206Pb/204Pb, Si, Sr and Zn. The algorithm selected these variables as the minimum set to differentiate samples according to producers.
On the other hand, the variables with statistically different means between the producers were Ba, Hg, Li, Mg, Mn, P, Zn, 208Pb/206Pb and 207Pb/206Pb.
Therefore, the most informative variables for differentiating the samples were Li, Ba, Hg, Mn, Zn, 208Pb/206Pb and 207Pb/206Pb.
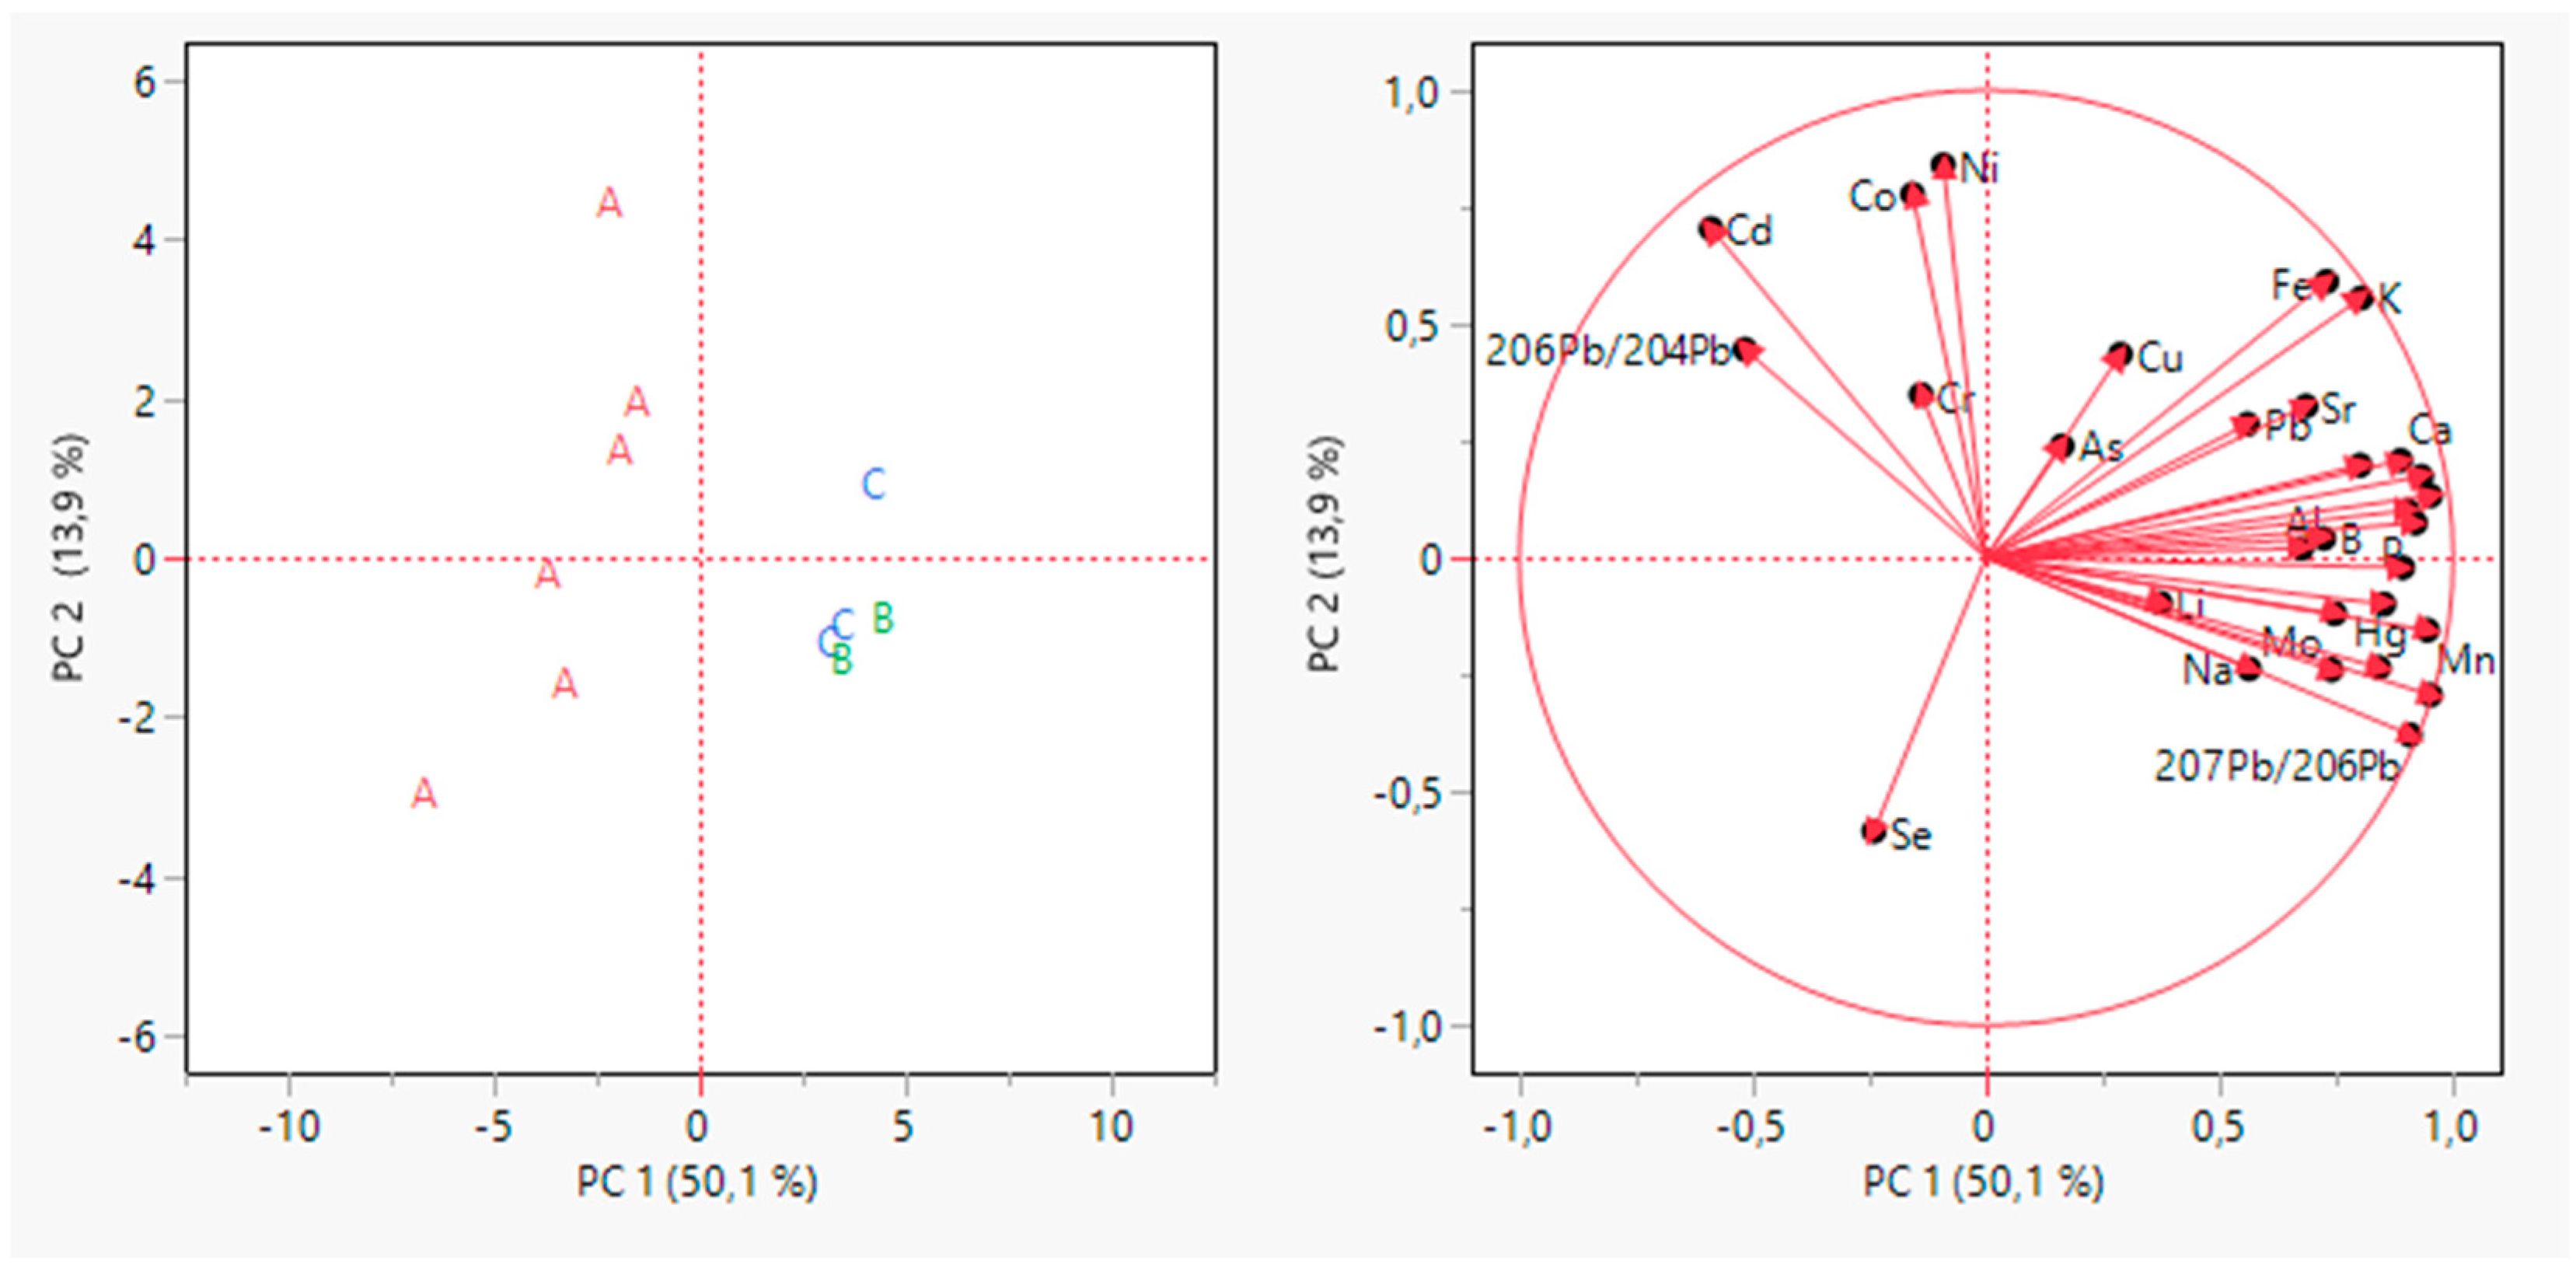
The PCA was carried out again but using only the selected variables. The results are provided in Figure 4.
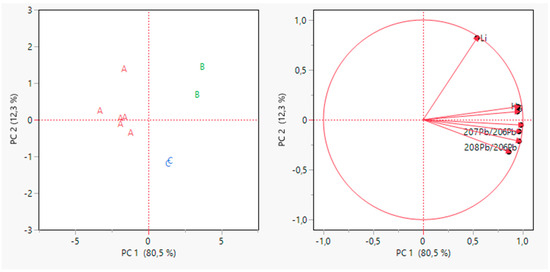
Figure 4.
PCA for grape samples data after variable selection. Scores plot on the left and loading plot on the right.
In this case, the first two PCs explained 92.8% of the total variance, with a gain of 28% compared to the previous PCA.
From Figure 4, it is possible to point out that the sample grouping in this case was better than the previous one. Indeed, all the producers appeared well separated from the others. Samples appeared well separated from the others on PC1. As reported in Table 5, almost all the variables contributed highly to PC1. The only variable that contributes less is Li, which instead contributes the majority to PC2.
Table 5.
Variable contribution on PC1 and PC2, after variable selection.
Once the natural grouping of samples was highlighted in PCA, the grape samples were used to explore the possibility of building a traceability tool for the different producers. Due to the small number of samples, the Linear Discriminant Analysis (LDA) and Quadratic Discriminant Analysis (QDA) were used as explorative classification methods. The Leave-One-Out method of validation was applied. Table 6 reports the correct classification rates of grape samples according to producers using the LDA and QDA classification methods.
Table 6.
Percentage of correct classification of grape samples according to producers by LDA and QDA classification methods.
The A and B producers achieved a success rate of 100%, which indicates that all samples were correctly classified. Producer C, however, showed a success rate of 33% in the QDA method, which means that some of their samples were incorrectly classified as coming from the B producer. Producers with a 100% performance rate have a clear competitive advantage and reliability in the market, being highly recognisable and different from others, which could translate into greater trust from customers or involved stakeholders.
However, it is essential to emphasise that these are preliminary data and that a larger sample would be needed to confirm these results.
4. Conclusions
This study provided a comprehensive analysis of Montepulciano d’Abruzzo grapes by assessing multi-elemental concentrations, isotopic ratios and chemometric techniques. The detailed characterization of these elements and isotopes within the Montepulciano d’Abruzzo PDO provides not only a deeper understanding of the geochemical imprint and environmental influences on grape quality but also establishes a vital reference for future studies aimed at safeguarding the authenticity and quality of these wines.
The multi-elemental analysis revealed the presence of both essential and potentially toxic elements within the grape samples. The results highlighted significant differences for Ba, Hg, Li, Mg, Mn, P and Zn concentrations among producers, possibly due to variations in soil composition, viticultural practices and environmental conditions. Notably, all samples remained below the harmful levels of toxic metals such as lead and cadmium, indicating adherence to safety standards and highlighting the health-conscious cultivation practices employed by the winemakers.
The isotopic analysis proved to be a crucial tool for verifying the geographical origin of the grapes, showcasing distinct signatures that reflect the unique terroir of the Abruzzo region. This aspect of the study is particularly significant for maintaining the integrity of the Montepulciano d’Abruzzo PDO, ensuring that consumers receive a product that is authentic and of the expected quality.
The chemometric assessment using PCA, LDA and QDA effectively utilised the identified significant variables, achieving a clear differentiation among the producers. This not only aids in the traceability and verification of the grape source but also enhances the robustness of quality assurance processes. The successful classification of producers via chemometric models underscores the potential of these techniques in ongoing quality control and fraud prevention within the viticulture industry.
The findings from this study are of immense value to grape growers, wine producers, regulators and consumers alike. For growers and producers, understanding their grapes’ elemental and isotopic composition can aid in refining cultivation practices and improving grape quality. Regulators will find the isotopic data particularly useful for PDO verification, helping to uphold market standards and protect geographical indications. Lastly, consumers benefit from the assurance of authenticity and safety of the Montepulciano d’Abruzzo wines, reinforcing trust in this renowned PDO product.
In conclusion, integrating elemental, isotopic and chemometric analyses presents a robust approach to understanding and enhancing the quality and safety of Montepulciano d’Abruzzo grapes. Future research should aim to expand the sample size and include additional vintages to validate these findings further and continue improving the precision of traceability systems in viticulture. This study sets a benchmark for future analyses and contributes significantly to the global scientific and regulatory framework that supports the global PDO wine industry.
Author Contributions
Conceptualisation, M.R., M.F. and M.E.C.; methodology, M.R. and M.E.C.; software, M.R. and M.F.; validation, M.R., M.F., I.R. and M.E.C.; formal analysis, M.R. and M.E.C.; investigation, M.R. and M.F.; resources, M.R. and M.F.; data curation, M.R., M.F. and I.R.; writing—original draft preparation, M.R.; writing—review and editing, M.R., M.F., I.R. and M.E.C.; supervision, M.E.C. All authors have read and agreed to the published version of the manuscript.
Funding
This research was funded by Sapienza University of Rome, grant “SEED PNR 2021”.
Institutional Review Board Statement
Not applicable.
Conflicts of Interest
Author Marco Ferrante was employed by the company Trace Technologies S.r.l. Author Ilia Rodushkin was employed by the company ALS Scandinavia AB. The remaining authors declare that the research was conducted in the absence of any commercial or financial relationships that could be construed as a potential conflict of interest.
References
- Feng, H.; Feng, J.; Tian, D.; Mu, W. Consumers’ Perceptions of Quality and Safety for Grape Products: A Case Study in Zhejiang Province, China. Br. Food J. 2012, 114, 1587–1598. [Google Scholar] [CrossRef]
- Reynolds, A.G. Managing Wine Quality: Viticulture and Wine Quality; Elsevier: Amsterdam, The Netherlands, 2010. [Google Scholar]
- Rubini, L.; Motta, L.; Di Tommaso, M.R. Quality-Based Excellence and Product-Country Image: Case Studies on Italy and China in the Beverage Sector. Meas. Bus. Excell. 2013, 17, 35–47. [Google Scholar] [CrossRef]
- Selma, M.V.; Luna, M.C.; Martínez-Sánchez, A.; Tudela, J.A.; Beltrán, D.; Baixauli, C.; Gil, M.I. Sensory Quality, Bioactive Constituents and Microbiological Quality of Green and Red Fresh-Cut Lettuces (Lactuca sativa L.) Are Influenced by Soil and Soilless Agricultural Production Systems. Postharvest Biol. Technol. 2012, 63, 16–24. [Google Scholar] [CrossRef]
- Christaki, T.; Tzia, C. Quality and Safety Assurance in Winemaking. Food Control 2002, 13, 503–517. [Google Scholar] [CrossRef]
- Battistelli, N.; Perpetuini, G.; Perla, C.; Arfelli, G.; Zulli, C.; Rossetti, A.P.; Tofalo, R. Characterization of Natural Oenococcus Oeni Strains for Montepulciano d’Abruzzo Organic Wine Production. Eur. Food Res. Technol. 2020, 246, 1031–1039. [Google Scholar] [CrossRef]
- Saranraj, P.; Sivasakthivelan, P.; Naveen, M. Fermentation of Fruit Wine and Its Quality Analysis: A Review. Aust. J. Sci. Technol. 2017, 1, 85–97. [Google Scholar]
- Suhaj, M.; Koreñovská, M. Application of Elemental Analysis for Identification of Wine Origin: A Review. Acta Aliment. 2005, 34, 393–401. [Google Scholar] [CrossRef]
- Gajek, M.; Pawlaczyk, A.; Szynkowska-Jozwik, M.I. Multi-Elemental Analysis of Wine Samples in Relation to Their Type, Origin, and Grape Variety. Molecules 2021, 26, 214. [Google Scholar] [CrossRef]
- Rocha, S.; Pinto, E.; Almeida, A.; Fernandes, E. Multi-Elemental Analysis as a Tool for Characterization and Differentiation of Portuguese Wines According to Their Protected Geographical Indication. Food Control 2019, 103, 27–35. [Google Scholar] [CrossRef]
- Pasvanka, K.; Kostakis, M.; Tarapoulouzi, M.; Nisianakis, P.; Thomaidis, N.S.; Proestos, C. Icp–Ms Analysis of Multi-Elemental Profile of Greek Wines and Their Classification According to Variety, Area and Year of Production. Separations 2021, 8, 119. [Google Scholar] [CrossRef]
- Guibourdenche, L.; Stevenson, R.; Pedneault, K.; Poirier, A.; Widory, D. Characterizing Nutrient Pathways in Quebec (Canada) Vineyards: Insight from Stable and Radiogenic Strontium Isotopes. Chem. Geol. 2020, 532, 119375. [Google Scholar] [CrossRef]
- Jacinto, J.; Jesus, J.G.; Damásio, M.; Silvestre, J.; Máguas, C.; Antunes, C. Phloem Carbon Isotopic Signature as a Valuable Tool to Assess Physiological Adjustments among European Grapevine Varieties under a Mediterranean Climate. Agric. Water Manag. 2023, 286, 108396. [Google Scholar] [CrossRef]
- Roullier-Gall, C.; Boutegrabet, L.; Gougeon, R.D.; Schmitt-Kopplin, P. A Grape and Wine Chemodiversity Comparison of Different Appellations in Burgundy: Vintage vs Terroir Effects. Food Chem. 2014, 152, 100–107. [Google Scholar] [CrossRef] [PubMed]
- Rapa, M.; Ferrante, M.; Rodushkin, I.; Paulukat, C.; Conti, M.E. Venetian Protected Designation of Origin Wines Traceability: Multi-Elemental, Isotopes and Chemometric Analysis. Food Chem. 2023, 404, 134771. [Google Scholar] [CrossRef] [PubMed]
- Rapa, M.; Ferrante, M.; Rodushkin, I.; Paulukat, C.; Conti, M.E. Heavy Metals, Rare Earth Elements and Isotopic Fingerprint of Venetian Protected Designation of Origin Sparkling Wines. Br. Food J. 2023, 125, 2644–2662. [Google Scholar] [CrossRef]
- Rapa, M.; Giannetti, V.; Boccacci Mariani, M. Characterization of Polyphenols in a Sicilian Autochthonous White Grape Variety (PDO) for Monitoring Production Process and Shelf-Life of Wines. Agriculture 2022, 12, 1888. [Google Scholar] [CrossRef]
- Rodushkin, I.; Engström, E.; Baxter, D.C. Sources of Contamination and Remedial Strategies in the Multi-Elemental Trace Analysis Laboratory. Anal. Bioanal. Chem. 2010, 396, 365–377. [Google Scholar] [CrossRef] [PubMed]
- Bowen, H.J.M.; Dymond, J.A. Strontium and Barium in Plants and Soils. Proc. R. Soc. Lond. B Biol. Sci. 1955, 144, 355–368. [Google Scholar] [CrossRef]
- Sleimi, N.; Kouki, R.; Hadj Ammar, M.; Ferreira, R.; Pérez-Clemente, R. Barium Effect on Germination, Plant Growth, and Antioxidant Enzymes in Cucumis Sativus L. Plants. Food Sci. Nutr. 2021, 9, 2086–2094. [Google Scholar] [CrossRef]
- Yan, B.; Hou, Y. Effect of Soil Magnesium on Plants: A Review. In Proceedings of the IOP Conference Series: Earth and Environmental Science; IOP Publishing: Bristol, UK, 2018; Volume 170. [Google Scholar]
- Ferreira, L.d.S.; Oliveira, V.d.S.; Marchiori, J.J.d.P.; Ferreira, T.C.; Bernabé, A.C.B.; Boone, G.T.F.; Pereira, L.L.d.S.; Carriço, E. The Nutrient Magnesium in Soil and Plant: A Review. Int. J. Plant Soil. Sci. 2023, 35, 136–144. [Google Scholar] [CrossRef]
- Schmidt, S.B.; Husted, S. The Biochemical Properties of Manganese in Plants. Plants 2019, 8, 381. [Google Scholar] [CrossRef]
- Alejandro, S.; Höller, S.; Meier, B.; Peiter, E. Manganese in Plants: From Acquisition to Subcellular Allocation. Front. Plant Sci. 2020, 11, 517877. [Google Scholar] [CrossRef] [PubMed]
- Cui, E.; Lu, R.; Xu, X.; Sun, H.; Qiao, Y.; Ping, J.; Qiu, S.; Lin, Y.; Bao, J.; Yong, Y.; et al. Soil Phosphorus Drives Plant Trait Variations in a Mature Subtropical Forest. Glob. Chang. Biol. 2022, 28, 3310–3320. [Google Scholar] [CrossRef]
- Lambers, H. Phosphorus Acquisition and Utilization in Plants. Annu. Rev. Plant Biol. 2022, 73, 17–42. [Google Scholar] [CrossRef] [PubMed]
- Chan, C.; Liao, Y.Y.; Chiou, T.J. The Impact of Phosphorus on Plant Immunity. Plant Cell Physiol. 2021, 62, 582–589. [Google Scholar] [CrossRef]
- Stanton, C.; Sanders, D.; Krämer, U.; Podar, D. Zinc in Plants: Integrating Homeostasis and Biofortification. Mol. Plant 2022, 15, 65–85. [Google Scholar] [CrossRef]
- Balafrej, H.; Bogusz, D.; Abidine Triqui, Z.E.; Guedira, A.; Bendaou, N.; Smouni, A.; Fahr, M. Zinc Hyperaccumulation in Plants: A Review. Plants 2020, 9, 562. [Google Scholar] [CrossRef] [PubMed]
- Gayathri, N.; Sailesh, A.R.; Srinivas, N. Effect of Lithium on Seed Germination and Plant Growth of Amaranthus Viridis. J. Appl. Nat. Sci. 2022, 14, 133–139. [Google Scholar] [CrossRef]
- Tanveer, M.; Hasanuzzaman, M.; Wang, L. Lithium in Environment and Potential Targets to Reduce Lithium Toxicity in Plants. J. Plant Growth Regul. 2019, 38, 1574–1586. [Google Scholar] [CrossRef]
- Shahzad, B.; Tanveer, M.; Hassan, W.; Shah, A.N.; Anjum, S.A.; Cheema, S.A.; Ali, I. Lithium Toxicity in Plants: Reasons, Mechanisms and Remediation Possibilities—A Review. Plant Physiol. Biochem. 2016, 107, 104–115. [Google Scholar] [CrossRef]
- Benavides, M.P.; Gallego, S.M.; Tomaro, M.L. Cadmium Toxicity in Plants. Braz. J. Plant Physiol. 2005, 17, 21–34. [Google Scholar] [CrossRef]
- Das, P.; Samantaray, S.; Rout, G.R. Studies on Cadmium Toxicity in Plants: A Review. Environ. Pollut. 1997, 98, 29–36. [Google Scholar] [CrossRef] [PubMed]
- Bothe, H.; Słomka, A. Divergent Biology of Facultative Heavy Metal Plants. J. Plant Physiol. 2017, 219, 45–61. [Google Scholar] [CrossRef] [PubMed]
- Guo, Z.; Gao, Y.; Yuan, X.; Yuan, M.; Huang, L.; Wang, S.; Liu, C.; Duan, C. Effects of Heavy Metals on Stomata in Plants: A Review. Int. J. Mol. Sci. 2023, 24, 9302. [Google Scholar] [CrossRef] [PubMed]
- Asati, A.; Pichhode, M.; Nikhil, K. Effect of Heavy Metals on Plants. Int. J. Appl. Innov. Eng. Manag. 2016, 5, 56–66. [Google Scholar] [CrossRef]
- Naharro, R.; Esbrí, J.M.; Amorós, J.Á.; García-Navarro, F.J.; Higueras, P. Assessment of Mercury Uptake Routes at the Soil-Plant-Atmosphere Interface. Geochem. Explor. Environ. Anal. 2018, 19, 146–154. [Google Scholar] [CrossRef]
- Hiraoka, H.; Morita, S.; Izawa, A.; Aoyama, K.; Shin, K.C.; Nakano, T. Tracing the Geographical Origin of Onions by Strontium Isotope Ratio and Strontium Content. Anal. Sci. 2016, 32, 781–788. [Google Scholar] [CrossRef] [PubMed]
- Lancellotti, L.; Sighinolfi, S.; Ulrici, A.; Maletti, L.; Durante, C.; Marchetti, A.; Tassi, L. Tracing Geographical Origin of Lambrusco PDO Wines Using Isotope Ratios of Oxygen, Boron, Strontium, Lead and Their Elemental Concentration. Curr. Res. Food Sci. 2021, 4, 807–814. [Google Scholar] [CrossRef]
- Epova, E.N.; Bérail, S.; Séby, F.; Vacchina, V.; Bareille, G.; Médina, B.; Sarthou, L.; Donard, O.F.X. Strontium Elemental and Isotopic Signatures of Bordeaux Wines for Authenticity and Geographical Origin Assessment. Food Chem. 2019, 294, 35–45. [Google Scholar] [CrossRef]
- Janin, M.; Medini, S.; Técher, I. Methods for PDO Olive Oils Traceability: State of Art and Discussion about the Possible Contribution of Strontium Isotopic Tool. Eur. Food Res. Technol. 2014, 239, 745–754. [Google Scholar] [CrossRef]
- Almeida, C.M.; Vasconcelos, M.T.S.D. ICP-MS Determination of Strontium Isotope Ratio in Wine in Order to Be Used as a Fingerprint of Its Regional Origin. J. Anal. Spectrom. 2001, 16, 607–611. [Google Scholar] [CrossRef]


Disclaimer/Publisher’s Note: The statements, opinions and data contained in all publications are solely those of the individual author(s) and contributor(s) and not of MDPI and/or the editor(s). MDPI and/or the editor(s) disclaim responsibility for any injury to people or property resulting from any ideas, methods, instructions or products referred to in the content. |
© 2024 by the authors. Licensee MDPI, Basel, Switzerland. This article is an open access article distributed under the terms and conditions of the Creative Commons Attribution (CC BY) license (https://creativecommons.org/licenses/by/4.0/).