Article

Suppression of Plastidial Glucan Phosphorylase (PHO1) Increases Drought Tolerance in Potato (Solanum tuberosum L.)

1
Department of Biochemistry and Microbiology, Warsaw University of Life Sciences—SGGW, Nowoursynowska 159, 02-776 Warsaw, Poland
2
Biopolymer Analytics, Institute of Biochemistry and Biology, University of Potsdam, Karl-Liebknecht-Str. 24-25, 14476 Potsdam-Golm, Germany
*
Author to whom correspondence should be addressed.
Agriculture 2024, 14(9), 1491; https://doi.org/10.3390/agriculture14091491 (registering DOI)
Submission received: 9 July 2024 / Revised: 20 August 2024 / Accepted: 22 August 2024 / Published: 1 September 2024
(This article belongs to the Section Crop Genetics, Genomics and Breeding)

Abstract

:
Glucan phosphorylase is present in plants in two isozymes, namely, a plastidial isoform (PHO1) and a cytosolic isoform (PHO2), and is involved in starch-related carbohydrate metabolism. The aim of this study was to determine whether mutations in the genes encoding glucan phosphorylase caused these plants to have increased resistance to short-term drought. One of the strategies plants use to defend themselves against drought stress is to change their starch content, which may be due to changes in glucan phosphorylase activity. In our greenhouse pot experiment, we used potato leaves from wild-type plants and transgenic mutant lines with reduced expression of genes encoding both PHO isozymes. The plants were exposed to drought or were grown under optimal conditions. A lack of water strongly affected the water saturation deficit (WSD) and leaf protein content. The activity of the plastidial glucan phosphorylase isoform (PHO1) in mutant plants increased under drought stress, in contrast to its activity in wild-type plants. After analyzing several physiological parameters, we found that suppressed expression of the gene encoding one of the subunits of plastidial glucan phosphorylase, PHO1a, resulted in increased tolerance to drought in potatoes.

1. Introduction

Most plants synthesize and degrade starch in a manner that depends on many internal and external factors. Starch is a carbon and energy reserve in the plant. Therefore, the regulation of starch metabolism under the influence of abiotic stress, when the assimilation of carbon is difficult, plays an important role. Abiotic stress factors such as water deficiency, salinity, and extreme temperature can influence starch metabolism in different ways [1]. Some stress factors can disrupt plant growth, leading to reduced utilization of sugars and an excessive increase in their concentration in the plant tissue [2,3,4]. The intensity of starch synthesis is then increased, allowing the utilization of excess carbohydrates [5,6,7]. Excessive levels of soluble sugars can inhibit photosynthesis and lead to accelerated senescence; therefore, the conversion of soluble sugars to starch has a positive effect by promoting ongoing photosynthesis [8,9]. However, when there is a carbon deficiency in plants, starch can serve as a carbon source by intensifying the degradation process. This situation occurs when abiotic stress limits photosynthesis, leading to a decreased concentration of soluble sugars and a carbon deficiency [10]. Increased starch degradation leads to higher amounts of mono- and disaccharides and their various derivatives, which may play a role in stress tolerance [2,3,11]. The sugars released from starch can also act as signaling molecules in signal transduction pathways or as osmoprotectants, and they can neutralize reactive oxygen species [12,13]. Maltose and glucose are also very efficient respiratory substrates that are required for the biosynthesis of proteins and protective compounds, especially when the photosynthetic process is inhibited under the influence of stress [14,15,16].
Numerous studies have shown that abiotic stress can cause both increased and decreased starch content in plants [2,3,6,17,18,19]. Decreased content can be the result of reduced synthesis or intensified degradation of starch [10]. Reduced starch synthesis in plants under drought stress has been documented in species such as potato and spinach [20,21]. Barley has shown a similar response, with decreased starch and sucrose content, suggesting that sucrose hydrolysis provides sugars for osmoprotection [22]. High temperature also reduces the synthesis of starch and decreases its content in cereals such as barley, wheat, maize, and rice [23]. In Arabidopsis thaliana leaves and cucumber cotyledons, starch content was decreased due to its enhanced degradation under drought [24,25]. In contrast, cold stress increased starch degradation in rice mutants and transgenic tobacco [5,26]. However, the results regarding changes in starch metabolism in response to stress are inconclusive.
For example, increased activity of starch biosynthesis pathway enzymes and consequent starch accumulation were observed in wheat and rice under conditions of slight water deficit [27,28]. Increased starch content can play a role in salinity tolerance, which has been shown in the halophyte Thellungiella halophila [29], rice [30], and tomato [31], among other species. Cold stress can also lead to greater starch accumulation [5,6]. Quinoa cotyledons showed a transient increase in starch content in response to cold for 2 days, but after 6 days of cold exposure, the amount of starch decreased [8]. It may be possible to conclude that short-term or mild stress increases starch content, as observed in quinoa, wheat, and rice under mild water deficit [27,28]. It is possible that this is an early phase of the response to stress, in which plants accelerate carbon storage by intensifying starch synthesis to be prepared for its subsequent use in the event of increased intensity or prolongation of the stress [10]. In addition, starch can act as an ion trap. It has been observed that in reeds exposed to high concentrations of harmful ions, the ions are trapped inside the starch. This prevents the ions from spreading throughout the plant and producing systemic effects [32,33].
Abiotic stress can also affect enzymes involved in the synthesis and degradation of starch. Studies on the involvement of glucan phosphorylase in the starch metabolism of Arabidopsis thaliana (named PHS in Arabidopsis) under stress conditions (water or salt stress) indicate that it contributes to increased tolerance to abiotic stress [34]. Based on the research results, it was found that silencing the gene encoding the plastid isoform did not result in significant changes in starch accumulation during the day or starch degradation at night, while mutants lacking the plastidial isoform were more sensitive to water deficiency and salt stress [34]. This may be due to the fact that starch degradation involving glucan phosphorylase provides substrates for respiratory processes in the chloroplasts, further suggesting that starch phosphorolysis plays an important role in tolerance to abiotic stress and rapid response to environmental changes [34]. In turn, β-amylases, which play important roles in starch degradation in leaves, are involved in the response to temperature stress [5,35]. Studies of Arabidopsis thaliana showed that temperature shock increased the expression of isoenzymes encoding two β-amylases, BMY8 (at low temperatures) and BMY7 (at high temperatures) [5]. An increase in β-amylases means an intensification of the process of hydrolytic starch degradation. This leads to an accumulation of maltose, the product of β-amylase hydrolysis, in the chloroplasts, which presumably has a protective effect on stromal and thylakoid membrane proteins involved in the photosynthetic electron transport chain [5].
Transgenic Solanum tuberosum L. lines with reduced PHO expression have already been described in other studies. The influence of such a mutation on changes in the structure of storage starch during growth at low temperatures was investigated in lines with reduced PHO1 activity. Wild-type potato plants and transgenic plants with reduced expression of PHO1a and PHO1b were used for the experiment. The starch content, size, and internal structure of isolated starch granules from control plants and plants grown at reduced temperatures were analyzed. No significant changes in starch content or grain size were observed. However, it was found that starch granules from wild-type plants contained more short glucan chains in their structure than did those from control plants during growth at low temperatures. Transgenic lines with silenced PHO1 did not show this effect; thus, it was concluded that the PHO1 in wild-type plants is involved in forming short glucan chains at low temperatures [36]. Mutants of potato plants with reduced expression of glucan phosphorylase were also used in studies on the uptake of glucose-1-phosphate by tubers. PHO1 has been shown to be involved in the active uptake of glucose-1-phosphate into tuber parenchyma cells and its incorporation into starch granules. In lines in which PHO1 activity was strongly reduced, the conversion of glucose-1-phosphate into starch was found to be slower than in wild-type plants, and the pathway was largely inhibited. In line with reduced PHO2 activity, no changes were observed in the rate of this process compared to the wild type [37,38]. Similar studies of potato tubers were conducted to evaluate the effects of reduced expression of both PHO isoforms on the conversion of glucose-1-phosphate to soluble maltodextrins. It was found that mutant plants with silenced PHO1 exhibited impaired glucose-1-phosphate uptake and reduced production of malto-oligosaccharides. This confirmed the important role of PHO1 in processes related to glucose-1-phosphate utilization in starch metabolism [39]. In addition, lines with silenced PHO1 and PHO2 activity were used for proteomic studies aimed at characterizing proteins interacting with starch in potato tubers under various temperature conditions [40].
This study analyzed the enzymatic activity of glucan phosphorylase, not the expression level of the genes encoding the two isoforms of the enzyme at the transcriptional stage. This is because the transcriptional changes do not necessarily result in the same changes in protein expression or in overall activity. Therefore, the test presented in this paper examined proteins present in the cell as active and functional molecules.

2. Materials and Methods

2.1. Plant Materials and Stress Conditions

The research material used in this work consisted of leaves from potato plants (Solanum tuberosum L.) from three lines: the UP1 line, with suppressed expression of the gene encoding PHO1a; the UP13 line, with suppressed expression of the gene encoding PHO2; and a corresponding wild type of the plant (WT) (see also [25,26,27,28,29]).
The plants were grown in a greenhouse in 3 L pots with universal commercial garden substrate and watered twice weekly during 2002–2023. At 5 weeks, before flowering began, plants were subjected to drought stress, and after 3 days, the first leaf collection took place (Figure 1). During the experiment, the following conditions prevailed in the greenhouse: an additional 16 h of illumination (200 µmol photons/m2 s) and a temperature of 22 °C during the day and 15 °C at night, with 50% relative humidity. Within each of the 3 potato lines tested, 6 to 8 plants were divided into control and stress groups. In the experiment, some plants (the stress group) were subjected to drought stress, i.e., irrigation was stopped. Then, medium-sized leaf samples were collected from both stress and control plants at 3-day intervals for 12 days, including leaf collection 3 days after irrigation (“recovery”). The samples were taken at the same time on each collection day in the middle of the light phase. All collected samples were frozen in liquid nitrogen and then stored at –80 ℃ until further analysis.

2.2. Determination of Chlorophyll Content

The chlorophyll content in the leaves of living plants was measured using a non-invasive method with a SPAD-502Plus chlorophyll meter from Konica Minolta. Chlorophyll content was measured in randomly selected leaves of plants from both groups, control and stress, within all 3 lines on each day of sampling. These leaves were then cut from the plants, weighed, and frozen in liquid nitrogen for further analysis. The results of the replicates performed for each experiment are presented in the form of arithmetic averages. The average measurement error, expressed as a percentage, was taken into account.

2.3. Determination of Water Saturation Deficit (WSD)

WSD was determined according to the method described by Hummel and co-authors, with modifications [2]. Measurements were performed on 2 randomly selected leaves collected on each harvest day from plants in both the control and stress groups within each line.

2.4. Acquisition of Enzyme Extracts

The plant material was ground in a mortar on ice with extraction buffer 50 mM Hepes pH 7.5, 10% (w/v) glycerol, 1 mM phenylmethylsulfonyl fluoride (PMSF), 2 mM EDTA (ethylenediaminetetraacetic acid). Each sample was triturated in 2 replicates with buffer. For this purpose, a sample weighing approximately 0.1 g was measured and placed in a mortar, and 0.3 mL extraction buffer was added. The homogenate was transferred to an Eppendorf tube and centrifuged (4 °C, 20 min, 15,000 rpm). After centrifugation, the sediment was discarded, and the protein content of the supernatant was determined and used to determine the activity of glucan phosphorylase in polyacrylamide gels.

2.5. Determination of Protein Content

The total soluble protein content was determined using the Bradford method [41] with BSA as the standard.

2.6. Separation of Proteins by Electrophoresis under Nondenaturing Conditions

The method described by Orzechowski and co-authors was used to separate proteins under nondenaturing conditions [42].

2.7. Glucan Phosphorylase Zymography and Determination of Intensity of PHO Activity

Glucan phosphorylase staining was performed as described by Fettke et al. [43]. The obtained images of PAGE gels were subjected to densitometric analysis. The band intensity was quantified from the image scans of the PAGE gels using ImageJ software (Java v. 13.0.6 (64-bit, https://imagej.net/ij/index.html), National Institutes of Health, Bethesda, MD, USA). The intensity of the bands was expressed as a percentage relative to the individual activity in the control samples.

2.8. Determination of Hydrogen Peroxide (H2O2) Content

To obtain extracts for determining H2O2 content, previously crushed plant material was ground in a mortar on ice with 0.01 M phosphate buffer (pH 5.8) and 0.1% (v/v) trichloroacetic acid (TCA). Each sample was triturated in duplicate with buffer and TCA. For this purpose, a 0.1 g sample was weighed and placed in a mortar on ice, and 0.75 mL TCA 0.1% (v/v) and 0.75 mL phosphate buffer (0.01 M, pH 5.8) were added. After trituration, the homogenate was transferred to an Eppendorf tube and centrifuged (4 °C, 20 min, 15,000 rpm). After centrifugation, the sediment was discarded, and the supernatant was transferred to a new Eppendorf tube. H2O2 determination was performed in 3 replicates for each extract obtained using the method described by Junglee and co-authors, with modifications [44]. For this purpose, 100 μL of the supernatant was transferred to a new Eppendorf tube and further modified by adding 200 μL of 0.1% (v/v) TCA and 200 μL of phosphate buffer (0.01 M, pH 5.8) and then 500 μL of 1 M KI. All samples were incubated in a thermomixer in the dark (25 °C, 20 min). Then, the samples were centrifuged (4 °C, 5 min, 15,000 rpm), and the absorbance was measured at a wavelength of 350 nm. As a blank, 250 μL of 0.1% (v/v) TCA, 250 μL of phosphate buffer (0.01 M, pH 5.8), and 500 μL of 1 M KI were combined. The blank sample was incubated and centrifuged under the same conditions as the leaf extract samples. H2O2 determination was performed using a spectrophotometer (Merck Spectroquant Pharo 300) within 2 h of obtaining the extract. The arithmetic mean values and mean measurement errors were calculated as percentages from the results of individual replicates.

2.9. Sample Preparation and Carbohydrate Analysis

For starch and soluble sugar analysis, 50 mg powdered leaf samples were used. The homogenized leaf samples were washed with 1 mL of ethanol twice and incubated for 15 min at 80 °C. A 2 mL volume of ethanolic extract was recovered, dried, and used for soluble sugars (glucose, fructose, and sucrose), while starch pellets were washed, dried in a SpeedVac, and stored for starch content estimation. The dried residues of soluble sugars were resuspended in 0.5 mL of water and centrifuged. The soluble sugars were measured enzymatically as described in [45] and by Jones et al. [46]. The glucose, fructose, and sucrose were analyzed in the presence of phosphate-6-dehydrogenase by adding 3 µL hexokinase, phosphoglucose isomerase, and invertase, respectively. The reaction mixture, with a total volume of 1 mL, consisted of 200 mM imidazole/HCl (pH 6.9), 3 mM MgCl2, 1.1 mM ATP, 2.5 mM NADP, 1.7 U G6P-DH, and 20 µL of soluble sugar extract. Quantification was accomplished using a spectrophotometer; with the addition of each enzyme, the absorbance change at 340 nm was assessed. Starch content was quantified according to Malinova [47] by resuspending the dried starch pellets in 0.2 M KOH and boiling at 80 °C for 1 h in a thermomixer, then neutralizing the starch by adding 88 µL of 1 M acetic acid; 50 µL of the sample was solubilized and hydrolyzed with 50 µL of amyloglucosidase (1 unit). The starch samples were quantified by measuring the absorbance at 340 nm after adding hexokinase.

2.10. Starch Extraction and Morphology Analysis by Scanning Electron Microscope (SEM)

Starch isolation and SEM analysis were performed according to Malinova [48]. Leaves of wild-type potato and the mutant lines UP1 (PHO1a) and UP13 (PHO2) were collected and ground into a fine powder with a mortar and pestle using liquid nitrogen. The powdered leaf material was further suspended in 50 mL of starch extraction buffer comprising 20 mM HEPES-KOH (pH 7.4), 0.4 mM EDTA, and 0.05% (v/v) Triton X-100. The filtrate was then passed through Miracloth (475855-1R, Millipore Sigma, Darmstadt, Germany), followed by centrifugation at 1500× g for 10 min at 4 °C. After centrifugation, the supernatant was discarded, and the sediments were resuspended in 35 mL of starch extraction buffer. The filtrate was vortexed, passed through 25 µm and 100 µm meshes, and again centrifuged as described above. The resulting starch sediments were resuspended in 0.5 mL of starch extraction buffer, then gently pipetted over 5 mL of Percoll solution (17-0891-01, GE Healthcare, Chicago, IL, USA) ) poured into a 15 mL Falcon tube and centrifuged at 2000× g for 15 min at 4 °C. The supernatant was discarded, and the starch was recovered, washed 6 times, and dried in a SpeedVac.
For scanning electron microscopy, dried starch granules were scattered on the sticky tabs positioned on top of the SEM stubs. The data were collected using a 2SE lens and 1 kV beam in a Zeiss Ultra Plus SEM (Zeiss, Oberkochen, Germany). The diameter of the starch granules (1.54 d) was analyzed using ImageJ.

2.11. Laser Confocal Scanning Microscope (LCSM) Analysis

Potato leaves of similar age were collected and submerged in safranin O solution (5 g/L) overnight. The number of starch granules per chloroplast was visualized using a Zeiss LSM 880 Air Scan confocal microscope (Zeiss, Oberkochen, Germany) as described by Liu et al. [49]. The pictures were analyzed using ZEN Lite 3.8 software (https://www.zeiss.com/microscopy/en/products/software/zeiss-zen-lite.html).

2.12. Statistical Analyses

A comparison of the arithmetic means between leaf samples in the control and stress groups collected each day was performed using the unpaired Student’s t-test (GraphPad, GraphPad Software, La Jolla, California, USA, https://www.graphpad.com/quickcalcs/ttest1.cfm). ANOVA (Microsoft Excel, version 16.78, Microsoft Corporation, Redmond, DC, USA) was used to analyze the changes during the experiment. Differences with p ≤ 0.05 were considered statistically significant. The detailed results of the individual statistical analyses can be found in the Supplementary Data.

3. Results

3.1. Potato Plants with Repressed PHO Had Reduced Leaf Starch Content and Fewer Starch Granules per Chloroplast

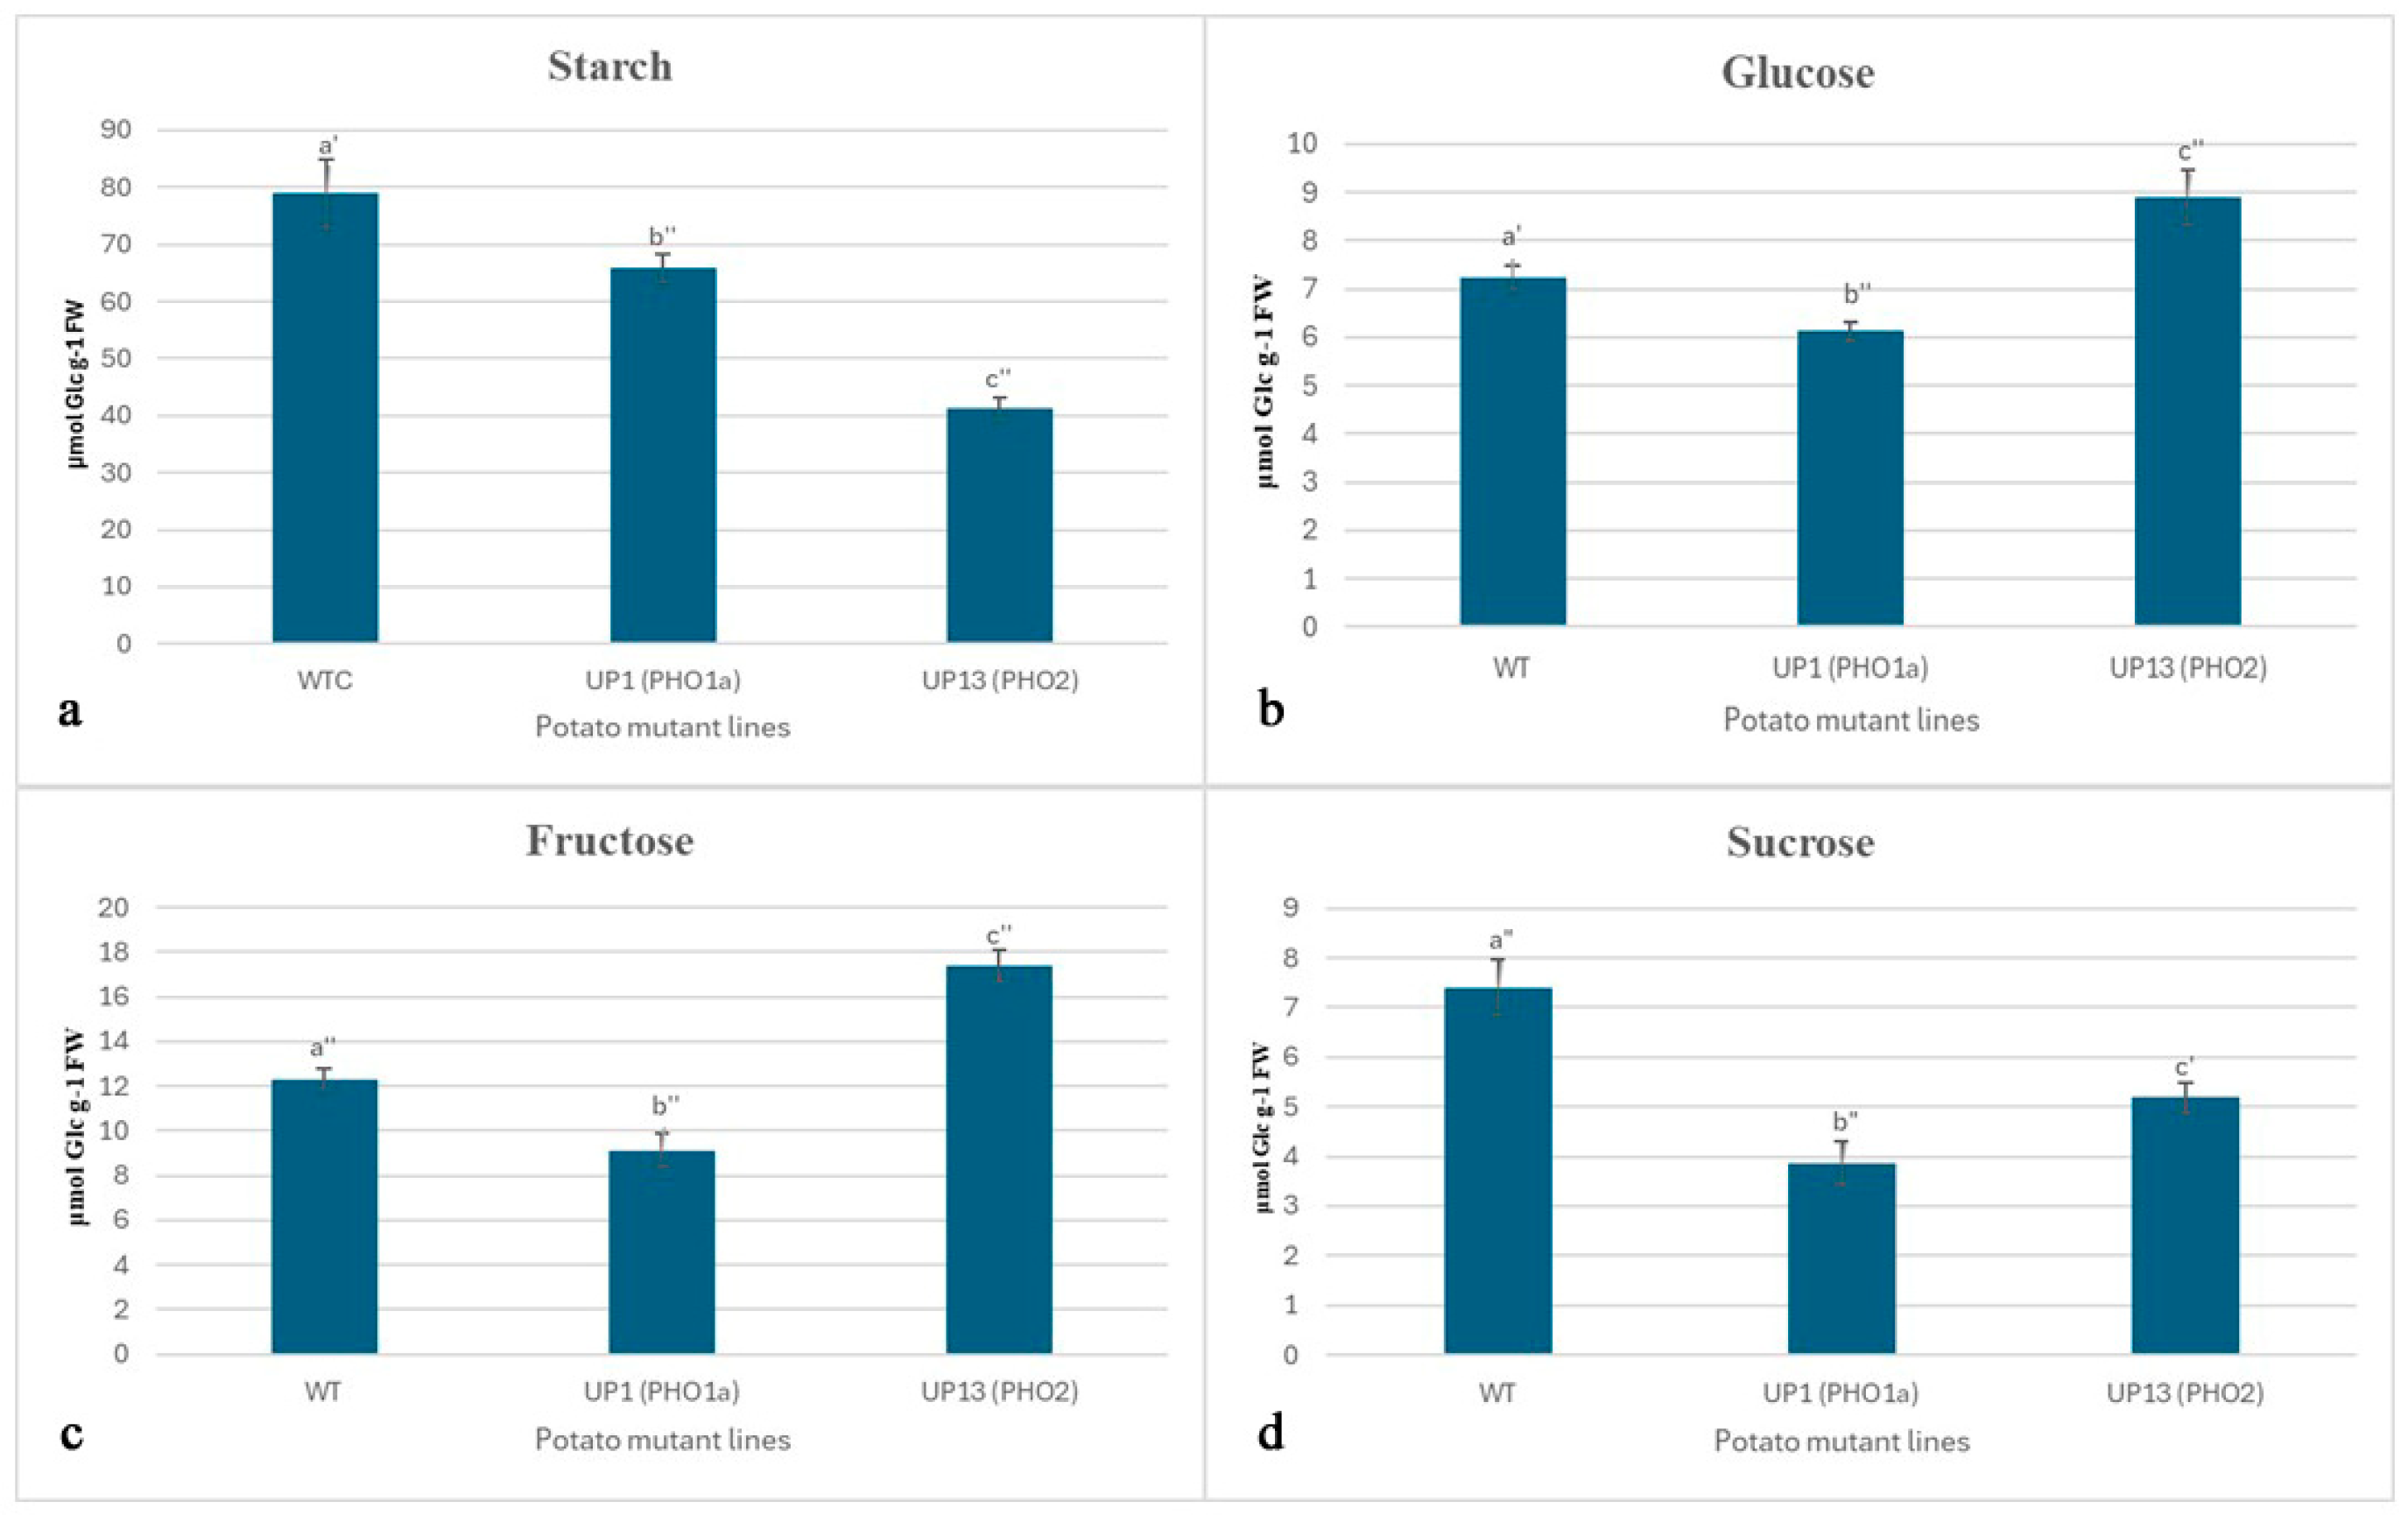
The potato lines used in this study were characterized for carbohydrate and starch metabolism. Therefore, the contents of starch and soluble sugar were determined (Figure 2).
Both mutant lines were found to have decreased starch content. However, the reduction was more pronounced in UP13, which had approximately 50% of the content of the corresponding wild type. Repression of PHO1 (UP1) further reduced glucose, fructose, and sucrose content. In contrast, repression of PHO2 (UP13) resulted in increased glucose and fructose content but reduced sucrose content.
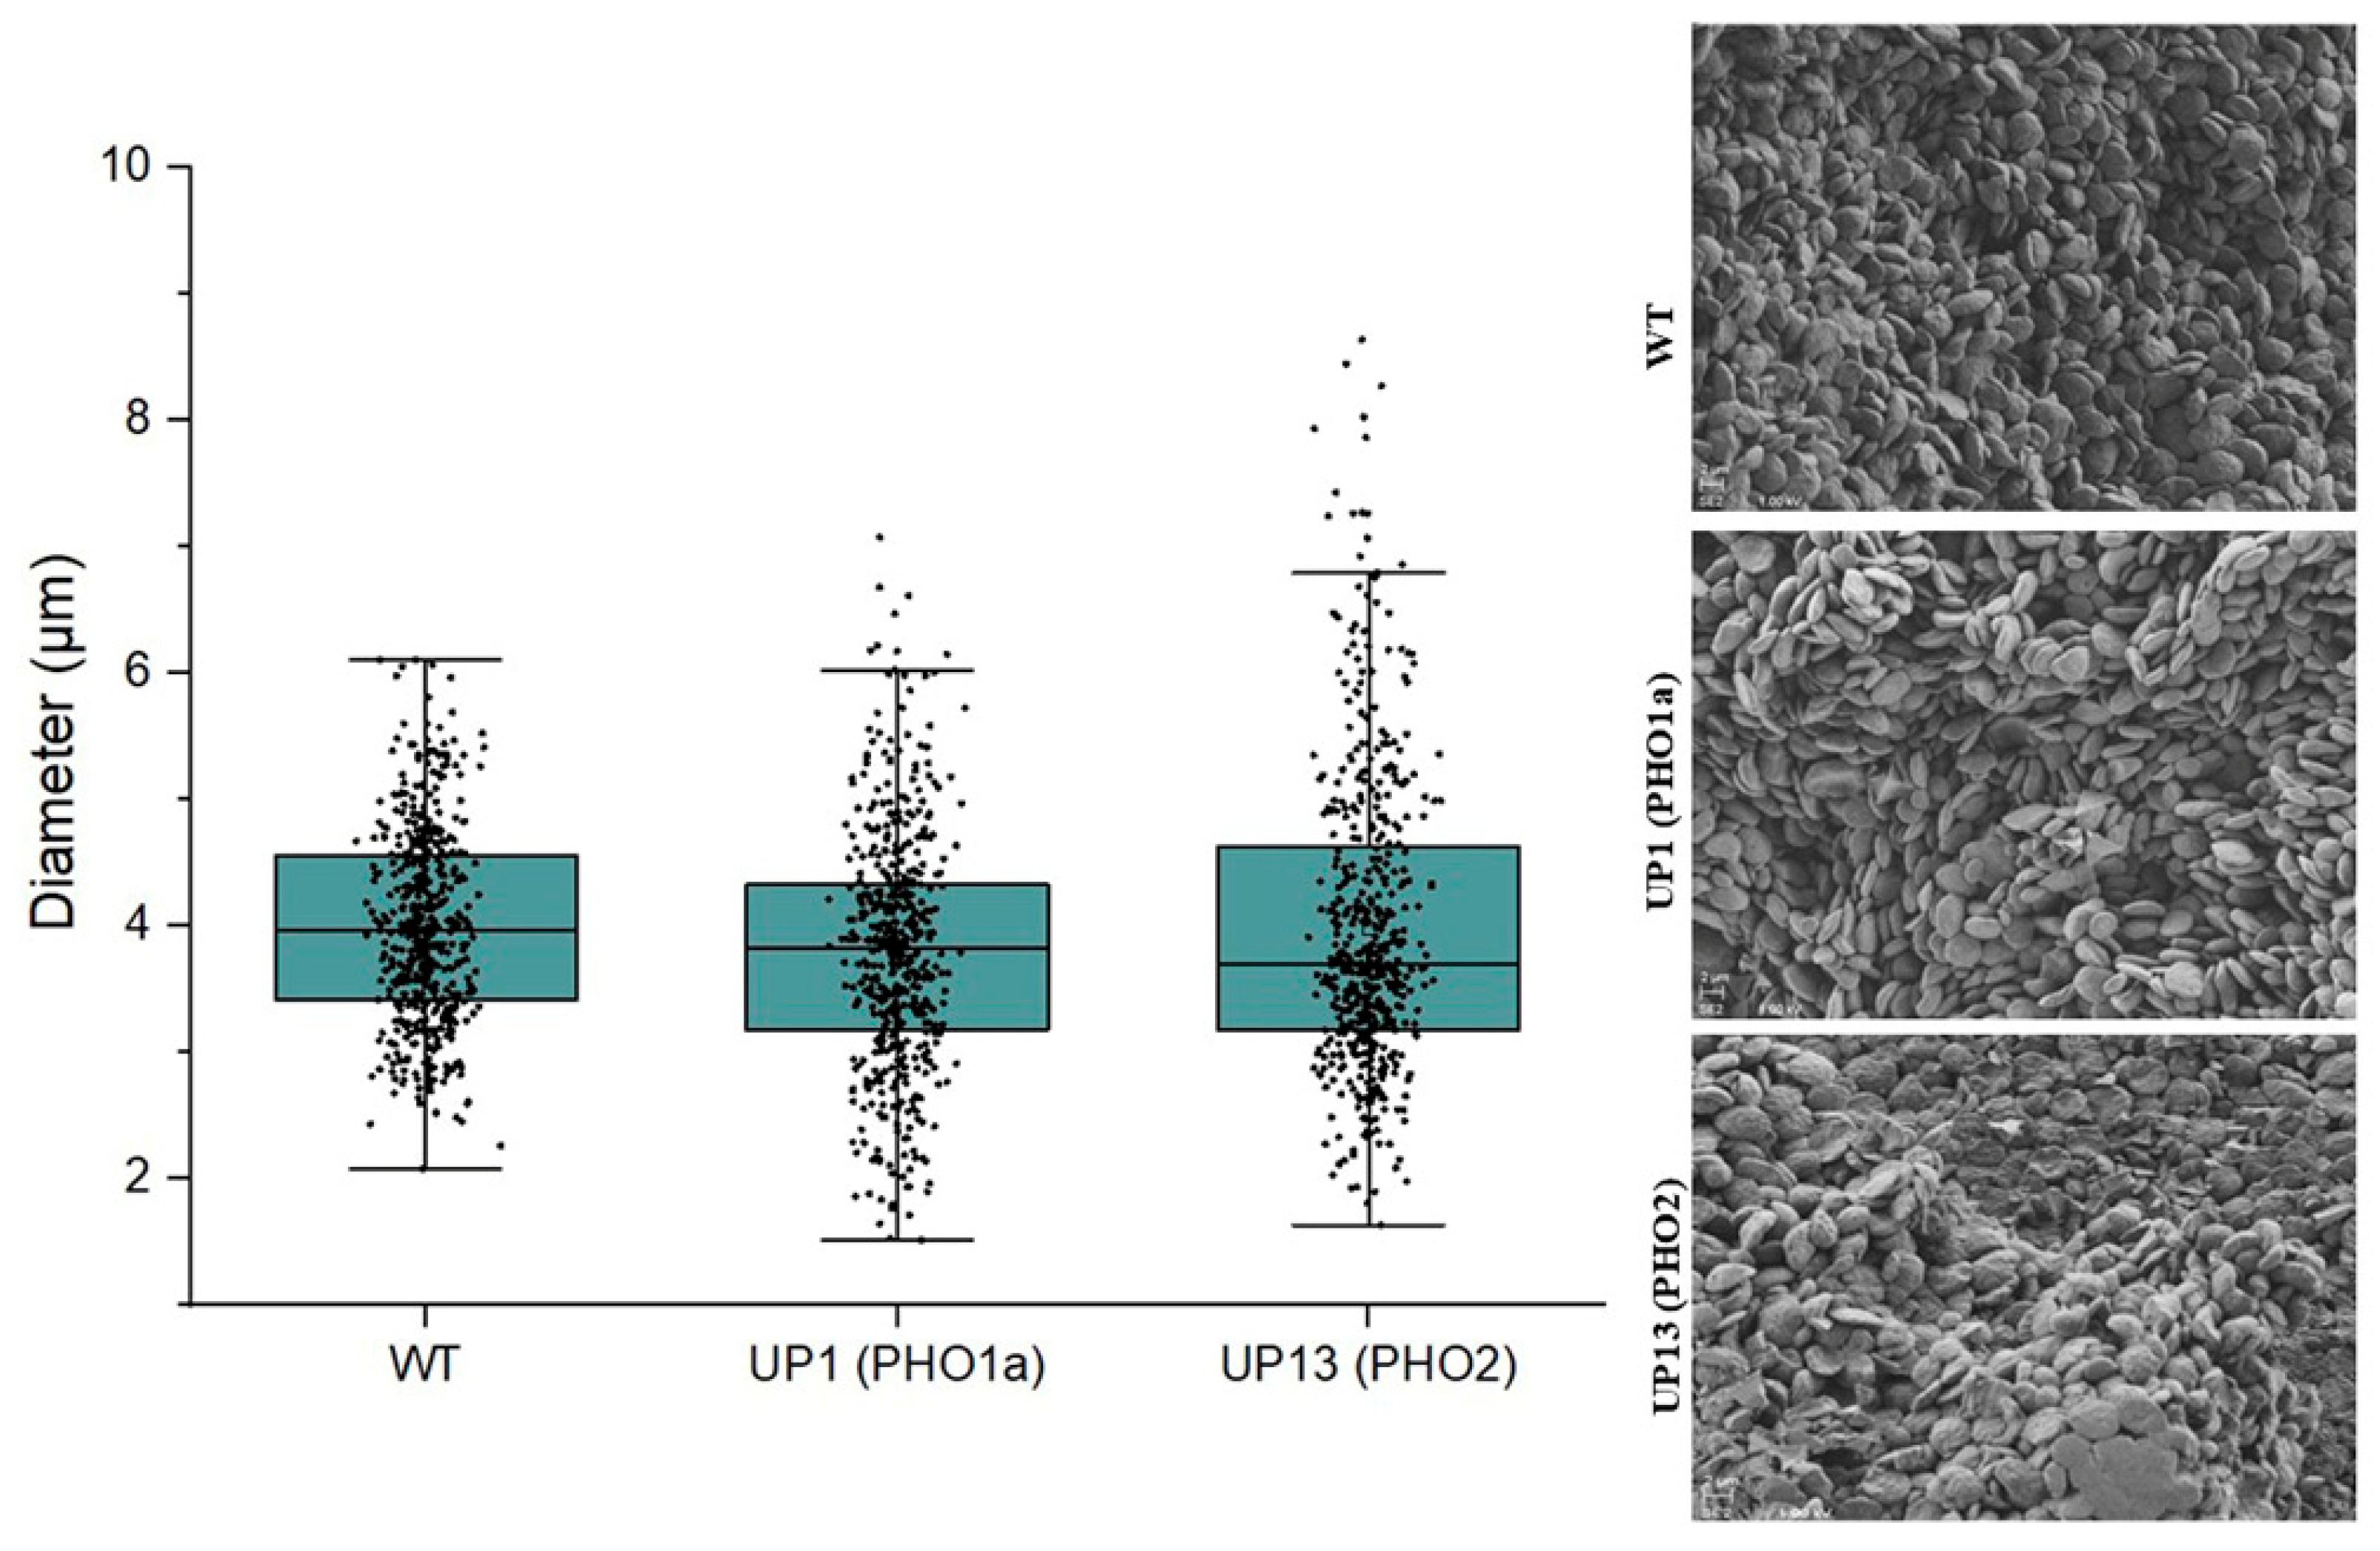
The observed reduction in starch content was not accompanied by changes in starch granule size or morphology, as visualized by means of SEM analysis, shown in Figure 3.
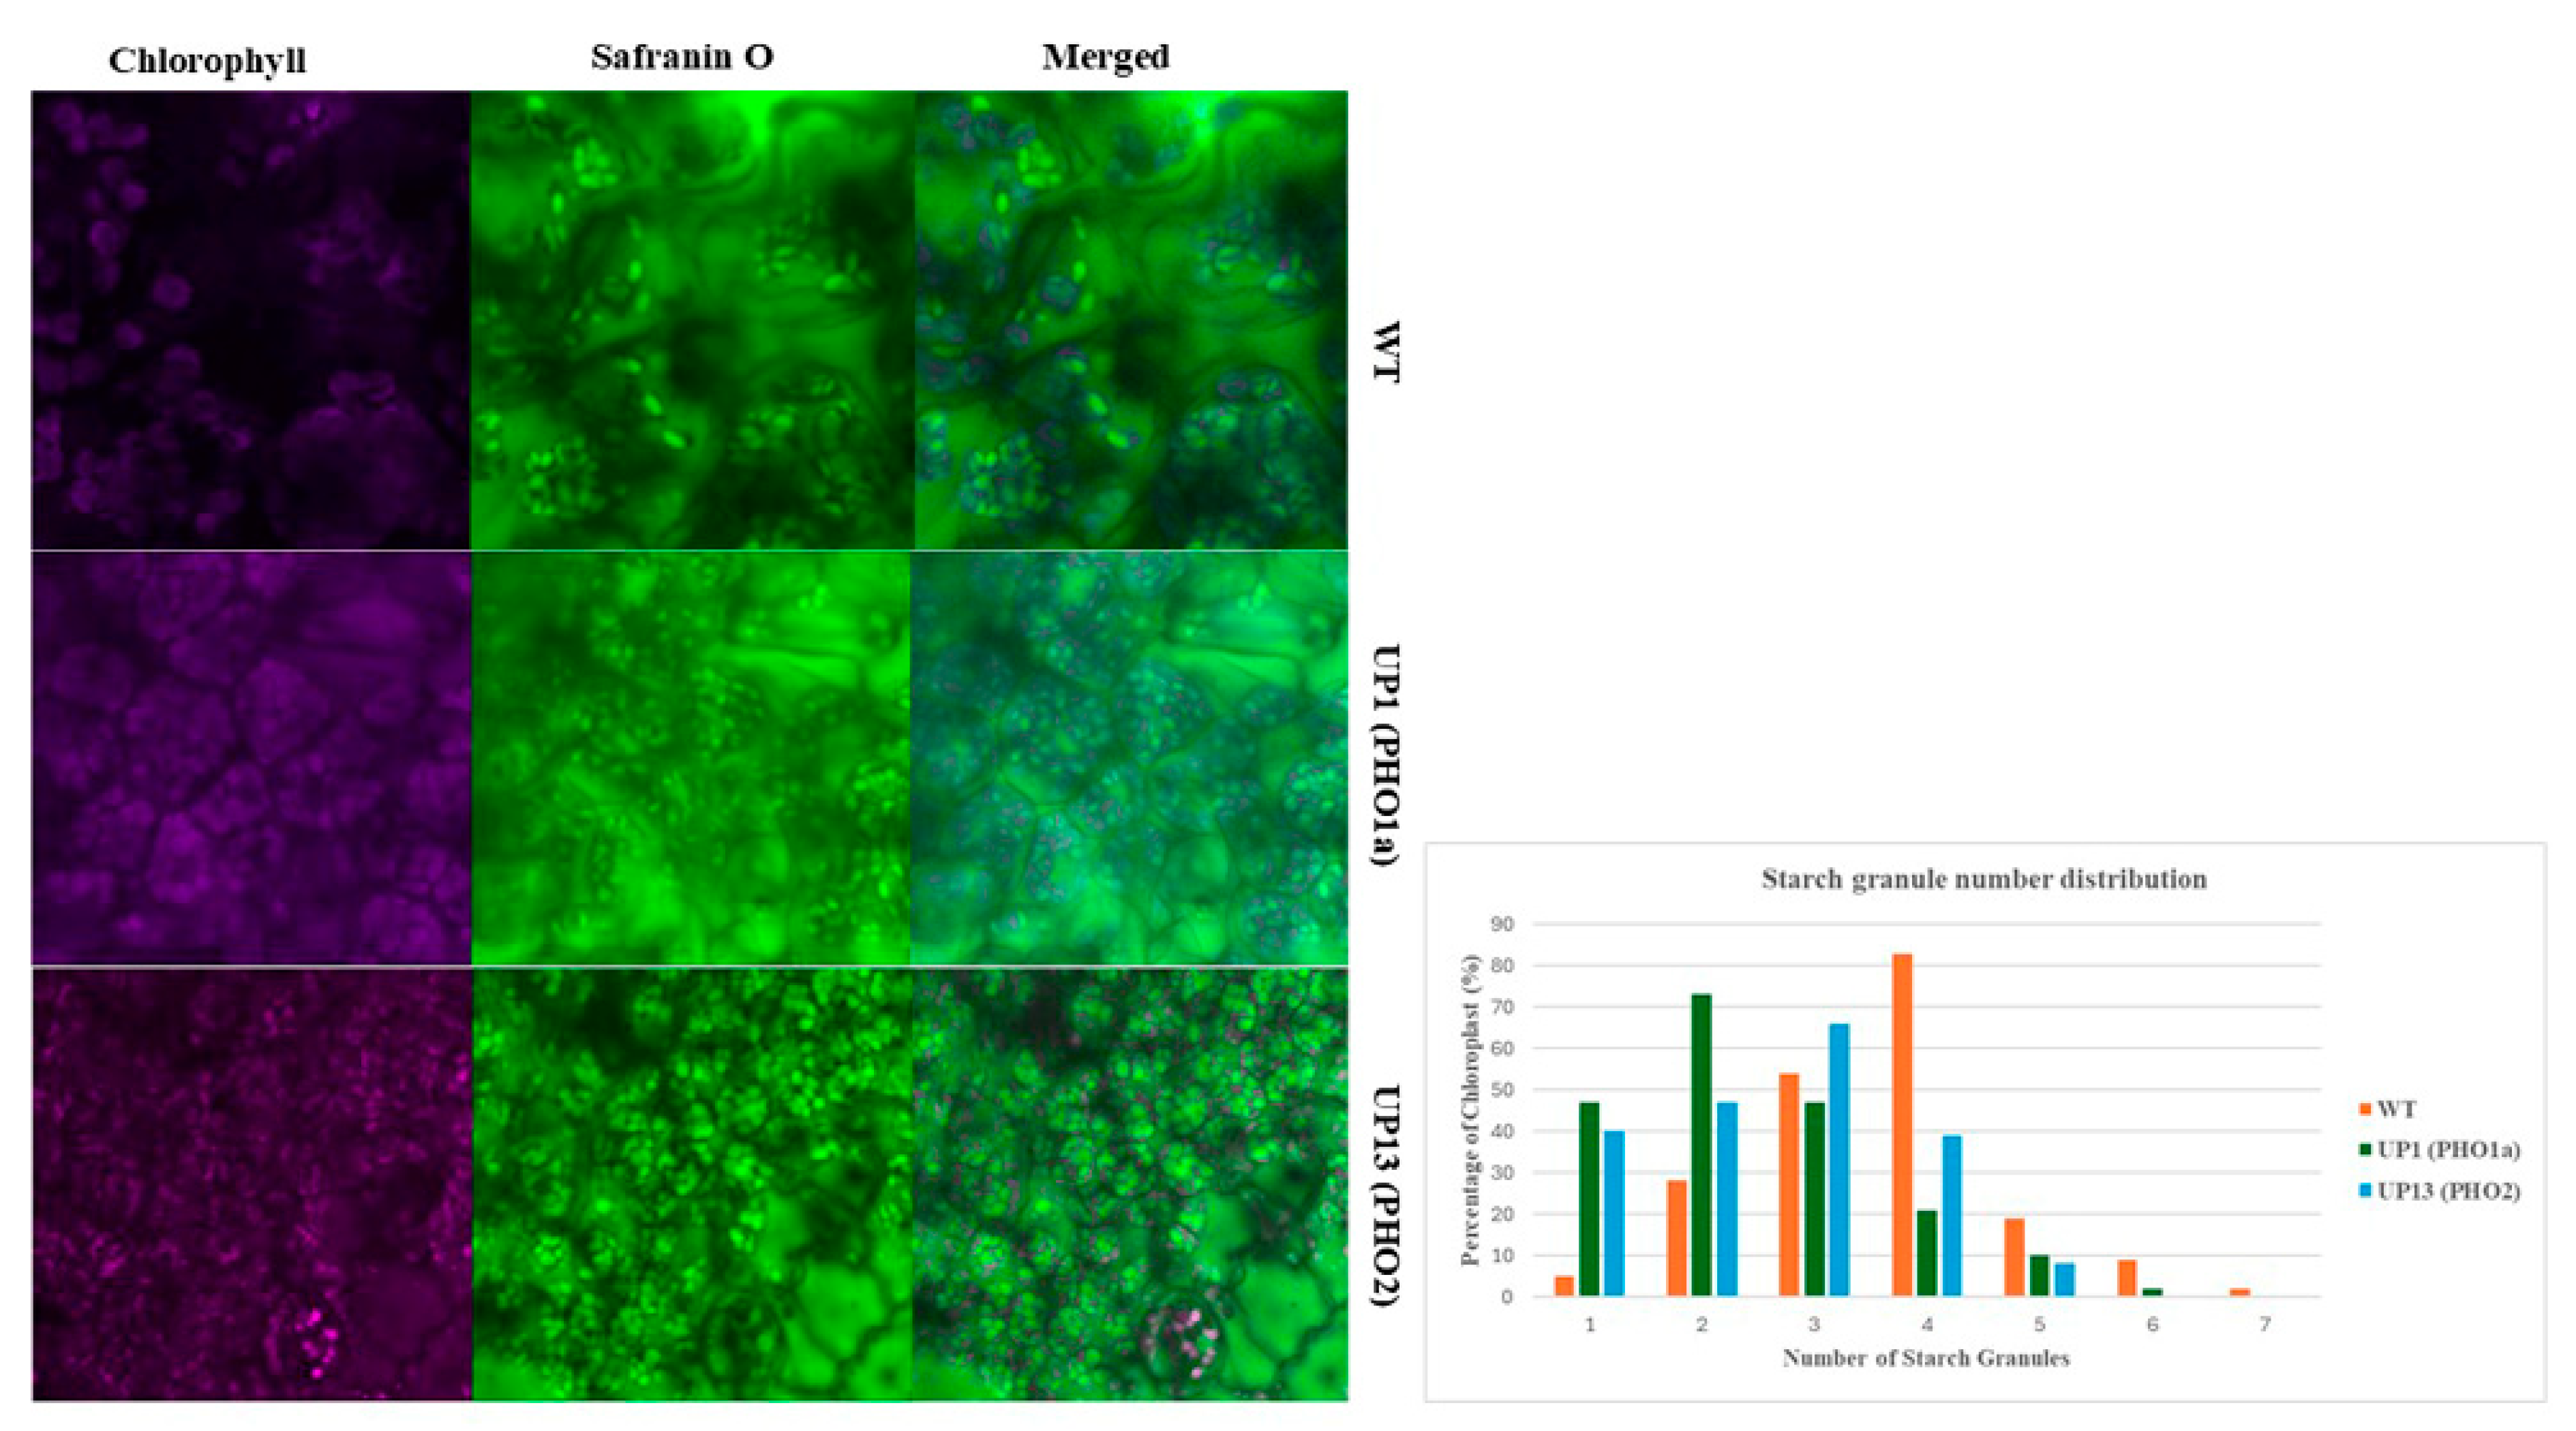
Therefore, we also tested the granule number per chloroplast to find out why the mutant lines had reduced amounts of starch (Figure 4).
The laser confocal scanning microscopy analysis revealed fewer starch granules per chloroplast in both mutant lines compared to the wild type. Most chloroplasts of UP1 had one or two starch granules, and most chloroplasts of UP13 contained two or three starch granules. By contrast, in the wild type, most chloroplasts contained three or four starch granules.
Overall, the results clearly show that carbohydrate metabolism was affected in the mutant lines, and both lines had reduced starch content, which was mainly a result of having fewer granules per chloroplast. Thus, it is likely that the inner starch structure was also affected.

3.2. Plants with Reduced PHO1 Expression Had Delayed Water Deficiency and Less Hydrogen Peroxide Generation

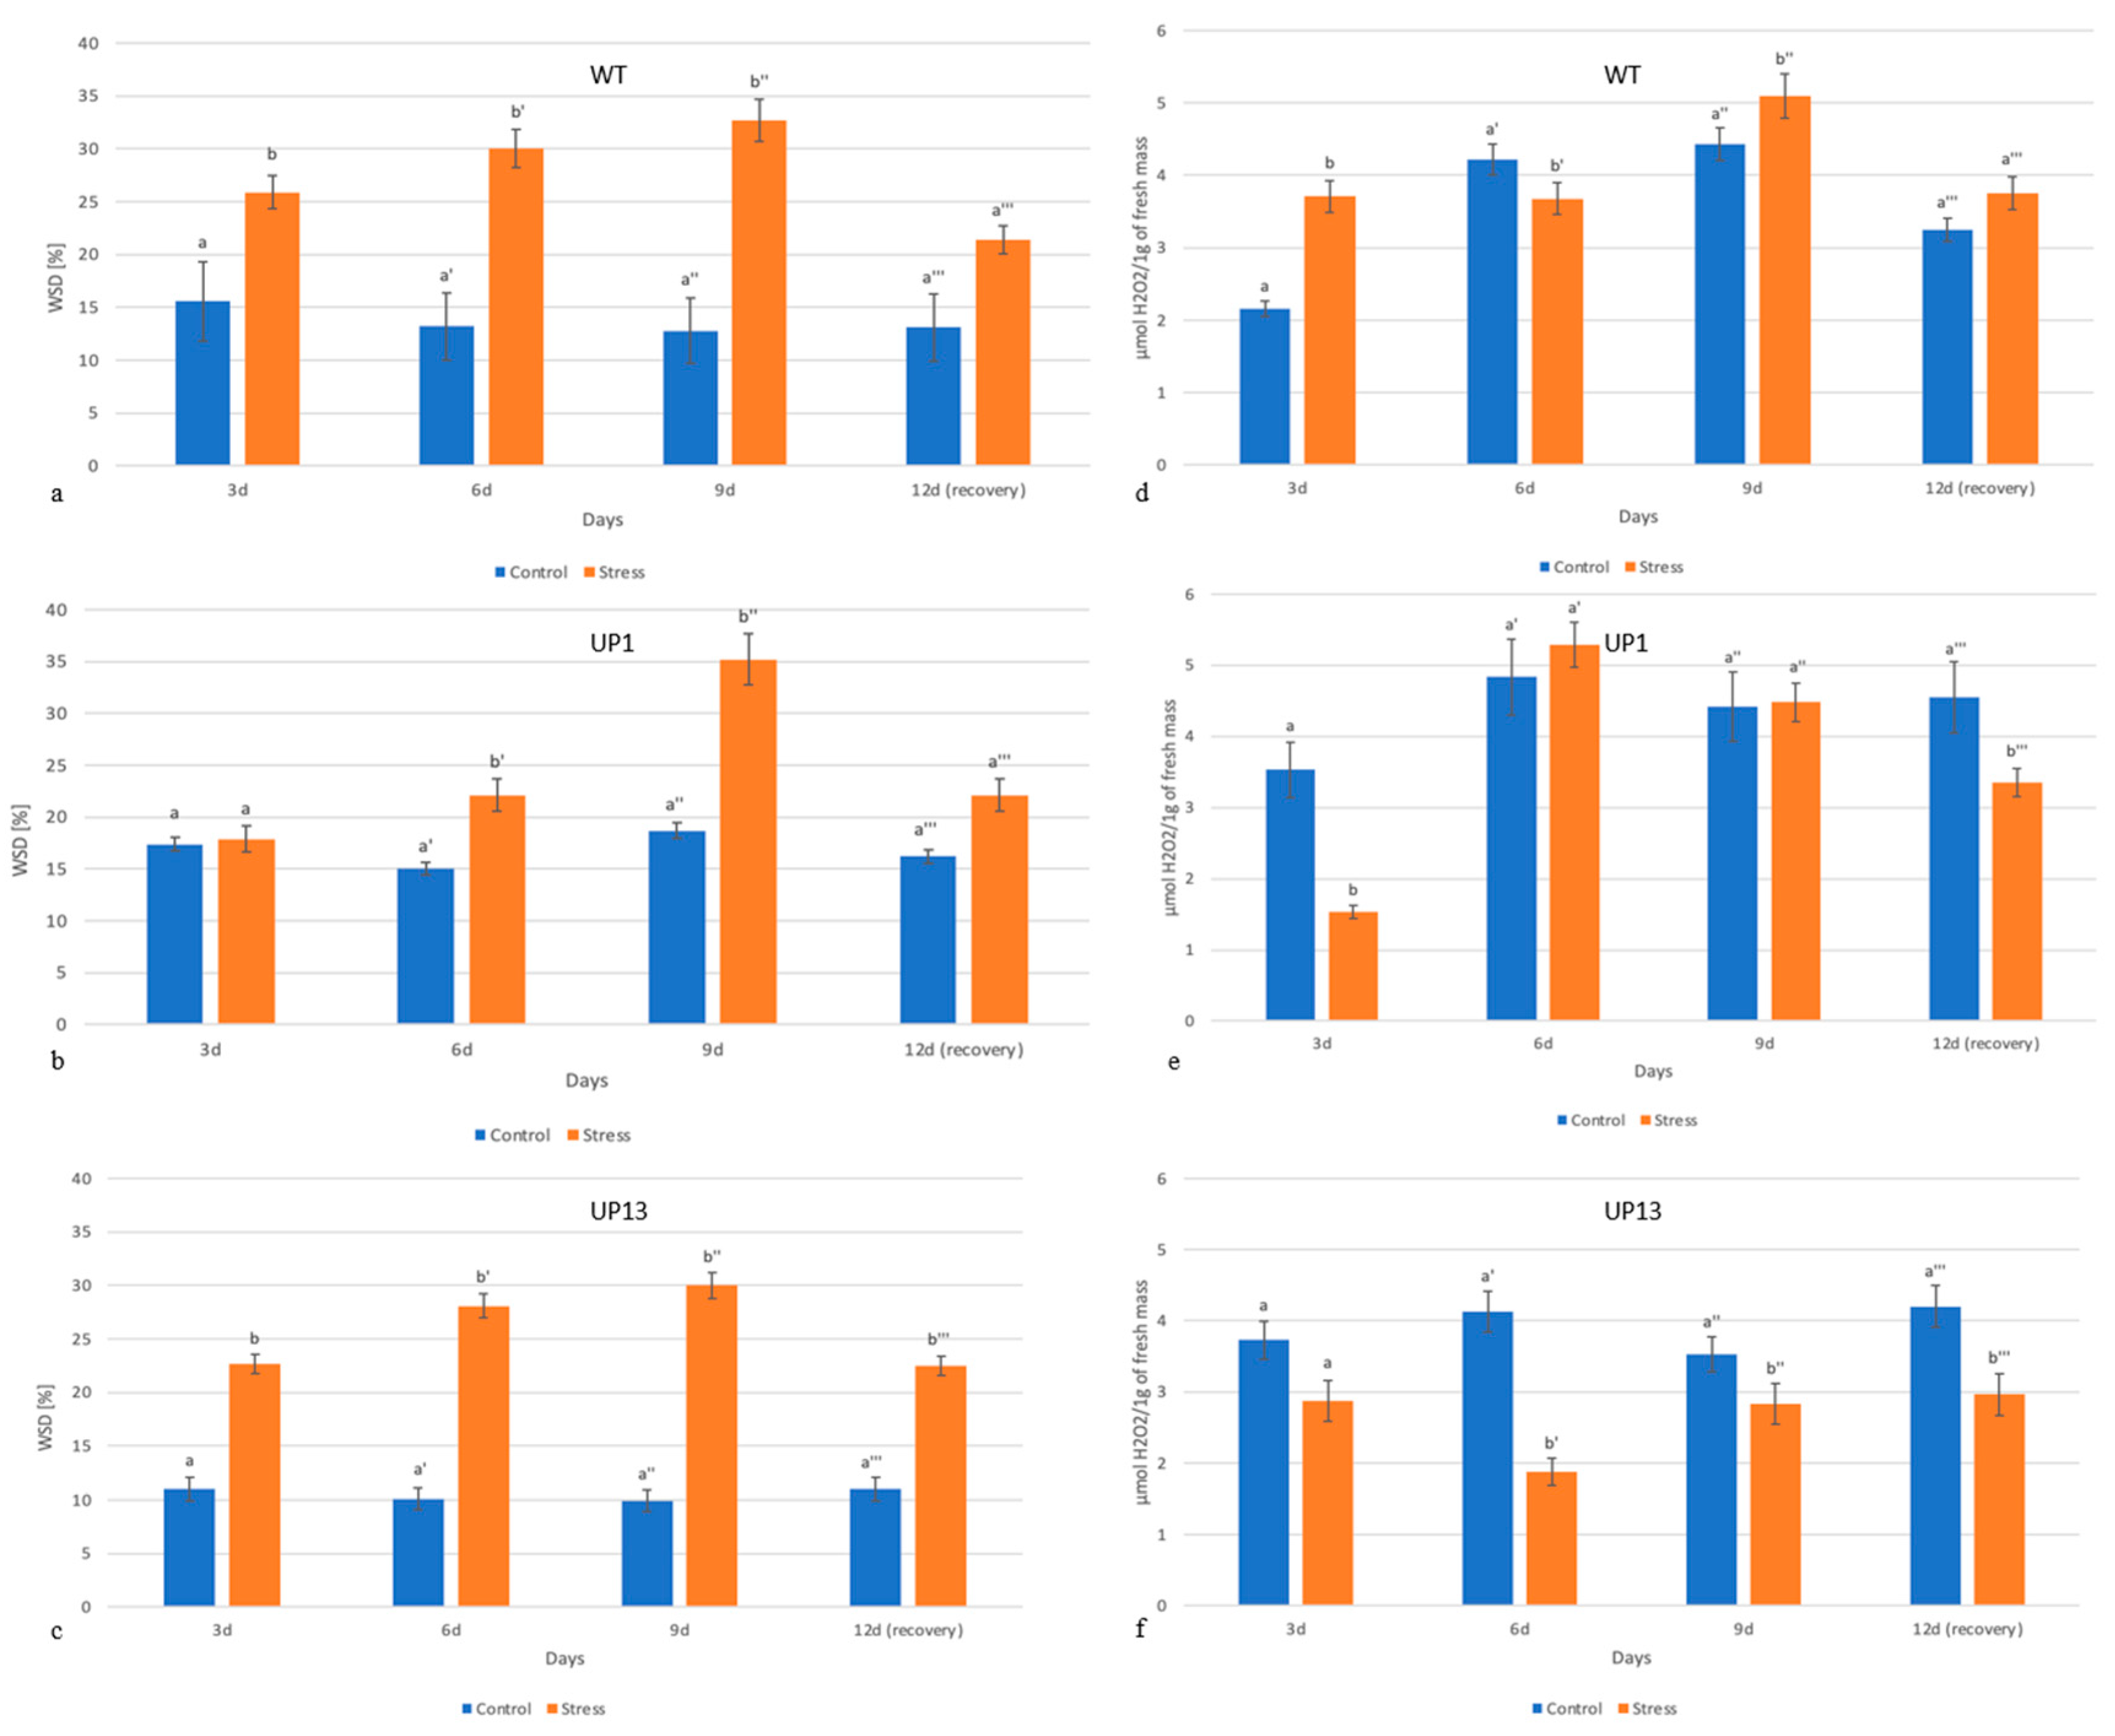
The values for water saturation deficit in the leaves of WT, UP1, and UP13 potato plants are shown in Figure 5a–c. The comparison of WSD index values for both groups of WT plants showed that the values determined for the group of plants exposed to stress were statistically significantly higher than those for the control plants. This was confirmed by a lower degree of hydration of the leaves of plants exposed to drought. Analyzing the relationship between WSD values and time, it was found that water deficit in the leaves of stressed plants increased on days 3, 6, and 9 of the experiment, whereas on day 12, after the plants were watered, it decreased significantly (Figure 5a). An analysis of the results of WSD for UP1 leaves (Figure 5b) showed that the WSD values determined on day 3 were similar for the plants in the control and stress groups and showed no statistically significant difference. However, the WSD values for days 6, 9, and 12 were statistically significantly higher for the plants from the non-irrigated group than those from the control group. These results indicate that a slight drought (3 days) did not reduce the degree of hydration of the leaves in these mutant potato plants, and only a longer period of water shortage caused this effect. An analysis of the changes in WSD values during the experiment shows that the water deficit in the leaves of plants from the stressed group systematically increased during prolonged drought and decreased after repeated irrigation. The WSD values for the individual sampling days were statistically significantly higher for the UP13 plants in the stressed group than the control plants (Figure 5c). The dependence of WSD values on time showed that the water deficit in the leaves of plants of the stressed group increased on the days following drought stress and decreased after irrigation.
The hydrogen peroxide content in the leaves of WT, UP1, and UP13 potato plants is shown in Figure 5d–f, respectively. The amounts of hydrogen peroxide in the collected leaf samples were compared using an unpaired Student’s t-test. The results showed that H2O2 levels in leaves from WT plants in the control group and those exposed to drought stress were significantly different after 3, 6, and 9 days of stress, while the differences between H2O2 levels in the control and stressed plants after rewatering were not statistically significant (Figure 5d, Tables S4–S6). Analyzing the changes in H2O2 levels during the experiment using ANOVA, it was found that the differences were statistically significant between the control and stress groups. No statistically significant difference was found in the hydrogen peroxide content of leaves from UP1 plants in the control and stressed groups on the 6th and 9th days of stress, while the content was significantly different after 3 days of stress and after repeated irrigation (Figure 5e, Table S8). ANOVA showed that the differences in H2O2 levels in the control group during the experiment were not statistically significant, while in the group exposed to drought stress, H2O2 levels differed significantly over time.
A comparison of the results for each day of sample collection using an unpaired Student’s t-test showed that the H2O2 content in the leaves from UP13 after 3 days of drought was not significantly different between the control group and the group exposed to drought stress, whereas after 6 and 9 days of drought and after rewatering, the differences were not statistically significant (Figure 5f, Table S8). ANOVA showed that the changes in H2O2 content in the control group during the experiment were not significantly different, while the changes in the stressed group were statistically significant.

3.3. Chlorophyll Content Is Altered and Soluble Protein Amounts Are Decreased in Stressed Plants

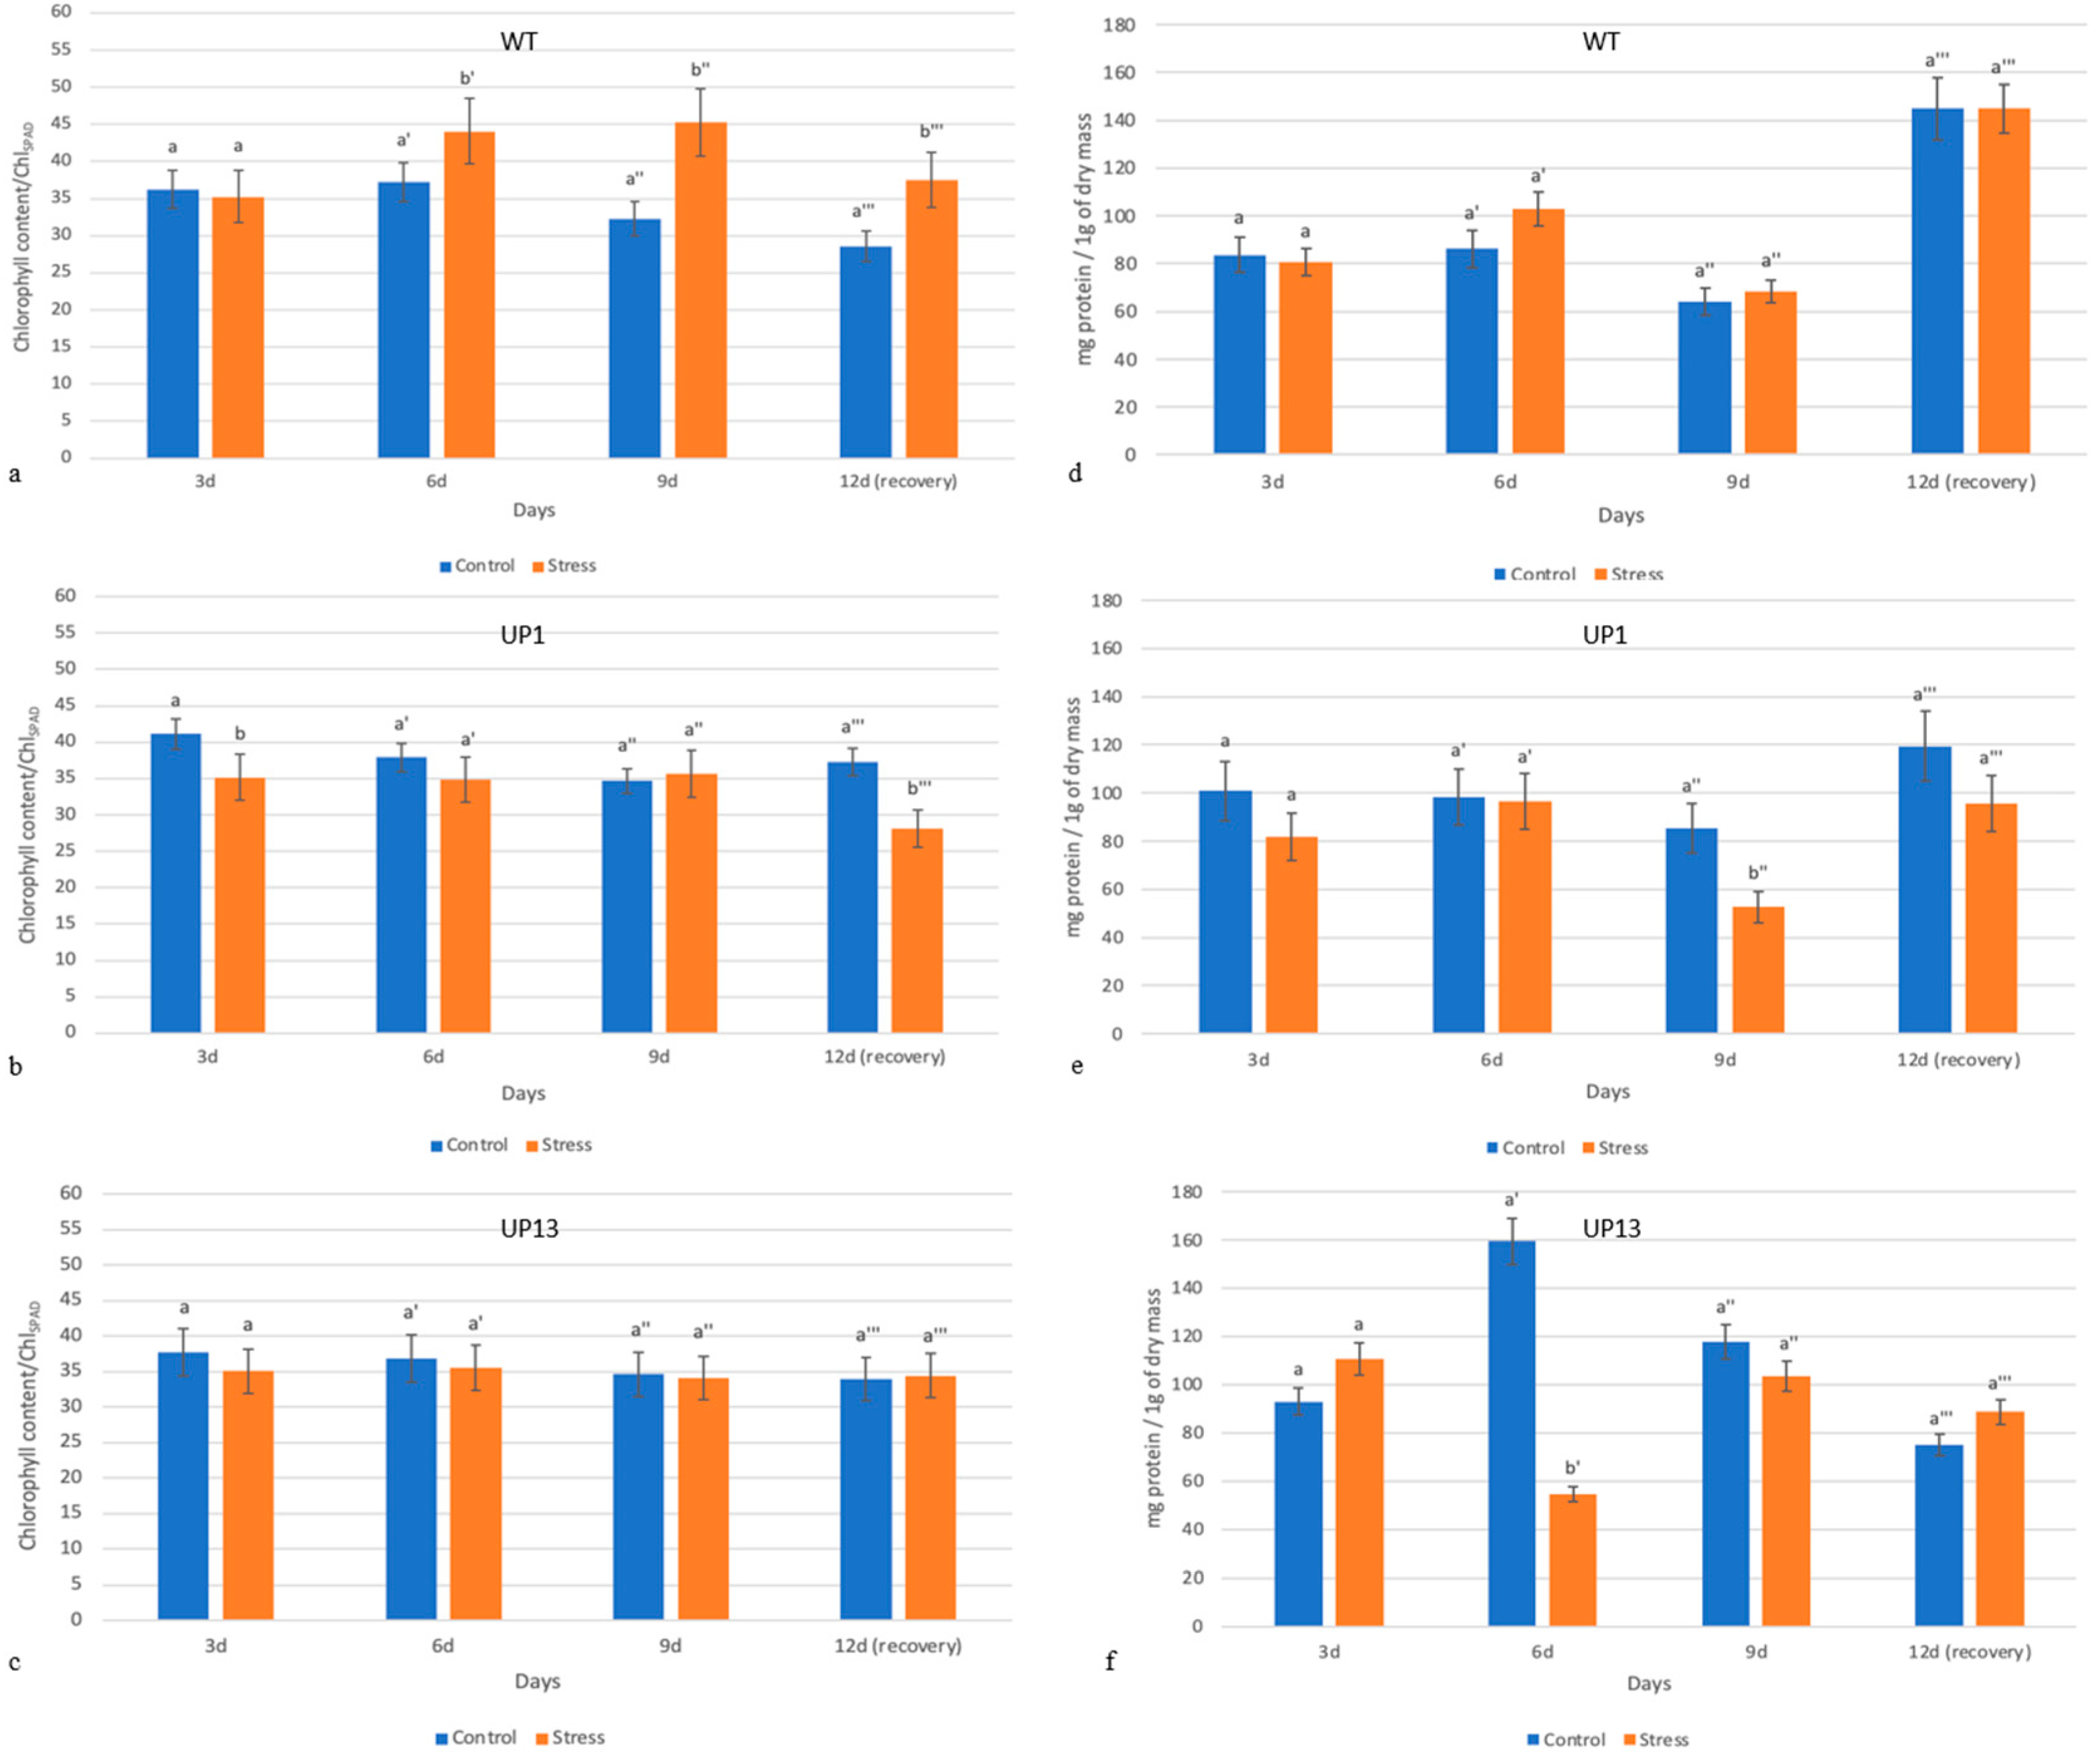
The chlorophyll content in the leaves of WT, UP1, and UP13 potato plants is shown in Figure 6a–c, respectively. An analysis of the results for the individual days of sample collection using an unpaired Student’s t-test showed that after 3 days of drought, the chlorophyll content in the leaves of the control and test groups showed no statistically significant difference, whereas the chlorophyll content in differed significantly after 6, 9, and 12 days of drought (Figure 6a, Table S1). The changes in chlorophyll content over time were analyzed using ANOVA, which showed that the differences in average chlorophyll content were statistically significant in both the control and stress groups (Table S7). The chlorophyll content in UP1 plants is shown in Figure 6b. It was found that the chlorophyll content in the leaves of plants in the control and stress groups differed significantly after 3 and 12 days of drought, whereas there was no statistically significant difference after 6 and 9 days of drought (Figure 6b, Table S2). ANOVA showed that the changes in chlorophyll content over time were statistically significant for both the control and test groups (Table S7). The chlorophyll content of UP13 plants is shown in Figure 6c. The average measurement error is marked in the graph. A comparison of the results for the individual days of sample collection using an unpaired Student’s t-test showed that at all time points (after 3, 6, 9, and 12 days of drought), the differences in chlorophyll content in the leaves of plants in the control and test groups were not statistically significant (Figure 6c, Table S3). ANOVA showed that the changes in chlorophyll content over time were not statistically significant for either the control or the test group (Table S7).
In the leaf extracts, there were no significant differences between control plants and plants exposed to drought stress in the groups of WT plants (Figure 6d) on all collection days. When the stressed plants were irrigated again, the protein content increased significantly. In plants of the UP1 line (Figure 6e), there were no significant differences in protein content in leaves exposed to drought stress on day 3, 6, or 12 of the experiment compared to control plants, while the protein content in stressed plants on day 9 decreased significantly compared to the control. The differences in protein content between plants of the UP13 line (Figure 6f) exposed to drought and those of the control group on days 3, 9, and 12 were nonsignificant. The protein content in the group of stressed plants decreased significantly on day 6 compared to the control group.

3.4. PHO1 Activity Decreases under Water Deficiency Conditions in Wild-Type Plants Compared to Mutant Plants

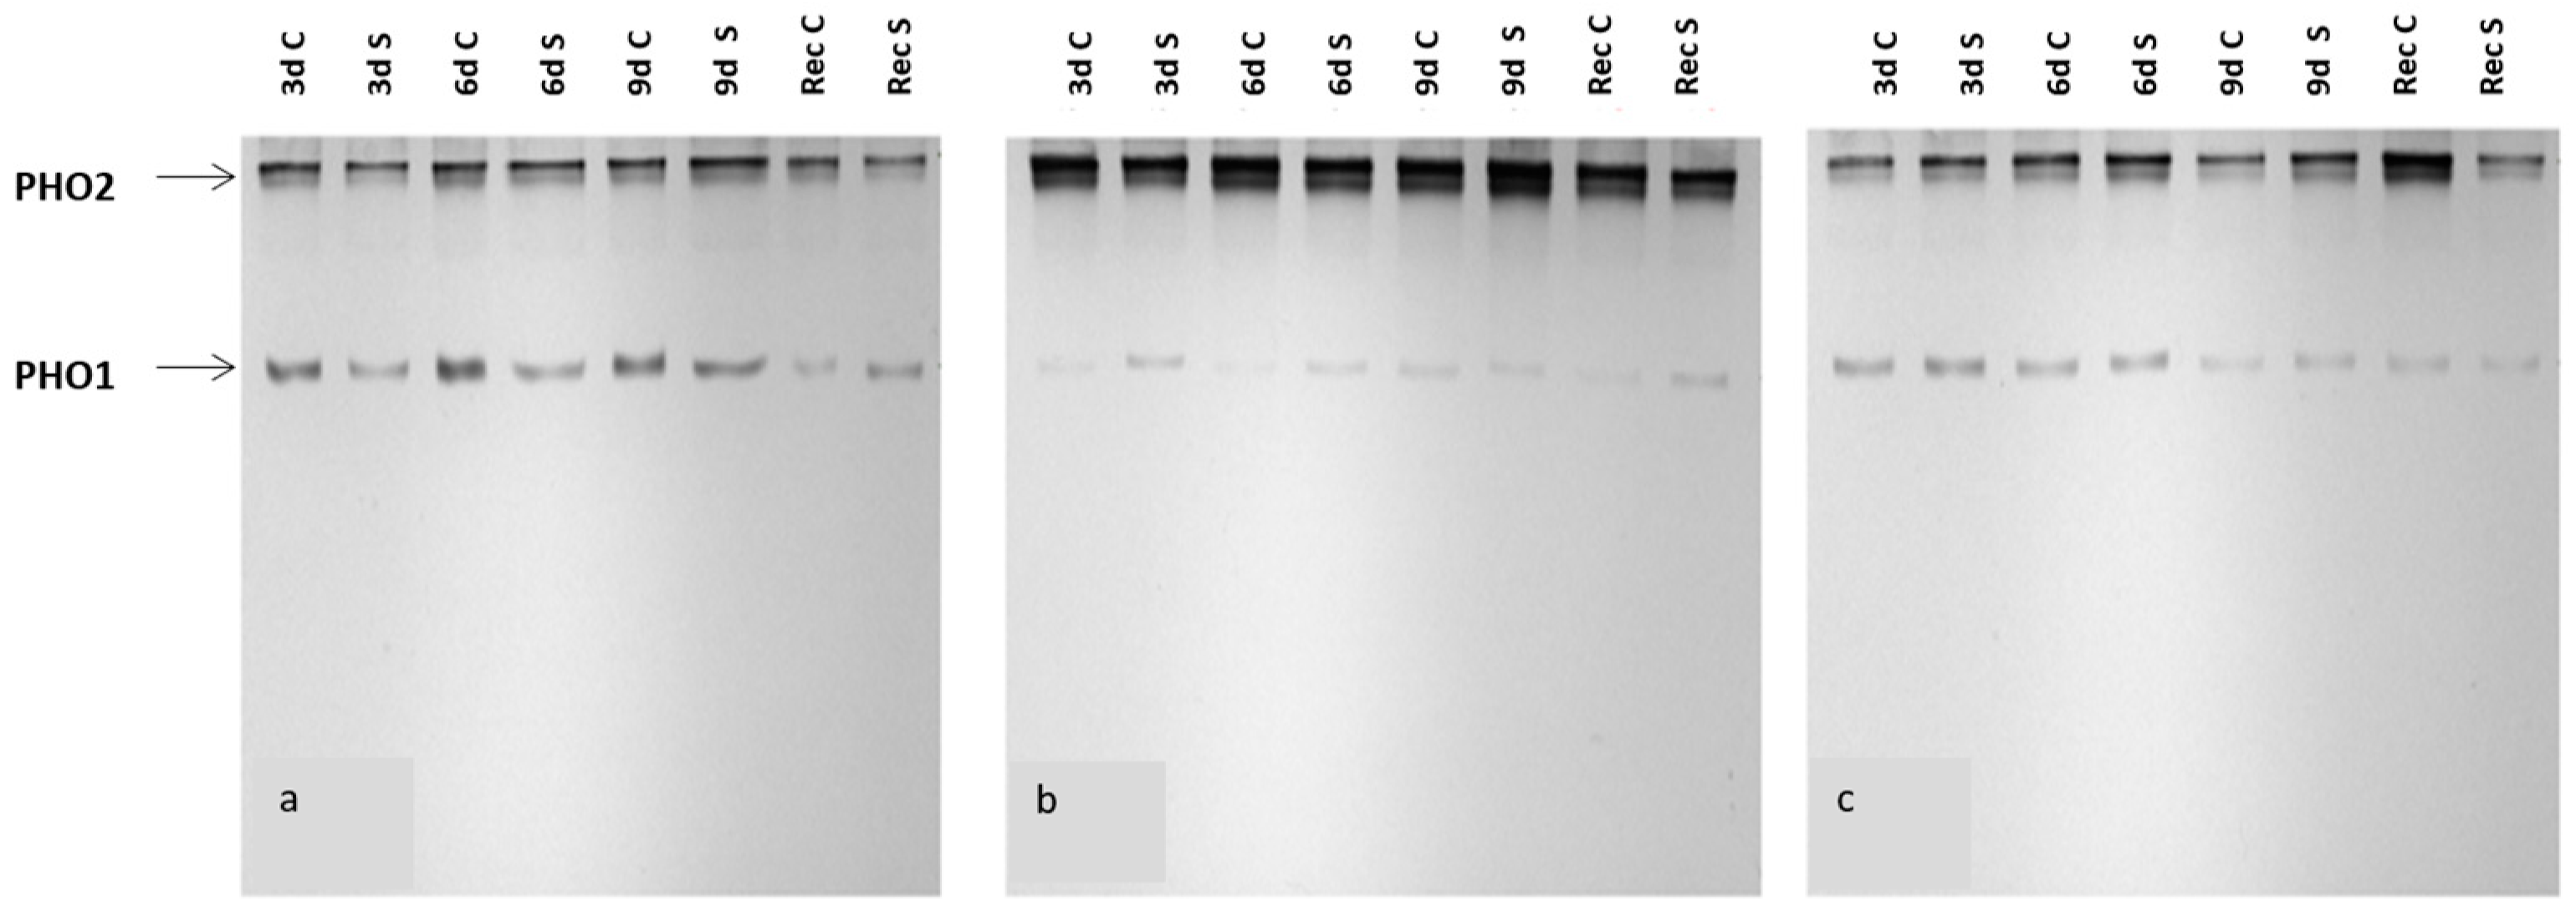
In wild-type plants, a 3-day drought resulted in decreased PHO2 activity compared to the control, whereas increased PHO2 activity was observed during prolonged stress (6 and 9 days) (Figure 7a, Table 1A). Decreased PHO1 activity was observed after 3, 6, and 9 days of drought compared to the control samples (Table 1A). A significant increase in PHO1 activity was observed in samples that were rewatered (Rec S) (Table 1A). Total PHO activity decreased after 3 and 6 days of drought compared to the control samples, while increased total PHO activity was observed after 9 days of drought (Table 1A). After the stressed plants were rewatered (Rec S), the total PHO activity was similar to that of the control samples.
In UP1 plants, PHO2 activity was slightly reduced or remained at a similar level under drought stress (Figure 7b, Table 1B). In PHO1 plants, a significant increase in activity was observed in response to stress, persisting even after the plants were rewatered. An exception was found in the results on the 9th day of drought, when a slight decrease in PHO1 activity was observed (Table 1B). However, no significant changes in total PHO activity were observed under the influence of drought stress in the samples from stressed plants, and the total activity remained at a similar level throughout the experiment (Table 1B).
In the UP13 line, drought stress led to increased PHO2 activity, whereas after repeated irrigation (Rec S), there was a significant decrease in activity. PHO1 activity in the initial phase of the experiment (after 3 days of drought) remained at a similar level to the control plants, while prolonged stress (after 6 and 9 days) caused a slight increase in PHO1 activity (Figure 7c, Table 1C). The total PHO activity under drought stress (after 3, 6, and 9 days) increased compared to plants in the control group, whereas it decreased significantly after rewatering of stressed plants (Rec S) (Table 1C).

4. Discussion

One of the effects of drought stress on plants is leaf desiccation. The degree of leaf desiccation can indicate the intensity of stress to which the plant was exposed. For this reason, the water saturation deficit (WSD) coefficients of the plant material collected during the experiments were determined in the leaves of both plants exposed to drought and control plants irrigated every 2–3 days. All plant lines showed increased WSD in response to prolonged drought (Figure 2a–c). A similar tendency was also observed in studies of pea (Pisum sativum) and lupin (Lupinus luteus). In this case, the water deficit reduced the relative water content in the leaves by about 10% during the two-week drought [50]. In the case of the UP1 line, a slight drought (3 days) did not reduce the degree of hydration of leaves compared to the control. Only prolonged exposure of the plants to a lack of water led to a decrease in the degree of hydration of the leaves (Figure 5b). This could indicate a greater tolerance of plants of the UP1 line to drought compared to wild-type (WT) plants, as the effect of stress in the form of decreased hydration in the leaves was already visible in the WT plants at the first measurement, after 3 days of drought. The results obtained for the UP13 line are analogous to those for the wild type (Figure 5c). This could indicate that the mutation in the UP13 line (silencing of the cytosolic isoform of glucan phosphorylase) has no significant effect on reducing or increasing the drought tolerance of the mutants, as is the case with silencing of the gene encoding the plastid isoform of glucan phosphorylase.
However, the starch metabolism was affected in both mutant lines: a smaller amount of starch and fewer starch granules per chloroplast were detected (Figure 2 and Figure 4). Drought stress also affects changes in metabolism and starch content in plant tissues. Changes in starch metabolism may be due to the stress effects on the activity of enzymes involved in the processes of starch synthesis and degradation, which has been documented in numerous studies. For example, it has been shown that in potato (Solanum tuberosum ssp. andigena), water deficit causes decreased starch synthase and ADP-glucose pyrophosphorylase activity, with a simultaneous increase in β-amylase activity [51]. In response to drought, increased ⍺- and β-amylase activity was also observed in rice (Oryza sativa) [52] and Arabidopsis thaliana [53]. However, the effect of drought on glucan phosphorylase activity has not yet been investigated.
The results of this study indicate that the activity of the plastid isoform of glucan phosphorylase (PHO1) was reduced under water deficit conditions in wild-type (WT) plants (Table 1A). As a result, the stomata were closed, causing the availability of CO2 and, thus, the intensity of photosynthesis to be decreased. As a result, the process of starch biosynthesis was inhibited, and reduced activity of enzymes involved in starch synthesis, including PHO1, was observed. In turn, a significant increase in PHO1 activity was observed in the UP1 line during drought stress (Table 1B). In this mutant line with suppressed PHO1a expression, perhaps the plant attempted to compensate for the reduced amount of the enzyme by increasing its activity. This could be due to either post-translational modifications or induced gene expression of PHO1b under these conditions, which would form an active homodimer rare in wild-type plants and plants grown under optimal conditions [54]. Moreover, the concentration of this enzyme in the cells is low and its contribution to the total activity of glucan phosphorylases is minimal due to the mutation; therefore, even small changes in its activity can result in visible changes.
In the second mutant line tested, UP13, a slight increase in PHO1 activity was also observed in plants exposed to drought (Table 1C). It is possible that the stress conditions induced a different response in these mutant plants than in the wild-type plants. Considering the decreased PHO1 activity in wild-type plants and the increased PHO1 activity in the UP1 and UP13 plants under drought conditions, it is reasonable to assume that the plastid isoform of glucan phosphorylase is involved in the response to water deficit. However, different activities result in altered plant responses to drought stress. The increased activity of the cytosolic isoform of glucan phosphorylase (PHO2) under the influence of drought stress in wild-type plants may indicate an increase in the intensity of processes related to the metabolism of cytosolic heteroglycans. Perhaps the heteroglycans become an alternative carbon source or pathway under conditions of underwater scarcity and limited photosynthesis. Stronger PHO2 activity under stress conditions was also observed in the mutant UP13 line, in which this isoform was reduced. The results indicate that increased PHO2 activity in this line may also be due to the lower enzyme concentration resulting from the mutation. Still, in this case, the mutant plants showed the same response to stress as wild-type plants.
In all lines tested, increased PHO1 activity and decreased PHO2 activity were observed after plants exposed to a 9-day drought were rewatered. This could be because after rehydration, the stomata open and the photosynthetic process is restored, leading to an intensive process of assimilatory starch synthesis in the plastids. PHO1 can be involved in both starch biosynthesis and starch degradation. Therefore, PHO1 activity may increase when starch biosynthesis intensifies [55]. However, the change in PHO2 activity does not show such a tendency, since this isoenzyme is involved in the metabolism of cytosolic heteroglycans, which is downstream of the biosynthesis of assimilative starch. In addition, increased protein content was observed in wild-type (WT) plants after rewatering (Figure 5d). This could indicate that restoration of the photosynthetic process by rehydration is associated with the de novo synthesis of photosynthetic proteins [56] in wild-type plants.
A significant decrease in protein content was observed in mutant plants exposed to drought compared to control plants: in the UP1 line on day 9 of the experiment (Figure 5e) and in the UP13 line on day 6 (Figure 5f). This may indicate the process of protein degradation and a consequent decrease in protein content under water shortage conditions. This tendency was demonstrated in pea (Pisum sativum) and yellow lupin (Lupinus luteus), where the protein content in the leaves decreased during a two-week drought [50]. Moreover, the results of measuring glucan phosphorylase activity on these days indicate an increase in cytosolic isoform (PHO2) activity, which, as mentioned above, could indicate the degradation of cytosolic heteroglycans due to the limited photosynthesis. The decreased protein concentration in the leaves under stress also demonstrates that the plants utilize alternative sources for the carbon skeleton under water deficit conditions.
Drought stress also causes secondary oxidative stress by disrupting the process of photosynthesis and electron transport, which leads to an increased concentration of reactive oxygen species in the tissues of the stressed plant [57]. In this work, the concentration of hydrogen peroxide in leaf extracts was measured to estimate the extent of oxidative stress in plants exposed to drought. In wild-type (WT) plants, an increase in H2O2 content under drought was observed (Figure 5d), but the mutant lines did not show this tendency (Figure 5e,f). It is likely that the reduced expression of both PHO1a and PHO2 in the mutant plants causes a different response to water deficit than in wild-type plants. UP1 mutants are more tolerant to water deficiency in the substrate than wild-type plants. The results of measuring the amount of H2O2 in the leaves of mutant plants indicate that this is not an optimal marker for oxidative stress caused by water deficiency, at least not in the initial phase.
Water deficit affects many physiological processes in plants, including the functioning of chloroplasts. Under the influence of drought, chlorophyll synthesis and degradation decrease [58]. One of the steps taken in this technical work was to measure chlorophyll concentration (ChlSPAD) in the leaves of living plants using a noninvasive method. However, no downward trend in chlorophyll content due to drought was observed. Under water deficit conditions, chlorophyll content increased only in wild-type plants (Figure 6a), while no significant changes in content were observed in the mutant lines (Figure 6b,c).

5. Conclusions

Experiments performed in a greenhouse revealed that the UP1 potato line, with suppressed expression of the gene encoding PHO1a, showed greater tolerance to drought stress than did wild-type plants and the UP13 line, with suppressed expression of the gene encoding PHO2. Future studies will provide a more comprehensive analysis of carbohydrate metabolism in the whole plant in response to drought stress.

Supplementary Materials

The following supporting information can be downloaded at: https://www.mdpi.com/article/10.3390/agriculture14091491/s1, Tables S1–S8: Results of statistical analyses.

Author Contributions

Conceptualization, S.O.; methodology, S.O. and J.F.; software, J.P.; formal analysis, S.O., J.F. and E.Z.-Z.; investigation, J.P. (chlorophyll content, protein content, PHO activity), A.R. (WSD determination), P.N. (H2O2 content), and A.K. (sugar content, microscopy analysis); writing—original draft preparation, J.P. and S.O.; writing—review and editing, S.O. and J.F.; visualization, J.P. and A.K.; supervision, S.O. All authors have read and agreed to the published version of the manuscript.

Funding

This research received no external funding.

Institutional Review Board Statement

Not applicable.

Data Availability Statement

The data presented in this study are available on request from the corresponding author.

Acknowledgments

The authors would like to thank S. Samborski from the Institute of Agriculture of the Warsaw University of Life Sciences (SGGW) for providing the Konica Minolta SPAD-502Plus chlorophyll meter to measure the chlorophyll content in leaves.

Conflicts of Interest

The authors declare no conflicts of interest.

References

  1. Thalmann, M.; Santelia, D. Starch as a determinant of plant fitness under abiotic stress. New Phytol. 2017, 214, 943–951. [Google Scholar] [CrossRef]
  2. Hummel, I.; Pantin, F.; Sulpice, R.; Piques, M.; Rolland, G.; Dauzat, M.; Christophe, A.; Pervent, M.; Bouteillé, M.; Stitt, M.; et al. Arabidopsis plants acclimate to water deficit at low cost through changes of carbon usage: An integrated perspective using growth, metabolite, enzyme, and gene expression analysis. Plant Physiol. 2010, 154, 357–372. [Google Scholar] [CrossRef]
  3. Cuellar-ortiz, S.M.; de la Paz Arrieta-montiel, M.A.R.I.A.; Acosta-Gallegos, J.O.R.G.E.; Covarrubias, A.A. Relationship between carbohydrate partitioning and drought resistance in common bean. Plant Cell Environ. 2008, 31, 1399–1409. [Google Scholar] [CrossRef] [PubMed]
  4. Lee, B.-R.; Jin, Y.-L.; Jung, W.-J.; Avice, J.-C.; Morvan-Bertrand, A.; Ourry, A.; Park, C.-W.; Kim, T.-H. Water-deficit accumulates sugars by starch degradation—not by de novo synthesis—in white clover leaves (Trifolium repens). Physiol. Plant 2008, 134, 403–411. [Google Scholar] [CrossRef] [PubMed]
  5. Kaplan, F.; Guy, C.L. RNA interference of Arabidopsis beta-amylase8 prevents maltose accumulation upon cold shock and increases sensitivity of PSII photochemical efficiency to freezing stress. Plant J. 2005, 44, 730–743. [Google Scholar] [CrossRef]
  6. Hoermiller, I.I.; Naegele, T.; Augustin, H.; Stutz, S.; Weckwerth, W.; Heyer, A.G. Subcellular reprogramming of metabolism during cold acclimation in Arabidopsis thaliana. Plant Cell Environ. 2017, 40, 602–610. [Google Scholar] [CrossRef]
  7. Zanella, M.; Borghi, G.L.; Pirone, C.; Thalmann, M.; Pazmino, D.; Costa, A.; Santelia, D.; Trost, P.; Sparla, F. β-amylase 1 (BAM1) degrades transitory starch to sustain proline biosynthesis during drought stress. J. Exp. Bot. 2016, 67, 1819–1826. [Google Scholar] [CrossRef]
  8. Rosa, M.; Prado, C.; Podazza, G.; Interdonato, R.; González, J.A.; Hilal, M.; Prado, F.E. Soluble sugars. Plant Signal. Behav. 2009, 4, 388–393. [Google Scholar] [CrossRef]
  9. Yin, Y.-G.; Kobayashi, Y.; Sanuki, A.; Kondo, S.; Fukuda, N.; Ezura, H.; Sugaya, S.; Matsukura, C. Salinity induces carbohydrate accumulation and sugar-regulated starch biosynthetic genes in tomato (Solanum lycopersicum L. cv. ‘Micro-Tom’) fruits in an ABA- and osmotic stress-independent manner. J. Exp. Bot. 2010, 61, 563–574. [Google Scholar] [CrossRef]
  10. Dong, S.; Beckles, D.M. Dynamic changes in the starch-sugar interconversion within plant source and sink tissues promote a better abiotic stress response. J. Plant Physiol. 2019, 234–235, 80–93. [Google Scholar] [CrossRef] [PubMed]
  11. Nagao, M.; Minami, A.; Arakawa, K.; Fujikawa, S.; Takezawa, D. Rapid degradation of starch in chloroplasts and concomitant accumulation of soluble sugars associated with ABA-induced freezing tolerance in the moss Physcomitrella patens. J. Plant Physiol. 2005, 162, 169–180. [Google Scholar] [CrossRef] [PubMed]
  12. Pommerrenig, B.; Ludewig, F.; Cvetkovic, J.; Trentmann, O.; Klemens, P.A.W.; Neuhaus, H.E. In concert: Orchestrated changes in carbohydrate homeostasis are critical for plant abiotic stress tolerance. Plant Cell Physiol. 2018, 59, 1290–1299. [Google Scholar] [CrossRef] [PubMed]
  13. Heiber, I.; Cai, W.; Baier, M. Linking chloroplast antioxidant defense to carbohydrate availability: The transcript abundance of stromal ascorbate peroxidase is sugar-controlled via ascorbate biosynthesis. Mol. Plant 2014, 7, 58–70. [Google Scholar] [CrossRef]
  14. Keunen, E.; Peshev, D.; Vangronsveld, J.; Van Den Ende, W.; Cuypers, A. Plant sugars are crucial players in the oxidative challenge during abiotic stress: Extending the traditional concept. Plant Cell Environ. 2013, 36, 1242–1255. [Google Scholar] [CrossRef]
  15. Krasensky, J.; Jonak, C. Drought, salt, and temperature stress-induced metabolic rearrangements and regulatory networks. J. Exp. Bot. 2012, 63, 1593–1608. [Google Scholar] [CrossRef] [PubMed]
  16. Rolland, F.; Baena-Gonzalez, E.; Sheen, J. Sugar sensing and signaling in plants: Conserved and novel mechanisms. Ann. Rev. Plant Biol. 2006, 57, 675–709. [Google Scholar] [CrossRef]
  17. Skirycz, A.; De Bodt, S.; Obata, T.; De Clercq, I.; Claeys, H.; De Rycke, R.; Andriankaja, M.; Van Aken, O.; Van Breusegem, F.; Fernie, A.R.; et al. Developmental stage specificity and the role of mitochondrial metabolism in the response of Arabidopsis leaves to prolonged mild osmotic stress. Plant Physiol. 2010, 152, 226–244. [Google Scholar] [CrossRef]
  18. Monroe, J.D.; Storm, A.R.; Badley, E.M.; Lehman, M.D.; Platt, S.M.; Saunders, L.K.; Schmitz, J.M.; Torres, C.E. B-amylase1 and b-amylase3 are plastidic starch hydrolases in Arabidopsis that seem to be adapted for different thermal, pH, and stress conditions. Plant Physiol. 2014, 166, 1748–1763. [Google Scholar] [CrossRef] [PubMed]
  19. He, J.-F.; Goyal, R.; Laroche, A.; Zhao, M.-L.; Lu, Z.-X. Water stress during grain development affects starch synthesis, composition and physicochemical properties in triticale. J. Cereal Sci. 2012, 56, 552–560. [Google Scholar] [CrossRef]
  20. Geigenberger, P.; Reimholz, R.; Geiger, M.; Merlo, L.; Canale, V.; Stitt, M. Regulation of sucrose and starch metabolism in potato tubers in response to short-term water deficit. Planta 1997, 201, 502–518. [Google Scholar] [CrossRef]
  21. Zrenner, R.; Stitt, M. Comparison of the effect of rapidly and gradually developing water-stress on carbohydrate metabolism in spinach leaves. Plant Cell Environ. 1991, 14, 939–946. [Google Scholar] [CrossRef]
  22. Villadsen, D.; Rung, J.H.; Nielsen, T.H. Osmotic stress changes carbohydrate partitioning and fructose-2,6-bisphosphate metabolism in barley leaves. Funct. Plant Biol. 2005, 32, 1033–1043. [Google Scholar] [CrossRef]
  23. Thitisaksakul, M.; Jimenez, R.; Arias, M.; Beckles, D. Effects of environmental factors on starch biosynthesis and composition. J. Cereal Sci. 2012, 56, 67–80. [Google Scholar] [CrossRef]
  24. Thalmann, M.; Pazmino, D.; Seung, D.; Horrer, D.; Nigro, A.; Meier, T.; Kölling, K.; Pfeifhofer, H.W.; Zeeman, S.C.; Santelia, D. Regulation of leaf starch degradation by abscisic acid is important for osmotic stress tolerance in plants. Plant Cell 2016, 28, 1860–1878. [Google Scholar] [CrossRef]
  25. Todaka, D.; Matsushima, H.; Morohashi, Y. Water stress enhances β-amylase activity in cucumber cotyledons. J. Exp. Bot. 2000, 51, 739–745. [Google Scholar] [CrossRef] [PubMed]
  26. Peng, T.; Zhu, X.; Duan, N.; Liu, J.-H. PtrBAM1, a β-amylase-coding gene of Poncirus trifoliata, is a CBF regulon member with function in cold tolerance by modulating soluble sugar levels. Plant Cell Environ. 2014, 37, 2754–2767. [Google Scholar] [CrossRef] [PubMed]
  27. Yang, J.; Zhang, J.; Wang, Z.; Xu, G.; Zhu, Q. Activities of key enzymes in sucrose-to-starch conversion in wheat grains subjected to water deficit during grain filling. Plant Physiol. 2004, 135, 1621–1629. [Google Scholar] [CrossRef]
  28. Zhang, H.; Li, H.; Yuan, L.; Wang, Z.; Yang, J.; Zhang, J. Post-anthesis alternate wetting and moderate soil drying enhances activities of key enzymes in sucrose-to-starch conversion in inferior spikelets of rice. J. Exp. Bot. 2012, 63, 215–227. [Google Scholar] [CrossRef]
  29. Wang, X.; Chang, L.; Wang, B.; Wang, D.; Li, P.; Wang, L.; Yi, X.; Huang, Q.; Peng, M.; Guo, A. Comparative proteomics of Thellungiella halophila leaves from plants subjected to salinity reveals the importance of chloroplastic starch and soluble sugars in halophyte salt tolerance. Mol. Cell Prot. 2013, 12, 2174–2195. [Google Scholar] [CrossRef]
  30. Pattanagul, W.; Thitisaksakul, M. Effect of salinity stress on growth and carbohydrate metabolism in three rice (Oryza sativa L.) cultivars differing in salinity tolerance. Ind. J. Exp. Biol. 2008, 46, 736–742. [Google Scholar]
  31. Balibrea, M.; Dell’Amico Rodríguez, J.M.; Bolarín, M.C.; Pérez-Alfocea, F. Carbon partitioning and sucrose metabolism in tomato plants growing under salinity. Physiol. Plant 2000, 110, 503–511. [Google Scholar] [CrossRef]
  32. Higuchi, K.; Kanai, M.; Tsuchiya, M.; Ishii, H.; Shibuya, N.; Fujita, N.; Nakamura, Y.; Suzui, N.; Fujimaki, S.; Miwa, E. Common reed accumulates starch in its stem by metabolic adaptation under Cd stress conditions. Front. Plant Sci. 2015, 6, 138. [Google Scholar] [CrossRef] [PubMed]
  33. Kanai, M.; Higuchi, K.; Hagihara, T.; Konishi, T.; Ishii, T.; Fujita, N.; Nakamura, Y.; Maeda, Y.; Yoshiba, M.; Tadano, T. Common reed produces starch granules at the shoot base in response to salt stress. New Phytol. 2007, 176, 572–580. [Google Scholar] [CrossRef] [PubMed]
  34. Zeeman, S.C.; Thorneycroft, D.; Schupp, N.; Chapple, A.; Weck, M.; Dunstan, H.; Haldimann, P.; Bechtold, N.; Smith, A.M.; Smith, S.M. Plastidial alpha-glucan phosphorylase is not required for starch degradation in Arabidopsis leaves but has a role in the tolerance of abiotic stress. Plant Physiol. 2004, 135, 849–858. [Google Scholar] [CrossRef]
  35. Sitnicka, D.; Orzechowski, S. Cold-induced starch degradation in potato leaves—Intercultivar differences in the gene expression and activity of key enzymes. Biol. Plantarum. 2014, 58, 659–666. [Google Scholar] [CrossRef]
  36. Orawetz, T.; Malinova, I.; Orzechowski, S.; Fettke, J. Reduction of the plastidial phosphorylase in potato (Solanum tuberosum L.) reveals impact on storage starch structure during growth at low temperature. Plant Physiol. Biochem. 2016, 100, 141–149. [Google Scholar] [CrossRef]
  37. Fettke, J.; Albrecht, T.; Hejazi, M.; Mahlow, S.; Nakamura, Y.; Steup, M. Glucose 1-phosphate is efficiently taken up by potato (Solanum tuberosum) tuber parenchyma cells and converted to reserve starch granules. New Phytol. 2010, 185, 663–675. [Google Scholar] [CrossRef]
  38. Fettke, J.; Leifels, L.; Brust, H.; Herbst, K.; Steup, M. Two carbon fluxes to reserve starch in potato (Solanum tuberosum L.) tuber cells are closely interconnected but differently modulated by temperature. J. Exp. Bot. 2012, 63, 3011–3029. [Google Scholar] [CrossRef]
  39. Flores-Castellanos, J.; Fettke, J. The plastidial glucan phosphorylase affects the maltooligosaccharide metabolism in parenchyma cells of potato (Solanum tuberosum L.) tuber discs. Plant Cell Physiol. 2023, 64, 422–432. [Google Scholar] [CrossRef]
  40. Castellanos, J.F.; Khan, A.; Fettke, J. Gradual analytics of starch-interacting proteins revealed the involvement of starch-phosphorylating enzymes during synthesis of storage starch in potato (Solanum tuberosum L.) tubers. Molecules 2023, 28, 6219. [Google Scholar] [CrossRef]
  41. Bradford, M.M. A rapid and sensitive method for the quantitation of microgram quantities of protein utilizing the principle of protein-dye binding. Anal. Biochem. 1976, 72, 248–254. [Google Scholar] [CrossRef]
  42. Orzechowski, S.; Sitnicka, D.; Grabowska, A.; Compart, J.; Fettke, J.; Zdunek-Zastocka, E. Effect of short-term cold treatment on carbohydrate metabolism in potato leaves. IJMS 2021, 22, 7203. [Google Scholar] [CrossRef] [PubMed]
  43. Fettke, J.; Eckermann, N.; Tiessen, A.; Geigenberger, P.; Steup, M. Identification, subcellular localization and biochemical characterization of water-soluble heteroglycans (SHG) in leaves of Arabidopsis thaliana L.: Distinct SHG reside in the cytosol and in the apoplast. Plant J. 2005, 43, 568–585. [Google Scholar] [CrossRef]
  44. Junglee, S.; Urban, L.; Sallanon, H.; Lopez-Lauri, F. Optimized assay for hydrogen peroxide determination in plant tissue using potassium iodide. AJAC 2014, 5, 730–736. [Google Scholar] [CrossRef]
  45. Bergmeyer, H. Methoden der Enzymatischen Analyse, 3rd ed.; Verlag Chemie: Weinheim, Germany, 1974. [Google Scholar]
  46. Jones, M.G.K.; Outlow, W.H.; Lowry, O.M. Enzymic assay of 10−7–10−14 moles of sucrose in plant tissues. Plant Physiol. 1977, 60, 379–383. [Google Scholar] [CrossRef] [PubMed]
  47. Malinova, I.; Fettke, J. Reduced starch granule number per chloroplast in the dpe2/phs1 mutant is dependent on initiation of starch degradation. PLoS ONE 2017, 12, e0187985. [Google Scholar] [CrossRef] [PubMed]
  48. Malinova, I.; Mahlow, S.; Alseekh, S.; Orawetz, T.; Fernie, A.R.; Baumann, O.; Steup, M.; Fettke, J. Double knockout mutants of arabidopsis grown under normal conditions reveal that the plastidial phosphorylase isozyme participates in transitory starch metabolism. Plant Physiol. 2014, 164, 907–921. [Google Scholar] [CrossRef] [PubMed]
  49. Liu, Q.; Li, X.; Fettke, J. Starch granules in Arabidopsis thaliana mesophyll and guard cells show similar morphology but differences in size and number. Int. J. Mol. Sci. 2021, 22, 5666. [Google Scholar] [CrossRef]
  50. Juzoń, K.; Skrzypek, E.; Czyczło-Mysza, I.; Marcińska, I. Effect of soil drought on the yield structure, protein and phenolics content in Pisum sativum and Lupinus luteus. Acta Agric. Hun. 2014, 61, 267–278. [Google Scholar] [CrossRef]
  51. Watkinson, J.I.; Hendricks, L.; Sioson, A.A.; Heath, L.S.; Bohnert, H.J.; Grene, R. Tuber development phenotypes in adapted and acclimated, drought-stressed Solanum tuberosum ssp. Andigena have distinct expression profiles of genes associated with carbon metabolism. Plant Physiol. Biochem. 2008, 46, 34–45. [Google Scholar]
  52. Yang, J.; Zhang, J.; Wang, Z.; Zhu, Q. Activities of starch hydrolytic enzymes and sucrose-phosphate synthase in the stems of rice subjected to water stress during grain filling. J. Exp. Bot. 2001, 52, 2169–2179. [Google Scholar] [CrossRef] [PubMed]
  53. Harb, A.; Krishnan, A.; Ambavaram, M.M.R.; Pereira, A. Molecular and physiological analysis of drought stress in Arabidopsis reveals early responses leading to acclimation in plant growth. Plant Physiol. 2010, 154, 1254–1271. [Google Scholar] [CrossRef] [PubMed]
  54. Albrecht, T.; Greve, B.; Pusch, K.; Kossmann, J.; Buchner, P.; Wobus, U.; Steup, M. Homodimers and heterodimers of Pho1-type phosphorylase isoforms in Solanum tuberosum L. as revealed by sequence-specific antibodies. Eur. J. Bioch 1998, 251, 343–352. [Google Scholar] [CrossRef]
  55. Shoaib, N.; Liu, L.; Ali, A.; Mughal, N.; Yu, G.; Huang, Y. Molecular functions and pathways of plastidial starch phosphorylase (PHO1) in starch metabolism: Current and future perspectives. IJMS 2021, 22, 10450. [Google Scholar] [CrossRef]
  56. Boguszewska-Mańkowska, D.; Pieczyński, M.; Wyrzykowska, A.; Kalaji, H.M.; Sieczko, L.; Szweykowska-Kulińska, Z.; Zagdańska, B. Divergent strategies displayed by potato (Solanum tuberosum L.) cultivars to cope with soil drought. J. Agric. Crop Sci. 2018, 204, 13–30. [Google Scholar] [CrossRef]
  57. Mori, I.C.; Schroeder, J.I. Reactive Oxygen Species activation of plant Ca2+ channels. A signaling mechanism in polar growth, hormone transduction, stress signaling, and hypothetically mechanotransduction. Plant Physiol. 2004, 135, 702–708. [Google Scholar] [CrossRef]
  58. Ashraf, M.; Harris, P.J.C. Photosynthesis under stressful environments: An overview. Photosynthetica 2013, 51, 163–190. [Google Scholar] [CrossRef]
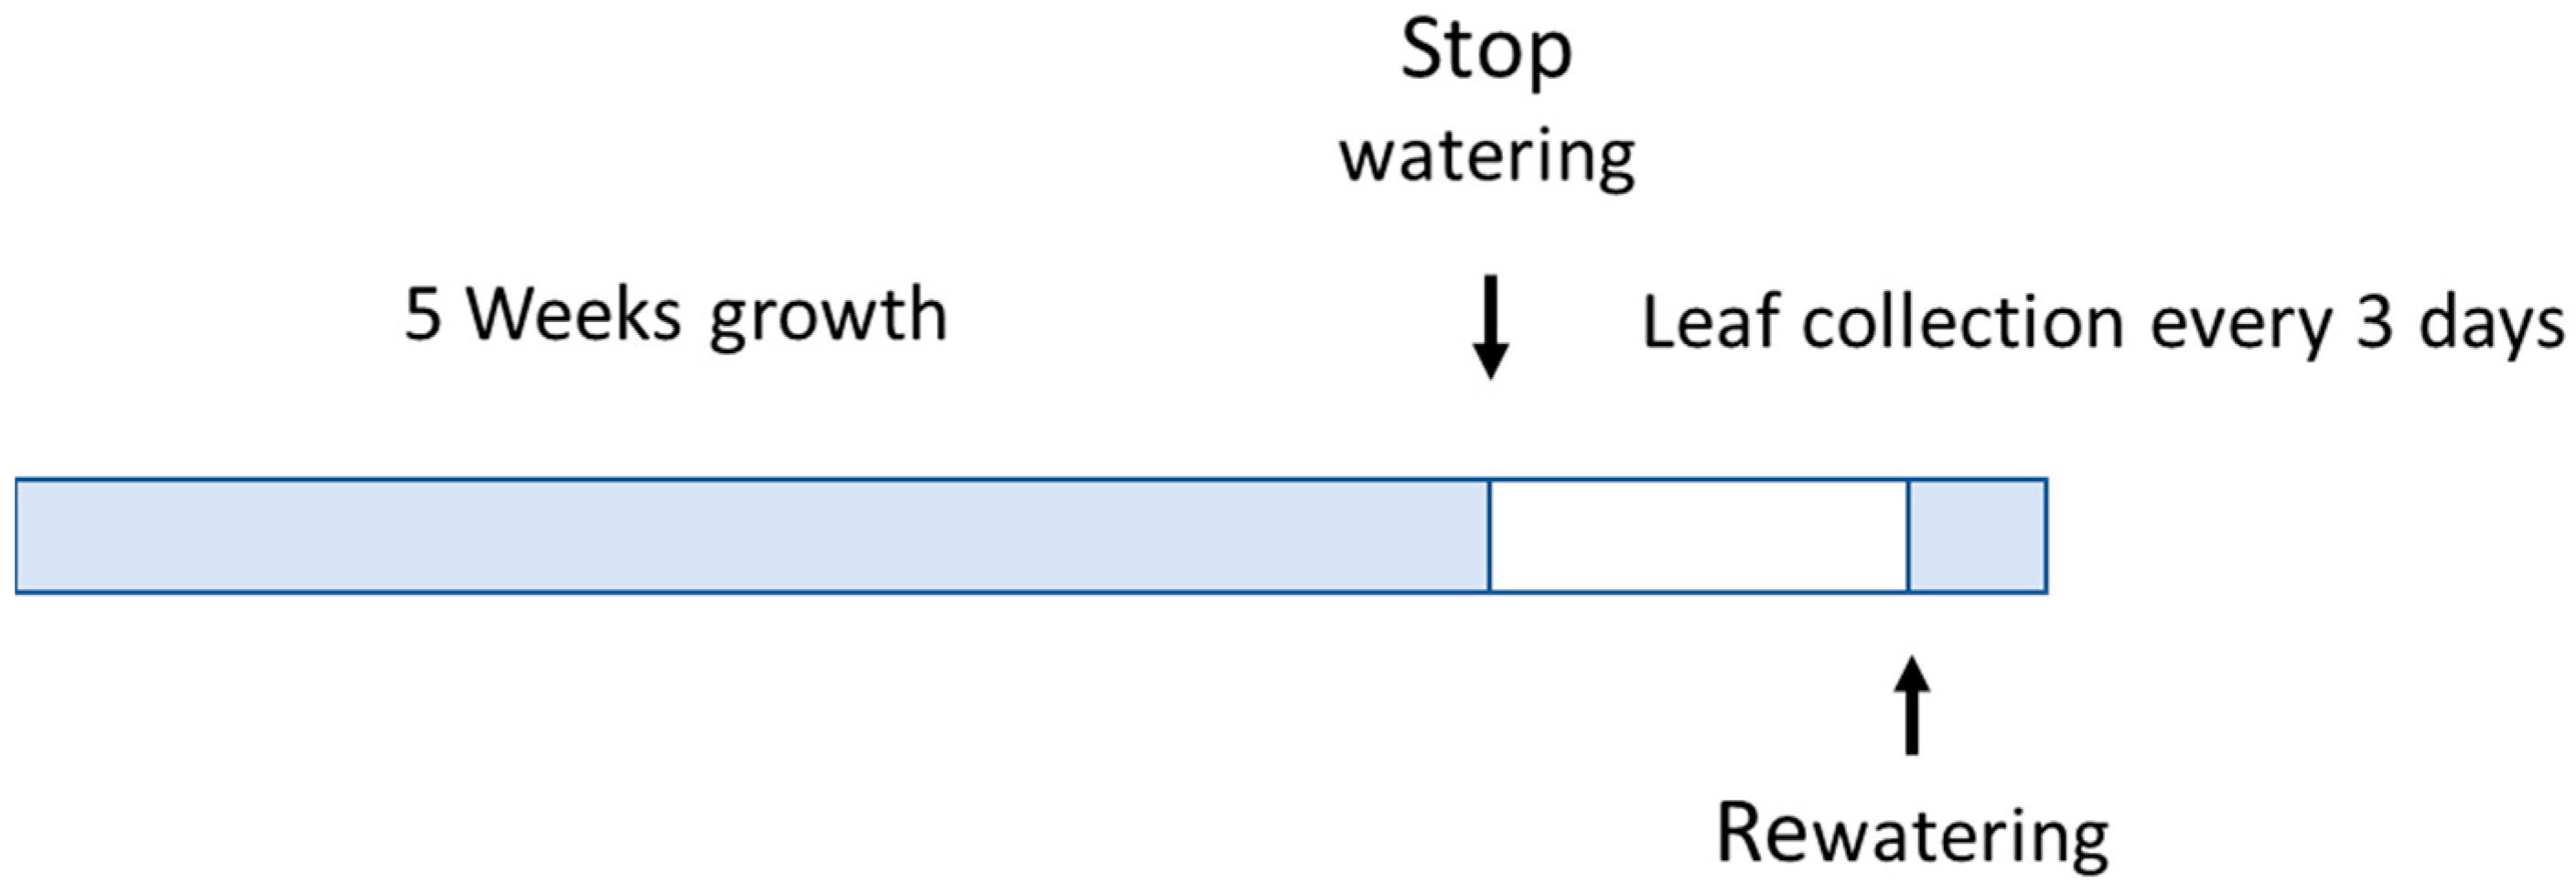
Figure 1. Experimental design of sampling.
Agriculture 14 01491 g001
Figure 2. (a) Starch, (b) glucose, (c) fructose, and (d) sucrose content in the leaves of WT, UP1 (PHO1a), and UP13 (PHO2) potato. The results are the means of at least three replicates ± SD. Different letters at the tops of the bars indicate significant differences (p ≤ 0.05) according to Student’s t-test.
Agriculture 14 01491 g002
Figure 3. Scanning electron microscope analysis of native starch granules isolated from WT, UP1 (PHO1a), and UP13 (PHO2) potato lines. Starch granules were isolated from leaves taken in the middle of the light phase (6 h into the day). The diameters of 500 starch granules per sample were examined. Bars = 2 µm.
Agriculture 14 01491 g003
Figure 4. Laser confocal scanning microscope analysis of starch granules per chloroplast in WT and mutant lines. All samples were taken in the middle of the light phase (6 h into the day), and 200 chloroplasts per sample were examined.
Agriculture 14 01491 g004
Figure 5. (ac) Water saturation deficit and (df) hydrogen peroxide content in leaves from the WT, UP1, and UP13 lines, respectively. The results are the means of at least three replicates ± SD. Different letters at the tops of the bars indicate significant differences (p ≤ 0.05) according to Student’s t-test.
Agriculture 14 01491 g005
Figure 6. (ac) Chlorophyll content and (df) protein content in leaves from the WT, UP1, and UP13 lines, respectively. The results are the means of at least three replicates ± SD. Different letters at the tops of the bars indicate significant differences (p ≤ 0.05) according to Student’s t-test.
Agriculture 14 01491 g006
Figure 7. Representative gels of activity staining of glucan phosphorylases from leaves of potato plants after native PAGE: (a) WT, (b) UP1, and (c) WT13. Each lane was loaded with 50 μg of proteins extracted from the leaves of control and stressed plants after 3, 6, 9, and 12 days (recovery).
Agriculture 14 01491 g007
Table 1. The band intensity was quantified from image scans of PAGE gels using ImageJ software (Java v. 13.0.6 (64-bit), National Institutes of Health, USA). The band intensity is expressed as a percentage relative to individual activities in the control samples. The percentage activity of glucan phosphorylase isoforms and total activity in (A) wild-type (WT) plants, (B) the UP1 line, and (C) the UP13 line, in samples exposed to drought (S) in relation to control samples, are given. Data were obtained after densitometric analysis of PAGE gels in which 50 μg of protein was added to the wells.
A
Sample3 d C3 d S6 d C6 d S9 d C9 d SRec CRec S
PHO2 activity100%65%100%105%100%148%100%76%
PHO1 activity100%46%100%39%100%84%100%197%
Total PHO activity100%57%100%75%100%120%100%93%
B
Sample3 d C3 d S6 d C6 d S9 d C9 d SRec CRec S
PHO2 activity100%83%100%92%100%107%100%67%
PHO1 activity100%227%100%123%100%79%100%133%
Total PHO activity100%91%100%93%100%105%100%71%
C
Sample3 d C3 d S6 d C6 d S9 d C9 d SRec CRec S
PHO2 activity100%130%100%118%100%159%100%29%
PHO1 activity100%102%100%116%100%114%100%90%
Total PHO activity100%118%100%117%100%149%100%35%
Disclaimer/Publisher’s Note: The statements, opinions and data contained in all publications are solely those of the individual author(s) and contributor(s) and not of MDPI and/or the editor(s). MDPI and/or the editor(s) disclaim responsibility for any injury to people or property resulting from any ideas, methods, instructions or products referred to in the content.