Article

Sward Diversity Modulates Soil Carbon Dynamics After Ploughing Temporary Grassland

1
Institute of Crop Science and Plant Breeding, Grass and Forage Science/Organic Agriculture, Christian-Albrechts-University Kiel, Hermann-Rodewald-Straße 9, D-24118 Kiel, Germany
2
Department of Agronomy, Stellenbosch University, Stellenbosch 7600, South Africa
3
Ministry for Energy Transition, Climate Protection, Environment and Nature Schleswig-Holstein, Mercatorstraße 3, D-24106 Kiel, Germany
*
Author to whom correspondence should be addressed.
Agriculture 2025, 15(8), 888; https://doi.org/10.3390/agriculture15080888
Submission received: 6 March 2025 / Revised: 15 April 2025 / Accepted: 17 April 2025 / Published: 19 April 2025
(This article belongs to the Special Issue Research on Soil Carbon Dynamics at Different Scales on Agriculture)

Abstract

:
Grasslands are crucial for sequestering carbon underground, but disturbances like ploughing can lead to significant soil organic carbon (SOC) loss as CO2, a potent greenhouse gas. Thus, managed grasslands should be maintained to minimize GHG emissions. A field study was carried out to investigate how varying sward diversity influences soil respiration following the ploughing of temporary grassland. This study investigated the extent of CO2 emissions from different species mixtures immediately after ploughing, as well as C losses when straw was added to plots, over a 142-day period. The species mixture treatments consisted of a binary mixture (BM), a tertiary mixture (TM), and a complex mixture (CM), which were compared to two bare plot treatments, one of which was also ploughed. The highest CO2 flux occurred immediately after ploughing and was observed in the BM treatment (1.99 kg CO2-C ha−1 min−1). Accumulated CO2 emissions ranged from 0.4 to 14.8 t CO2 ha−1. The ploughing effect on CO2 emissions was evident for bare soils, as ploughing increased soil aeration, which enhanced microbial activity and accelerated the decomposition rate of soil organic matter. However, different mixtures did not affect the C turnover rate. Adding straw to treatments resulted in 43% higher CO2 emissions compared to bare plots. The BM treatment likely induced a higher priming effect, suggesting that the incorporated straw, under different sward residues, influenced CO2 emissions more than the mechanical disturbance caused by ploughing. Findings suggest that using complex species mixtures can be recommended as a strategy to reduce CO2 emissions from incorporated biomass and minimize the priming effect of native soil carbon.

1. Introduction

Besides providing substantial quantities of herbage for animal production, grasslands can offer a variety of ecosystem services [1]. Grasslands can be categorized into temporary and permanent types, each serving distinct roles in agricultural systems [2]. Temporary grasslands are planted for a limited duration, typically as part of crop rotation or as forage sources, with the land being ploughed or replaced by other crops after a few years [3]. These grasslands are useful for improving soil fertility, reducing erosion, and providing forage during the growing season. On the other hand, permanent grasslands are maintained for extended periods without tillage, often for grazing or biodiversity conservation. Permanent grasslands are particularly effective at enhancing carbon sequestration due to their stable root systems and long-term biomass accumulation [4]. Incorporating grass or grass-clover swards into arable crop rotations has long been acknowledged for its positive impact on soil fertility [5]. High concentrations of carbon (C) are found in the topsoil layer in the form of litter, humus, and edaphon. An exchange of C occurs between different pools, with about 80% of terrestrial C bound to the soil, whereas 20% is stored in vegetation [6]. Therefore, grasslands possess the potential to sequester significant amounts of C underground due to their dense root system and higher root mass compared to annual plants [5,7]. This makes grasslands particularly effective in sequestering soil organic carbon (SOC) following land-use change [7,8]. Root C inputs can range between 0.5 and 5.2 t C ha−1 year−1 [9,10]. However, even single soil disturbance events can cause a rapid decline in SOC, with losses of over 10 t C ha−1 per year possible after ploughing [11,12]. These losses occur due to the increased decomposition of SOC in the months following tillage [13]. Furthermore, this could lead to the net release of associated greenhouse gas (GHG) emissions, such as CO2, which affects greenhouse gas budget systems [14].
The inclusion of multispecies in grassland swards has been well documented [15,16,17]. Moreover, it increases the functional diversity and reduces the environmental impact of milk production on the environment [15,18,19,20]. In addition to soil moisture, temperature, and nutrient composition, the botanical composition of grasslands can also influence the levels of CO2 emissions [16,21,22,23]. Different species can accumulate different amounts of C in the soil, and different amounts are lost through respiration [24,25]. Various studies have indicated varying C turnover rates depending on the plant species [16,21,22,23].
Between 20% and 60% of the carbon that enters plants through photosynthesis is stored underground in roots. Some studies indicate different turnover rates of roots depending on the plant species [22]. Through the process of rhizodeposition, root exudates provide soil microbes with C as an energy source, which increases the quantity, diversity, and activity of microorganisms that make up part of the C soil pool [24]. Soil organic matter (SOM) is made up of decomposed plant, microbial, and animal residues, with soil organic carbon (SOC) representing the carbon fraction of SOM. A change in the SOC pool can occur at specific times. Carbon losses can happen through various pathways, such as leaching, erosion, rhizodeposition, and mineralization [26]. Modern agricultural practices can enhance these pathway losses. Therefore, agricultural soils contain less SOC compared to soils that have remained unused or natural. Moreover, potent greenhouse gas emissions can increase due to agricultural management practices such as ploughing.
Soil respiration and CO2 emissions are known to increase as a result of ploughing [13,27,28]. However, mechanical soil management is often required for land use change and/or re-seeding purposes, and therefore, ploughing is still widely adopted in European agriculture. It is believed that the highest C losses occur during the first year after ploughing grassland [11]. However, the immediate effect after ploughing temporary grasslands under various management conditions and different sward species has not been studied extensively. Furthermore, it would be of interest to investigate whether a priming effect exists under different sward mixtures. The priming effect refers to the addition of organic material to the soil, which boosts microbial activity and speeds up the breakdown of existing soil organic carbon. This results in increased CO2 emissions from the soil, even though the added organic material may not be fully decomposed itself. It is therefore important to explore opportunities to reduce CO2 emissions during soil disturbances. It is essential to understand soil processes more in-depth and to investigate which factors could lead to a reduction in soil respiration. However, the impact of varying species composition in temporary grasslands on immediate CO2 emissions following ploughing warrants further research.
Therefore, in the current study, we aimed to assess the effects of three different seeding mixtures on soil respiration after temporary grassland ploughing. We hypothesize that the mechanical effect of ploughing and the amount of incorporated organic material in swards containing different botanical compositions would have a priming effect and influence C turnover after soil disturbance, which leads to high CO2 emissions. Thus, we evaluated the extent to which CO2 is being emitted under diverse grassland mixtures in the context of an on-farm research study in northern Germany. Subsequently, CO2 was measured immediately after ploughing during spring and compared between different sward mixtures and a bare treatment as a control. Accordingly, in this paper, we present results from field trials from 24 measurement dates over 142 days. The findings of this study may offer valuable insights into the CO2 emissions directly after ploughing temporary grassland. This could assist in grassland management and support developing mitigation strategies towards GHG emissions from agriculture, promoting sustainability and environmentally friendly farming.

2. Materials and Methods

2.1. Experimental Site Description

A field study was carried out on both temporary and permanent grassland plots at the Lindhof experimental farm (54°27′ N, 9°57′ E, 10 m.a.s.l.), operated by the Grass and Forage Science group at Kiel University, Germany. The farm is situated along the Baltic Sea, adjacent to Eckernförde Bay. The region experiences a temperate oceanic climate, with a long-term average annual temperature of 9.3 °C and annual precipitation of 754 mm (1991–2020). Weather conditions were monitored using a Vantage Pro2 weather station (Davies Instruments Corp., Hayward, CA, USA), located within 1 km of the experimental site. During the experimental year, rainfall was lower and temperatures were higher compared to the long-term average from 1991 to 2020 [29]. Weather data are shown in Table 1.
The site was previously managed under a five-year arable crop rotation until 1993. Following that period, the land was transitioned to organic farming in accordance with the standards of the “Bioland” association, which prohibits the use of synthetic fertilizers and pesticides. Around the same time, several arable fields were transformed into permanent grassland.
The grass was sown in May 2016 as a catch crop in a cereal rotation and served afterward as pasture for dairy cows or used for cutting in 2017–2019.
The soil at the experimental site is classified as loamy sand to sandy loam. Soil texture is described as 11% clay, 29% silt, and 60% sand with a 1.7% Corg in the topsoil (0–30 cm) [30].

2.2. Experimental Layout and Treatments

In 2020, a study was carried out to investigate CO2 losses as a result of ploughing different species mixtures. An experiment was designed using a randomized block design with various treatments, replicated across three blocks as shown in Figure 1.
Plots were 3 × 3 m. Plots in each block served as control treatments (bare plots [BP], bare not ploughed [BNP]) as well as three plots which were left bare but ploughed. Furthermore, all treatments received straw (+s) in half of the plots, except for the bare treatments without ploughing. Plots were ploughed in spring 2020, except for the control plots, which were kept bare and not ploughed. To prevent any vegetation growth, potential germination was regularly burnt down weekly, ensuring the plots remained free of vegetation while avoiding any mechanical disturbance to the soil. The different species mixtures used are presented in Table 2.

2.3. CO2 Measurements

Carbon dioxide emissions were measured using dark canopy chambers [31], and a CO2 Gas Analyzer LI-820 (LI-COR Biosciences, Lincoln, NE, USA). Basal rings, made from a polyvinyl chloride (PVC) tube with a diameter of 60 cm and a height of 15 cm, were placed inside the soil at a depth of 10 cm in each plot. The installation occurred directly after ploughing, and the basal rings remained in the soil for the duration of the measurement period. The opaque PVC chambers (volume of 0.1 m3 and 35 cm height) were deployed onto the basal rings during measurement and secured with a rubber band to ensure an air-tight seal. Soil air fluxes were measured and recorded for a time stamp of 180 s while the CO2 concentration and temperature were recorded every five seconds. A small fan located inside the chamber circulated the air, which ensured a homogenous atmosphere within the chamber headspace. The chambers were placed on the different plots immediately after ploughing to capture the effluxes as directly as possible. CO2 flux measurements began immediately after ploughing on 23 March 2020, with subsequent measurements on 24 March, 27 March, 31 March, and 3 April. Thereafter, measurements were conducted approximately once a week until 11 August 2020, totaling 24 measurements over 142 days.
Soil moisture and temperature inside the chamber of the CO2 Gas Analyzer LI-820 (LI-COR Biosciences, Lincoln, NE, USA) were recorded for each treatment and block during every measurement.
While the priming effect was not directly measured in this study, it was inferred from the short-lived spikes in CO2 release observed immediately following ploughing. The priming effect refers to the stimulation of soil organic carbon decomposition due to changes in environmental conditions or microbial activity, often triggered by disturbances like ploughing [32]. In this case, the observed CO2 spikes suggest that microbial activity was temporarily enhanced, leading to an increased decomposition of soil organic carbon.

2.4. Flux Calculations

The CO2 flux was calculated using the method outlined by Flessa et al. (1998) [33] and Drösler (2005) [34], and can be found in Equation (1). Accordingly, negative values indicated a loss to the atmosphere within the ecosystem. An ideal gas behavior was assumed.
F C O 2 = M V ° m   V A   c t
where F C O 2 is the calculated flux (µg CO2 m−2 s−1), M is the molar mass of CO2 (44.01 g mol−1), V ° m is the normal volume of ideal gas (22.4141 L mol−1), V is the chamber volume (m3), A is the collar area (m2), and Δc/Δt is the change in concentration within the chamber headspace over time (CO2: ppb h−1).
The accumulated CO2 emissions were calculated by plot-based linear interpolation between the measured daily fluxes for each replication. The accumulated period included 24 measurement days within a time frame of 142 days.

2.5. Above- and Belowground Sampling

Aboveground biomass was sampled by cutting the different mixtures before ploughing in the spring (23 March 2020). Quadrats of 0.5 m2 were used to collect aboveground cuttings. Samples from each plot were randomly cut by hand-operated clippers, placed in a bag, and weighed. The samples were then dried in an oven at 60 °C for 48 hours. The dry matter (DM) content and forage yield (t DM ha−1) were subsequently determined. The dried samples were milled to a particle size of 1 mm using an Ultra Centrifugal Mill (ZM200, Retsch GmbH, Haan, Germany) for analysis.
Soil samples from each plot were collected on 17 March 2020, at three depths: 0–30, 30–60, and 60–90 cm, to assess the N and C content. The samples were oven-dried at 40 °C, then sieved to a particle size of 2 mm and finely ground using a roller grinder. The N and C content, both aboveground and belowground, was directly measured using an elemental analyzer (Vario Max CN, Elementar Analysensysteme GmbH, Hanau, Germany).
Soil bulk density was measured by extracting intact soil cores (five times) at depths of 5 and 15 cm. The undisturbed soil samples were collected using a puncture cylinder with a volume of 100 cm3. These samples were oven-dried at 105 °C for a minimum of 16 hours to ensure complete moisture removal. The soil bulk density was calculated to be 1.61 ± 0.06 g cm3.
Root samples were collected from each plot at depths of 0–15 and 15–30 cm. The roots were thoroughly washed to remove soil and then dried at 58 °C until they reached a constant weight. The dried samples were then ball milled (model MM-2; Retsch GmbH, Haan, Germany) to a particle size of less than 1 mm. The N and C content was directly measured using an elemental analyzer (Vario Max CN, Elementar Analysensysteme GmbH, Hanau, Germany).

2.6. Adding Straw

To trace the fate of ploughed-in litter, a small amount of 13C-labelled wheat straw was incorporated into each treatment and block on 24 March 2020 [35]. Ploughing was performed to a depth of approximately 25 cm and involved only mechanical soil disturbance without the incorporation of straw at this stage. Since the straw was enclosed in mesh litter bags, it could not be ploughed in and was instead inserted manually into the soil.
PVC collars were installed in the soil, and 5 g of labeled wheat straw was placed in a mesh bag net that allowed microbial access. The nets were then manually inserted into the soil within each PVC collar.
Gas samples were collected using a 30 mL syringe through a septum cap located at the top of the closed chamber and immediately transferred into 12 mL pre-evacuated exetainers (Labco, High Wycombe, Wales, UK). Samples were taken at 30-second intervals. The isotopic composition of the gas samples was analyzed using an elemental analyzer-isotope ratio mass spectrometer (EA-IRMS) to determine the 13C signature.

2.7. Statistical Analysis

The statistical analysis was conducted using R Studio 4.2 (2022) [36]. Data evaluation began with the selection of an appropriate statistical model. It was assumed that the data followed a normal distribution and exhibited heteroscedasticity with respect to the different plant mixtures, ploughing, and straw application treatments. These assumptions were verified through a visual graphical residual analysis [37]. The statistical model treated the treatment as a fixed factor, while the block was considered a random factor. Significance was set at p ≤ 0.05. Based on this model, an analysis of variance (ANOVA) was performed to test the hypothesis. Additionally, multiple contrast tests (e.g., see Bretz et al. 2011 [38]) were applied to compare the various levels of the tested treatments.

3. Results

3.1. Biomass, Carbon, and Nitrogen
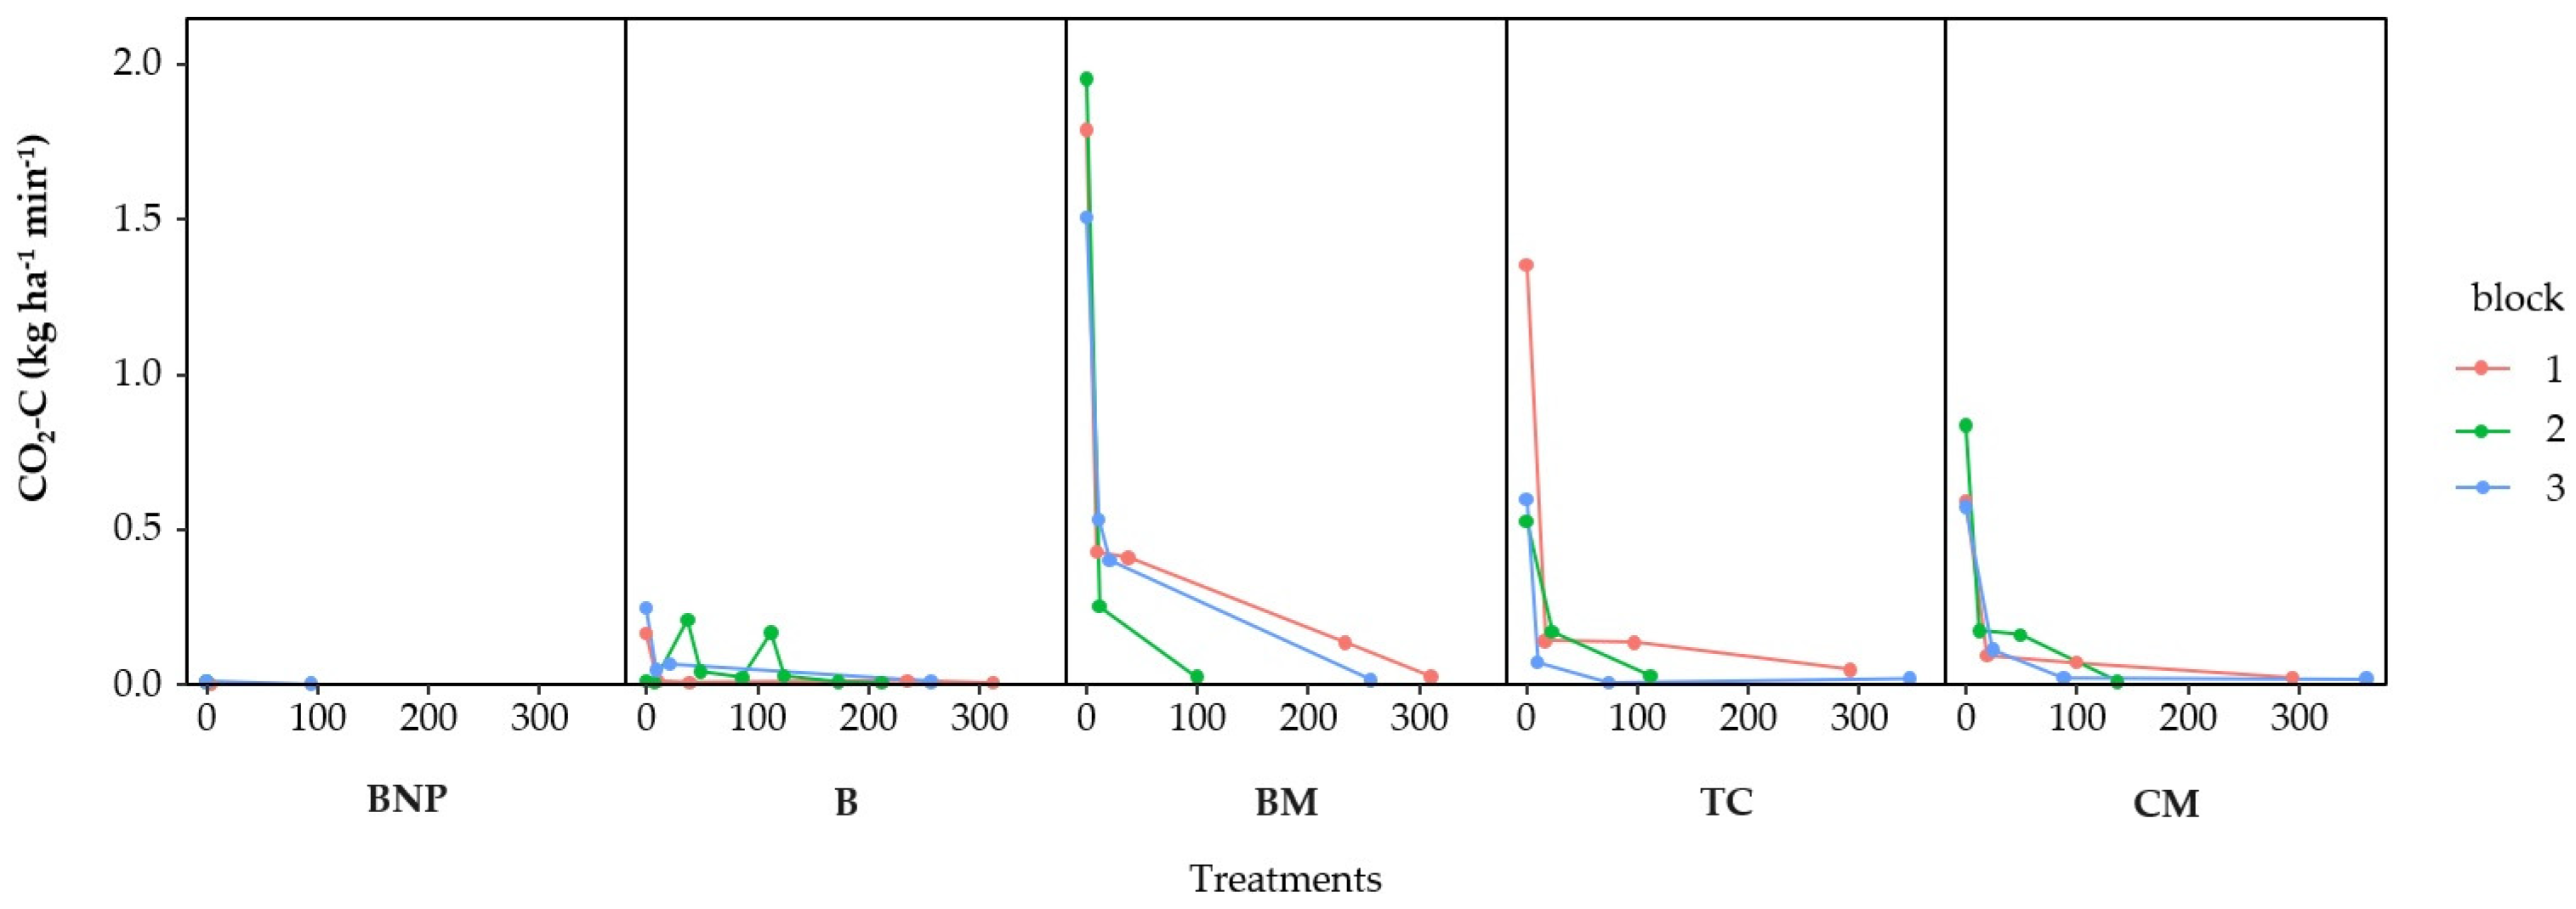
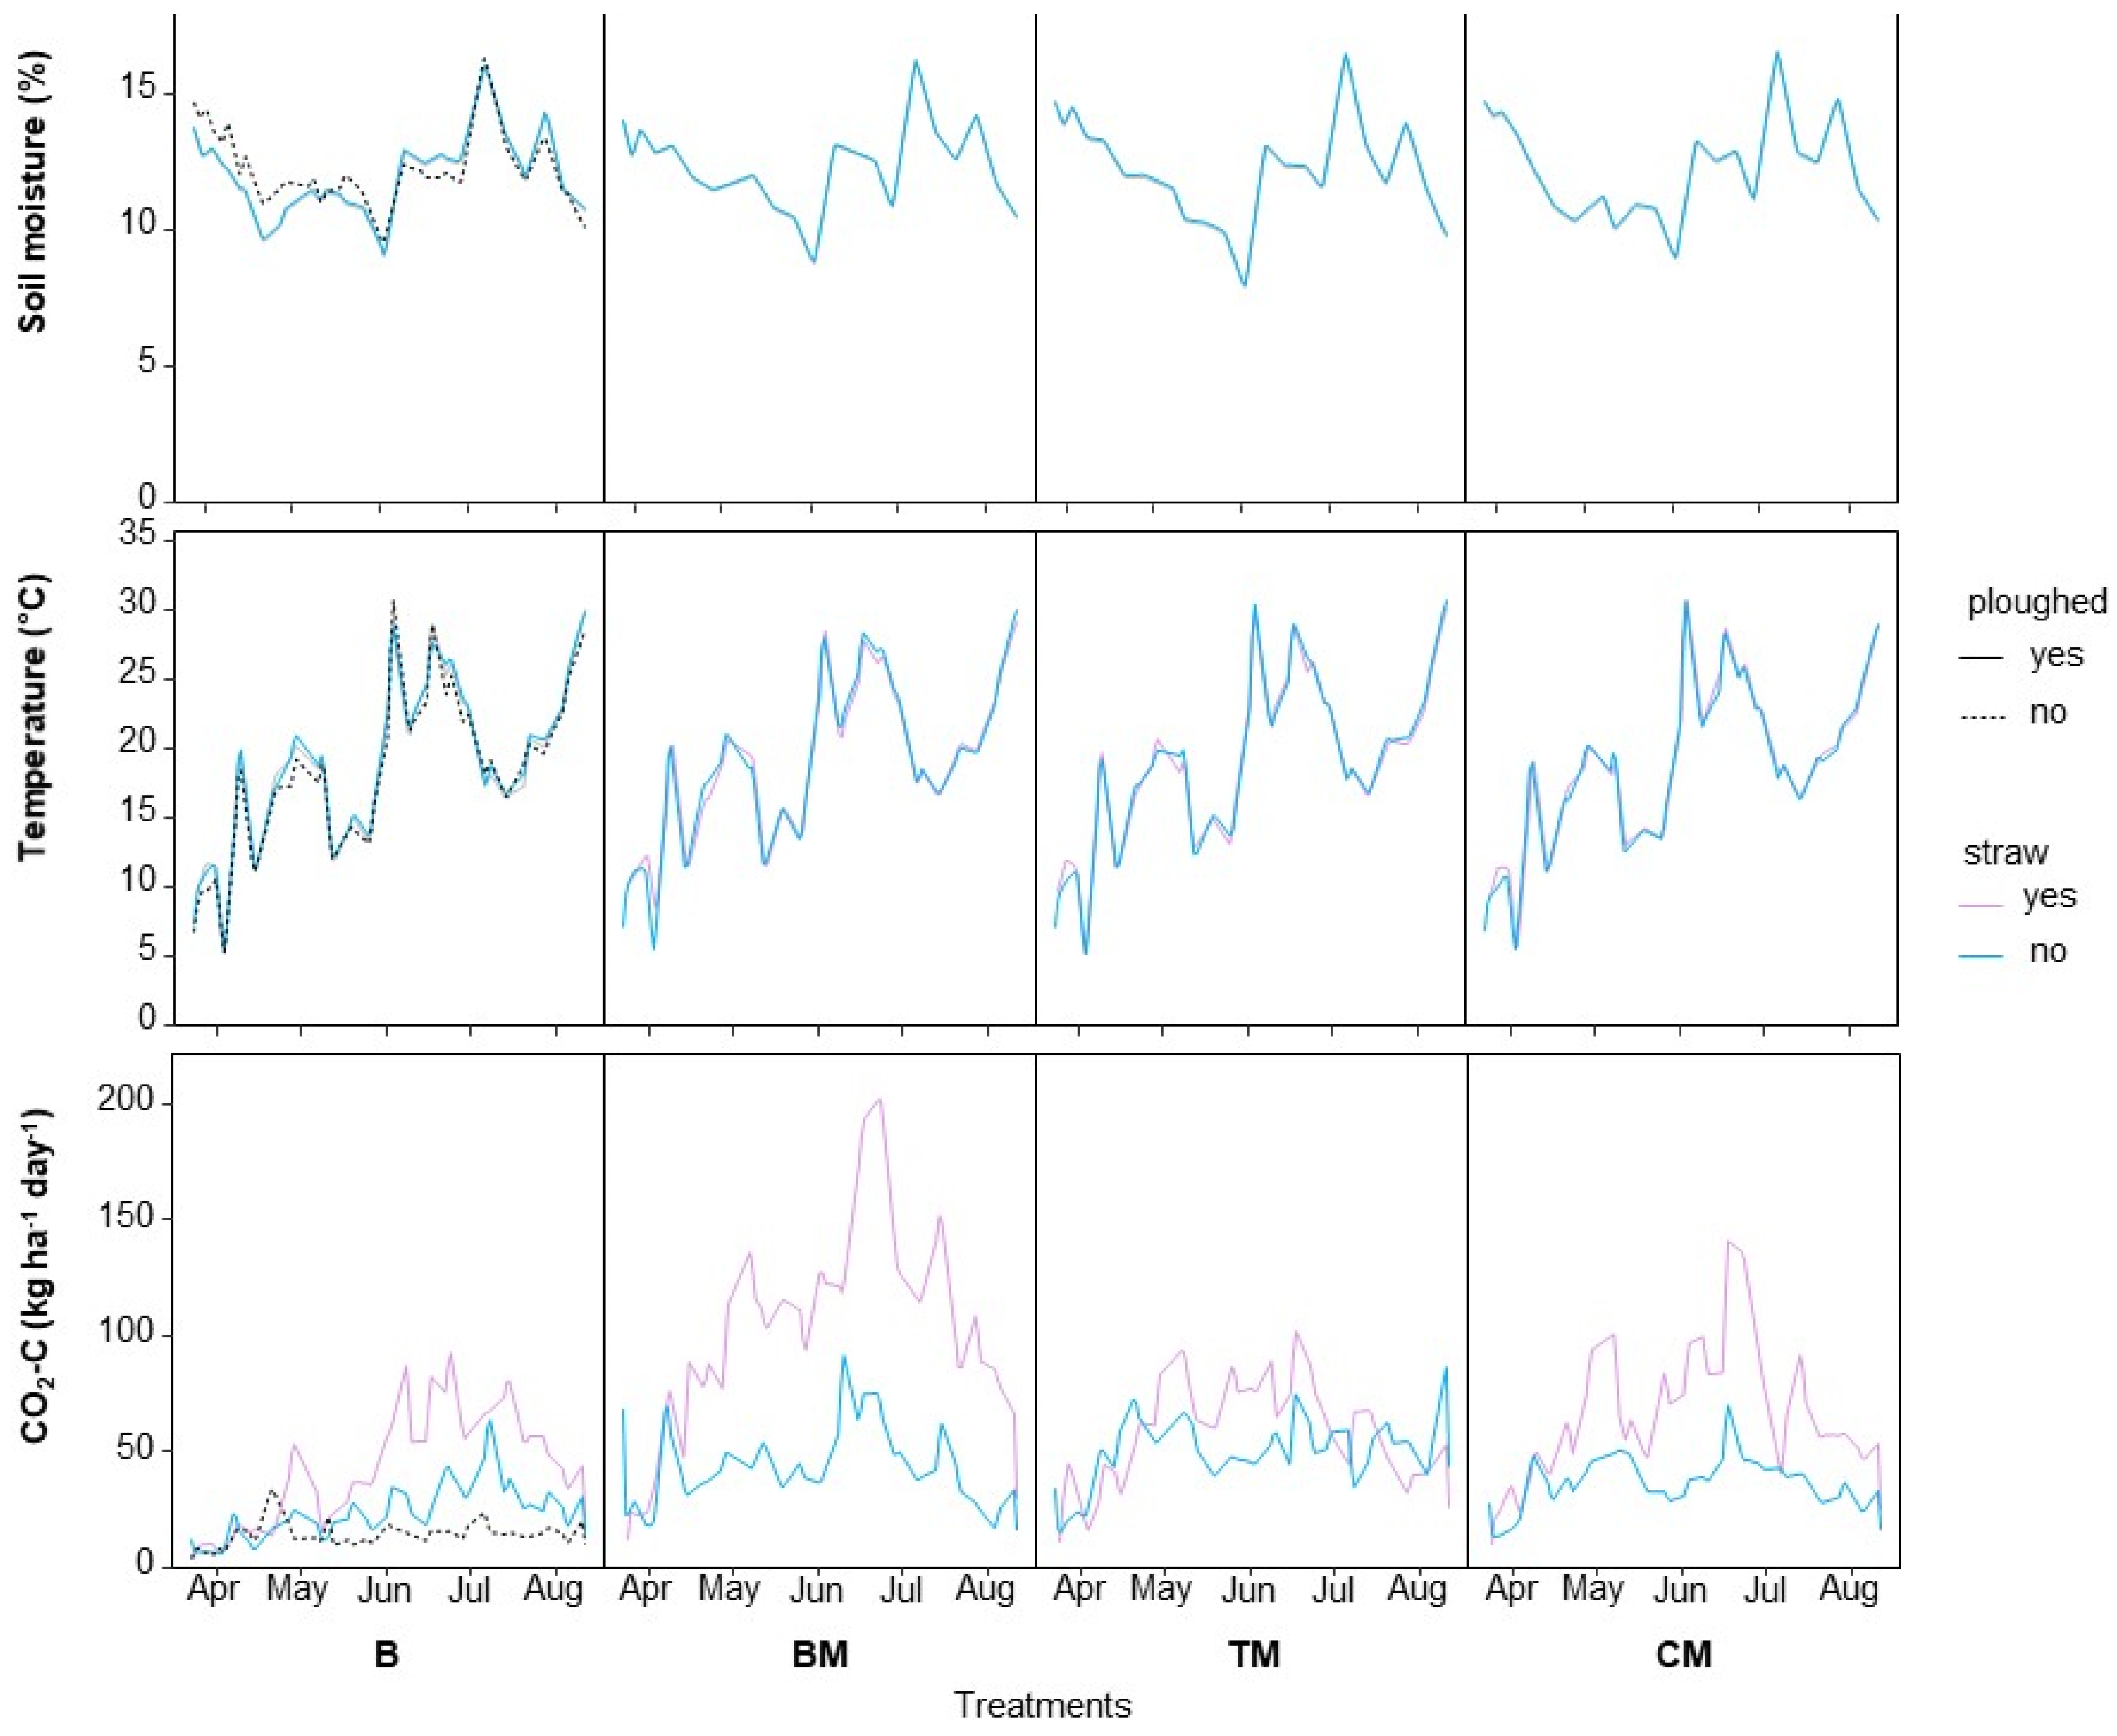
The biomass, C, and N yields aboveground and belowground, as well as the totals of the different mixtures, are shown in Table 3. The highest aboveground and belowground biomass was observed in the BM treatment, with values of 1.06 ± 0.16 t DM ha−1 and 13.70 ± 1.6 t DM ha−1, respectively. In contrast, the lowest aboveground biomass was found in the CM treatment (0.72 t DM ha−1), while the lowest belowground biomass was recorded in the TM treatment (11.00 ± 2.6 t DM ha−1). The belowground biomass differed significantly within the bare treatments, where BNP had a higher belowground biomass (2.13 ± 0.76 t DM ha−1) compared to the B treatment (0.92 ± 0.51 t DM ha−1). However, no differences (p > 0.05) were observed in the aboveground and belowground biomass between the different mixtures (BM, TM, and CM) used.
The highest C- and N yield in aboveground and belowground biomass was observed in the BM treatment (0.47 ± 0.07 t ha−1 and 6.54 ± 0.41 t ha−1, respectively, for C and 33.30 ± 6.4 kg ha−1 and 242.00 ± 15.3 kg ha−1, respectively, for N). The lowest C yield in the aboveground biomass was observed in the CM treatment (21.60 ± 1.4 t ha−1), and the TM treatment had the lowest N yield (210.00 ± 48.7 kg ha−1) in the belowground biomass. Ploughing had a significant effect on the C- and N-yields within the bare treatments, where BNP had higher C- and N-yields in the belowground biomass (1.14 ± 0.27 t ha−1 and 39.00 ± 14.4 kg ha−1, respectively) compared to just the B treatment (0.44 ± 0.25 t ha−1 and 16.90 ± 8.9 kg ha−1). However, no differences (p > 0.05) were observed in the C- and N-yields between the different mixtures (BM, TM, and CM) used.
The highest C/N ratio in the belowground biomass was found in the CM treatment (29.0 ± 0.0), while the lowest was observed in the TM treatment (25.5 ± 0.0). All three of the mixtures (BM, TM, and CM) differed (p < 0.05) in terms of C/N ratio from each other during the experimental period in the belowground biomass as well as for the totals. The total C/N ratio from the TM treatment (23.7 ± 0.3) differed from all other treatments, including the BNP and B treatments. Ploughing did not have an effect (p > 0.05) on the C/N ratio between the bare treatments.

3.2. CO2 Fluxes

The CO2 fluxes observed within 6 hours after ploughing are shown in Figure 2. We observed only one brief peak in CO2 emissions over the various treatments immediately after ploughing within the first few minutes. The CO2 fluxes had a rapid decline in the first hour and returned to values close to zero. The maximum CO2 flux was observed in the BM treatment and ranged up to 1.99 kg CO2-C ha−1 min−1, with the lowest flux observed in the B treatment, which ranged up to 0.001 kg CO2-C ha−1 min−1. However, the true maximum flux may have occurred before that measurement. Ploughing led to higher CO2 fluxes in the bare treatment (B) compared to the bare treatment without ploughing (BNP). No other peaks in CO2 fluxes were observed for the remainder of the experiment.
The CO2 fluxes (excluding day 1), soil moisture, and temperature for the remainder of the experiment (24 March 2020 to 11 August 2020) are shown in Figure 3. From our results, we observed a difference in CO2 fluxes between the bare treatments that were ploughed. Furthermore, treatments that received added straw had higher CO2 fluxes compared to the treatments without added straw. Peaks in CO2 fluxes were observed between June and August across all treatments. The highest fluxes occurred in the BM treatment, which received added straw, while the lowest CO2 fluxes were recorded in the bare treatment without ploughing (BNP) (Figure 3).

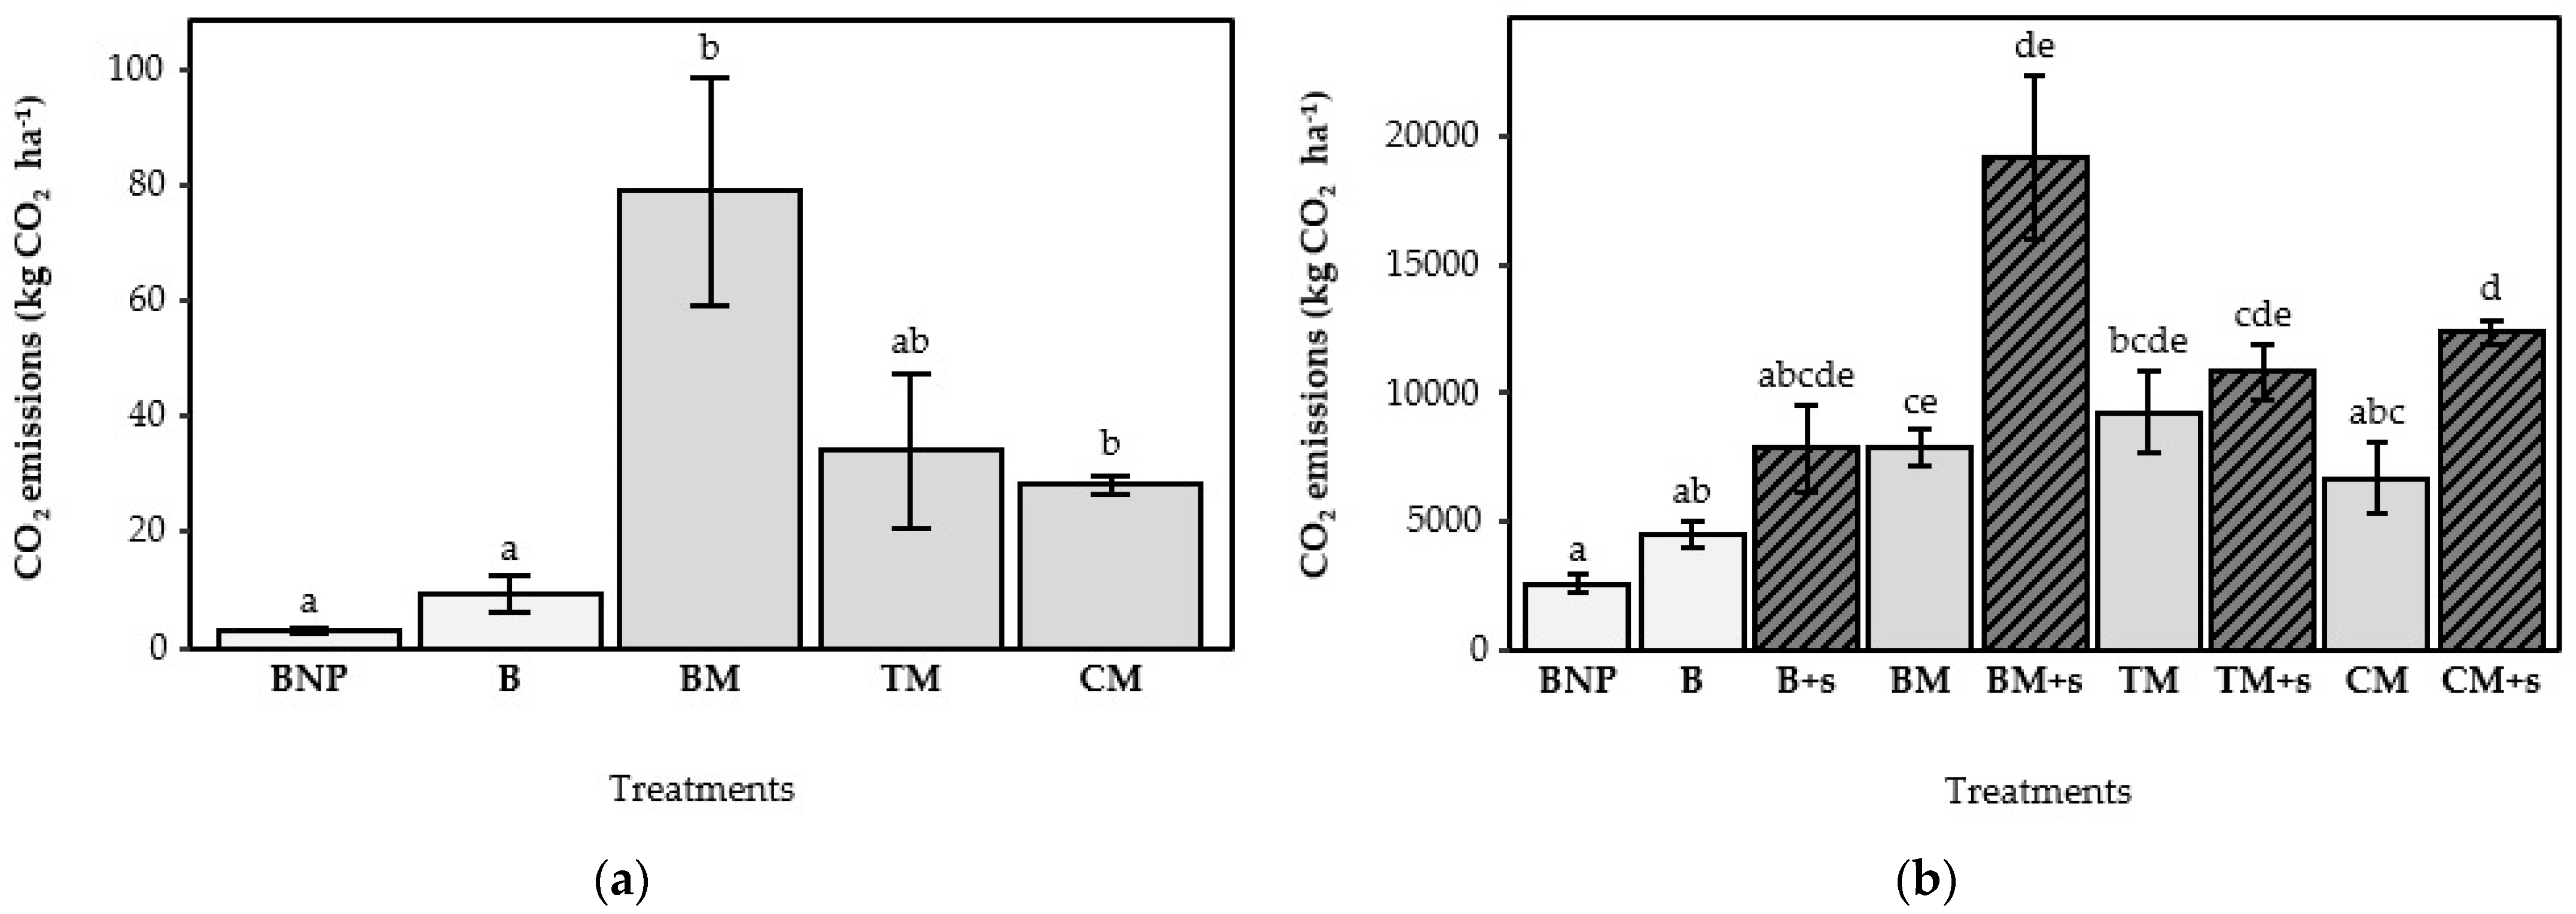
3.3. Accumulated CO2-Losses

Figure 4a shows the mean accumulated CO2 emissions on the first day after ploughing. The calculated accumulated CO2 emissions ranged from 1.1 to 108.0 kg CO2 ha−1 on the first day. The BM treatment resulted in the highest accumulated CO2 emissions (78.9 kg CO2 ha−1), while the BNP treatment produced the lowest CO2 emissions (2.99 kg CO2 ha−1). The BM and CM treatments showed higher CO2 emissions compared to the bare plots (BNP and B) (p < 0.05). However, the TM treatment showed no significant difference compared to the other treatments or the bare plots. Furthermore, ploughing between the bare plots did not show differences on the first day of the experiment.
After day one, straw was added to the various treatments and included in the total mean accumulated CO2 emissions over the rest of the experimental period (24 March 2020 to 11 August 2020). Differences in total accumulated CO2 emissions between treatments are shown in Figure 4b. The BM treatment with added straw resulted in the highest total accumulated CO2 emissions (19,197 ± 3218 kg CO2 ha−1), whereas the BNP treatment resulted in the lowest CO2 emissions (2555 ± 361 kg CO2 ha−1). A significant difference (p < 0.05) in total accumulated CO2 emissions was observed in the CM treatment between the treatment without straw and the treatment that received added straw. The different mixtures (BM, TM, and CM) did not show significant (p > 0.05) differences among each other. Incorporating straw into the mixtures significantly increased total CO2 emissions (p < 0.05) compared to the plots without added straw. Overall, the straw-enriched treatments produced 43% higher CO2 emissions than those without straw. Ploughing between the bare plots did not show differences for the total accumulated CO2 emissions for the rest of the experimental period.

4. Discussion

4.1. Biomass, C, and N Yield

The BM treatment had the highest total biomass and, accordingly, the highest C and N yields. Other studies suggest that multispecies mixtures are related to higher C accumulation and increased microbial activity in the soil [16,23], which was not the case in our study. Our results indicated that the CM treatment had lower total biomass compared to the BM treatment; however, the difference was not significant.
According to our results, the CM treatment had the lowest aboveground biomass compared to the other two treatments (BM and TM). Eriksen et al. (2012) [21] observed the opposite, concluding that the aboveground biomass increased as the herb content rose. However, our CM treatment yielded the most biomass belowground compared to the other treatments. This could be due to root samples, which were only collected to a depth of 30 cm, and therefore, the possibility that the root mass of the mixtures containing red clover was underestimated exists, as red clover roots could reach a depth of up to one meter [39].
Some species mixtures, such as those including Lolium perenne (perennial ryegrass) and legume-based species (clover, alfalfa), are known to have deeper and denser rooting systems, which contribute to improved soil structure and C sequestration [40,41]. However, in temporary grasslands, variations in root composition influence the rate of SOM decomposition, which should be taken into account when assessing net C storage in the cropping system [21]. More lignin is found in thicker, woody roots compared to fine roots. The decomposition rate occurs faster in fine roots since higher lignin contents slow down turnover rates [42].
Roots within the vegetated treatments (BM, TM, and CM) contributed the largest part of residual organic matter at the time of soil disturbance. However, roots were still found in the BNP treatment even though no plants were present. A possible explanation for this could be the presence of residual root systems from previous vegetation, which have a slow decomposition rate. Furthermore, small samples were collected from these plots and extrapolated to hectares, which resulted in some bare plots without root biomass and some bare plots having comparatively high root biomass.
Our study showed a higher N content in the belowground biomass for the ryegrass treatment (BM). The same has been observed in other studies [43] and is in line with higher amounts of N being allocated to roots from grass species compared to non-grass species [44,45]. However, it should be noted that observed differences in N concentration could also be influenced by biomass production, where lower biomass can lead to higher N concentrations due to a concentration effect, and higher biomass may result in the dilution of N content. Therefore, incorporating plant species such as ryegrass can decrease the nitrate level in soil as well as decrease N2O emissions [46], thereby adding to a better N budget on-farm in low-input systems.

4.2. Impact of Soil Disturbance and Vegetation on CO2 Emissions After Ploughing

Soil disturbance, including practices like ploughing, is widely recognized in the literature as a factor that increases CO2 emissions [13,14,28]. The same has been observed in our study, which indicated a significant difference between CO2 fluxes from the ploughed treatments compared to the undisturbed treatment. Previous studies related to the topic indicated that increased CO2 emissions after soil disturbance were only observed for hours [28,47]. Our results showed the same trend, where CO2 emissions were highest within the first few hours (6 hours) after ploughing. The same was observed in Willems et al. (2011) [28], which showed only short-term differences compared to the control treatment after ploughing within the first five hours. From our study, we observed the CO2 losses from the treatments to be at the higher end of values reported elsewhere. Willems et al. (2011) [28] recorded a peak CO2 flux of 6.91 g CO2 m−2 h−1 right after ploughing. In contrast, our observations in the BM treatment revealed a significantly higher peak flux of 15.2 g CO2 m−2 h−1. This peak is most likely caused by the sudden availability of oxygen and aeration, which coincides with soil disturbance [48]. Mineralization rates were favored by the physical disturbance of soil and aggregate breakup during ploughing. This caused more oxygen exposure to the surface when straw was ploughed into the soil. Soil microorganisms can consume this oxygen in a very short amount of time. Furthermore, the C trapped inside macro- and micropores released after ploughing can therefore cause a steep increase in CO2 emissions directly after ploughing [48].
Carbon dioxide emissions are related to soil mineralization [28], and as a result, CO2 emissions can increase because of easily degradable C and N found in the belowground biomass. Additionally, environmental conditions, along with the quantity and chemical properties of residual biomass, play a role in driving the decomposition of organic matter during ploughing. In general, root growth in grasslands is highest during early spring. This could mean that newer root biomass was formed during spring, just before ploughing, which was easily decomposable, leading to high initial CO2 emissions in our study from the vegetated treatments. Moreover, root production is closely connected to the SOM pool, and therefore, the reasons that influence the C turnover rates are to be found in the rhizosphere. As a result, deep-rooted legumes influence the deeper SOC pools by contributing biomass further into the soil [24], with root turnover decreasing at greater soil depths [49]. It is therefore possible that deep-rooted red clover found in the TM and CM mixture led to less CO2 emissions because less C was lost in the topsoil layer during ploughing. On the contrary, grass species and white clover have fine roots and therefore have a high capacity to sequester C [50]. It could be argued that the BM treatment, which contained a mixture of ryegrass and white clover, had a lot of fine roots close to the surface and therefore a high potential to lose the C stored in them. This was probably the reason that we observed more C losses from our BM treatment.
Vegetated plots compared to bare plots prior to ploughing had a greater impact on the CO2 emissions. Our results indicated that ploughing the vegetated plots, which contained the mixtures, resulted in higher CO2 emissions. However, our study did not contain a treatment that remained vegetated without being ploughed, so no direct statement can be made by us concerning the influence of ploughing with regard to vegetation on the CO2 emissions. Much of the SOC is stored in plant materials. The absence of plants on our bare plots meant that little C was present, which could probably escape as CO2 after ploughing. The lack of C and N found in the bare plots resulted in very little CO2 emissions, irrespective of ploughing. Reinsch et al. (2018) [13] found a strong relationship between biomass present on plots and CO2 fluxes. Furthermore, ploughing also affects other GHG losses after renovation [51], and can lead to NO3 leaching losses from sandy soils, which pose other environmental threats [52].

4.3. The Effect of Adding Straw on CO2 Losses

At the time when straw was incorporated into the plots, no plants were present. These plots were either bare or had been ploughed, which means no autotrophic respiration could have taken place, as photosynthesis did not occur. Therefore, the CO2 emissions originate exclusively from the decomposition of roots, plant residues, and added straw. The priming effect [53], where higher decomposition rates of organic matter occur due to an increase in the microbial biomass and enzyme activity of soil microbes after plant material is added [54], could therefore also help to explain the increased CO2 emissions observed in our study.
It was hypothesized that adding straw to the treatment plots would release more CO2 throughout the experiment compared to the B and BNP treatments. Our results confirmed this hypothesis, and we observed significant differences in CO2 emissions between treatments with and without added straw. This was likely due to the addition of young organic material, which decomposed quickly, leading to a significant amount of CO2 being released in the short term on plots with added straw. It has previously been shown that the C turnover rate is affected by the C/N ratio [42]. Our BM treatment had a narrower C/N ratio compared to the CM treatment, which probably led to a more rapid turnover of roots.
Although the amount of straw added was relatively small (~177 kg ha−1), the significantly higher CO2 emissions observed in the BM+s and CM+s treatments can likely be explained by interactions between the added straw and the pre-existing root-derived organic matter in these mixtures. The clover-grass mixtures, particularly in BM and CM treatments, contributed substantial belowground biomass, which, when combined with the labile carbon from the straw, may have triggered a pronounced priming effect. This would have stimulated microbial activity and accelerated the decomposition of both fresh and native organic matter. In contrast, the TM treatment likely lacked the same synergistic potential, resulting in lower CO2 emissions. These dynamics highlight how even small organic inputs can significantly impact carbon fluxes when interacting with biologically active root zones.
Carbon input in the form of straw enhances the SOC concentration. This, in turn, is easily mineralizable and leads to enhanced CO2 emissions. Furthermore, the microbial biomass under straw return may affect C fluxes through the stimulation of decomposition of SOC and straw [55]. Liu et al. (2014) [56] found in a meta-analysis that the inclusion of straw leads to significantly higher SOC concentrations in the soil as well as high CO2 emissions. A possible reason for the increase in CO2 emissions could be the ability of straw to increase the soil moisture as well as influence the soil porosity [57]. However, it should be noted that shortly after straw incorporation, no immediate increase in soil moisture can be expected, as the dry straw may initially absorb water from the soil. Later, after precipitation, the straw can hold more water than soils without straw. Therefore, the water-holding capacity of straw could lead to higher emissions from sandy soils (which were also the soil type from our experiment), whereas increased soil porosity affects the emissions from loamy soils. In addition, soil type and aggregate structure influence the mineralization of organic C [58].
The processes governing C and N fluxes are closely interconnected and are typically influenced by climatic and soil conditions, site factors, and management practices. The increased mineralization in the plough layer (0–20 cm) after soil disturbance may partly be due to the additional C sequestered by temporary multispecies grasslands [21]. However, the decomposition of plant materials becomes more relevant with time, and together with favorable conditions, this root biomass could lead to high turnover rates, which form an integral part of the nutrient cycling of grasslands [59].
Some studies indicate the effect of botanical composition on soil respiration [16,21,23,40]. Steinbeiss et al. (2008) [16] found that C losses were notably lower in areas with greater species richness. The same observation was made in our study, which indicated that C losses from our CM treatment were less than the losses associated with the BM and TM treatments. This was likely due to C being stored in the top 5 cm of soil [60] in the BM and TM treatments, for a pattern common in grass species with shallow root systems that concentrate most of their root biomass in the upper soil layers.

4.4. Limitations

The lack of non-ploughed sward treatments restricts the ability to thoroughly evaluate the direct impact of ploughing on CO2 emissions. Additionally, variations in soil sampling depths for C and N estimation, belowground biomass, and soil bulk density pose challenges in establishing clear relationships among these variables, potentially obscuring correlations and complicating data interpretation. Furthermore, this study was not replicated over a second year, which means that the measured effects are strongly influenced by the climatic conditions of a single measurement year. Moreover, since temperature and water are well-known factors that significantly influence the decomposition of organic matter in the soil [61], the results may not fully reflect the potential variability of these effects under different climatic conditions.

5. Conclusions

This study demonstrated the losses of SOC shortly after ploughing. Our results indicated that high CO2 fluxes occur within 6 hours after ploughing. However, the peak observed was short-lived. The different mixtures did not affect the C turnover rate, and therefore, the hypothesis that a multispecies mixture affects the amount of C released from managed agricultural soils could not be confirmed from our results. However, even though the mechanical effect of ploughing led to high CO2 emissions, the addition of straw resulted in higher additional CO2 emissions, and the priming effect was observed to be stronger in the BM treatment. Therefore, the incorporated straw seems to affect the CO2 emissions more than ploughing itself. This increases the C turnover rate, and from our study, it could be concluded that the mineralization of roots and added straw seems to be the drivers for high CO2 emissions after ploughing.
Future research should focus on understanding the processes and factors that determine the extent to which incorporated biomass from grassland ploughing contributes to the buildup of soil organic matter (SOM). In general, grassland management should prioritize promoting diverse plant mixtures that offer multiple benefits, including stable forage yield and quality, enhanced plant and soil biodiversity, and increased potential for carbon sequestration.

Author Contributions

Conceptualization, R.L., A.P., F.T. and H.A.; methodology, A.P. and H.A.; software, H.A. and C.K.; validation, A.P. and F.T.; formal analysis, C.K. and H.A.; investigation, H.A.; resources, F.T.; data curation, C.K. and H.A.; writing—original draft preparation, H.P.J.S. and H.A.; writing—reviewing and editing, A.P., C.K. and F.T.; visualization, H.P.J.S., H.A. and A.P.; supervision, A.P.; funding acquisition, F.T. All authors have read and agreed to the published version of the manuscript.

Funding

This research received no external funding.

Data Availability Statement

The raw data supporting the conclusions of this article will be made available by the authors on request.

Acknowledgments

The authors acknowledge financial support by Land Schleswig-Holstein within the funding program Open Access Publikationsfonds.

Conflicts of Interest

The authors declare no conflicts of interest.

References

  1. Power, A.G. Ecosystem Services and Agriculture: Tradeoffs and Synergies. Philos. Trans. R. Soc. B Biol. Sci. 2010, 365, 2959–2971. [Google Scholar] [CrossRef] [PubMed]
  2. Mesbahi, G.; Michelot-Antalik, A.; Goulnik, J.; Plantureux, S. Permanent Grassland Classifications Predict Agronomic and Environmental Characteristics Well, but Not Ecological Characteristics. Ecol. Indic. 2020, 110, 105956. [Google Scholar] [CrossRef]
  3. Hoeffner, K.; Beylich, A.; Chabbi, A.; Cluzeau, D.; Dascalu, D.; Graefe, U.; Guzmán, G.; Hallaire, V.; Hanisch, J.; Landa, B.B.; et al. Legacy Effects of Temporary Grassland in Annual Crop Rotation on Soil Ecosystem Services. Sci. Total Environ. 2021, 780, 146140. [Google Scholar] [CrossRef]
  4. Bai, Y.; Cotrufo, M.F. Grassland Soil Carbon Sequestration: Current Understanding, Challenges, and Solutions. Science 2022, 377, 603–608. [Google Scholar] [CrossRef]
  5. Loges, R.; Bunne, I.; Reinsch, T.; Malisch, C.; Kluß, C.; Herrmann, A.; Taube, F. Forage Production in Rotational Systems Generates Similar Yields Compared to Maize Monocultures but Improves Soil Carbon Stocks. Eur. J. Agron. 2018, 97, 11–19. [Google Scholar] [CrossRef]
  6. Lal, R. Carbon sequestration. Philos. Trans. R. Soc. B Biol. Sci. 2008, 363, 815–830. [Google Scholar] [CrossRef]
  7. Guo, L.B.; Gifford, R.M. Soil Carbon Stocks and Land Use Change: A Meta Analysis. Glob. Chang. Biol. 2002, 8, 345–360. [Google Scholar] [CrossRef]
  8. Soussana, J.-F.; Loiseau, P.; Vuichard, N.; Ceschia, E.; Balesdent, J.; Chevallier, T.; Arrouays, D. Carbon Cycling and Sequestration Opportunities in Temperate Grasslands. Soil Use Manag. 2006, 20, 219–230. [Google Scholar] [CrossRef]
  9. Meersmans, J.; Martin, M.P.; Lacarce, E.; Orton, T.G.; de Baets, S.; Gourrat, M.; Sab, N.P.A.; Wetterlind, J.; Bispo, A.; Quine, T.A.; et al. Estimation of soil carbon input in France: An inverse modelling approach. Pedosphere 2013, 23, 422–436. [Google Scholar] [CrossRef]
  10. Rees, R.M.; Bingham, I.J.; Baddeley, J.A.; Watson, C.A. The Role of Plants and Land Management in Sequestering Soil Carbon in Temperate Arable and Grassland Ecosystems. Geoderma 2005, 128, 130–154. [Google Scholar] [CrossRef]
  11. Linsler, D.; Geisseler, D.; Loges, R.; Taube, F.; Ludwig, B. Temporal Dynamics of Soil Organic Matter Composition and Aggregate Distribution in Permanent Grassland after a Single Tillage Event in a Temperate Climate. Soil Tillage Res. 2013, 126, 90–99. [Google Scholar] [CrossRef]
  12. Necpálová, M.; Li, D.; Lanigan, G.; Casey, I.A.; Burchill, W.; Humphreys, J. Changes in Soil Organic Carbon in a Clay Loam Soil Following Ploughing and Reseeding of Permanent Grassland under Temperate Moist Climatic Conditions. Grass Forage Sci. 2014, 69, 611–624. [Google Scholar] [CrossRef]
  13. Reinsch, T.; Loges, R.; Kluß, C.; Taube, F. Effect of Grassland Ploughing and Reseeding on CO2 Emissions and Soil Carbon Stocks. Agric. Ecosyst. Environ. 2018, 265, 374–383. [Google Scholar] [CrossRef]
  14. Vellinga, T.V.; van den Pol-van Dasselaar, A.; Kuikman, P.J. The impact of grassland ploughing on CO2 and N2O emissions in the Netherlands. Nutr. Cycl. Agroecosystems 2004, 70, 33–45. [Google Scholar] [CrossRef]
  15. Luo, J.; Balvert, S.F.; Wise, B.; Welten, B.; Ledgard, S.F.; de Klein, C.A.M.; Lindsey, S.; Judge, A. Using Alternative Forage Species to Reduce Emissions of the Greenhouse Gas Nitrous Oxide from Cattle Urine Deposited onto Soil. Sci. Total Environ. 2018, 610–611, 1271–1280. [Google Scholar] [CrossRef]
  16. Steinbeiss, S.; Beßler, H.; Engels, C.; Temperton, V.M.; Buchmann, N.; Roscher, C.; Kreutziger, Y.; Baade, J.; Habekost, M.; Gleixner, G. Plant diversity positively affects short-term soil carbon storage in experimental grasslands. Glob. Chang. Biol. 2008, 14, 2937–2949. [Google Scholar] [CrossRef]
  17. Lorenz, H.; Reinsch, T.; Kluß, C.; Taube, F.; Loges, R. Does the Admixture of Forage Herbs Affect the Yield Performance, Yield Stability and Forage Quality of a Grass Clover Ley? Sustainability 2020, 12, 5842. [Google Scholar] [CrossRef]
  18. Harrison, S.; McAree, C.; Mulville, W.; Sullivan, T. The Problem of Agricultural ‘Diffuse’ Pollution: Getting to the Point. Sci. Total Environ. 2019, 677, 700–717. [Google Scholar] [CrossRef]
  19. Carlton, A.J.; Cameron, K.C.; Di, H.J.; Edwards, G.R.; Clough, T.J. Nitrate Leaching Losses Are Lower from Ryegrass/White Clover Forages Containing Plantain than from Ryegrass/White Clover Forages under Different Irrigation. N. Z. J. Agric. Res. 2019, 62, 150–172. [Google Scholar] [CrossRef]
  20. Loza, C.; Reinsch, T.; Loges, R.; Taube, F.; Gere, J.I.; Kluß, C.; Hasler, M.; Malisch, C.S. Methane Emission and Milk Production from Jersey Cows Grazing Perennial Ryegrass–White Clover and Multispecies Forage Mixtures. Agriculture 2021, 11, 175. [Google Scholar] [CrossRef]
  21. Eriksen, J.; Mortensen, T.; Søegaard, K. Root Biomass and Carbon Storage in Differently Managed Multispecies Temporary Grasslands. Grassl. Sci. Eur. 2012, 17, 610–612. Available online: https://orgprints.org/id/eprint/22043/ (accessed on 10 August 2024).
  22. Kagiya, N.; Reinsch, T.; Taube, F.; Salminen, J.-P.; Kluß, C.; Hasler, M.; Malisch, C.S. Turnover Rates of Roots Vary Considerably across Temperate Forage Species. Soil Biol. Biochem. 2019, 139, 107614. [Google Scholar] [CrossRef]
  23. Lange, M.; Eisenhauer, N.; Sierra, C.A.; Bessler, H.; Engels, C.; Griffiths, R.I.; Mellado-Vázquez, P.G.; Malik, A.A.; Roy, J.; Scheu, S.; et al. Plant Diversity Increases Soil Microbial Activity and Soil Carbon Storage. Nat. Commun. 2015, 6, 6707. [Google Scholar] [CrossRef]
  24. Kumar, S.; Meena, R.S.; Lal, R.; Singh Yadav, G.; Mitran, T.; Meena, B.L.; Dotaniya, M.L.; EL-Sabagh, A. Role of Legumes in Soil Carbon Sequestration. In Legumes for Soil Health and Sustainable Management; Springer Singapore: Singapore, 2018; pp. 109–138. [Google Scholar] [CrossRef]
  25. Poyda, A.; Wizemann, H.-D.; Ingwersen, J.; Eshonkulov, R.; Högy, P.; Demyan, M.S.; Kremer, P.; Wulfmeyer, V.; Streck, T. Carbon Fluxes and Budgets of Intensive Crop Rotations in Two Regional Climates of Southwest Germany. Agric. Ecosyst. Environ. 2019, 276, 31–46. [Google Scholar] [CrossRef]
  26. Marschner, P.; Rengel, Z. Nutrient Cycling in Terrestrial Ecosystems; Marschner, P., Rengel, Z., Eds.; Springer Science and Business Media: Berlin/Heidelberg, Germany, 2007; Volume 10. [Google Scholar]
  27. Feger, K.H. Book Review: Hans-Peter Blume, Rainer Horn, Sören Thiele-Bruhn: Handbuch Des Bodenschutzes: Bodenökologie Und Bodenbelastung–Vorbeugende Und Abwehrende Schutzmaßnahmen. J. Plant Nutr. Soil Sci. 2011, 174, 690–691. [Google Scholar] [CrossRef]
  28. Willems, A.B.; Augustenborg, C.A.; Hepp, S.; Lanigan, G.; Hochstrasser, T.; Kammann, C.; Müller, C. Carbon Dioxide Emissions from Spring Ploughing of Grassland in Ireland. Agric. Ecosyst. Environ. 2011, 144, 347–351. [Google Scholar] [CrossRef]
  29. DWD. Temperatur: Langjährige Mittelwerte 1991–2020. Available online: https://www.dwd.de/DE/leistungen/klimadatendeutschland/mittelwerte/temp_8110_akt_html.html?view=%0AnasPublication&nn=16102Dtsch.Wetterd (accessed on 10 August 2024).
  30. Reinsch, T.; Loges, R.; Kluß, C.; Taube, F. Renovation and Conversion of Permanent Grass-Clover Swards to Pasture or Crops: Effects on Annual N2O Emissions in the Year after Ploughing. Soil Tillage Res. 2018, 175, 119–129. [Google Scholar] [CrossRef]
  31. Hutchinson, G.L.; Mosier, A.R. Improved Soil Cover Method for Field Measurement of Nitrous Oxide Fluxes. Soil Sci. Soc. Am. J. 1981, 45, 311–316. [Google Scholar] [CrossRef]
  32. Panettieri, M.; Guigue, J.; Chemidlin Prevost-Bouré, N.; Thévenot, M.; Lévêque, J.; Le Guillou, C.; Maron, P.-A.; Santoni, A.-L.; Ranjard, L.; Mounier, S.; et al. Grassland-Cropland Rotation Cycles in Crop-Livestock Farming Systems Regulate Priming Effect Potential in Soils through Modulation of Microbial Communities, Composition of Soil Organic Matter and Abiotic Soil Properties. Agric. Ecosyst. Environ. 2020, 299, 106973. [Google Scholar] [CrossRef]
  33. Flessa, H.; Wild, U.; Klemish, M.; Pfadenhauer, J. Nitrous Oxide and Methane Fluxes from Organic Soils under Agriculture. Eur. J. Soil. Sci. 1998, 49, 327–335. [Google Scholar] [CrossRef]
  34. Drösler, M.; Schaller, L.; Kantelhardt, J.; Schweiger, M.; Fuchs, D.; Tiemeyer, B.; Augustin, J.; Wehrhan, M.; Förster, C.; Bergmann, L.; et al. Beitrag von Moorschutzund-Revitalisierungsmaßnahmen Zum Klimaschutz Am Beispiel von Naturschutzgroßprojekten. Nat. Und Landsch. 2012, 87, 70–76. [Google Scholar] [CrossRef]
  35. Comeau, L.-P.; Lemke, R.L.; Knight, J.D.; Bedard-Haughn, A. Carbon Input from 13C-Labeled Crops in Four Soil Organic Matter Fractions. Biol. Fertil. Soils 2013, 49, 1179–1188. [Google Scholar] [CrossRef]
  36. R Core Team. R: A Language and Environment for Statistical Computing; R Foundation for Statistical Computing: Vienna, Austria, 2020; Available online: https://www.R-project.org/ (accessed on 10 August 2024).
  37. Kozak, M.; Piepho, H.p. What’s Normal Anyway? Residual Plots Are More Telling than Significance Tests When Checking ANOVA Assumptions. J. Agron. Crop. Sci 2018, 204, 86–98. [Google Scholar] [CrossRef]
  38. Bretz, F.; Westfall, P. Multiple Comparisons Using R., 1st ed.; Chapman and Hall/CRC: London, UK, 2011. [Google Scholar]
  39. Boller, B.; Greene, S.L. Fodder Crops and Amenity; Boller, B., Posselt, U.K., Veronesi, F., Eds.; Springer: New York, NY, USA, 2010. [Google Scholar] [CrossRef]
  40. Mortensen, E.Ø.; Abalos, D.; Rasmussen, J. Well-Designed Multi-Species Grassland Mixtures Enhance Both Soil Carbon Inputs and Aboveground Productivity. Agric. Ecosyst. Environ. 2025, 385, 109578. [Google Scholar] [CrossRef]
  41. Bakker, L.M.; Barry, K.E.; Mommer, L.; van Ruijven, J. Focusing on Individual Plants to Understand Community Scale Biodiversity Effects: The Case of Root Distribution in Grasslands. Oikos 2021, 130, 1954–1966. [Google Scholar] [CrossRef]
  42. Li, F.; Sørensen, P.; Li, X.; Olesen, J.E. Carbon and Nitrogen Mineralization Differ between Incorporated Shoots and Roots of Legume versus Non-Legume Based Cover Crops. Plant Soil 2020, 446, 243–257. [Google Scholar] [CrossRef]
  43. Böldt, M.J.; Smit, H.P.J.; Loges, R.; Taube, F.; Kluß, C.; Reinsch, T. Evaluating Nitrous Oxide Emissions in Low Input Systems Using Different Cover Crop Strategies over the Winter Period. Agric. Ecosyst. Environ. 2024, 364, 108895. [Google Scholar] [CrossRef]
  44. Pietola, L.; Alakukku, L. Root Growth Dynamics and Biomass Input by Nordic Annual Field Crops. Agric. Ecosyst. Environ. 2005, 108, 135–144. [Google Scholar] [CrossRef]
  45. Redin, M.; Recous, S.; Aita, C.; Chaves, B.; Pfeifer, I.C.; Bastos, L.M.; Pilecco, G.E.; Giacomini, S.J. Root and Shoot Contribution to Carbon and Nitrogen Inputs in the Topsoil Layer in No-Tillage Crop Systems under Subtropical Conditions. Rev. Bras. Cienc. Solo 2018, 42. [Google Scholar] [CrossRef]
  46. Wang, H.; Beule, L.; Zang, H.; Pfeiffer, B.; Ma, S.; Karlovsky, P.; Dittert, K. The Potential of Ryegrass as Cover Crop to Reduce Soil N2O Emissions and Increase the Population Size of Denitrifying Bacteria. Eur. J. Soil. Sci. 2021, 72, 1447–1461. [Google Scholar] [CrossRef]
  47. Reicosky, D.C.; Archer, D.W. Moldboard Plow Tillage Depth and Short-Term Carbon Dioxide Release. Soil Tillage Res. 2007, 94, 109–121. [Google Scholar] [CrossRef]
  48. Reicosky, D. Tillage-Induced CO2 Emission from Soil. Nutr. Cycl. Agroecosyst. 1997, 49, 273–285. [Google Scholar] [CrossRef]
  49. Oram, N.J.; Ravenek, J.M.; Barry, K.E.; Weigelt, A.; Chen, H.; Gessler, A.; Gockele, A.; de Kroon, H.; van der Paauw, J.W.; Scherer-Lorenzen, M.; et al. Below-ground Complementarity Effects in a Grassland Biodiversity Experiment Are Related to Deep-rooting Species. J. Ecol. 2018, 106, 265–277. [Google Scholar] [CrossRef]
  50. Pacaldo, R.S.; Volk, T.A.; Briggs, R.D. Carbon Sequestration in Fine Roots and Foliage Biomass Offsets Soil CO2 Effluxes along a 19-Year Chronosequence of Shrub Willow (Salix x dasyclados) Biomass Crops. Bioenergy Res. 2014, 7, 769–776. [Google Scholar] [CrossRef]
  51. Drewer, J.; Anderson, M.; Levy, P.E.; Scholtes, B.; Helfter, C.; Parker, J.; Rees, R.M.; Skiba, U.M. The Impact of Ploughing Intensively Managed Temperate Grasslands on N2O, CH4 and CO2 Fluxes. Plant Soil 2017, 411, 193–208. [Google Scholar] [CrossRef]
  52. Smit, H.P.J.; Reinsch, T.; Kluß, C.; Loges, R.; Taube, F. Very Low Nitrogen Leaching in Grazed Ley-Arable-Systems in Northwest Europe. Agronomy 2021, 11, 2155. [Google Scholar] [CrossRef]
  53. Kuzyakov, Y. Priming Effects: Interactions between Living and Dead Organic Matter. Soil Biol. Biochem. 2010, 42, 1363–1371. [Google Scholar] [CrossRef]
  54. Chen, R.; Senbayram, M.; Blagodatsky, S.; Myachina, O.; Dittert, K.; Lin, X.; Blagodatskaya, E.; Kuzyakov, Y. Soil C and N Availability Determine the Priming Effect: Microbial N Mining and Stoichiometric Decomposition Theories. Glob. Chang. Biol. 2014, 20, 2356–2367. [Google Scholar] [CrossRef]
  55. Zhao, H.; Jiang, Y.; Ning, P.; Liu, J.; Zheng, W.; Tian, X.; Shi, J.; Xu, M.; Liang, Z.; Shar, A.G. Effect of Different Straw Return Modes on Soil Bacterial Community, Enzyme Activities and Organic Carbon Fractions. Soil Sci. Soc. Am. J. 2019, 83, 638–648. [Google Scholar] [CrossRef]
  56. Liu, C.; Lu, M.; Cui, J.; Li, B.; Fang, C. Effects of Straw Carbon Input on Carbon Dynamics in Agricultural Soils: A Meta-analysis. Glob. Chang. Biol. 2014, 20, 1366–1381. [Google Scholar] [CrossRef]
  57. Jabro, J.D.; Sainju, U.; Stevens, W.B.; Evans, R.G. Carbon Dioxide Flux as Affected by Tillage and Irrigation in Soil Converted from Perennial Forages to Annual Crops. J. Environ. Manag. 2008, 88, 1478–1484. [Google Scholar] [CrossRef] [PubMed]
  58. Bimüller, C.; Kreyling, O.; Kölbl, A.; von Lützow, M.; Kögel-Knabner, I. Carbon and Nitrogen Mineralization in Hierarchically Structured Aggregates of Different Size. Soil Tillage Res. 2016, 160, 23–33. [Google Scholar] [CrossRef]
  59. Stewart, A.M.; Frank, D.A. Short Sampling Intervals Reveal Very Rapid Root Turnover in a Temperate Grassland. Oecologia 2008, 157, 453–458. [Google Scholar] [CrossRef] [PubMed]
  60. Antony, D.; Collins, C.D.; Clark, J.M.; Sizmur, T. Soil Organic Matter Storage in Temperate Lowland Arable, Grassland and Woodland Topsoil and Subsoil. Soil Use Manag. 2022, 38, 1532–1546. [Google Scholar] [CrossRef]
  61. Sierra, C.A.; Trumbore, S.E.; Davidson, E.A.; Vicca, S.; Janssens, I. Sensitivity of Decomposition Rates of Soil Organic Matter with Respect to Simultaneous Changes in Temperature and Moisture. J. Adv. Model Earth Syst. 2015, 7, 335–356. [Google Scholar] [CrossRef]
Figure 1. Experimental layout showing the different treatments applied across three blocks. Treatments include bare soil (bare), which was ploughed or unploughed, vegetated soil (with different swards), and plots that received added straw (+s). The different species mixtures, BM, TM, and CM, and their species composition. BM = Binary mixture, TM = Tertiary mixture, CM = Complex mixture.
Agriculture 15 00888 g001
Figure 2. Hourly (minutes) CO2 (kg CO2-C ha−1 min−1) fluxes for the various treatments used during the experiment on the first day immediately after ploughing. BM = Binary mixture, TM = Tertiary mixture, CM = Complex mixture, B = Bare plots, BNP = Bare plots not ploughed. Different colors indicate the different blocks used in the experiment.
Agriculture 15 00888 g002
Figure 3. Daily CO2 (kg CO2-C ha−1 day−1) fluxes, soil moisture (%), and temperature (°C) for the different treatments used during the experiment, excluding the first day. BM = Binary mixture, TM = Tertiary mixture, CM = Complex mixture, B = Bare plots. Ploughing is presented by the solid line, and the bare (B) treatment without ploughing is presented by the dashed line. Treatments that received added straw are presented by the grey line, and the treatments without added straw are presented by the black line.
Agriculture 15 00888 g003
Figure 4. The total CO2 emissions (kg CO2 ha−1) from (a) the first day after ploughing without added straw; (b) the rest of our study period (24/03/2020 to 11/08/2020) when straw was added to treatments. BM = Binary mixture, TM = Tertiary mixture, CM = Complex mixture, B = Bare plots, BNP = Bare plots not ploughed, +s = treatments with added straw. Significant differences between the treatments are indicated by different lowercase letters. Standard errors are also provided.
Agriculture 15 00888 g004
Table 1. Monthly precipitation (mm) and average temperatures (°C) during the experimental year (2020) compared to the long-term total precipitation and average temperature (1991–2020).
YearJanFebMarAprMayJunJulAugSepOctNovDecTotal
Precipitation (mm)
20208013036142660796212611760637
Long-term675152385064837862746571754
Temperature (°C)
20205.75.75.69.011.216.615.819.714.811.37.94.410.6
Long-term1.72.24.38.112.015.317.817.614.310.05.82.99.3
Table 2. The different species mixtures, BM, TM, and CM, and their species composition. BM = Binary mixture, TM = Tertiary mixture, CM = Complex mixture.
Treatment Species Composition
Binary mixture (BM)Ryegrass (Lolium perenne)
White clover (Trifolium repens)
Tertiary mixture (TM)Ryegrass (Lolium perenne)
White clover (Trifolium repens)
Red clover (Trifolium pratens)
Complex mixture (CM)Ryegrass (Lolium perenne)
White clover (Trifolium repens)
Red clover (Trifolium pratens)
Chicory (Cichorium intybus)
Caraway (Carum carvi)
Sheep’s burnet (Sanguisorba minor)
Birdsfoot trefoil (Lotus corniculates)
Ribwort plantain (Plantago lanceolata)
Table 3. The biomass, C, and N above- and belowground, as well as the totals of the different mixtures investigated over the trial period. BM = Binary mixture, TM = Tertiary mixture, CM = Complex mixture, B = Bare plots, BNP = Bare plots not ploughed. Significant differences between the treatments are indicated by different lowercase letters. Standard errors are also provided.
TreatmentBiomassCNC/N
(t DM ha−1)(t ha−1)(kg ha−1)
Aboveground biomass
BM1.06 b ± 0.160.47 b ± 0.0733.30 b ± 6.414.3 ± 1.2
TM1.01 b ± 0.040.43 b ± 0.0232.80 b ± 1.213.2 ± 0.4
CM0.72 b ± 0.060.30 b ± 0.0421.60 b ± 1.413.8 ± 1.1
B----
BNP----
Belowground biomass
BM13.50 c ± 0.96.54 c ± 0.41242.00 c ± 15.327.1 a ± 0.0
TM11.00 c ± 2.65.33 c ± 1.24210.00 c ± 48.725.5 c ± 0.0
CM13.70 c ± 1.66.52 c ± 0.74225.00 c ± 25.429.0 b ± 0.0
B0.92 a ± 0.510.44 a ± 0.2516.90 a ± 8.927.5 ab ± 0.5
BNP2.13 b ± 0.761.14 b ± 0.2739.00 b ± 14.426.0 ac ± 0.6
Total
BM14.567.00 b ± 0.34275.00 b ± 8.925.4 a ± 0.4
TM12.015.77 b ± 1.26242.00 b ± 49.823.7 c ± 0.3
CM14.426.82 b ± 0.75246.00 b ± 25.527.7 b ± 0.2
B0.920.44 a ± 0.2516.90 a ± 14.427.5 ab ± 0.5
BNP2.131.15 a ± 0.2539.00 a ± 8.926.0 a ± 0.6
Disclaimer/Publisher’s Note: The statements, opinions and data contained in all publications are solely those of the individual author(s) and contributor(s) and not of MDPI and/or the editor(s). MDPI and/or the editor(s) disclaim responsibility for any injury to people or property resulting from any ideas, methods, instructions or products referred to in the content.

