Abstract
Coastal permeable groins have been used to protect beaches from erosion for centuries. However, the hydraulic functioning of permeable groins has not been fully understood and their design heavily depends on engineering experiences. In this study, numerical experiments were executed to investigate the effects of layout configurations of a permeable groin system on longshore currents. The non-hydrostatic SWASH (Simulating WAve till SHore) model was employed to carry out the numerical simulations. Two data sets obtained from physical laboratory experiments with different permeable groin layouts on different slopes are used to validate the accuracy of the model. Then, the longshore current reduction by the permeable groin system with varying configuration parameters (e.g., groin spacing, groin length) was numerically investigated under different environmental conditions (e.g., a slight or a moderate wave climate). From the calculation results of numerical experiments, it is indicated that permeable groins function efficiently to reduce the maximal longshore current velocity under the condition that the groin length ranges from 84% and 109% of the wave breaker zone width. The longshore current reduction rate monotonously decreases with the increase in groin spacing; permeable pile groin functions best to reduce longshore current with the minimal groin spacing-groin length ratio 1:1 among the range between 1:1 and 2:1. When the groin spacing–groin length ratios are 1:1 and 1.5:1, the longshore current reduction is not sensitive to the investigated wave conditions in this study. When the spatial ratio is 2:1, the permeable pile groin system functions worse under a moderate wave climate than under a slight wave climate, from the view of longshore current reduction.
1. Introduction
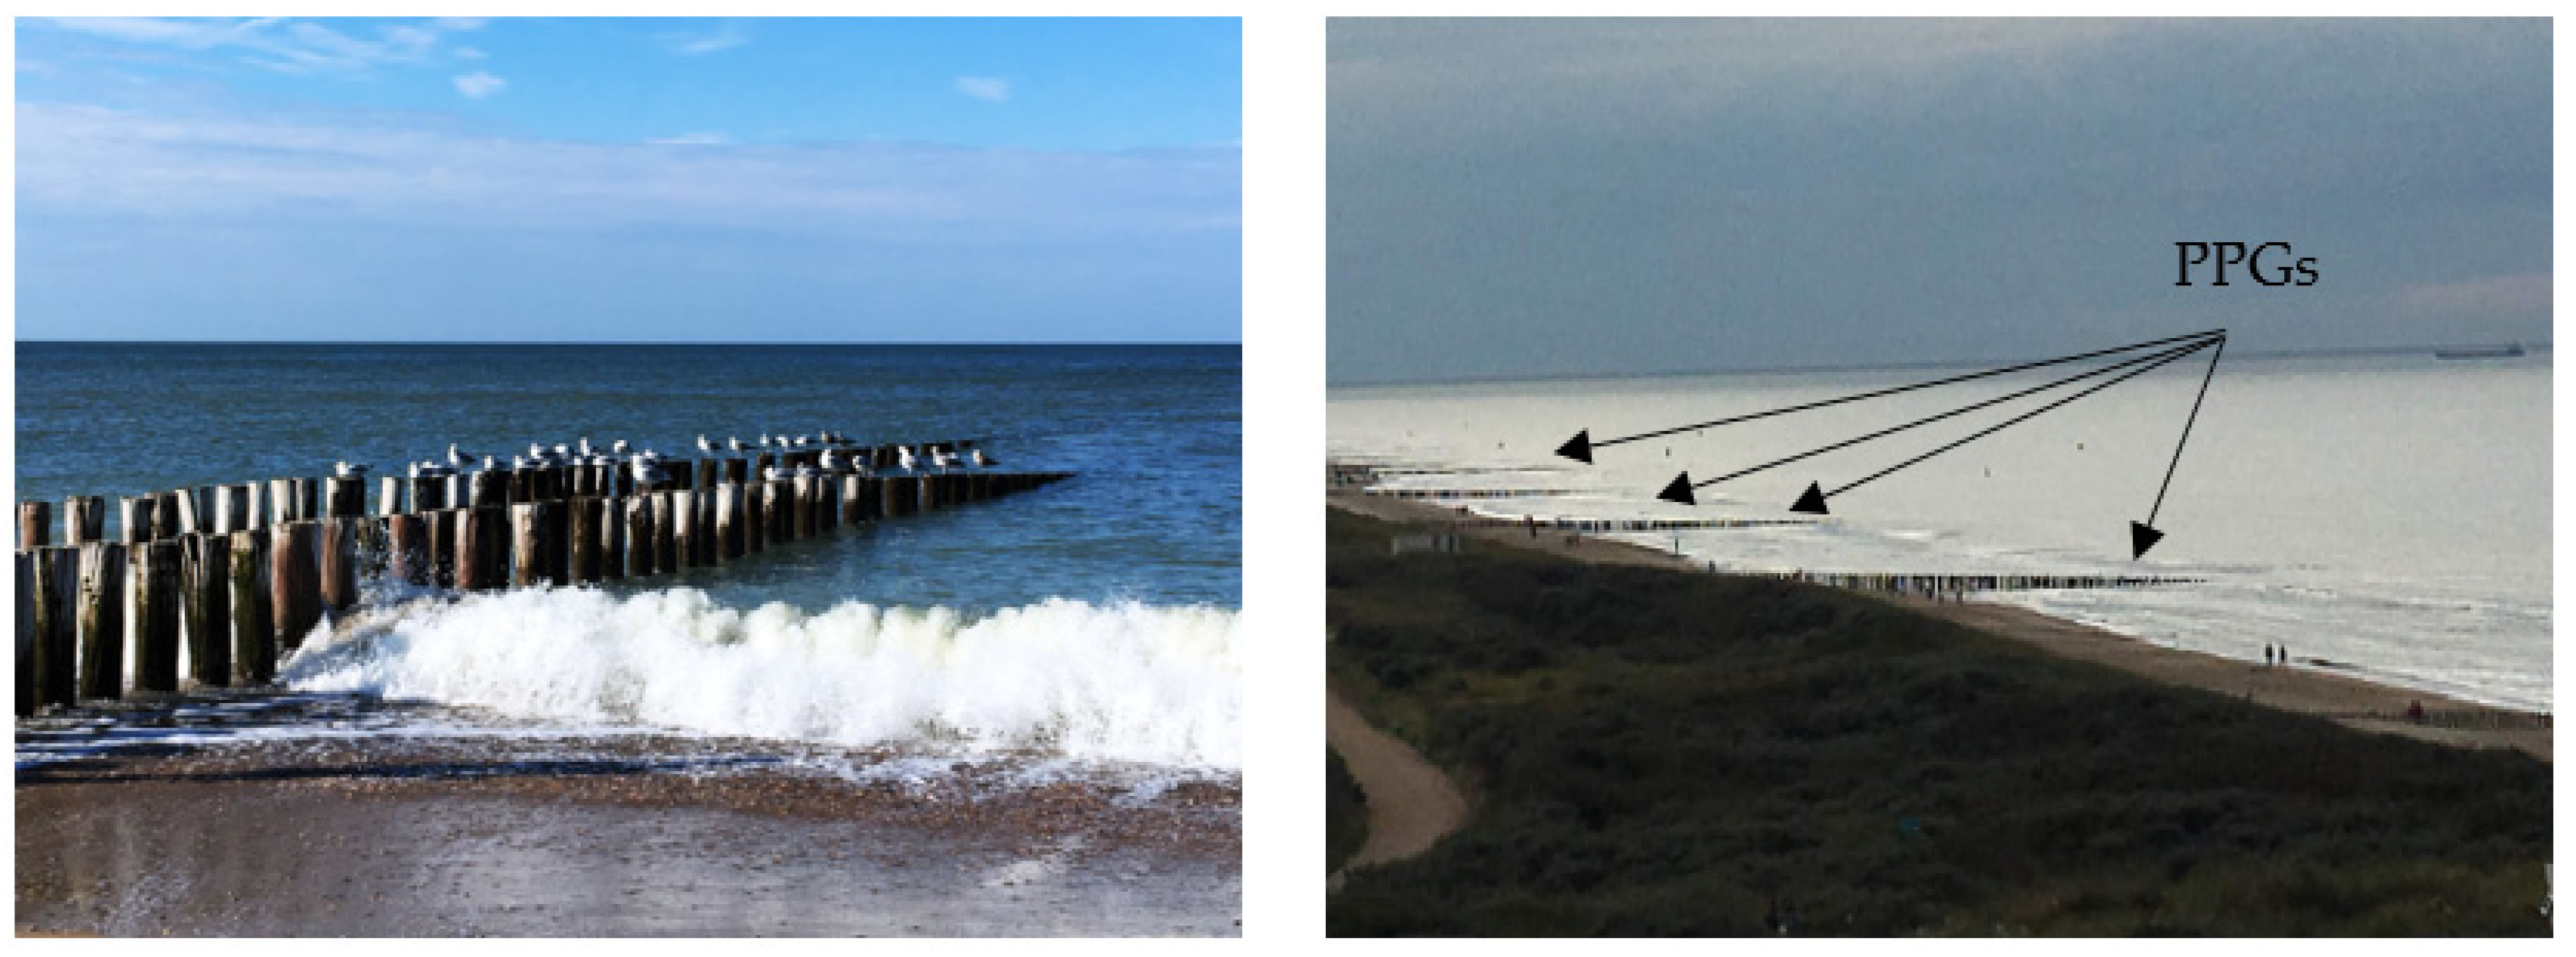
Coastal groins are long and narrow hydraulic structures, which are built to protect a stretch of beach from erosion. Groins are usually placed approximately perpendicular to the shoreline to hinder longshore currents and intercept longshore sediment transportation in the littoral zone [1]. In engineering practice, groins are widely used in combination with beach nourishment to sustain the recharged beach materials within groin bays, or groins serve as a terminal structure to reduce the sand loss to a sand sink (e.g., at a harbour inlet). For centuries groins have been used, but they are perhaps the least understood compared to numerous other shore-protection structures, due to the lack of research about established relationships between groin functional behaviours and environmental climates [2,3,4,5]. From the aspect of permeability, groins can be divided into two types, permeable and impermeable groins, respectively. In this study, the specific traditional form of the permeable groin, consisting of wooden piles, is investigated (Figure 1). Compared with solid groins (e.g., rubble mound groins), Permeable Pile Groins (PPGs) may attract more preference given their appealing natural look and flexibility of construction, and they are made of a renewable timber resource [6,7]. In addition, because longshore sediment transport could pass through large openings of PPGs, the side effects of beach erosion downdrift PPGs are much less compared to the effects associated with their impermeable counterparts. Consequently, PPGs have minor downdrift beach impacts and result in a continuous shoreline. Since the awareness of the esthetic value and environmental friendliness is increasing, PPGs are gradually regaining significant attention as a ‘soft’ type of groins or a kind of green infrastructure [8,9]. Therefore, PPGs deserve serious consideration and investigation as a promising type of economic and flexible coastal protection measure [3].

Figure 1.
Permeable pile groin at the Domburg coast, The Netherlands, (left: a PPG; right: a PPG system).
Compared with solid groins, the primary function of PPGs is to obtain a smooth reduction in velocity along the groin field, to enable the elimination of circulations within groin fields, and to weaken rip currents along the groins [10,11]. PPGs do not impound on and block longshore sediment transport, but instead of exerting resistance on longshore currents, to reduce the velocity of longshore currents and weaken their capability of transporting sediment. On the other hand, the reduction in current velocity decreases turbulence production at the seabed and allows the suspended sediment to settle. As a result, the capacity of longshore currents to entrain sediment decreases [11]. On several sites of field surveys, it was shown that coastline recession was effectively curbed and accretion nearshore was promoted by the massive rows of PPGs [3,5,8,12,13,14,15,16]. A five-year surveillance of beach profile evolution on a Southern coast in England showed that a build-up in beach levels appeared after the construction of PPGs [17]. Compared to a natural coast without groins, the evolution of beach profiles in response to PPGs is that the beach elevation was built up and the beach slope became much gentler from the shoreline to the trough. This implied that wave energy dissipated further seaward and a wider wave buffer zone was developed, reducing wave loading per unit area and alleviating the potential of beach erosion [12,18]. Similarly, the positive effects induced by PPGs, indicated by extensive field surveys from 1993 to 1997 on the Baltic Sea coast, are as follows: (a) significant seaward advancement of shoreline; (b) continuous growth of submarine terrace elevation; (c) seaward movement of the nearshore shoal [13]. The accretive morphological change appeared as a result of an indirect protection mechanism by PPGs [13], in addition to the direct effects on hydrodynamics. In the case of Naples Beach, Florida, USA, the monitored performance of an experimental permeable groin on-site was according to expectation, i.e., successfully stabilized the beach, enabled the beach to build up and did not have any significant side effects on the adjacent shoreline [5]. Bakker et al. (1984) reviewed the application of PPGs in the Netherlands. These authors concluded that the PPG effect was controversial due to a lack of statistically significant evidence because some PPG projects at Dutch sites did have the expected favourable effects, whereas other projects did have adverse effects and were abandoned.
When evaluating the effectiveness of PPGs on the morphological changes in nature, there is inevitable difficulty in isolating the effects of natural and non-natural variations, such as long-term morphological variations [3] or anthropogenic interventions (e.g., beach nourishment). In this study, numerical experiments were carried out merely focusing on hydrodynamics, to investigate the hydraulic functioning of PPGs under varying wave conditions. Separate experiments have been carried out to isolate groin configuration effects, such as groin length and groin spacing. Our aim is to numerically quantify the relationship between the layout parameters of a PPG system and the reduced longshore current reduction rate. The results may be used as a reference database to facilitate and improve PPG design.
In this study, the nearshore flow fields affected by different configurations of permeable pile groin systems under varying hydraulic conditions were simulated. The following section provides a brief overview of the literature on permeable groin layout design. Then, the setup of numerical experiments is given. The governing equations of the numerical tool, the SWASH model, are demonstrated in Section 3. The simulation results are analyzed and compared in Section 4. Finally, in the last section, a discussion is provided and the conclusions are summarized.
2. Methods
2.1. Numerical Experiments
2.1.1. The SWASH Model
SWASH (an acronym for Simulating Waves till Shore) model is an open source free surface wave flow model, considering non-hydrostatic pressure forces [19]. The governing equations are the RANS equations for an incompressible fluid including non-hydrostatic effects. In the vertical direction, the water volume is bound by the bottom and the free water surface , where t is the time, and x, y and z are the Cartesian coordinates. The local continuity equation and momentum equations are given as
where i and j indicate two horizontal coordinates x/cross-shore and y/alongshore, z is the vertical coordinate, is the horizontal component of in each direction, is the vertical velocity, and are hydrostatic and non-hydrostatic pressure components, respectively. The hydrostatic pressure is explicitly expressed as , so (where stands for ), and (where g is the gravitational acceleration). indicates turbulent stresses. Equation (1) is the local continuity equation, and Equations (2) and (3) are momentum equations including the effects of mixing, bottom friction, and resistance of cylinders. The last sink term of Equation (2) is the momentum loss due to the presence of PPG cylinders.
Integrating the local continuity equation in the vertical direction, by substituting kinematic boundary conditions at the free surface and impermeable bottom, a global continuity equation is induced:
where h (=) is the total water depth.
The bottom friction at the bottom boundary is computed according to the logarithmic law of the wall with a roughness height [20]. The turbulence stresses are given based on eddy viscosity closure equations. The horizontal viscosity and vertical viscosity are estimated by the Smagorinsky type model [21] and the k- model [20], respectively. The inclusion of vertical mixing spreads the effect of the bottom stress over the water column in the vertical direction.
To account for the momentum lost due to the resistance of pile cylinders, a sink term is added to the right-hand side of Equation (2),
where is the drag coefficient, N is the number of cylinders per unit bed area (/, D is the cylinder diameter (m), is the added-mass coefficient, A (=) is the cross-section area of a cylinder, is the drag and inertial forces per cylinder height in the x/cross-shore or y/alongshore direction.
2.1.2. PPG Design Factors
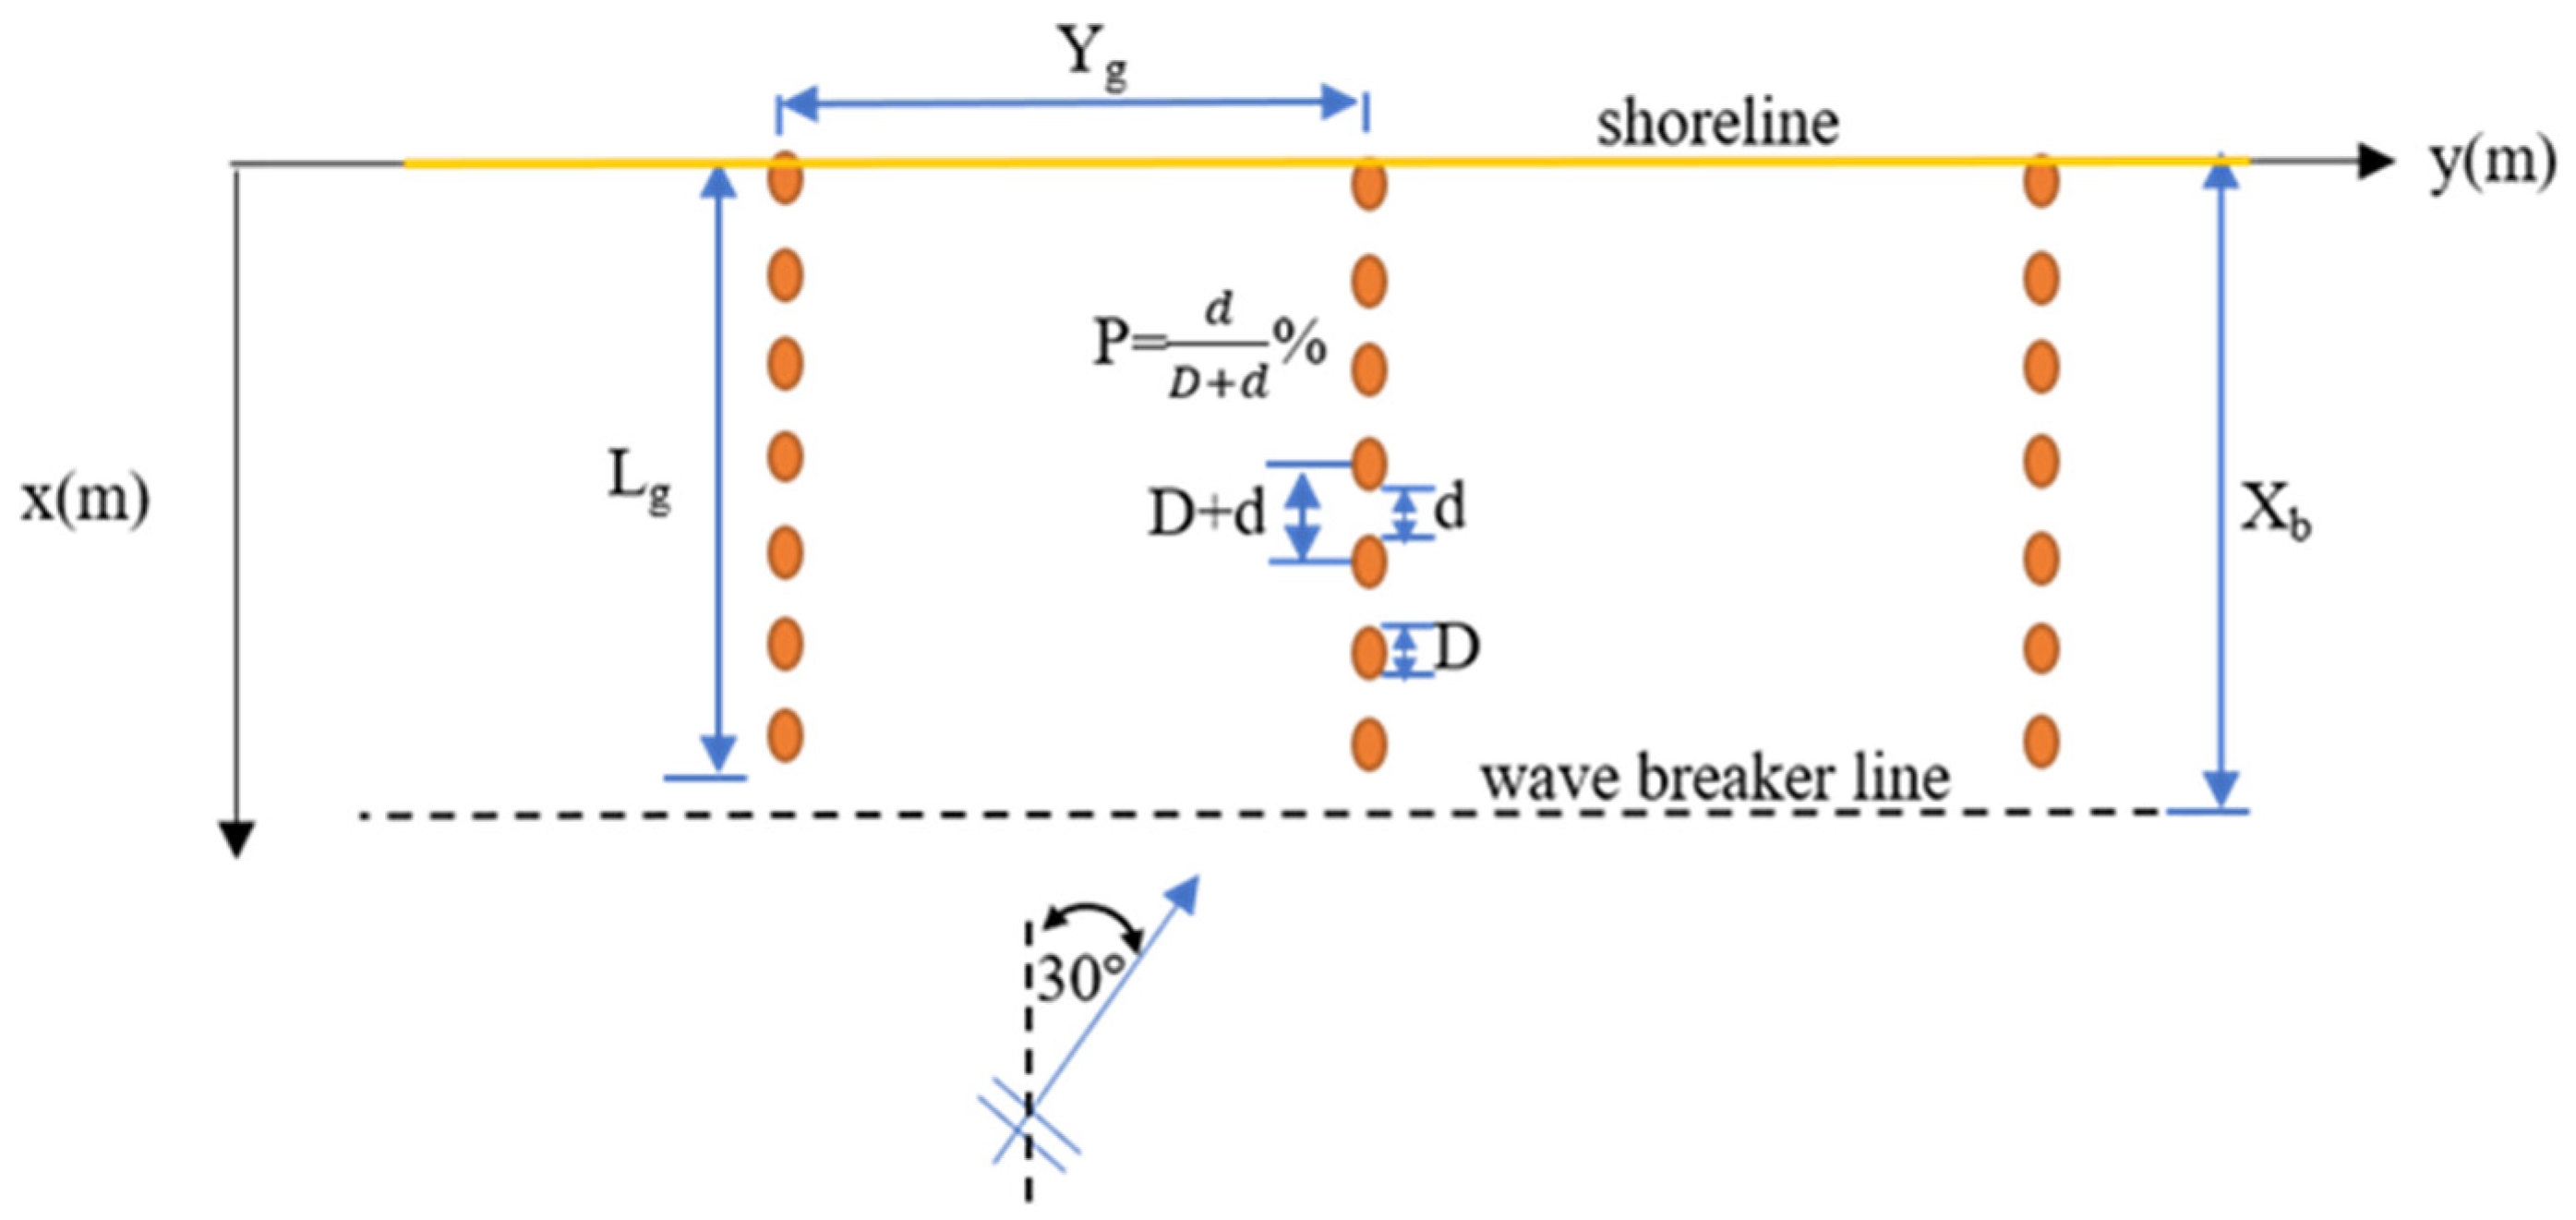
A brief summary of the design of permeable pile groins is provided below, including several design factors such as groin length, the spacing between neighbouring groins, and the layout of the groin system. However, there are no universal design criteria existing which are applicable to the groin design. Therefore, a number of main aspects are considered in this paper.
Groin length can be calculated according to the desired amount of potentially reduced longshore sediment transport, or the required minimum width of dry beach at the groin field. Thus, groin length is controlled by factors including beach materials, beach slopes, wave incident angles, tidal ranges, tidal currents, and longshore drift rates. For instance, on sand beaches, groins can be 100–200 m long depending on which proportion of the sediment transport is intended to be trapped [22]. Specifically, the PPGs were suggested to cross the average width of the surf zone to reach the low tide water line [5]. The best performance of a PPG is achieved when the groin length is in the order of the width of the surf zone [13]. In order to avoid outflanking at the shoreside, it is advisable for a groin to reach sufficiently landward till the high water line [5,13] to the foot of the dune, or an already existing revetment/seawall [23].
The groin spacing is closely related to the groin length because groin length determines the area of groin influence. Groins are spaced at a wider interval alongshore if situated under a more perpendicular wave incident. The ratio of groin spacing to groin length, indicated by theoretical and field experiences, commonly ranges from 1:1 to 1:4 [15,24,25]. The Coastal Engineering Manual suggests that the proper ratio range of groin spacing over groin length of shore normal groins is from 2 to 3 [26]. Learned from previous engineering practice and experiences, the ratio is typically between 2 and 4 on sand beaches in the Netherlands [27], whereas it is between 0.8 and 3 on shingle and mixed beaches in the UK [25]. For the specific form of PPG considered in this study, Raudkivi [10] summarized that the average spacing is 1.5 times the active groin length on the southern Baltic Sea coast, which is effective in preventing large-scale circulations within the groin fields. Poff et al. [5] suggested that groin spacing should be equal to the alongshore influenced length of a groin.
2.1.3. Numerical Experiments Setup
In this study, two available data sets, obtained from physical experiments by Hulsbergen and Ter Horst [28] and Trampenau [13], respectively, are used to validate the SWASH model. Following the validation, 12 cases with varying parameters of wave climate and groin configuration were simulated. The scale was set 1:40 as that in the experiments conducted by Hulsbergen and Ter Horst [28]. The waves are varying from a slight to a moderate wave state. However, the incident wave angle is invariant at 30 degrees. A summary of the wave parameters is provided in Table 1. In addition to varying wave conditions, three groin space distances and four groin lengths were investigated. The range of relative groin spacing (Xg/Lg, where Xg is groin spacing and Lg is groin length, Figure 2) is from 1:1, 1:1.5 to 1:2. The groin lengths are set from 109%, 99%, and 84% to 69% of the breaker zone width (Xb), and the groin height is constant and fully emergent. The flow domain is 26 m long in the y-direction and 11.4 m wide in the x-direction. In the vertical direction, the water depth was divided into 15 layers. In the cross-shore direction, the grid resolution of the computational domain depends on the wavelength (Table 1), and the finer grid resolution requires a longer computational time. The time step ∆t is 0.01 s and the simulation time is 150 T for each test. The obliquely incident regular waves were generated at the offshore open boundary. The lateral boundaries were set repeating to confine to a stretch of coastline. For instance, the computational time associated with the mesh with 78,000 grids is 2 h in 8 processors using a 3.79 GHz desktop to simulate 180 s.

Table 1.
The wave and PPG parameters.
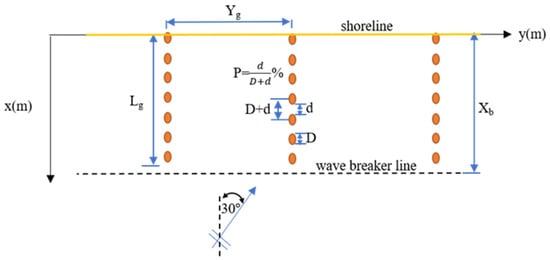
Figure 2.
Schematized layout of a PPG system.
3. Validation of the Numerical Model
In this section, the verification of the numerical model’s ability to simulate flow dynamics within permeable groin fields is based on a comparison with two experimental measurement data sets [13,28]. In Hulsbergen and Ter Horst’s experiment [28], the flow field within permeable double-row pile groin fields was investigated under varying combined wave-current conditions, while in Trampenau’s experiment the focus was on permeable single-row pile groins under wave alone and under current alone conditions separately [13].
It has been confirmed that PPGs have limited effects on wave propagation through numerical simulation [29], experimental measurements [13], and field observations [10]. The diffraction effects of PPGs on waves are negligible. Also, due to a small crossing angle between the longitudinal line of the PPG and the direction of wave propagation, wave attenuation is only confined to a limited wave shadow area. Therefore, wave variations within the PPG field are ignored and not further discussed in the following. Here, we only present the comparison between the calculated and the measured longshore current velocities averaged along the groin fields.
3.1. Hulsbergen and Ter Horst (1973) Experiments
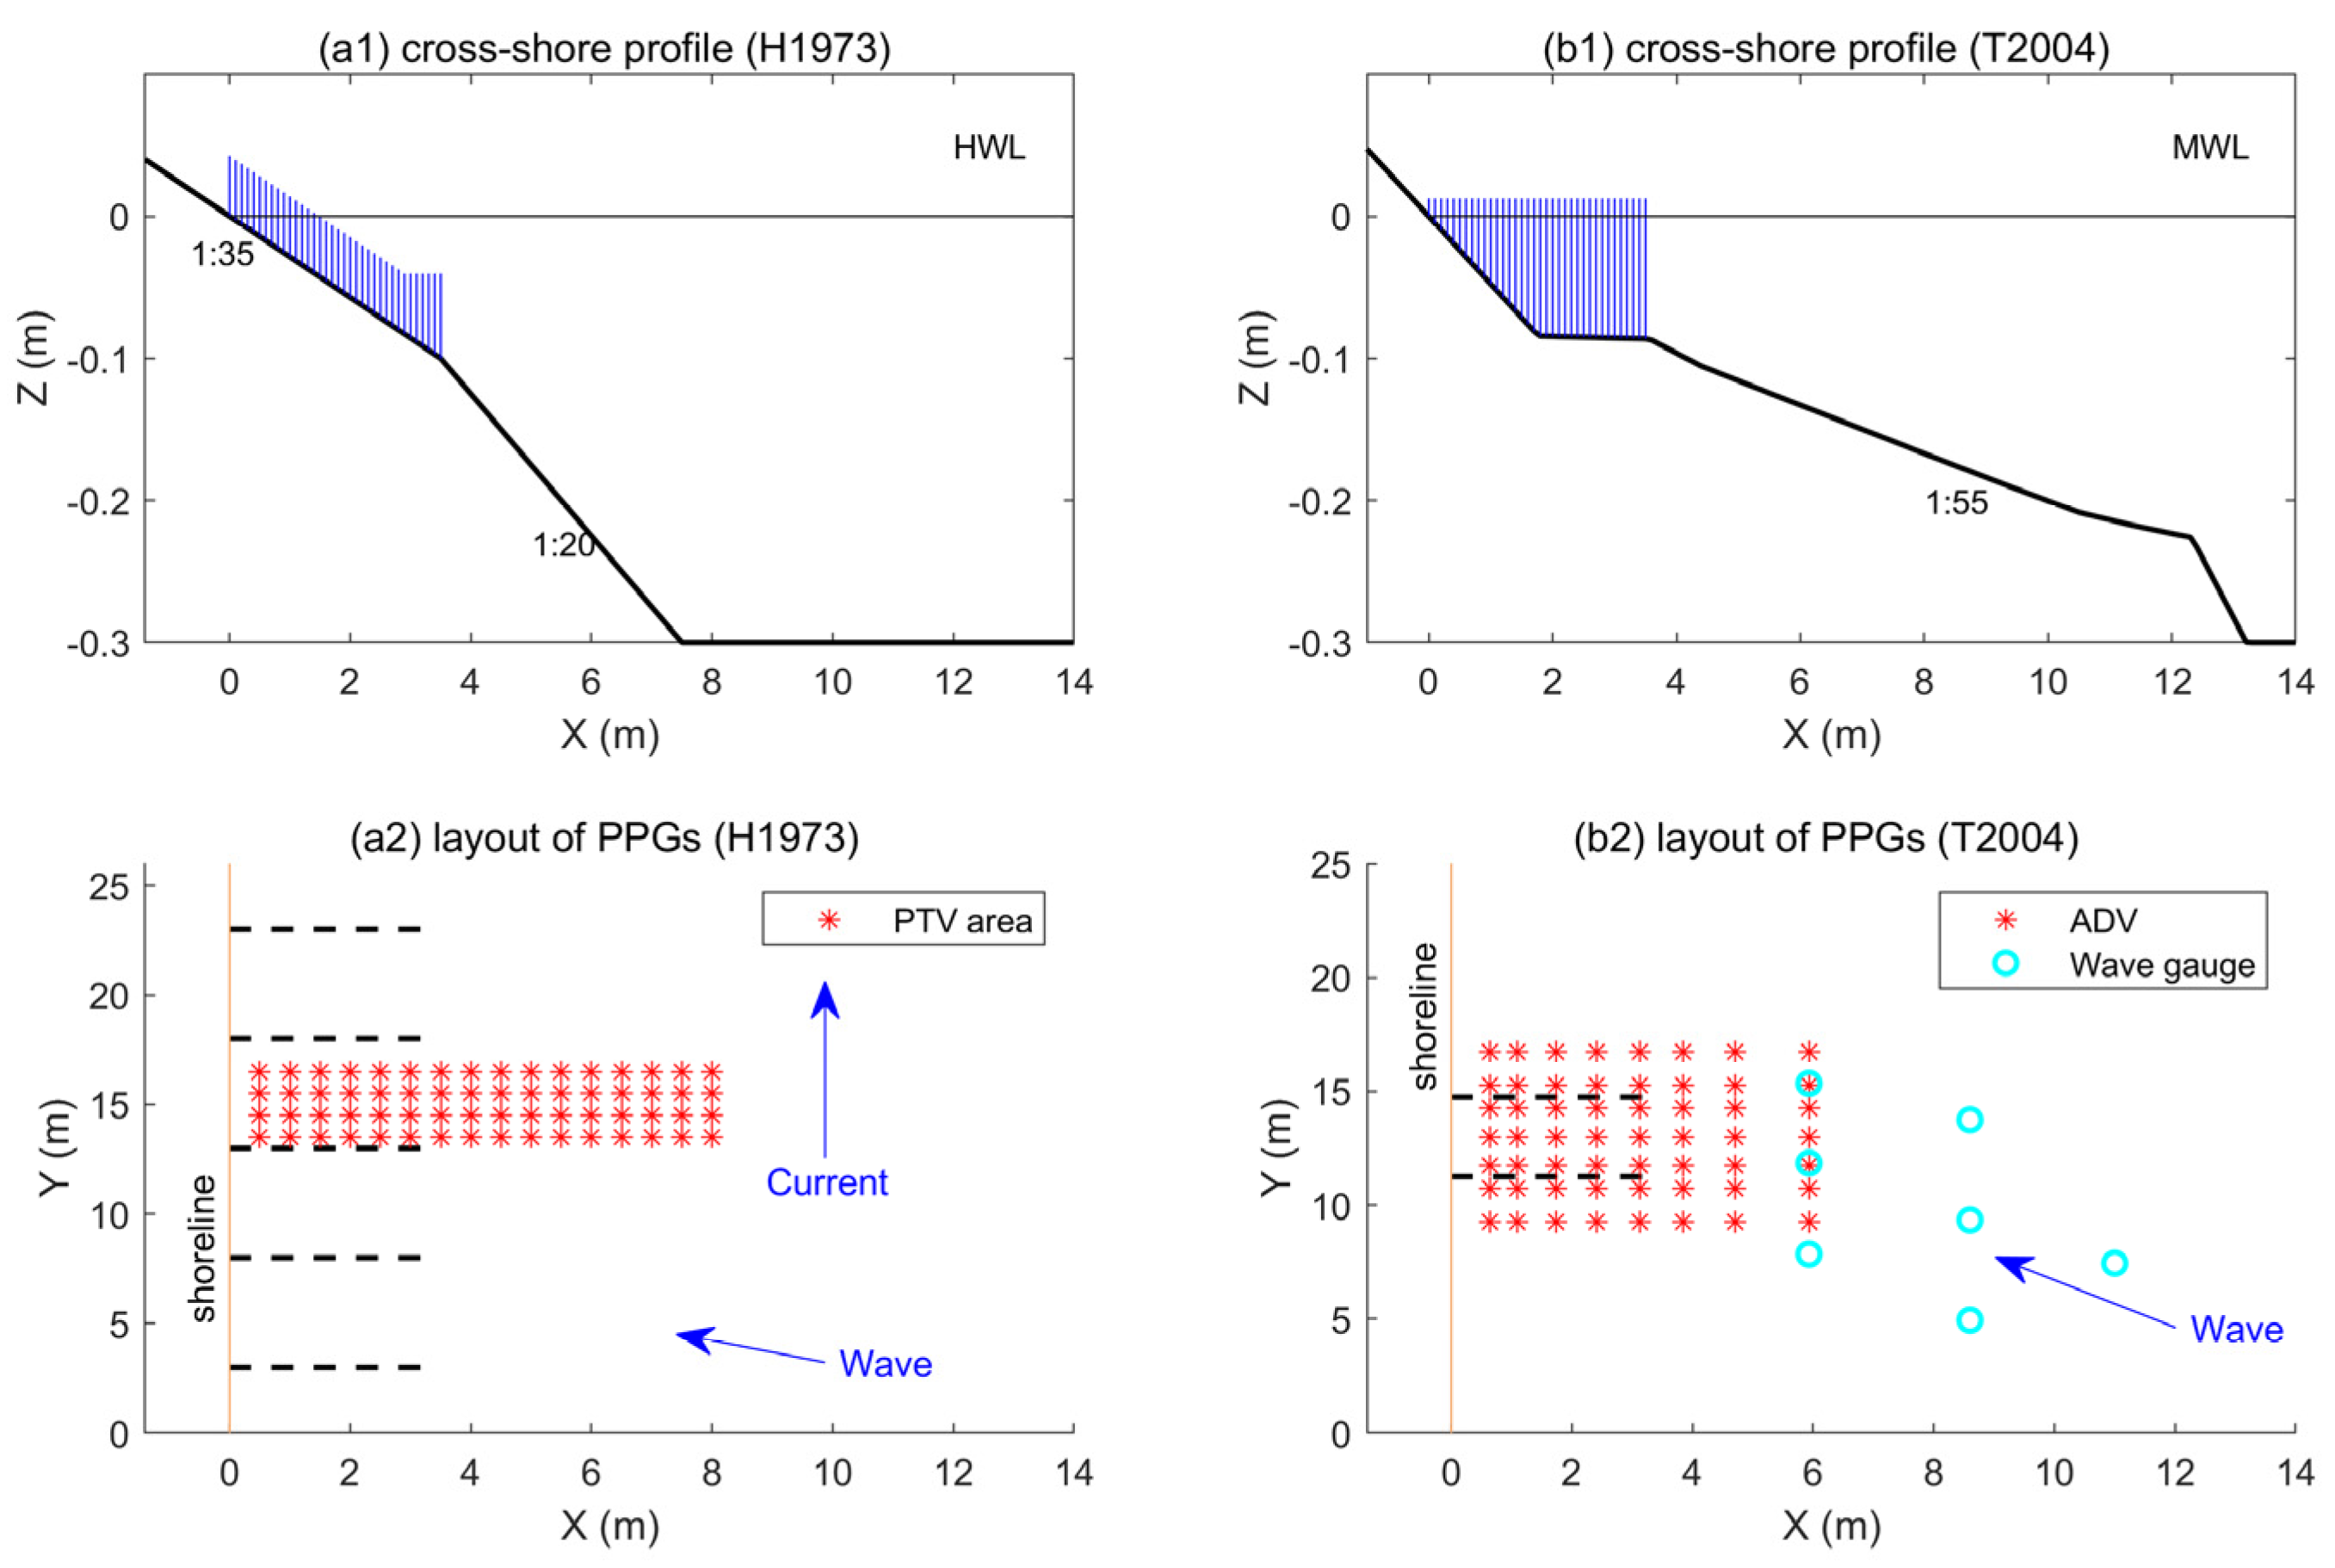
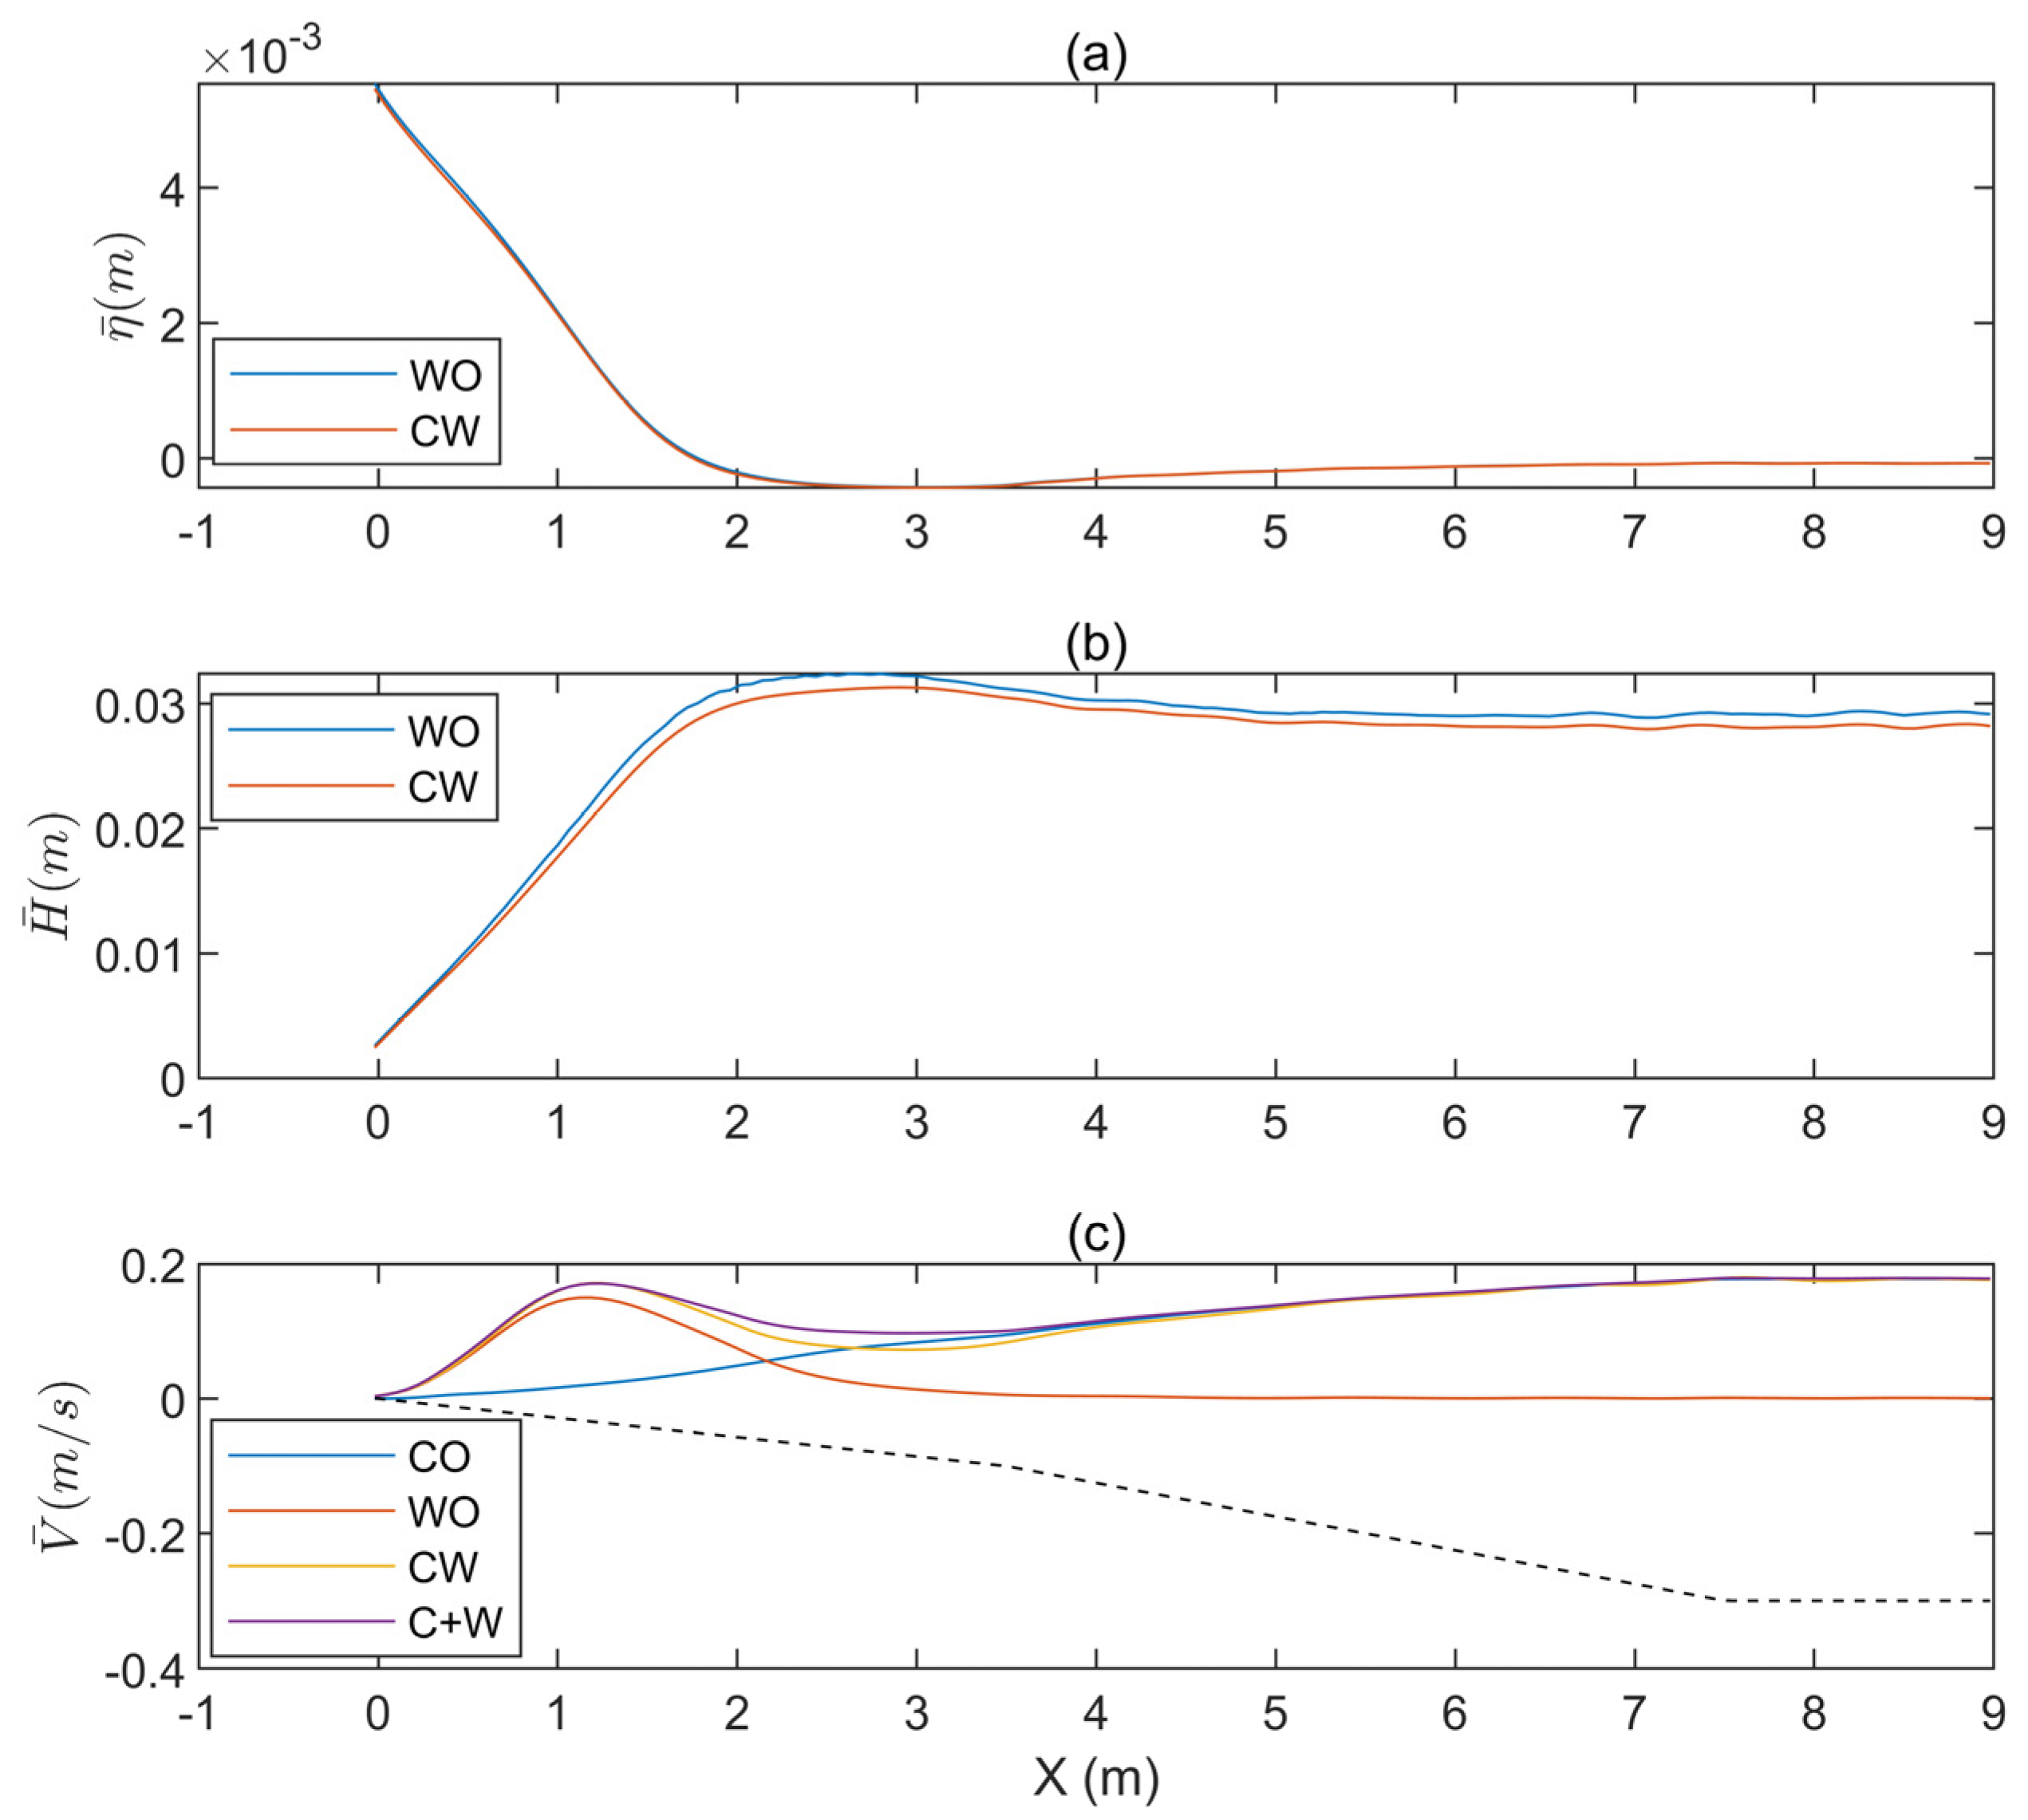
Hulsbergen and Ter Horst [28] did a series of experiments to investigate the optimal layout of a permeable pile groin system under combined wave-current conditions (Figure 3(a2). The scale is 1:40. The waves (H = 0.03 m, T = 1.04 s) obliquely incident at = 15° to shore-normal direction were superimposed on alongshore steady currents = 90°). The steady current velocity at 0.3 m water depth is about 0.2 m/s (Figure 4c). The PPG consists of two rows of pile cylinders. The pile cylinder diameter is 0.006 m, and the row-apart distance is 0.0875 m. The permeability is 50%. Here, the permeability is defined as the percentage of the void area over the total area of the groin’s cross-section (Figure 2). One layout of the groin system, consisting of five 3.5 m long groins at a 10 m spacing, was selected to be reproduced. For detailed calibration and validation information reference is made to [29]. It needs to be emphasized that the alongshore steady current was driven by setting an ad hoc pressure term at the lateral boundaries in SWASH, following the same way as [30] did. In such a way, a significantly larger domain or longer computation time allows for spin-up to be avoided. The phase-dependent wave effects are intrinsically accounted for in the SWASH model, such as nonlinear wave interactions and the generation of wave-induced currents [19] and wave refraction induced by prescribed currents. However, no effects of waves on ambient currents are accounted for.
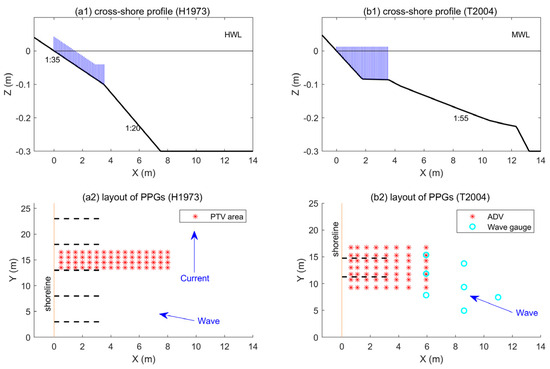
Figure 3.
The cross-shore profiles of the physical experiments. (a1): Hulsbergen and Ter Horst’s (1973) experiment; (b1): Trampenau’s (2004) experiment. The blue lines denote the cross-section of permeable pile groins. The lower panels show the layouts of the two PPG systems, respectively.
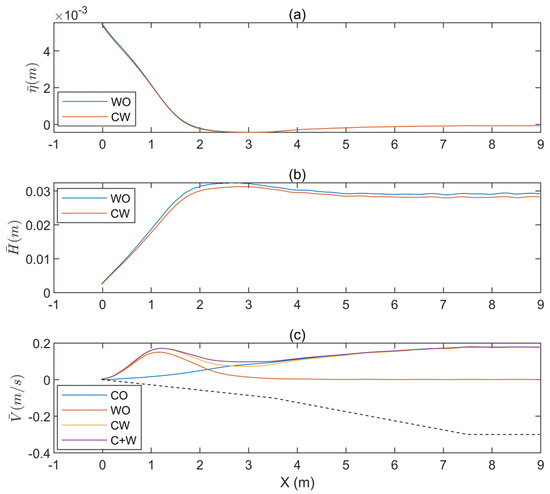
Figure 4.
Comparison of simulation results without groin interventions: (a) ; (b) ; (c) under wave only (WO), current only (CO), and combined wave-current conditions (WO). The ‘W + O’ means linear superimposition of wave-induced current and ambient current velocity in the lowest panel (c), and the dashed line denotes the bottom profile of the H1973 experiment.
It is confirmed in Figure 4 that there are nearly no wave effects on the ambient currents, but the ambient current existence causes current-induced wave refraction, so that the wave-induced longshore current velocity increases within the wave breaker zone (Figure 4c), and the near-orthogonal following current induce a bit decrease in wave height propagating to the shore. Because the physics of wave effects on the ambient currents is still missing in SWASH, it is inappropriate to further discuss the interactions between waves and ambient currents. Therefore, we only present the PPG effects on combined wave-induced currents and ambient currents under this specific validation case. Within the wave breaker zone, wave-induced longshore currents are dominated. Besides the H1973 simulation, other simulation tests in this study only focused on the wave-only condition and wave-induced longshore currents.
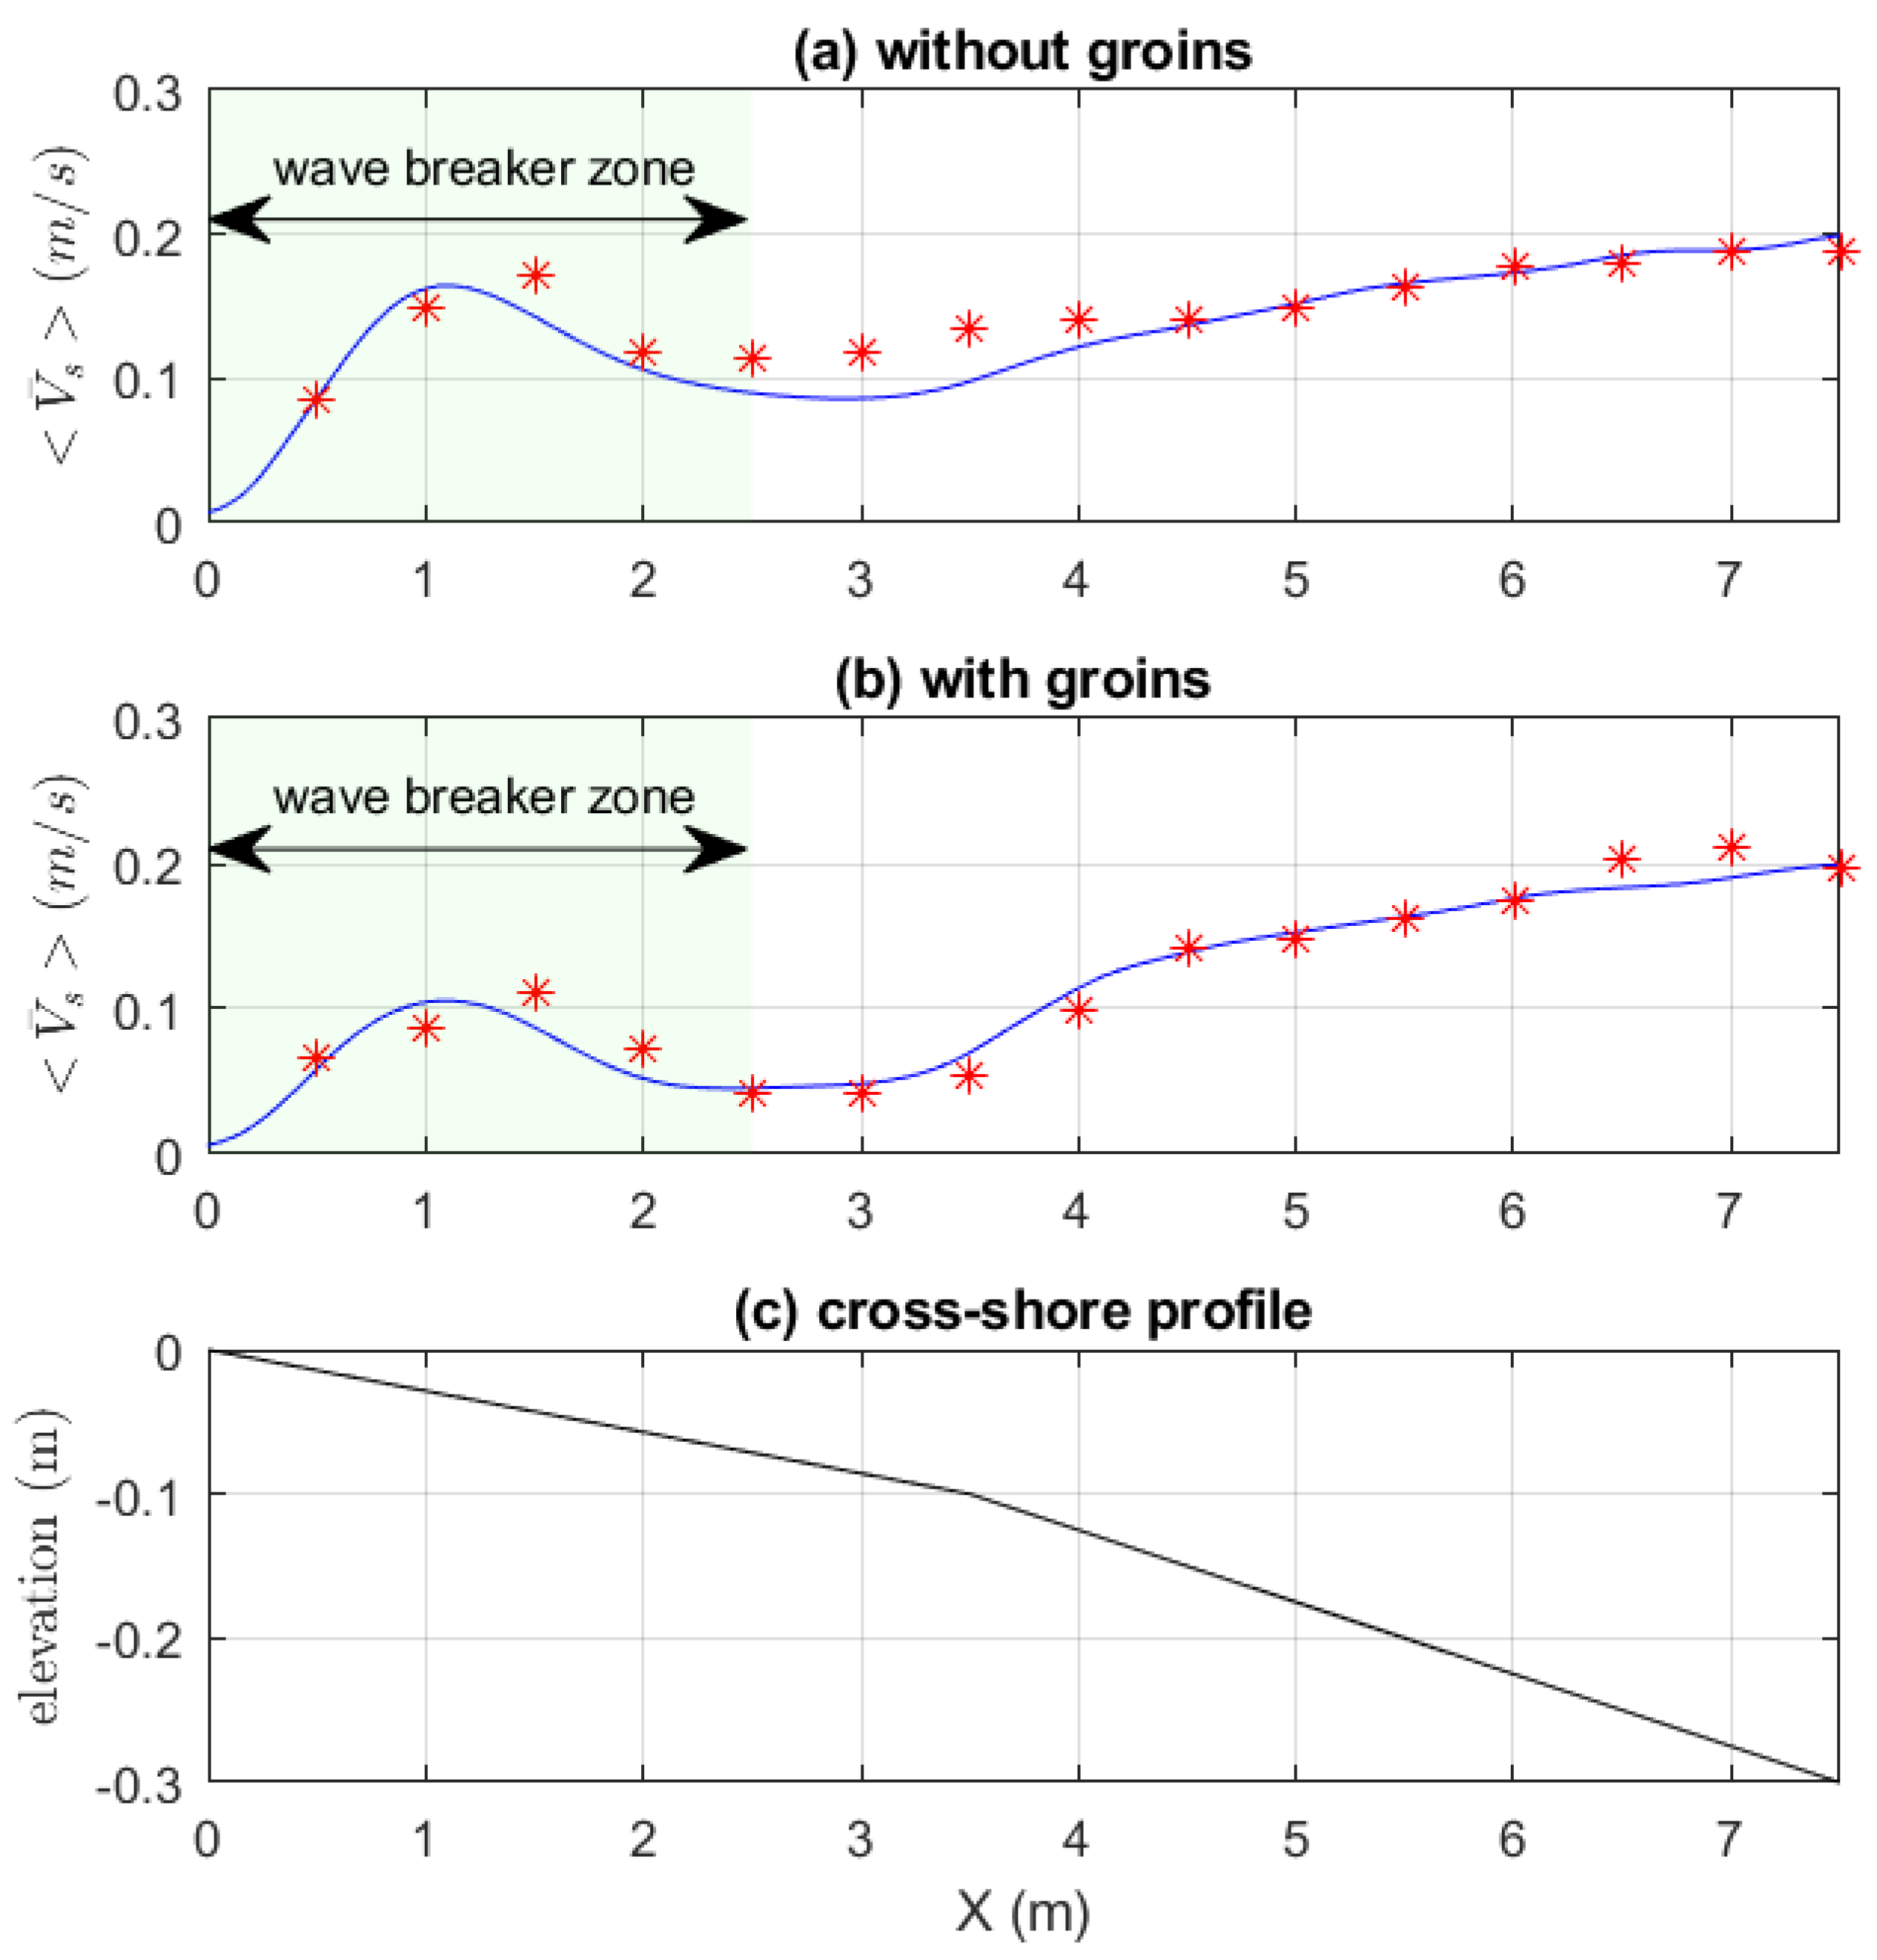
Generally, a good agreement between simulated and measured longshore current velocities within a PPG field is shown in Figure 5, which was adapted from Figure 11 by Zhang and Stive [29]. The longshore current velocities reduced by PPGs are well simulated by the numerical model. The longshore current velocities are effectively reduced within the breaker zone, for PPGs are mostly emergent, while the reduction is very limited at the seaward end of the PPG (at 5 m offshore) due to the submergence of the PPG and strong mixing. However, due to the missing wave-current physics of the phase-resolved SWASH model, we did not further discuss wave-current interaction.
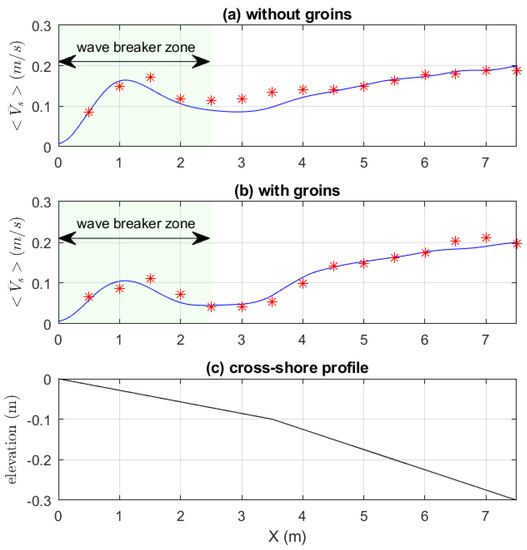
Figure 5.
The comparison of longshore-averaged mean longshore currents <> without groins (up panel) and with groin interventions (middle panel). Red stars represent measurement data, and blue lines denote calculation results. This figure is adapted from Figure 5 and Figure 11 from Zhang and Stive [29].
3.2. Trampenau (2004) Experiments
Trampenau et al. [13] performed systematic physical experiments in the Leichtweiss Institute (LWI) wave basin (26 m long and 19 m wide), focusing on the correlation between the groin configuration parameters and the current velocity and water level variations. The scale is 1:20. The beach slope near the shoreline is 1/20, connecting a nearly horizontal submarine terrace with a slope of about 1:200, then a 1:55 gentle slope extending to a flat bottom (Figure 3b). One of the obliquely incident regular wave conditions H = 0.05 m, T = 1.23 s, and = 30° was selected to validate the numerical model. The selected permeability of the single pile row groin is 50%. The diameter of cylinder dowels that were used in the experiment is 0.01 m and the groin length (Lg) is equal to the width of the breaker zone (xb).
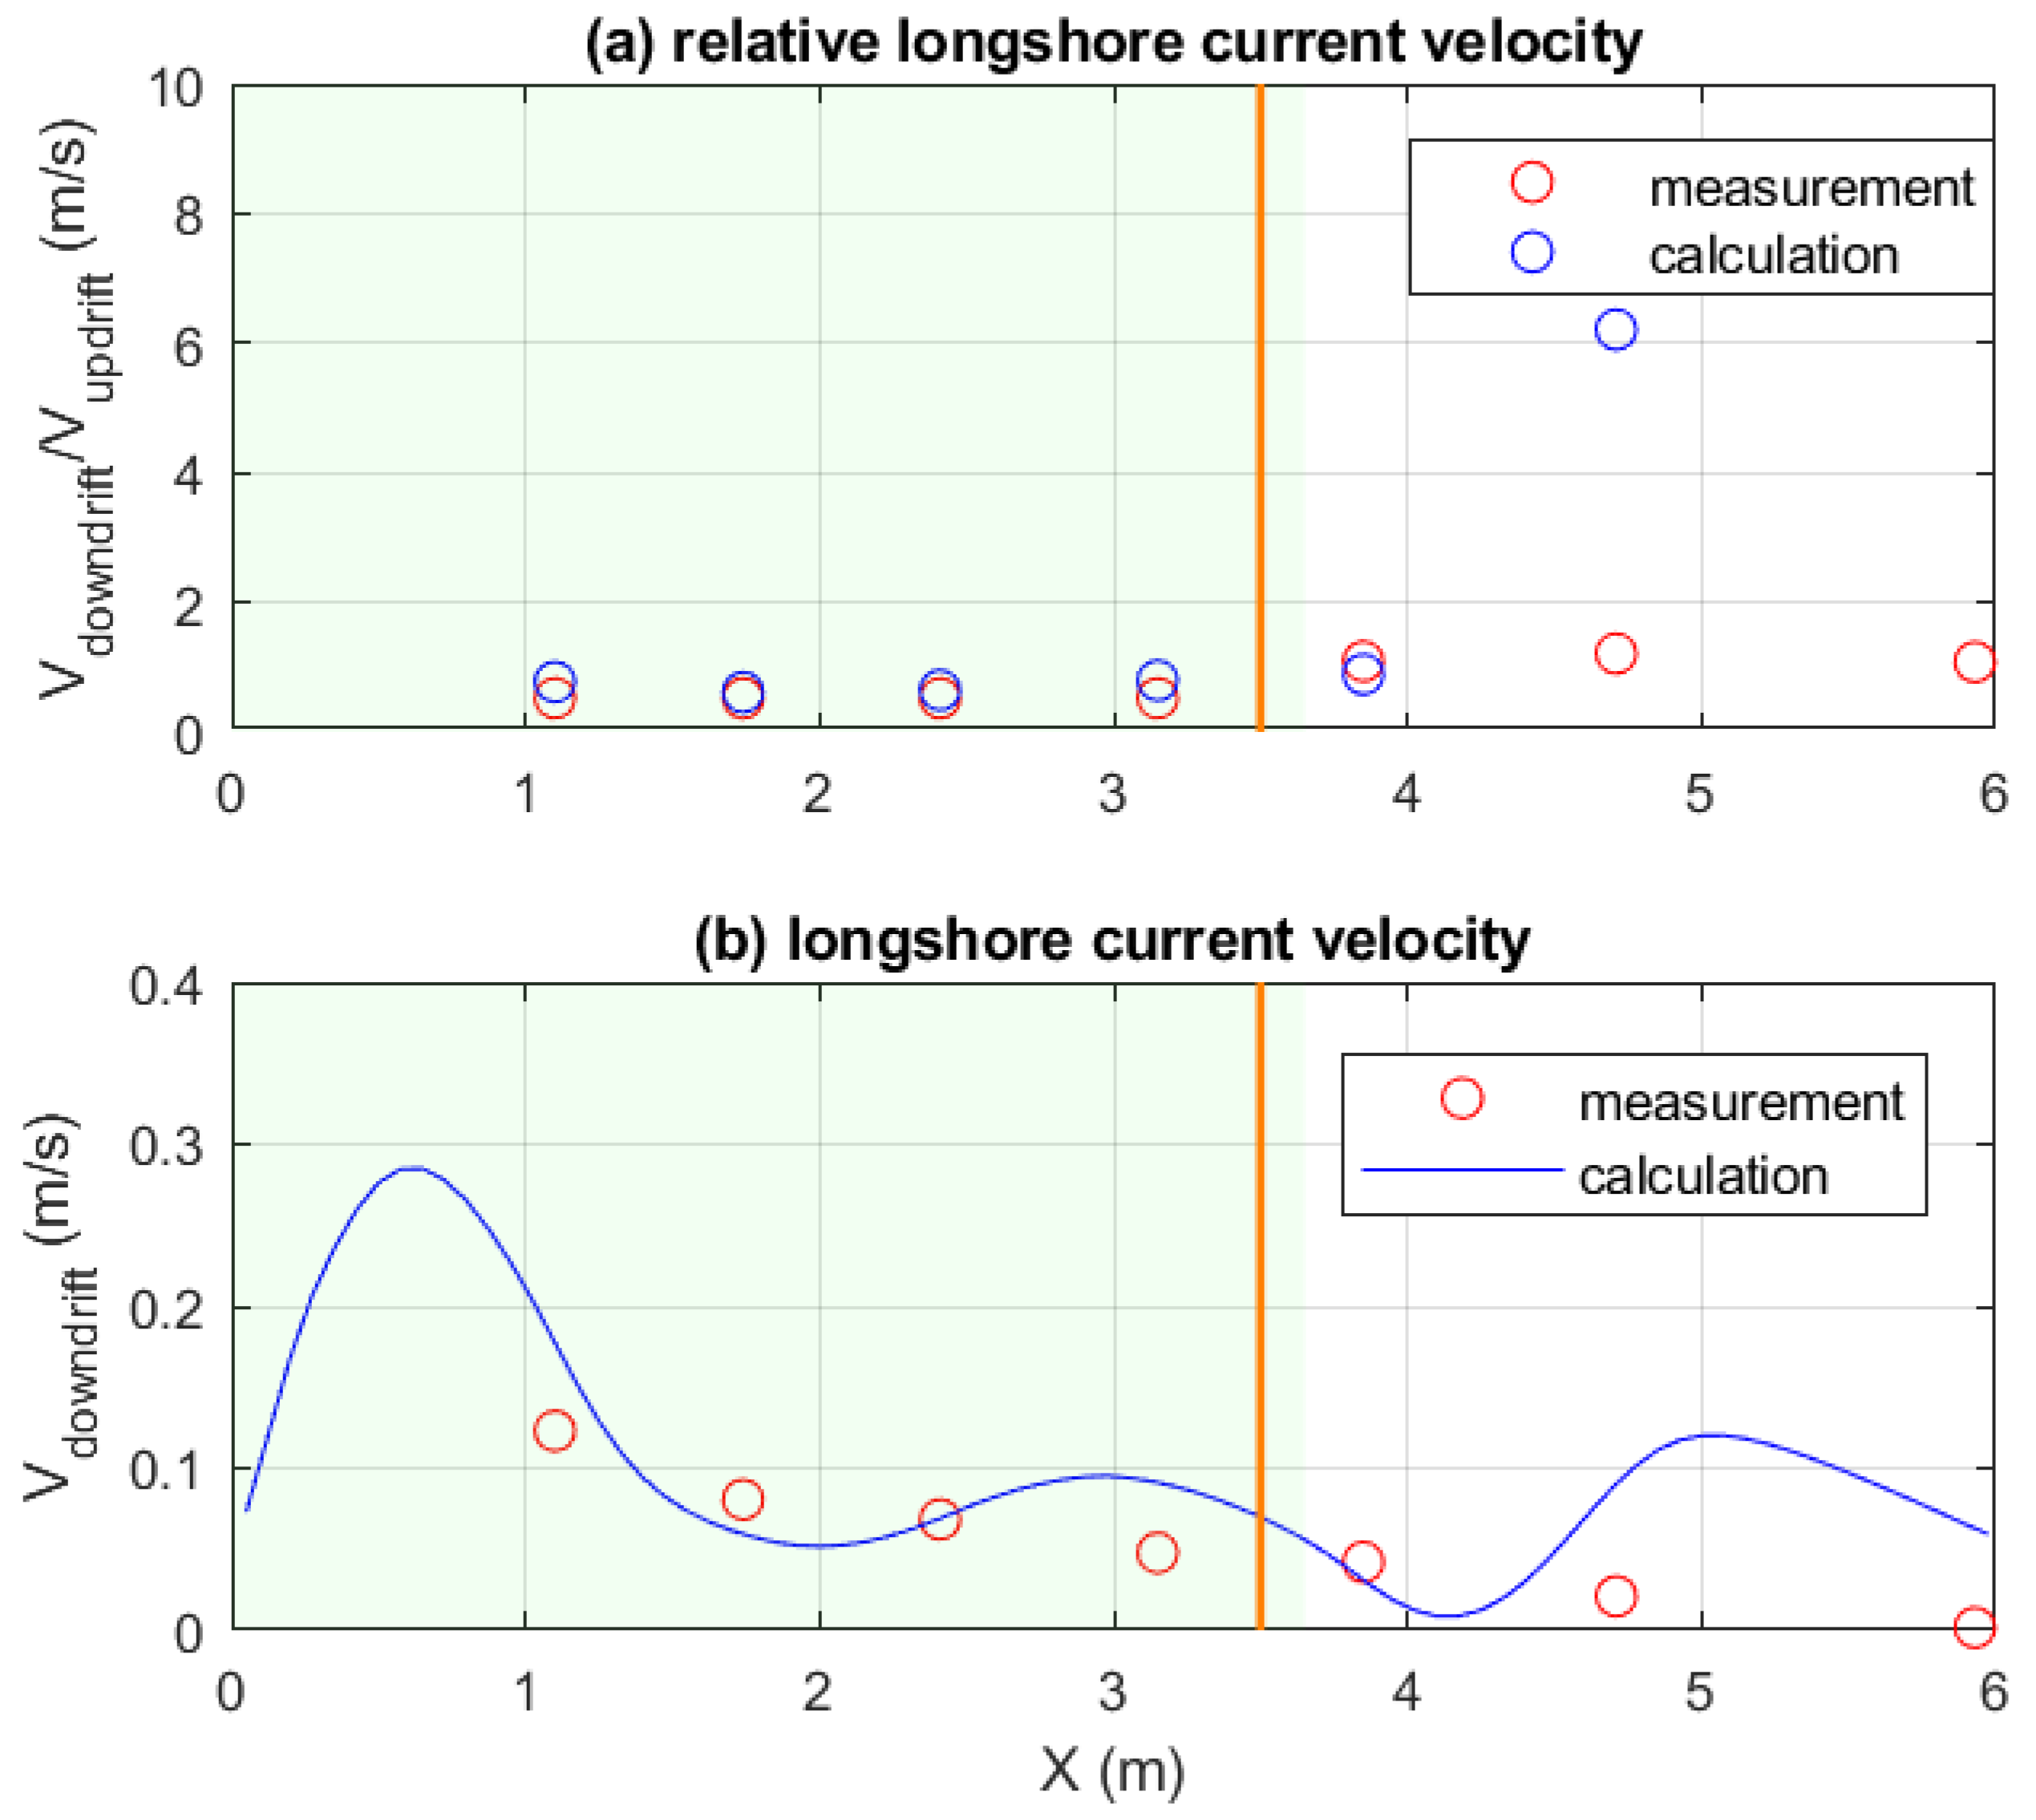
In this simulation, the computational domain was divided into 10 layers in the vertical direction, and discretized by 400 grids in the x direction (Δx = 0.0375 m) and 260 grids in the y direction (Δy = 0.1 m). The flow domain was 15 m wide and 26 m long. The bottom roughness coefficient was set as 0.0008 m following the validation setting of Hulsbergen and Ter Horst’s [28] experiment. In Figure 6, the comparison of measured and calculated longshore current velocities on the bare bottom without groin effects is shown. The calculated longshore current velocities agree well with the measured values, showing the maximal current velocities V = 0.23 m/s appearing at about 2 m seaward of the shoreline. When the groin intervention was considered, the drag coefficient CD was set to 1.1 following the calibration by Zhang and Stive [29]. The reason for omitting the calibration of CD was the lack of available measurement data. The deduction in measured longshore current velocities from available dimensionless, relative longshore current velocities would introduce uncertainties. Therefore, the simulations will have higher confidence in qualitative analysis. When the permeability is 50%, the cylinder density is N = 5000 stems/m2. The simulated relative longshore current velocities are similar to the measured values within the breaker zone (Figure 7a). The relative longshore current velocities are the percentage of velocities at 0.5 m downdrift of the first upstream groin over the uninterrupted values updrift the groins. The derived longshore current velocities are given as a reference in Figure 7b). The values are obtained from the product of the dimensionless relative velocity values and the calculated unimpeded longshore current velocities updrift the groins. Compared to longshore current velocities without groin interferences depicted in Figure 6, it is shown in Figure 7 that the maximal longshore current velocity within the groin field was effectively reduced, while the second peak of the maximal velocity is still significant. That is partly due to wave breaking being intense near the shoreline and the outflanking induced by the shoreward groin roots. Shoreward from the PPG head to the shoreline, the relative longshore current velocities are successfully reproduced, except for an overestimation near the seaward groin head (Figure 7a). Such a large overestimation is due to a further deflection of the stronger longshore currents near the groin head, as observed in Figure 7b). The stronger deflection of the longshore current is partly due to the imperfect implementation of a PPG in the SWASH model. There are no real cylinders blocking some part of the water volume and allowing water to pass through their openings. Instead, the drag forces exerted by a PPG on the water volume are calculated. Although the representation of a PPG in SWASH is simplified, it reproduces the principal effects of PPGs on longshore currents. The bulk reduction in longshore current velocities within a groin field by PPGs was appropriately simulated.
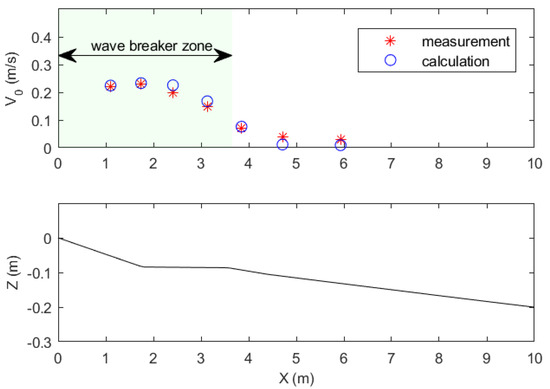
Figure 6.
The comparison of longshore current velocities without groin intervention (the up panel), and the bottom topography (the bottom panel).
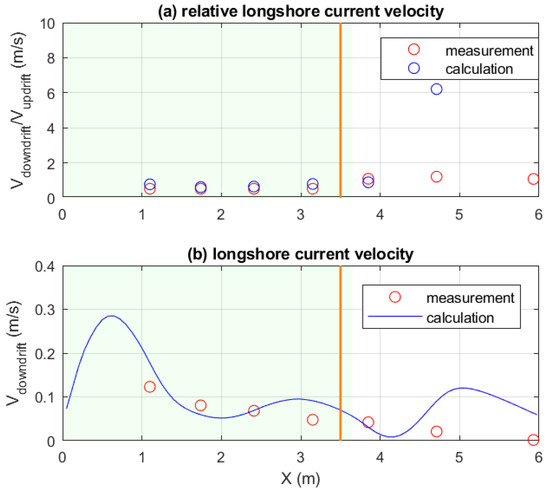
Figure 7.
The relative longshore current velocity at 0.5 m downdrift of the groin over that at 2 m updrift the first groin (a), and the calculated (blue line) and derived measured (red circles) longshore current velocities at 0.5 m downdrift of the groin (b). The groins have a permeability of 50% and a length of 3.5 m. The orange lines represent the location of groin seaward heads and the green shadow denotes the wave breaker zone width.
It was observed that in laboratory experiments the lower permeability of PPG induced a higher velocity reduction within a groin field. The experimental data show that the reduction ratio at 0.5 m downdrift of the first groin is 62% of undisturbed longshore current velocity when the permeability is 30% compared to a 27% reduction when the permeability is 50%. Suzuki et al. [31] found that when the permeability of a rigid vegetation patch is low, the porosity effect was validated as very important to wave propagation over the patch. The rigid vegetation is represented in the same way as a PPG in the SWASH model, namely by rigid cylinders. Similarly, the porosity effects of low permeability (P = 30%) of a PPG on longshore currents in the SWASH model were tested. Figure 8b demonstrates that when the porosity effect was considered, the SWASH model calculated a more accurate longshore current velocity downdrift of the groin than without the porosity effect. However, when the inertial coefficient Cm = 1 is applied, no notable changes are found (Figure 8). In general, the longshore current profiles downdrift of the groin, calculated by the SWASH model, agree with the experimental results. However, the longshore current reduction ratio downdrift of the groin is underestimated. This could be partly due to the fact that the PPG cylinders are not resolved; instead, the PPG cylinder-induced forces (e.g., drag force, inertial force) are resolved within a computational grid cell. In this case, the grid resolution is 0.04 m of PPG implementation, which is four times the true pile cylinder diameter of 0.01 m. For the model, the groin consists of a one-pile cylinder row, where the groin width is equal to the cylinder diameter. Therefore, the total PPG forces averaged over a coarser grid cell actually lead to a weaker force per unit area. On the other hand, the porosity (n = 1 − N × π × D2/4, where N is the density of cylinders) has to be changed with the varying density, to keep the frontal area of a groin constant, namely N × Widthgroin = N′ × Widthgrid. In addition, more significant deviations in longshore current velocities are observed both near the groin shoreward root and the groin seaward head. This illustrates that the measured sharper velocity gradients of longshore currents at these locations are underestimated., which implies that the local momentum mixing there needs a more sophisticated viscosity model.
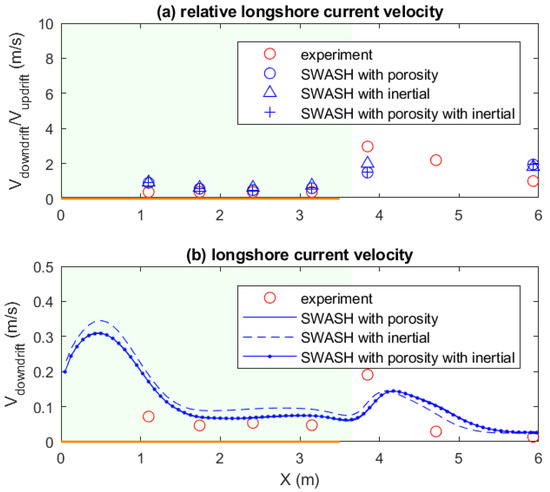
Figure 8.
The relative ratio of longshore current velocity at 0.5 m downdrift of the groin over the undisturbed velocity updrift the first groin (a), and the calculated (blue lines) and derived measured (red circles) longshore current velocities at 0.5 m downdrift of the groin (b). The groins have a permeability of 30% and a length of 3.5 m. The orange lines denote the groin length in the cross-shore direction and the green shadow denotes the wave breaker zone width.
4. Comparison of Different Groin Layouts
In this section, the simulation results of different groin layouts consisting of fice groins under varying wave conditions are compared. The beach profile and the two-pile-row configuration of the PPG from Hulsbergen and Ter Horst’s experiment [28] were adopted because the width of the two-pile-row groin is similar to the computationally efficient grid resolution as was the case for the one-pile-row groin. Consequently, when keeping the vertical frontal area of a groin constant, the porosity and unit groin reduced forces are closer to that of a real groin.
In Figure 9, it is shown that PPG effectively reduces longshore current velocities V within the breaker zone by about 50%. Although the reductions in V gradually increase the downdrift of the groin system., the longshore current velocity fields are quite similar within the second to fourth groin bays, except a smaller reduction appears in the first groin bay. Therefore, the longshore current velocities averaged along the whole groin system field <v> are representative values to be discussed in the following sections. The longshore currents started to reduce when approaching very close to the first groin (e.g., 0.5 m updrift), whereas much further downdrift the last groin, the longshore current gradually recovered to undisturbed magnitudes (e.g., 6.5 m downdrift).
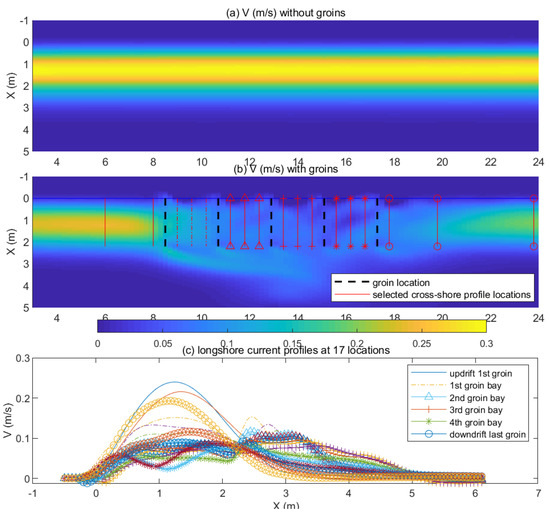
Figure 9.
The comparison of longshore current velocities V (m/s) with and without groin intervention under waves (H = 0.03 m, T = 1.5 s). The groin spacing distance equals the groin length, which are both 2.2 m. The groin permeability is 50%. The bottom panel shows the variations of longshore current profiles at 17 different locations adjacent to PPGs.
4.1. Groin Spacing Effects
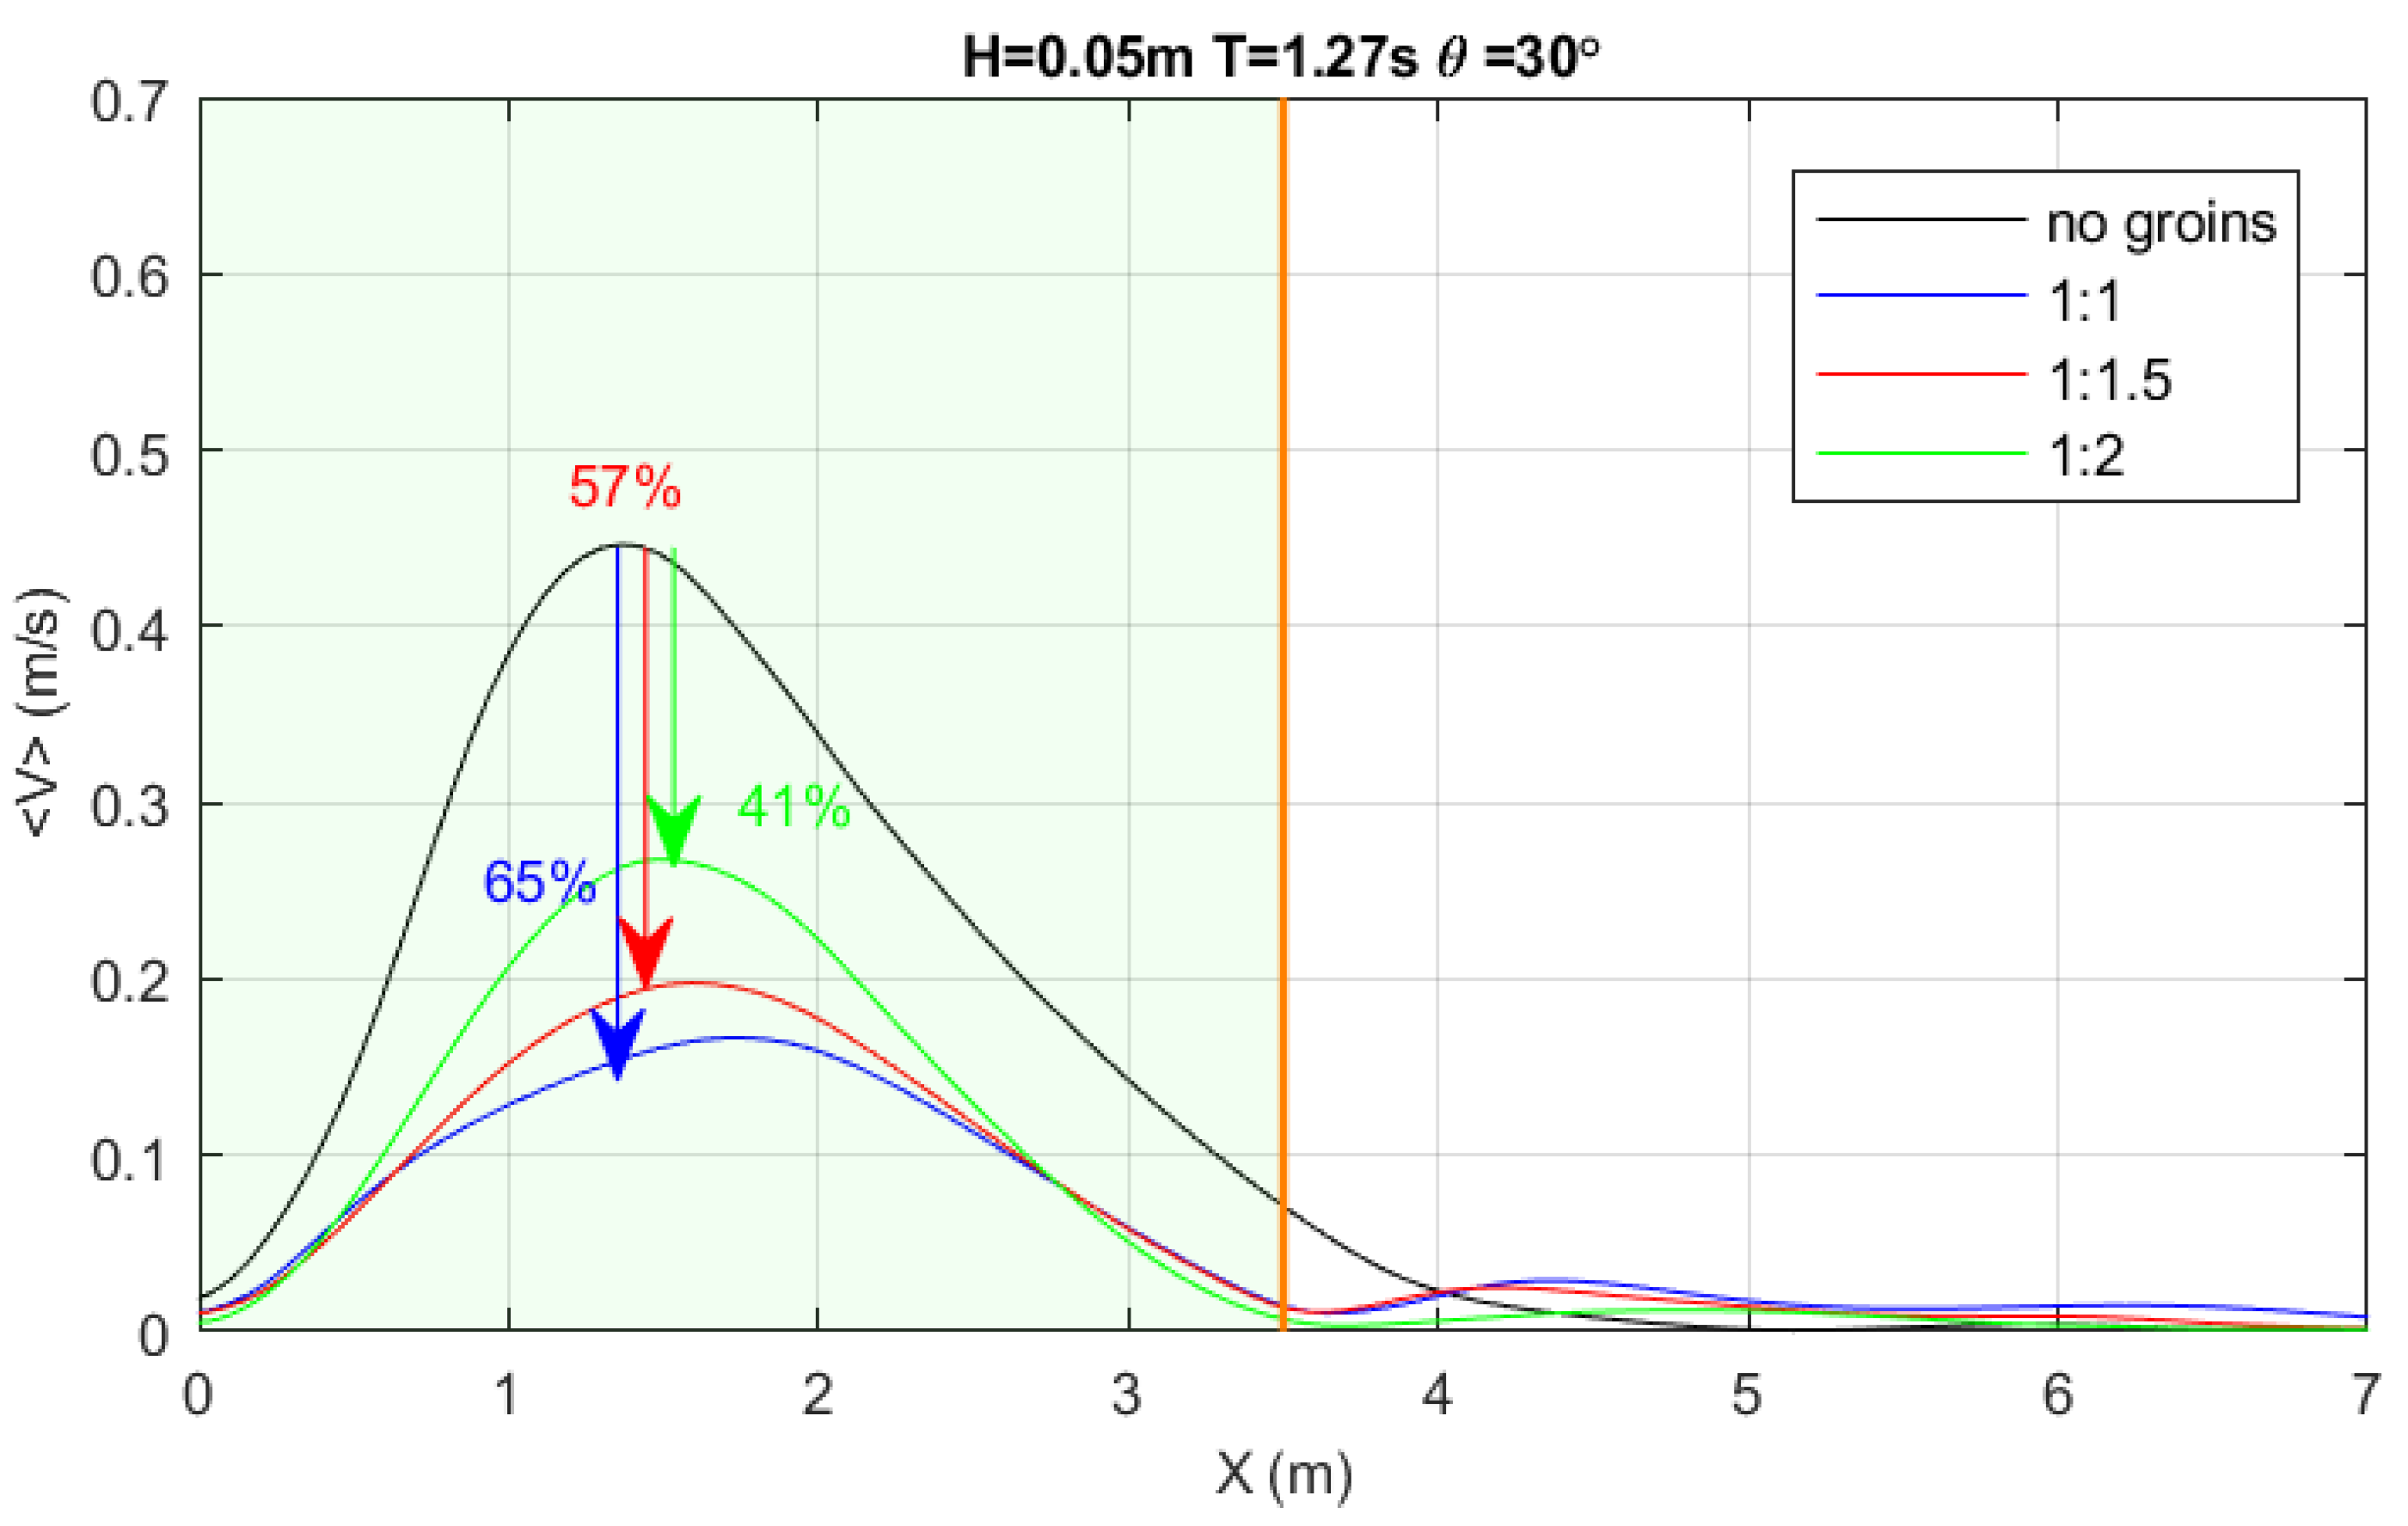
To investigate the groin spacing effect on the longshore current reduction rate, three spatial ratios of groin spacing over groin length (i.e., 1:1, 1:1.5, and 1:2) were set up. The groin lengths are 2.2 m under slight waves and 3.5 m under moderate waves, which are both weakly larger than the breaker zone widths. The permeability of the PPG is 50%. Under a slight wave state (H = 0.03 m), as shown in Figure 10, the longshore current reduction in a maximal longshore current is 65% when the spatial ratio is 1:1. Along with the groin spacing increasing to 1.5 times and 2 times the groin length, the longshore current reduction capacity of PPGs decreases to 57% and 51%, respectively. Under a moderate wave climate (H = 0.05 m), the results are similar (Figure 11). The longshore current reduction ratios are 65%, 57%, and 41%, when the spatial ratio is 1:1, 1:1.5, and 1:2, respectively.
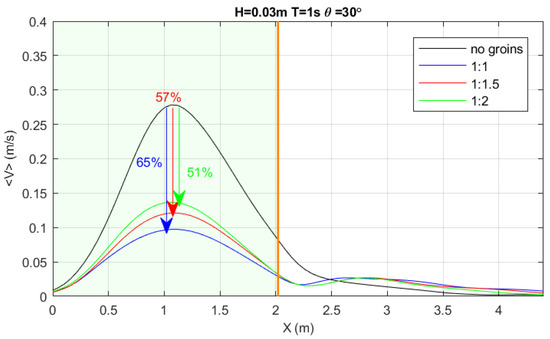
Figure 10.
The comparison of longshore current velocities averaged along groin fields <v> with and without groin intervention under waves (H = 0.03 m). The groin spacing distance varies from 1, 1.5, and 2 times the groin length. The groin permeability is 50%. The orange lines represent the location of groin seaward heads and the green shadow denotes the wave breaker zone width.

Figure 11.
The comparison of longshore current velocities averaged along groin fields <v> with and without groin intervention under waves (H = 0.05 m). The groin spacing distance varies from 1, 1.5, and 2 times the groin length. The groin permeability is 50%. The orange lines represent the location of groin seaward heads and the green shadow denotes the wave breaker zone width.
4.2. Groin Length Effects
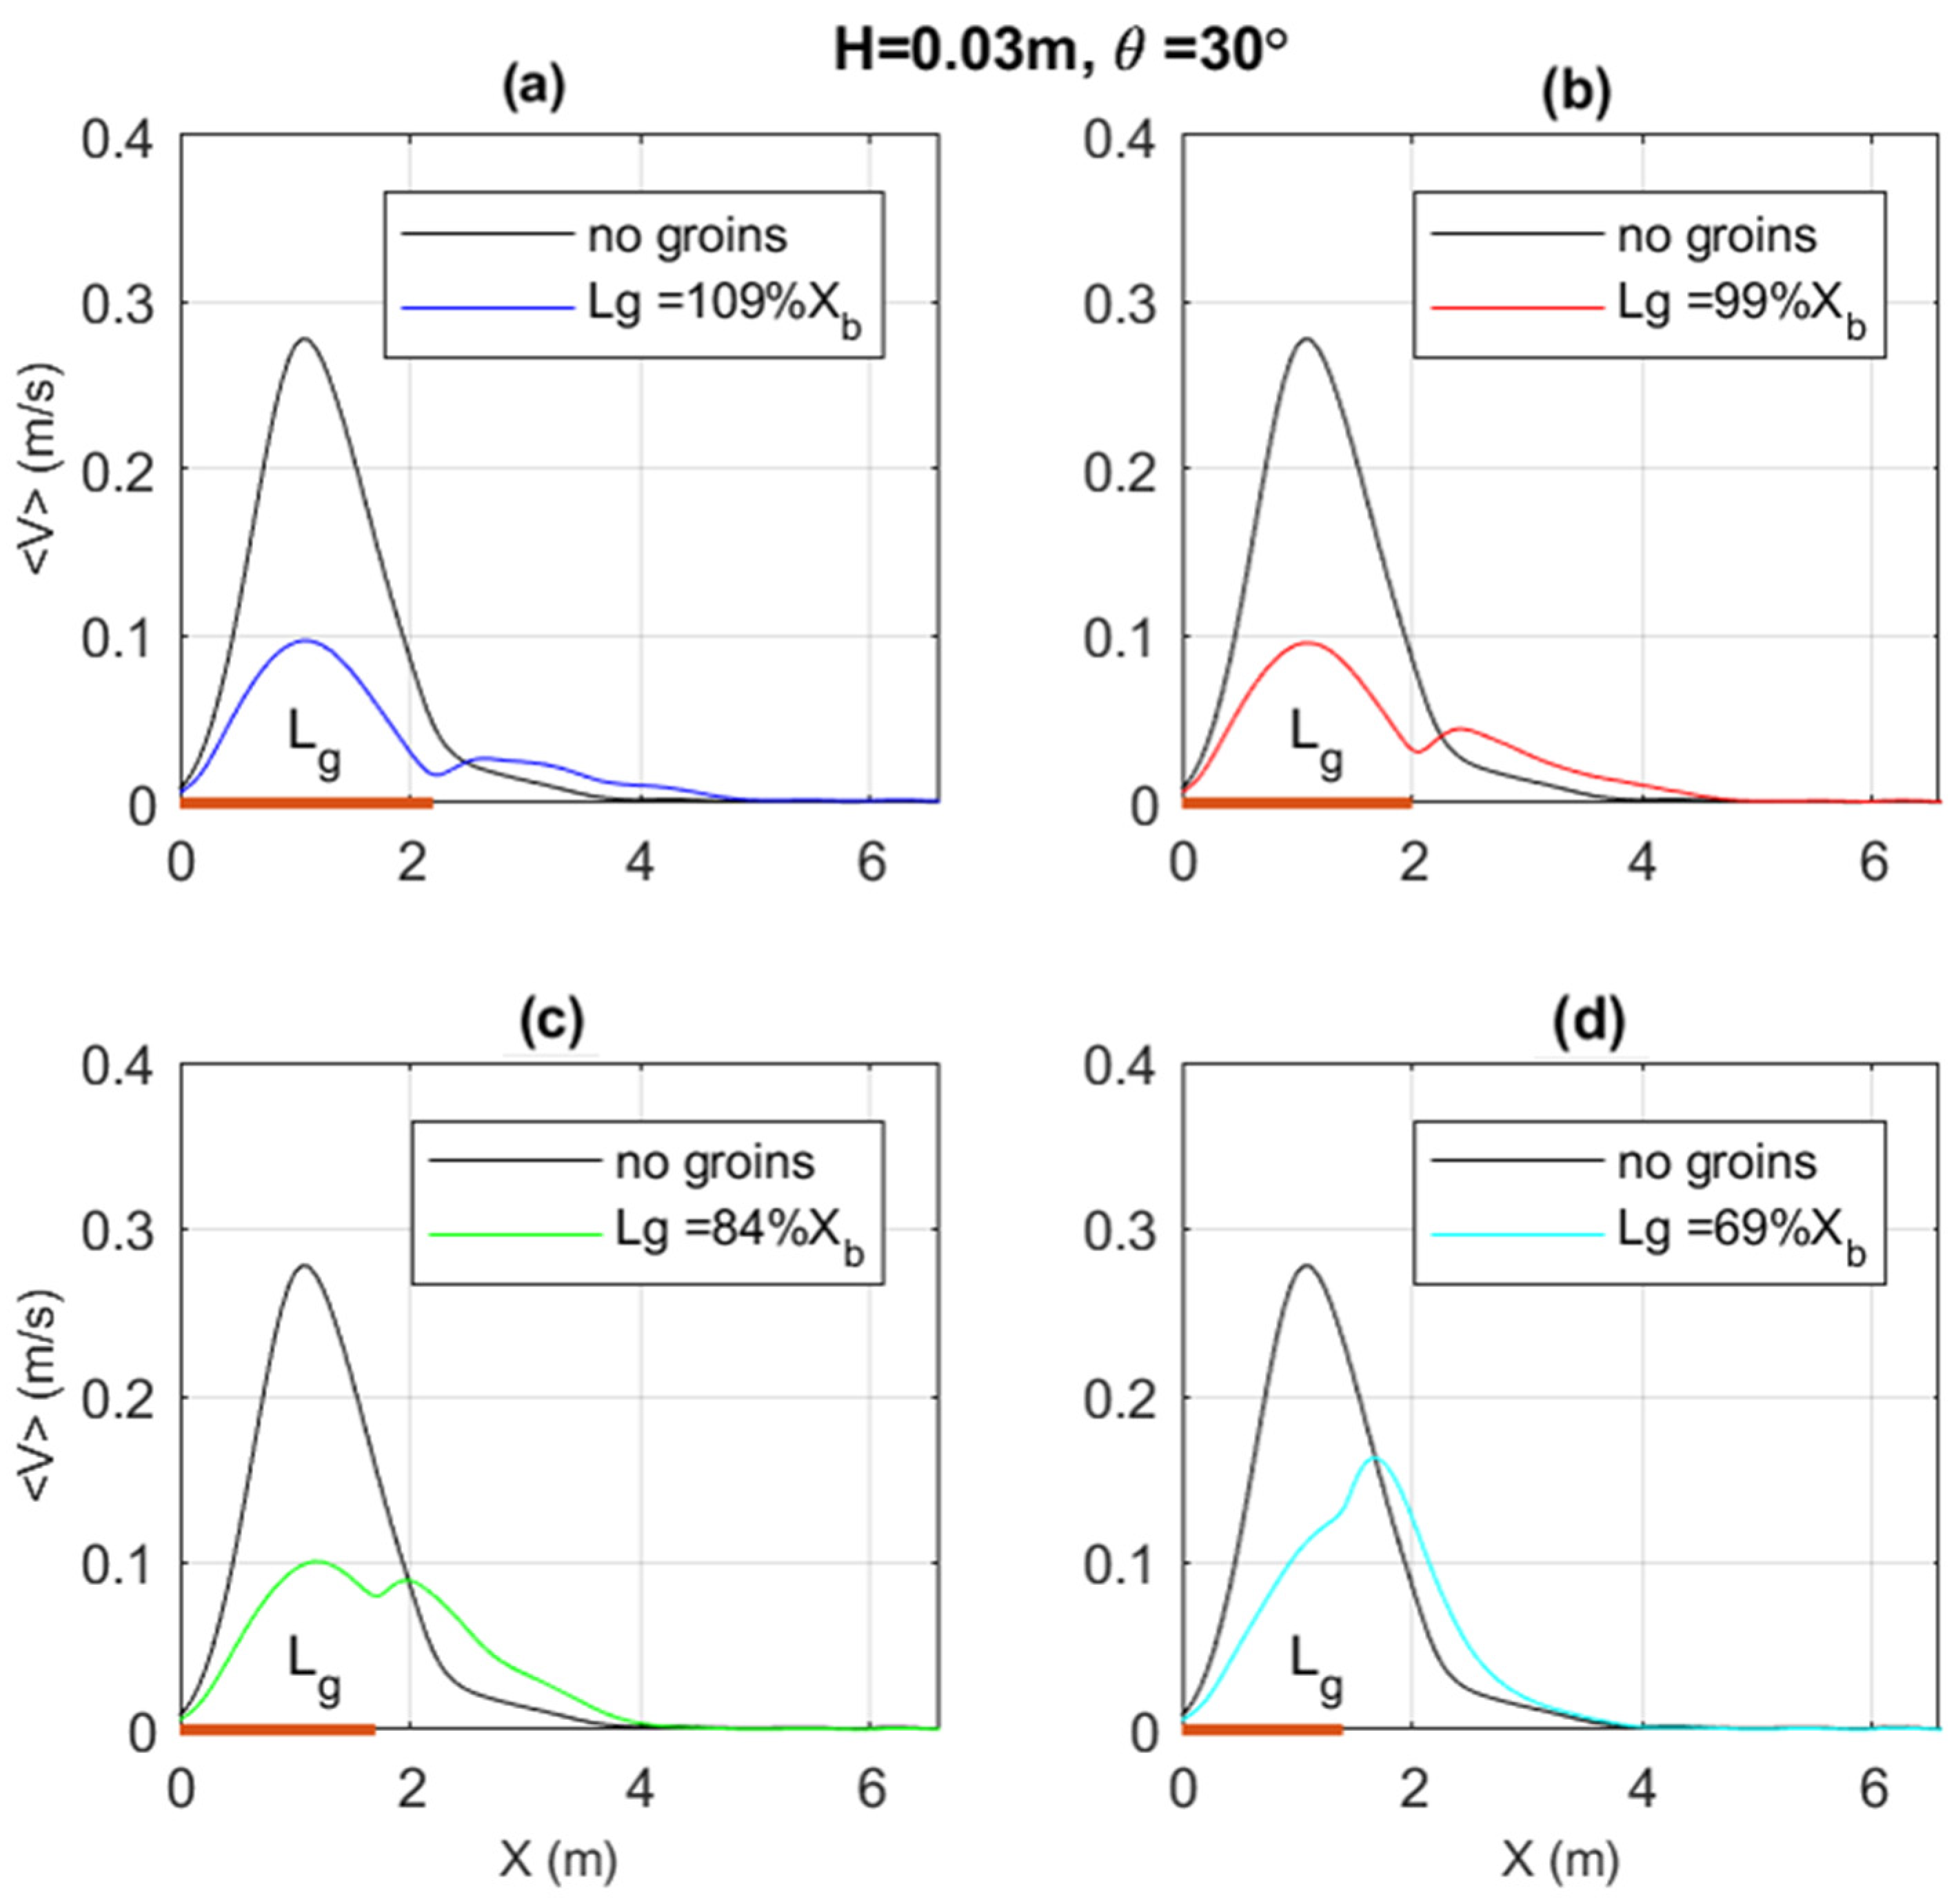
In addition to the groin’s spatial ratio factor, groin length is a crucial configuration parameter. To quantify the difference in a groin’s longshore current reduction capacity with varying groin lengths, four different groin lengths were simulated. The wave condition was light (H = 0.3 m, T = 1 s). The width of the breaker zone is 2.02 m. The groin lengths are 2.2, 2.02, 1.7 and 1.4 m, respectively, and the ratios of groin length to the width of the breaker zone are 109%, 99%, 84%, and 69%, respectively. In Figure 12, the results show that when the groin length is slightly longer (Lg/Xb = 109%) or nearly the same (Lg/Xb = 99%), the longshore current velocities are efficiently reduced. When the groin length is 16% shorter than the width of the wave breaker zone, the maximal/um longshore current at the middle of the breaker zone is likewise quite obstructed, but the longshore currents are hardly reduced by the seaward heads of a groin and significantly enhanced at the seaward breaker line (i.e., from 2 m seaward to 4 m seaward, Figure 12, left lower panel). For the shortest groin length (Lg = 1.4 m, Lg/Xb = 69%), the reduction ratio of maximal longshore current velocity increases from about 35% to 40%. From the groin head to the wave breaker line, the interrupted longshore current increases. When the offshore distance reaches 19% of the groin length or 82% of the breaker zone width, the interfered longshore current is the strongest. These quantities verify the design rule that the groin length should cross most parts of the wave breaker zone to guarantee an efficient longshore current reduction. From the simulations, we suggest the groin length should not be 85% shorter than the wave breaker zone width.
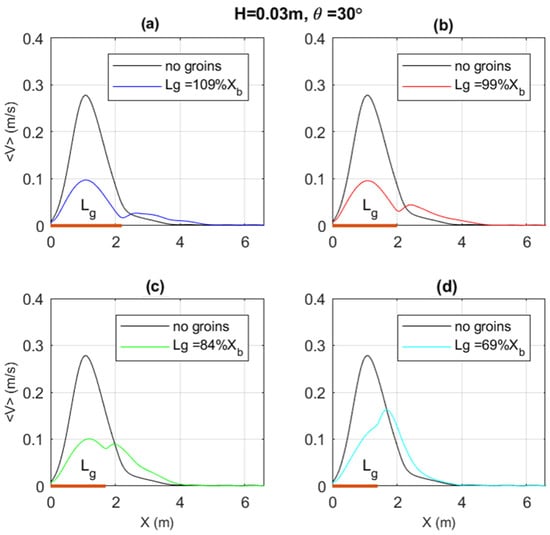
Figure 12.
(a–d) The comparison of longshore current velocities averaged along groin fields <v> with and without groin intervention under waves (H = 0.03 m, T = 1 s, Xb = 2.02 m). The groin length varies from 1.09, 0.99, and 0.84 to 0.69 times the wave breaker zone. The orange lines denote the groin length in the cross-shore direction. The groin permeability is 50%.
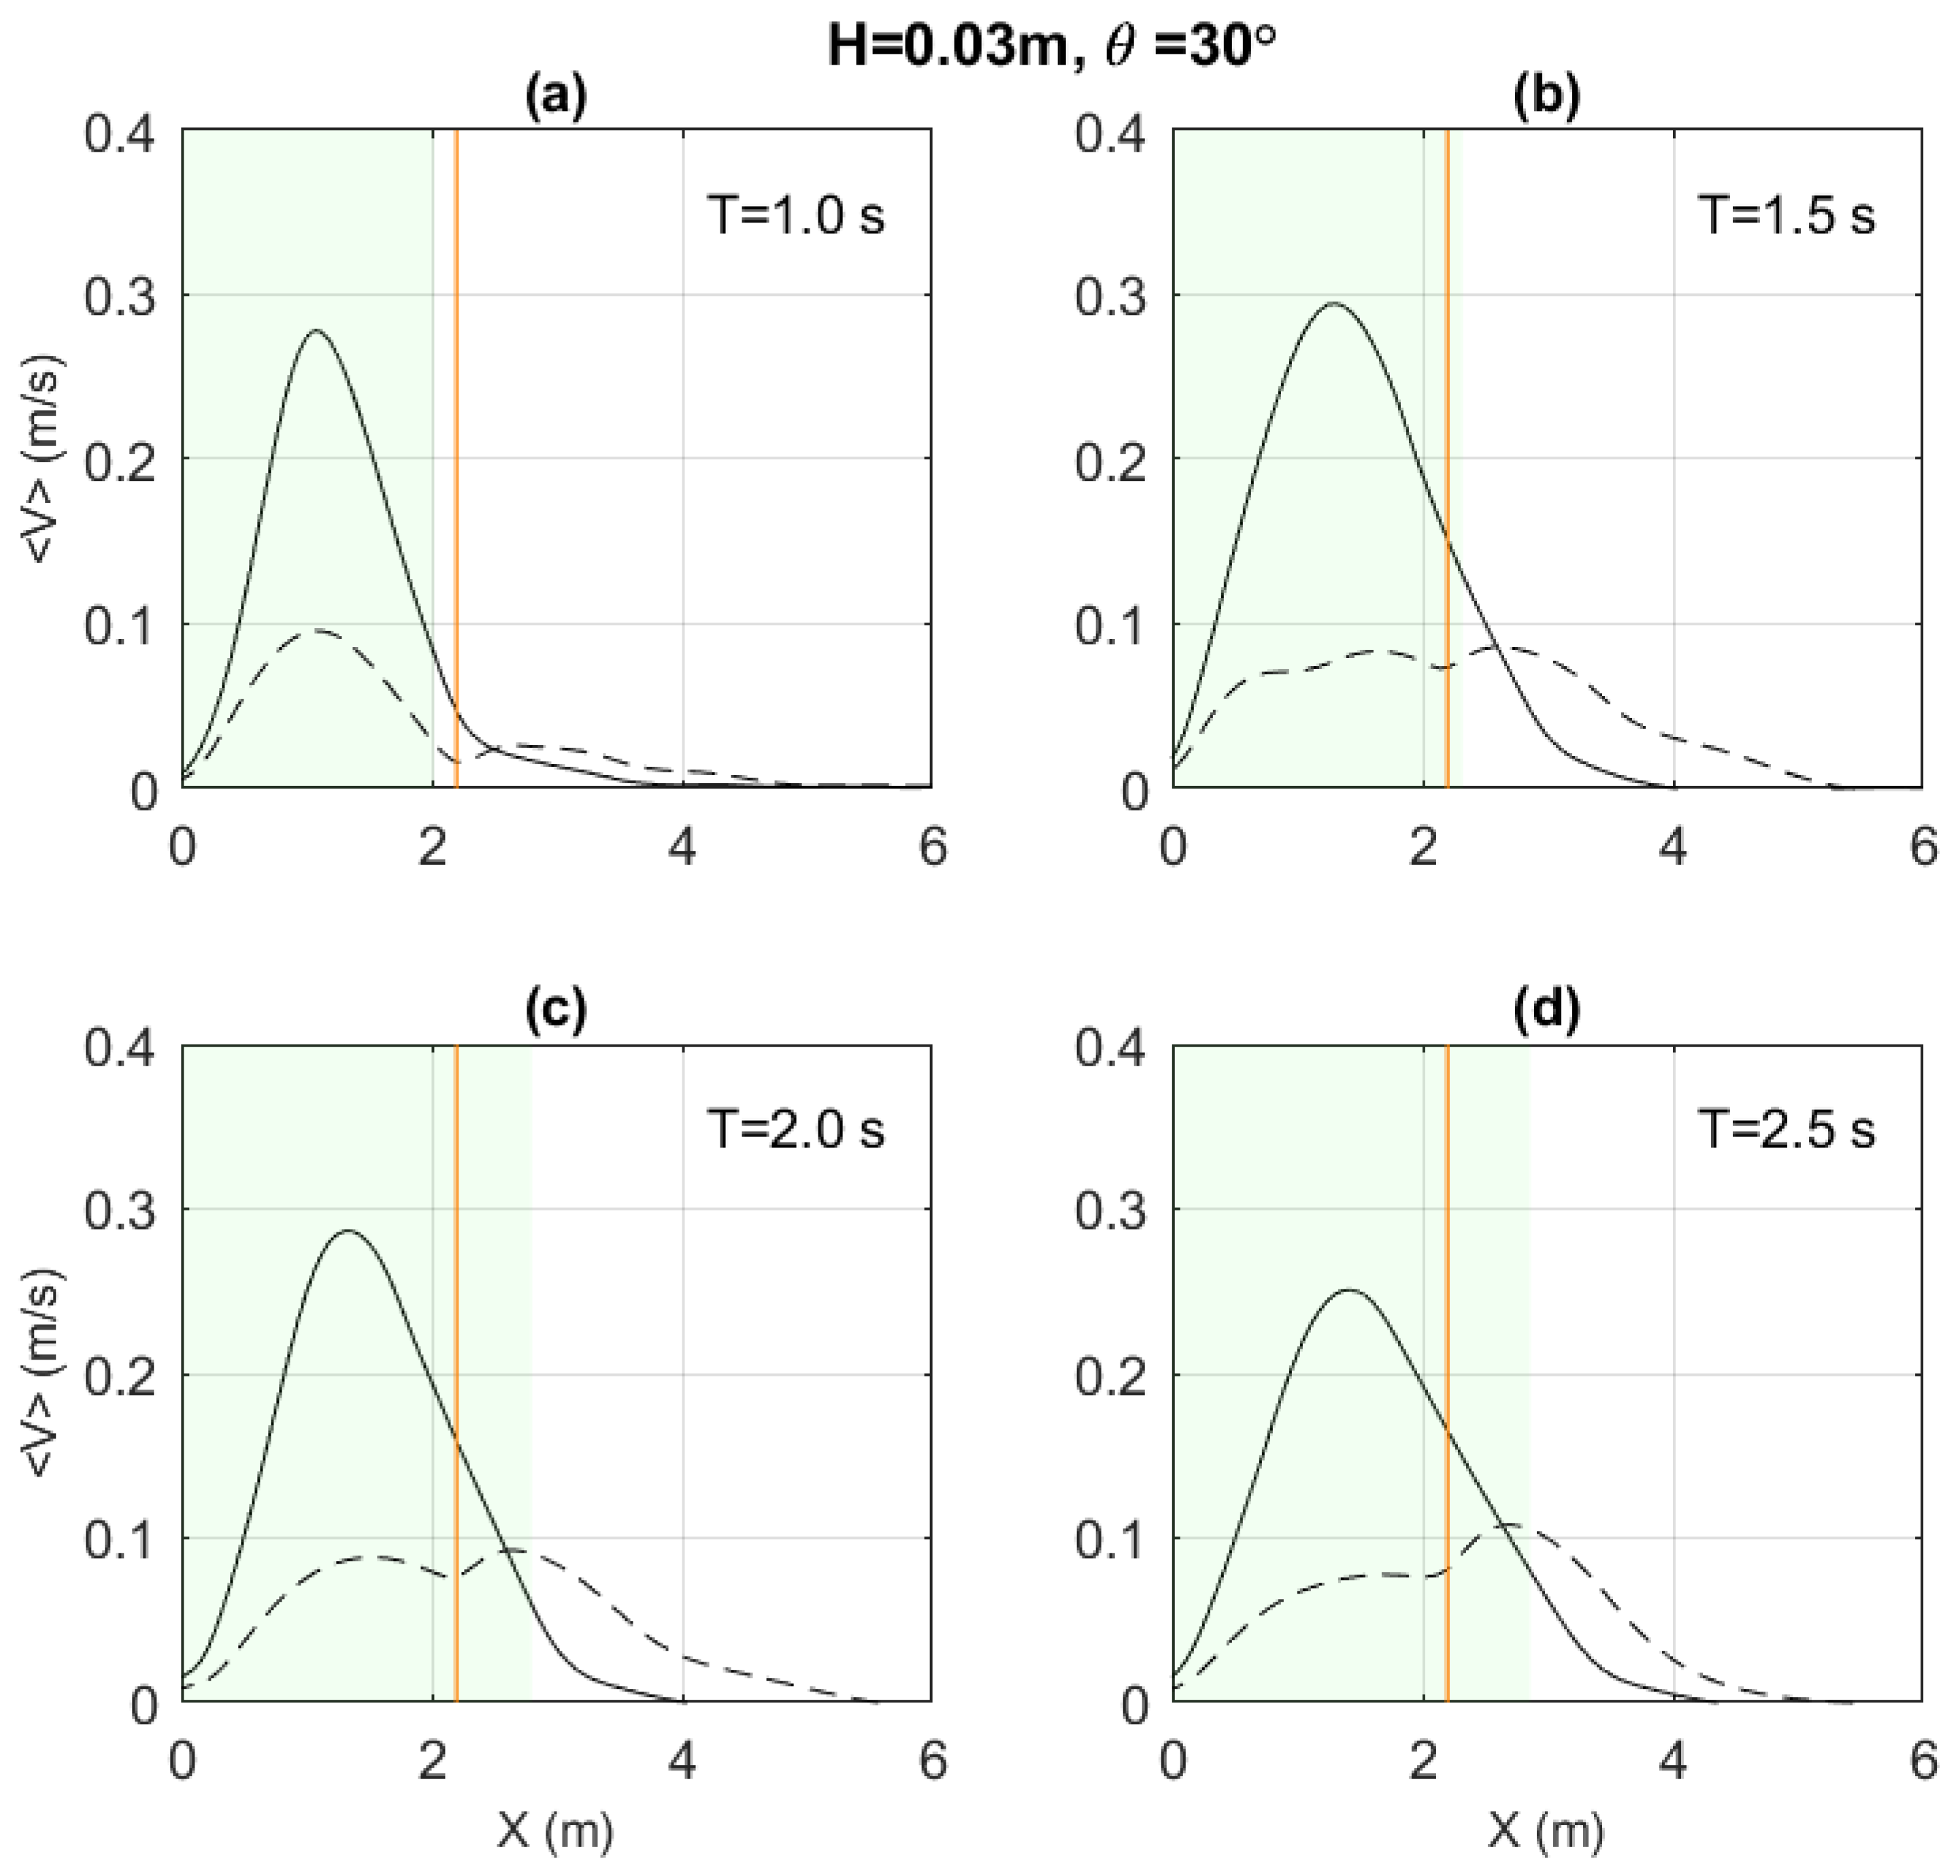
4.3. Wave Period Effects
In Figure 13, the simulated longshore currents over the non-groin-engineered bottom and over the groin-engineered bottom under regular wave conditions with different wave periods are shown. The wave periods vary in the range of 1.0 s and 2.5 s. The wave height was set constant at 0.03 m. The groin spacing equals the groin length, which is set as 2.2 m. The wave direction is 30°. Without groin intervention, the longshore currents are uniform. In cross-direction, the longshore currents spread mostly within the breaker zone. For a given wave height, when the wave period is longer, the wave breaker locations shift further seaward from 2.02 m when T = 1 s to 2.86 m when T = 2.5 s (Table 1). Consequently, the longshore currents spread further seaward till 4 m offshore (Figure 13). The maximal longshore current velocity increases slightly when a wave period increases. However, when the waves are longer, the waves refracted faster to shore-normal direction than shorter waves, according to Snell’s law. The surf zone average longshore current velocity is positively correlated to the sinusoidal of twice the breaker angle. The smaller wave breaker angle induced by longer waves leads to a reduction in the maximal longshore current velocity, which compensates for the enhancement effect of the longer wave period.
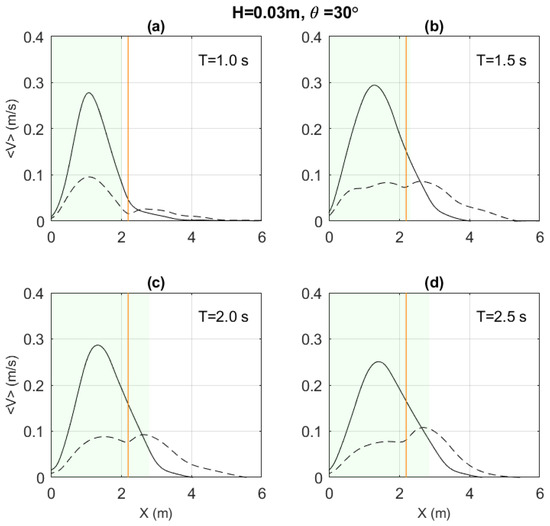
Figure 13.
The comparison of longshore current velocities averaged with groin fields <v> with and without groin intervention under waves with different periods: (a) T = 1.0 s; (b) T = 1.5 s; (c) T = 2 s; (d) T = 2.5 s. The solid lines denote the situation without groins, and the dashed lines show that with groins. The orange lines represent the location of groin seaward heads and the green shadow denotes the wave breaker zone width.
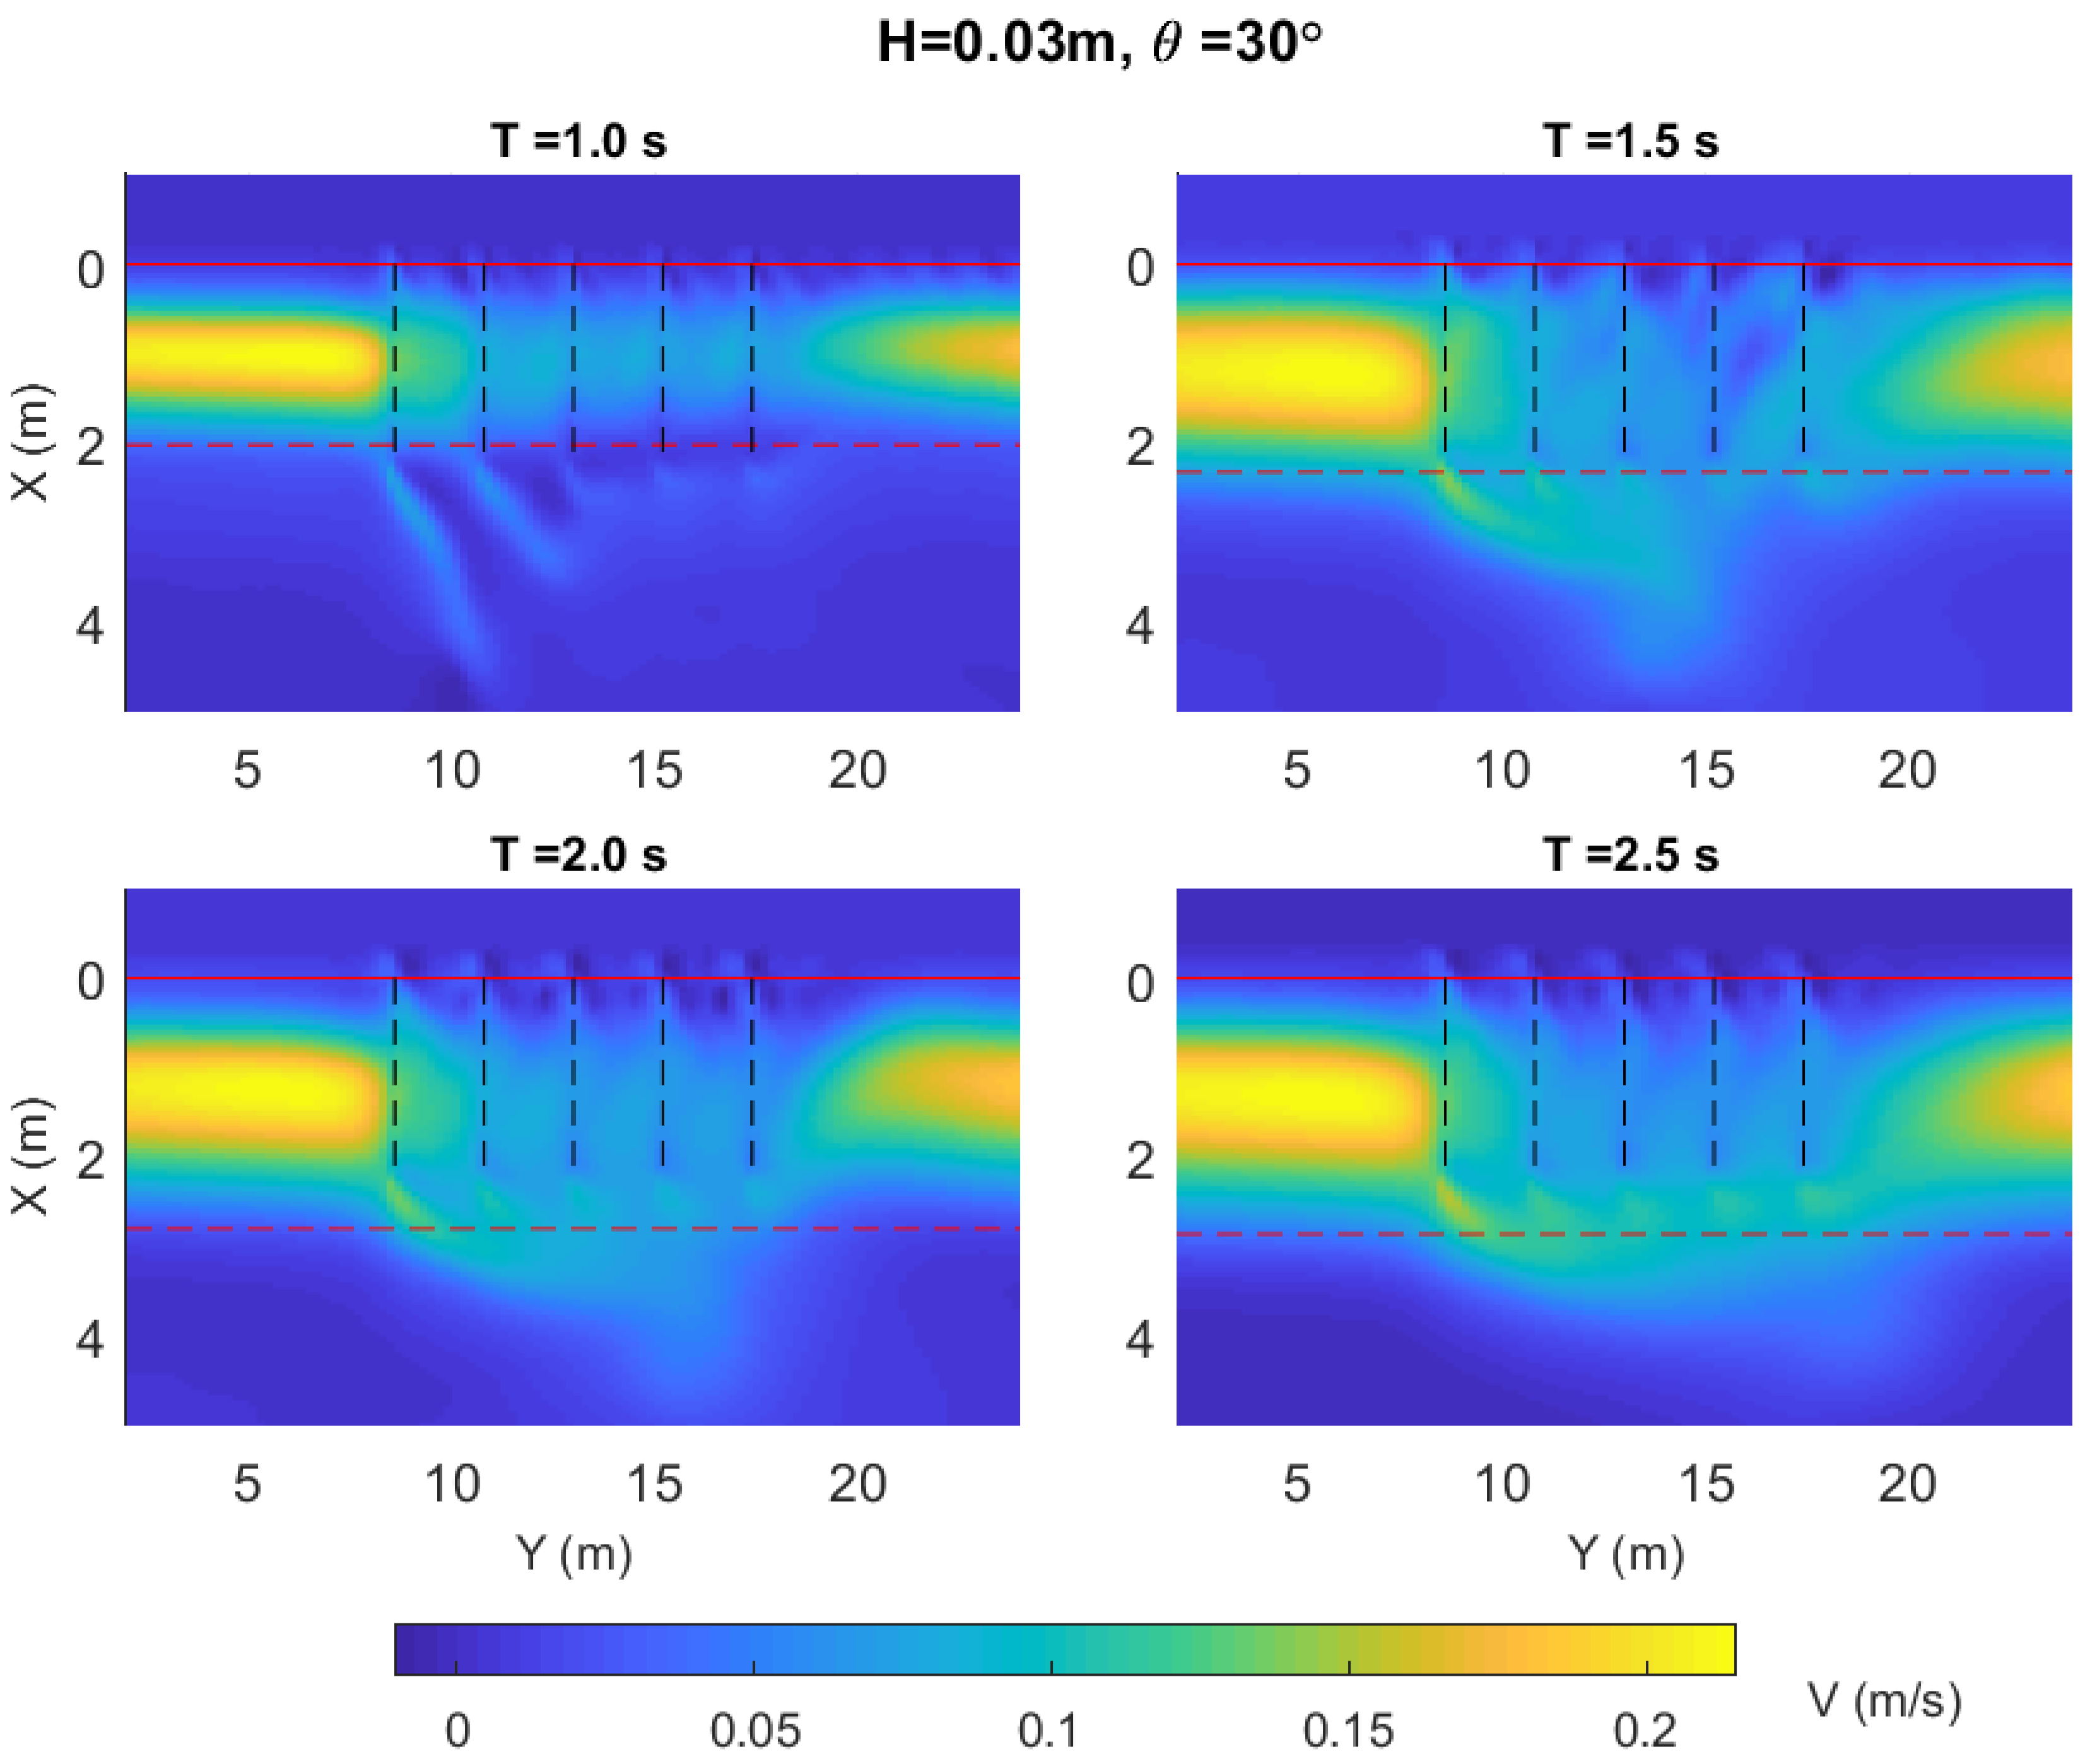
When groin effects on longshore currents are involved in the calculations, the longshore currents are efficiently reduced within the groin fields. When the groin length is no longer than the breaker zone width (Figure 12b–d), the second seaward longshore current peak magnitude could be similar to the first peak value, or even larger than the first peak. It is noted that when the groin length is less than 70% of the wave breaker zone width (Figure 12d), the second peak becomes the largest and should be better avoided. For all wave conditions, the longshore current increases by the groin seaward head. However, there appears a second peak of longshore current velocity seaward of the groin’s head when the wave period is longer than 1.5 s. When the wave period is as long as 2.5 s, the seaward longshore current peak is even larger than that within the breaker zone (Figure 13). The strong second longshore current peak could be explained by the further initial wave-breaking locations of longer waves. As shown in Figure 14, the increased longshore currents by the groin heads are directed seaward. When the waves are shorter, the increased currents are directed in a shoreline-oblique direction. Further downdrift the groin, the enhancement of longshore currents by the groin heads becomes less distinct. Therefore, when averaging longshore current velocities over a groin field in the alongshore direction, the increase in longshore current velocities is smeared, whereas when waves are longer, the longshore currents by the groin heads are redirected into a shoreline-parallel direction and even form a uniform second peak longshore current band (Figure 14).
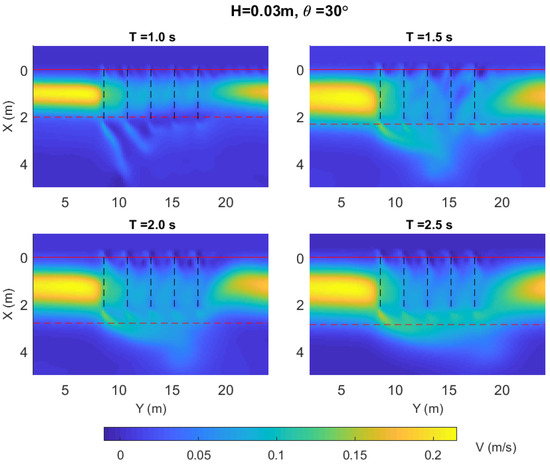
Figure 14.
The comparison of longshore current velocities V with groin intervention under waves with different wave periods (i.e., T = 1.0 s, 1.5 s, 2 s, 2.5 s). The groin length remains constant (Lg = 2.2 m). The dashed lines show the locations of groins. The red lines represent the location of the shoreline and the red dashed lines illustrate the wave breaker lines.
5. Discussion and Conclusions
The aim of this study was to apply an advanced numerical model to assist with designing the layout of a permeable pile groin system. The phase-resolving, non-hydrostatic SWASH model was used to solve the wave-induced longshore current pattern within the permeable groin field. The implementation of PPGs in the SWASH model and the robust capability of simulating wave–current–groin interactions have been validated by Zhang and Stive [29]. A numerical reproduction of relative longshore current velocities measured in the Trampenau et al. [13] experiment was included in this paper. A good match was found between the numerical calculations and the physical observations on a small laboratory scale. The validated model was further used to investigate the effects of varying PPG configurations on longshore currents under different wave conditions.
In this study, the different layouts of permeable groins are compared based on their capability of reducing longshore currents. Two key design variables of the layout of a PPG system, the aspect ratio of groin spacing over groin length and the relative groin length to wave breaker zone width, are compared under different wave conditions (e.g., different wave heights, wave periods).
Under a slight wave condition, the longshore current reduction rate decreases with an increase in the distance between the groins. The reduction rate decreases by 8% when the groin spacing is 1.5 times the groin length compared to the distance equal to the groin length. With groin space increasing to 2 times the groin length, the reduction rate decreases by 6% from 57% to 51%. In the case of a moderate wave climate, the reduction rate is nearly the same as under the slight wave condition when the groin spacing and length ratio is 1:1 and 1.5:1. The reduction rate decreases significantly by 16% from 57% to 41% when the groin spacing is as large as two times the groin length. The results suggest that if the groin space-length ratio is not larger than 2:1, the permeable pile groin functions similarly under light and moderate wave conditions. If the groin spacing is as large as 2 times the groin length, the permeable pile groin system performs worse under a moderate wave climate than under a light wave climate from the aspect of longshore current reduction rate. Therefore, the 1:1.5 spatial ratio is optimal from an economic design perspective; meanwhile, the longshore current reduction capacity of the PPG system is not heavily sacrificed.
For the varying groin length simulations, it is shown that when a groin length is about 70% of the wave breaker width, the maximal longshore current velocity within the breaker zone could not be efficiently hindered. In case of increasing wave periods with a constant wave height, the wavelength increases leading to a wider wave breaker zone and a consequent smaller groin length-breaker zone width ratio. Within the breaker zone, the longshore current reduction decreases weakly with the decreasing relative groin length to the breaker zone width. However, outside the breaker zone, the longshore current increases significantly, and even the reduced longshore current velocity peak moves from inside the breaker zone to the wave breaker location. Moreover, the expanding seaward distance of enhanced longshore current velocity is much further when the wave period is longer. In a plan view, the enhanced longshore current area by the groin heads is a band-like shape when the wave period is the largest 2.5 s among the four simulation cases (T = 1 s, 1.5 s, 2 s, and 2.5 s). Thus, it is suggested that the relative groin length to wave breaker width is larger than 85% and not less than 70% at the shortest.
The validated SWASH model offers a practical opportunity to compare the different layouts of pile groin systems. However, the simulations are carried out under well-controlled conditions. Therefore, the model results are able to provide a quick prediction of groin performance in a preliminary design phase. Furthermore, the validated numerical model could be used to investigate different alternatives of pile groins under more complex environmental conditions. The results obtained from the schematized numerical experiments may expand the database for permeable pile groin systems, which are then a valuable tool to assist the design and evaluation process in coastal engineering planning and management.
Author Contributions
Conceptualization, R.Z. and M.J.F.S.; methodology, R.Z. and M.J.F.S.; formal analysis, R.Z.; investigation, P.Y., M.J.F.S. and Y.C.; writing—original draft preparation, R.Z.; writing—review and editing, P.Y., M.J.F.S., Y.C. and J.Z.; supervision, M.J.F.S., Y.C. and J.Z.; funding acquisition, R.Z. All authors have read and agreed to the published version of the manuscript.
Funding
This study was supported by grants from the National Natural Science Foundation of China (No. 52201320), the International Postdoctoral Exchange Fellowship Program of China (No. YJ20210073), and the Fundamental Research Funds for the Central Universities of China (No. B220202078).
Institutional Review Board Statement
Not applicable.
Informed Consent Statement
Not applicable.
Data Availability Statement
The data presented in this study are available on request from the corresponding author.
Acknowledgments
The authors sincerely thank Zijlema for providing instructions on using the SWASH model and offering access to the HPC cloud. Thanks are also due to Visser and Hulsbergen for offering the experimental data and the report.
Conflicts of Interest
The authors declare no conflict of interest.
References
- Griggs, G.B. Headlands and Groins: Replicating Natural Systems. J. Coast. Res. 2004, SI33, 280–293. [Google Scholar]
- Berg, D.W.; Watts, G.M. Variations in Groin Design. In Proceedings of the Santa Barbara Specialty Conference, Reston, VA, USA, 1 October 1965; ASCE: Reston, VA, USA, 1965; pp. 763–797. [Google Scholar]
- Bakker, W.T.; Hulsbergen, C.H.; Roelse, P.; de Smit, C.; Svasek, J.N. Permeable Groynes: Experiments and Practice in the Netherlands. In Proceedings of the 19th International Conference on Coastal Engineering, Houston, TX, USA, 3–7 September 1984; pp. 1983–1996. [Google Scholar]
- Kraus, N.C.; Hanson, H.; Blomgren, S.H. Modern Functional Design of Groin Systems. In Proceedings of the 24th International Conference on Coastal Engineering, Kobe, Japan, 23–28 October 1994; pp. 1327–1342. [Google Scholar]
- Poff, M.T.; Stephen, M.F.; Dean, R.G.; Mulcahy, S. Permeable Wood Groins: Case Study on Their Impact on the Coastal System. J. Coast. Res. 2004, SI33, 131–144. [Google Scholar]
- Crossman, M.; Simm, J. Sustainable Coastal Defences—The Use of Timber and Other Materials. Proc. Inst. Civ. Eng. Munic. Eng. 2002, 151, 207–211. [Google Scholar] [CrossRef]
- Silva, R.; Lithgow, D.; Esteves, L.S.; Martínez, M.L.; Moreno-Casasola, P.; Martell, R.; Pereira, P.; Mendoza, E.; Campos-Cascaredo, A.; Grez, P.W.; et al. Coastal Risk Mitigation by Green Infrastructure in Latin America. Proc. Inst. Civ. Eng. Marit. Eng. 2017, 170, 39–54. [Google Scholar] [CrossRef]
- Williams, A.T.; Giardino, A.; Pranzini, E. Canons of Coastal Engineering in the United Kingdom: Seawalls/Groynes, a Century of Change? J. Coast. Res. 2016, 321, 1196–1211. [Google Scholar] [CrossRef]
- Griggs, G.; Patsch, K.; Lester, C.; Anderson, R. Groins, Sand Retention, and the Future of Southern California’s Beaches. Shore Beach 2020, 88, 14–36. [Google Scholar] [CrossRef] [PubMed]
- Raudkivi, A.J. Permeable Pile Groins. J. Waterw. Port Coast. Ocean Eng. 1996, 122, 267–272. [Google Scholar] [CrossRef]
- Trampenau, T.; Goricke, F.; Raudkivi, A.J. Permeable Pile Groins. In Proceedings of the 25th International Conference on Coastal Engineering, Orlando, FL, USA, 2–6 September 1996; pp. 2142–2151. [Google Scholar]
- Raudkivi, A.J.; Dette, H.H. Reduction of Sand Demand for Shore Protection. Coast. Eng. 2002, 45, 239–259. [Google Scholar] [CrossRef]
- Trampenau, T.; Oumeraci, H.; Dette, H.H. Hydraulic Functioning of Permeable Pile Groins. J. Coast. Res. 2004, SI33, 160–187. [Google Scholar]
- Abam, T.K.S. Bank Erosion and Protection in the Niger Delta. Hydrol. Sci. J. 2009, 38, 231–241. [Google Scholar] [CrossRef]
- Torres-Freyermuth, A.; Hofman, A.; Clemente Tuz-Pech, J.; Medellín, G.; Roos, P.C. Design and Performance of Permeable Groins on a Low-Energy Natural Beach. J. Mar. Sci. Eng. 2020, 8, 283. [Google Scholar] [CrossRef]
- Phan, Q.M.; Nguyen, V.P.; Hoang, T.N.; Vu, N.T. A Novel Approach Using Sustainable Structures in Preventing Coastal Erosion and Forming Sandy Beach in Vietnam. IOP Conf. Ser. Mater. Sci. Eng. 2020, 869, 072053. [Google Scholar] [CrossRef]
- Price, W.A.; Tomlinson, K.W.; Willis, D.H. Field Tests on Two Permeable Groynes. In Proceedings of the 13th International Conference on Coastal Engineering, Vancouver, BC, Canada, 10–14 July 1972; pp. 1312–1325. [Google Scholar] [CrossRef]
- Dette, H.H.; Raudkivi, A.J.; Oumeraci, H. Permeable Pile Groin Fields. J. Coast. Res. 2004, SI33, 145–159. [Google Scholar]
- Zijlema, M.; Stelling, G.; Smit, P. SWASH: An Operational Public Domain Code for Simulating Wave Fields and Rapidly Varied Flows in Coastal Waters. Coast. Eng. 2011, 58, 992–1012. [Google Scholar] [CrossRef]
- Launder, B.E.; Spalding, D.B. The Numerical Computation of Turbulent Flows. Comput. Methods Appl. Mech. Eng. 1974, 3, 269–289. [Google Scholar] [CrossRef]
- Smagorinsky, J. General Circulation Experiments with the Primitive Equations. Mon. Weather Rev. 1963, 91, 99–164. [Google Scholar] [CrossRef]
- Simm, J.; Orsini, A.; Blanco, B.; Lee, A.; Sands, P.; Williams, J.; Camilleri, A.; Spencer, R. Groynes in Coastal Engineering, Guide to Design, Monitoring and Maintenance of Narrow Footprint Groynes; CIRIA: London, UK, 2020; ISBN 9780860178989. [Google Scholar]
- Perdok, U.; Crossman, M.; Verhagen, H.J.; Howard, S.; Simm, J. Design of Timber Groynes. In Proceedings of the Coastal Structures 2003, Portland, OR, USA, 26–30 August 2003; pp. 1689–1699. [Google Scholar]
- Balsillie, J.H.; Berg, D.W. State of Groin Desigh and Effectiveness. In Proceedings of the 13th Conference on Coastal Engineering, Vancouver, BC, Canada, 10–14 July 1972; pp. 1367–1383. [Google Scholar]
- Rogers, J.; Hamer, B.; Brampton, A.; Challinor, S.; Glennerster, M.; Brenton, P.; Bradbury, A. Beach Management Manual, 2nd ed.; Construction Industry Research and Information Association: London, UK, 2010; ISBN 978-0-86017-682-4-3. [Google Scholar]
- US Army Corps of Engineers. Coastal Engineering Manual; US Army Corps of Engineers: Washington, DC, USA, 2002; Volume 1110.
- van Rijn, L.C. Principles of Sedimentation and Erosion Engineering in Rivers, Estuaries and Coastal Seas; Aqua Publications: Madison, WI, USA, 2005; ISBN 9789080035669. [Google Scholar]
- Hulsbergen, C.H.; Ter Horst, W. Effect of Permeable Pile Screens on Coastal Currents; Delft Hydraulics Laboratory Report M 1148; Delft Hydraulics: Delft, The Netherlands, 1973. (In Dutch) [Google Scholar]
- Zhang, R.; Stive, M.J.F. Numerical Modelling of Hydrodynamics of Permeable Pile Groins Using SWASH. Coast. Eng. 2019, 153, 103558. [Google Scholar] [CrossRef]
- De Wit, F.; Tissier, M.; Reniers, A. Including Tidal Currents in a Wave-Resolving Model. In Proceedings of the Coastal Dynamics 2017, Helsingør, Denmark, 12–16 June 2017; pp. 1638–1648. [Google Scholar]
- Suzuki, T.; Hu, Z.; Kumada, K.; Phan, L.K.; Zijlema, M. Non-Hydrostatic Modeling of Drag, Inertia and Porous Effects in Wave Propagation over Dense Vegetation Fields. Coast. Eng. 2019, 149, 49–64. [Google Scholar] [CrossRef]


Disclaimer/Publisher’s Note: The statements, opinions and data contained in all publications are solely those of the individual author(s) and contributor(s) and not of MDPI and/or the editor(s). MDPI and/or the editor(s) disclaim responsibility for any injury to people or property resulting from any ideas, methods, instructions or products referred to in the content. |
© 2023 by the authors. Licensee MDPI, Basel, Switzerland. This article is an open access article distributed under the terms and conditions of the Creative Commons Attribution (CC BY) license (https://creativecommons.org/licenses/by/4.0/).