Abstract
Mutated cells may constitute a source of cancer. As an effective approach to quantifying the extent of cancer, cell image segmentation is of particular importance for understanding the mechanism of the disease, observing the degree of cancer cell lesions, and improving the efficiency of treatment and the useful effect of drugs. However, traditional image segmentation models are not ideal solutions for cancer cell image segmentation due to the fact that cancer cells are highly dense and vary in shape and size. To tackle this problem, this paper proposes a novel U-Net-based image segmentation model, named U-Net_dc, which expands twice the original U-Net encoder and decoder and, in addition, uses a skip connection operation between them, for better extraction of the image features. In addition, the feature maps of the last few U-Net layers are upsampled to the same size and then concatenated together for producing the final output, which allows the final feature map to retain many deep-level features. Moreover, dense atrous convolution (DAC) and residual multi-kernel pooling (RMP) modules are introduced between the encoder and decoder, which helps the model obtain receptive fields of different sizes, better extract rich feature expression, detect objects of different sizes, and better obtain context information. According to the results obtained from experiments conducted on the Tsinghua University’s private dataset of endometrial cancer cells and the publicly available Data Science Bowl 2018 (DSB2018) dataset, the proposed U-Net_dc model outperforms all state-of-the-art models included in the performance comparison study, based on all evaluation metrics used.
1. Introduction
Image segmentation refers to the segmentation of an image into several disjoint regions based on features such as grayscale, color, spatial texture, and geometric shape, so that these features exhibit consistency or similarity within the same region and differences between different regions. The aim of this operation is to segment objects from the background. Image segmentation can be divided into semantic segmentation, instance segmentation, and panoptic segmentation. Semantic segmentation refers to the classification of pixels of an image into semantic categories; pixels belonging to a particular category are classified only to that category without considering other information. Instance segmentation classifies pixels by “instances” rather than categories. Panoptic segmentation, on the other hand, involves segmenting the entire image and separating each instance of an object in the image, while also predicting the identity of the object. Most of the existing semantic segmentation models are based on convolutional neural networks (CNNs) [1], and their network architecture is typically an encoder–decoder-based one [2], whereby the encoder is typically a pre-trained classification network, such as Visual Geometry Group (VGG-16) [3], Residual Network (ResNet) [4], Hierarchical Vision Transformer using Shifted Windows (Swin Transformer) [5], ConvNeXt [6], and so on. The commonly used semantic segmentation models include Fully Convolutional Networks (FCN) [7], SegNet [8], DeepLab v1 [9], DeepLab v2 [9], DeepLab v3 [10], DeepLab v3+ [11], Pyramid Scene Parsing Network (PSPNet) [12], etc. These models have shown brilliant results in semantic segmentation. U-Net [13] represents one of the most classic models in medical image segmentation, and its improved versions, such as U-Net++ [14], U-Net++ [15], DoubleU-Net [16], and U2Net [17], have also shown excellent results. Based on U-Net, this paper proposes a novel U-Net_dc model for performing better endometrial cancer cell segmentation.
The main contributions of this paper can be summarized as follows:
(1) By utilizing the DoubleU-Net idea [16], the original U-Net encoding and decoding processes is extended twice, and in addition, a skip connection operation [18] is introduced between the encoder and decoder, for better extraction of image features.
(2) By using the feature pyramid network (FPN) idea of feature fusion [19,20], the feature maps of the last few U-Net layers are upsampled [21] to the same size and then concatenated together to produce the final output, which allows the final feature map to retain many deep-level features.
(3) Dense atrous convolution (DAC) and residual multi-kernel pooling (RMP) [22] modules are introduced to the intermediate process of encoding and decoding. The DAC module uses many atrous convolutions [23], stacked in a cascade manner, and adopts cavity convolution with different expansion rates, which allows it to obtain receptive fields of different sizes and better extract rich feature expression. The RMP module connects residuals of many pooling layers of different sizes together, so that objects of different sizes could be detected, and context information could be better obtained.
(4) The segmentation performance of the proposed U-Net_dc model is compared with that of state-of-the-art models (SegNet, PSPNet, U-Net, U-Net++, and DoubleU-Net), based on two datasets.
The rest of the paper is structured as follows. Section 2 explains the background. Section 3 presents the related work conducted in the field. Section 4 explains details of the proposed U-Net_dc model. Section 5 describes the conducted experiments of the model performance comparison and analyses the obtained results. Finally, Section 6 concludes the paper.
2. Background
2.1. Convolutions
The physical significance of using convolutions in a CNN can be summarized as follows. The output of a system at a given time point is generated by the joint effect (superposition) of multiple inputs. The early CNN, called LeNet-5, proposed by LeCun et al. [24] had one input layer, two convolutional layers, two pooling layers [25], and three fully connected layers. Various independent and efficient models, such as AlexNet [26], GoogLeNet [27,28], VGG-Nets [29], ResNet [4], and ResNeXt [30], have appeared through continuous improvements and development.
In brief, the convolution operation performed on an image is to input two-dimensional (2D) data of an area of certain size, obtain the inner product with filters, and then obtain new 2D data. The same input data are processed by different filters to gain different output data, such as color depth, contour, and so on. Generally, different filters should be used to extract the desired information about an image, i.e., to extract different features of the image. An illustration of a 3 × 3 convolution operation is shown in Figure 1.
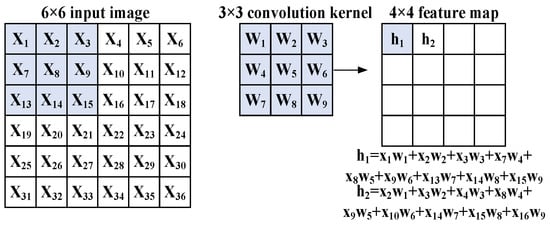
Figure 1.
A 3 × 3 convolution with a step size of 1.
2.2. Upsampling
The size of an input image in a CNN constantly becomes smaller as it continues to undergo convolution operations to extract features. However, sometimes the image should be restored to its original size for feature fusion or final output producing. This operation of mapping an image from a small resolution to a large resolution is called upsampling, which is generally implemented in three ways, namely, interpolation, unpooling, and transposed convolution. The latter two types, which are used by the U-Net_dc model proposed in this paper, are described in the following two subsections.
2.2.1. Unpooling
Unpooling [31] is categorized into maximum unpooling and average unpooling (Figure 2). For the former, the location of the maximum value is required to be recorded during the maximum pooling operation. This way, during the unpooling, the entered value is returned to the original location, based on the index, and the remaining locations are generally filled with zeroes. For the latter, the position of the maximum value is not required to be recorded, and the input value is directly added to the corresponding position in general cases.
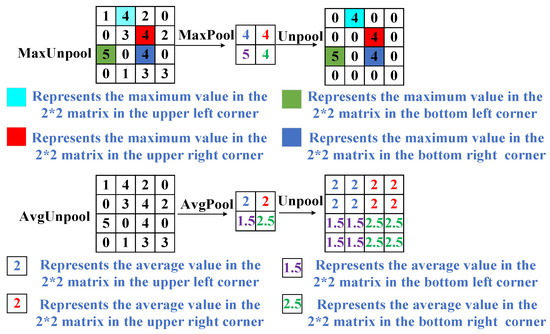
Figure 2.
An illustration of the maximum unpooling and average unpooling.
2.2.2. Transposed Convolution
Generally, convolution operations only reduce or rarely change the size of the input image. As an exception, transposed convolution [32] makes the input image smaller. To put it simply, this operation is the opposite of convolution. More specifically, it multiplies each element of the input tensor by all elements of the kernel tensor in turn. The multiplication result of the elements of the same input tensor are placed in a new tensor, and the result of each multiplication is placed in the corresponding position. When all elements of the input tensor are calculated, the elements in the new tensor are added together according to their position to produce the final output, as shown in Figure 3.
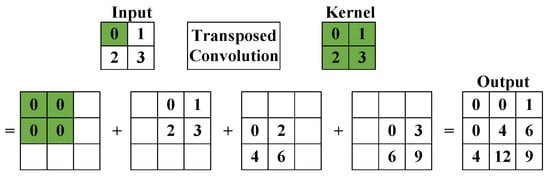
Figure 3.
An illustration of the transposed convolution.
2.3. Loss Functions
The function of image segmentation is to extract regions of interest from an image. The role of the loss function in image segmentation is to make the location and recognition more accurate. The binary cross entropy (BCE) loss and sigmoid activation function [33] are generally used simultaneously since it is necessary to ensure that the input and output range from 0 to 1. These functions are defined as follows:
where is the ground-truth value and is the predicted value.
Another suitable loss function is the Dice loss [34], calculated as follows:
where is a coefficient commonly used for calculating the similarity between two samples (with a value range [0, 1]), as follows:
where denotes the number of intersection elements between and , and and denote the number of elements in and , respectively.
LDice = 1 − Dice,
In the presented study, the BCE loss and Dice loss are combined together to improve the performance of the proposed model, whereby the BCE loss is used to measure the accuracy of predicted results, and the Dice loss is used for measuring the similarity of predicted results. More specifically, the BCE loss and Dice loss are weighted and summed together to obtain the final loss function, as follows:
where λ1 and λ2 denote the weights assigned to LBCE and LDice, respectively.
LBCE-Dice = λ1 × LBCE + λ2 × LDice,
3. Related Work
Image segmentation is an important fundamental task among machine vision tasks. It plays a vital role in image analysis, autonomous driving, and other fields. Image segmentation can also be regarded as a classification task, but it is more about classifying each pixel. Its classic networks have emerged one after another and have been divided into many series, such as FCN, Encoder-Decoder, Multi-scale & Pyramid Network, DeepLab, and so on. In the following subsections, the classic image segmentation models and the U-Net models are presented.
3.1. Classic Image Segmentation Models
3.1.1. Fully Convolutional Networks (FCNs)
In 2014, Long et al. in [7] proposed the FCN model, which represents a pioneering work of deep learning in the field of image segmentation. As the name implies, FCN only includes convolutional layers, with fully connected layers removed, so it can accept images of any size. Then, it trains an end-to-end full convolutional network for pixel-by-pixel classification. The continuous use of convolution operations to extract features in FCN leads to increasingly lower image resolution. Thus, it is necessary to upsample the low-resolution image in order to restore the value of the original image, thereby classifying and predicting each pixel on the original image. In the model proposed in this paper, an upsampling operation is first performed and then followed by a deconvolution operation to restore the image resolution to the value of the original image.
FCN is divided into FCN-32S, FCN-16S, and FCN-8S. For FCN-32S, the convolutional portion of VGG16 is used as its backbone, and the last three fully connected layers of VGG16 are changed to convolutional layers. In the upsampling section, a transposed convolution with a step size of 32 is used to upsample the feature map 32 times and restore the image to the original size. The disadvantage of FCN-32S is that during the upsampling process, the final feature map is sampled 32 times at a time, and many details could be lost during the upsampling process due to the small feature map of the last layer. For FCN-16S and FCN-8S, improvements are made to address this problem. In FC-16S, a branch is added based on FCN-32S. The input part of this branch is the output feature map of the fourth pooling layer in VGG16. Finally, the outputs of the two branches are added, and then a six-fold upsampling is conducted to restore the image to the original size, as shown in Figure 4. In FCN-8S, a branch is added based on FCN-16S. The input part of this branch is the output feature map of the third pooling layer in VGG16. Finally, the outputs of the three branches are added, and then an eight-fold upsampling is performed to restore the image to its original size.
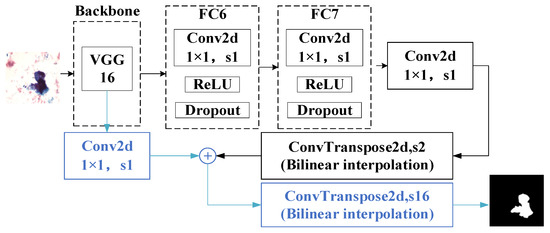
Figure 4.
The FCN-16S structural diagram.
3.1.2. Deep Convolutional Encoder–Decoder Architecture (SegNet)
SegNet [8] is a deep network of image semantic segmentation proposed by the University of Cambridge for the purposes of autonomous driving or intelligent robotics. SegNet is a semantic segmentation network, based on FCN, obtained by modifying VGG-16. Its idea is quite similar to FCN, except for the encoding and decoding techniques used. For the encoder part of SegNet, the first 13 convolutional layers of VGG-16 are used, whereby each encoder layer corresponds to a decoder layer. The final output of the decoder is fed into a SoftMax classifier [35], which classifies each pixel independently.
Specifically, the same convolution is used in SegNet to extract features during the encoding process so that the size of the image does not change before and after the convolution. In the decoding process, the same convolution is also used, but the goal of doing so is to enrich the feature information for the images upon upsampling. As a result, the information lost during the pooling process can be obtained through learning during the decoding process. The biggest highlight of SegNet lies in that the upsampling operation in the decoding process is not realized through transposed convolution but by maximum unpooling. To put it simply, the index of the maximum value is recorded when performing the maximum pooling operation.
When performing the maximum unpooling operation, each weight is assigned to the corresponding position according to the index, with the other positions filled with zeroes. This can reduce the number of parameters and computation workload relative to the transposed convolution and eliminate the need for learning upsampling.
3.1.3. Pyramid Scene Parsing Network (PSPNet)
When it comes to the disadvantage of FCN, it does not use global scene classification information well. Comparatively, PSPNet combines local and global information by building a pyramid pooling module to make the final prediction more reliable. The model performs feature fusion at four different scales, rough or fine, through a pyramid pooling module. The roughest scale performs global average pooling of feature maps to produce a single-grid output, while the finest scale divides the feature map into sub-regions, resulting in multi-grid output. Different scales of outputs correspond to different sizes of feature maps. The low-dimensional feature maps are then upsampled through bilinear interpolation to obtain features of the same size. Finally, the different levels of features are spliced into the final global feature of pyramid pooling, as shown in Figure 5.
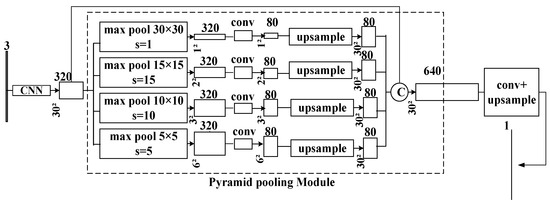
Figure 5.
The PSPNet structural diagram.
Specifically, the feature extraction network of PSPNet is a Mobilenet V2 structure [36], in which features are extracted through multiple convolutions, pooling, and cross-layer connections, until the feature map is finally outputted. Then, a pyramid pooling module is used for feature fusion at four different scales, rough or fine. A 30 × 30 global pooling, a 15 × 15 maximum pooling with a step size of 15, a 10 × 10 maximum pooling with a step size of 10, and a 5 × 5 maximum pooling with a step size of 5 for feature maps extracted from the trunk are performed separately. Then, a bilinear interpolation upsampling on these new feature maps is conducted at different scales to restore images to their original size, and these feature maps are spliced with the feature maps extracted from the trunk. Finally, one round of convolution is performed to switch the number of channels to the desired number for outputting.
3.2. U-Net Models
3.2.1. U-Net
Proposed in 2015, U-Net is a model aimed at solving the problem of medical image segmentation. It has a U-shaped structure in its entirety. Convolutional layers are used during the whole process, with fully connected layers removed, so that the size of the input image is not constrained. The entire network is divided into two parts, encoding and decoding, from shallow to deep layers and from bottom to top. For encoding, two 3 × 3 convolutions, a Batch Normalization (BN) layer [37], and a Rectified Linear Unit (ReLU) activation function [38] are used at each layer. The number of channels is increased without changing the image size. Then, a 2 × 2 maximum pooling layer is adopted to reduce the image size to half of the original size to continuously extract image features. For decoding, an upsampling operation is first performed on the image through transposed convolution to double the size of the image while reducing the number of channels by half. Then, feature fusion is performed on these upsampling images and images produced by the encoding process at the same level. Finally, the number of channels upon feature fusion is reduced by half through two 3 × 3 convolutions. This process continues until the size of the image is restored to its original value. As the final step of the network, the final number of output channels is converted into the desired number while maintaining the same image size via a 1 × 1 convolution, as shown in Figure 6.
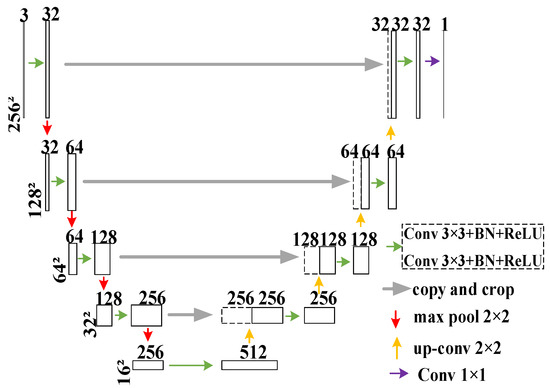
Figure 6.
The U-Net structural diagram.
The features extracted from each layer differ greatly as the network deepens. High-level features tend to have a lower resolution but stronger semantic information, whereas low-level features have higher resolution but perceive details better. Thus, both high-level and low-level extracted features have their respective meanings. U-Net fuses features at different levels by using the advantages of both low levels and high levels. Generally, the edges of a larger feature map obtained through upsampling contain insufficient information. It is impossible for the lost features to be retrieved through upsampling. However, U-Net realizes the retrieval of edge features through feature splicing.
3.2.2. U-Net++
As an improved version of U-Net, U-Net++ combines the structural ideas of U-Net and eliminates its shortcomings. U-Net++ indirectly integrates multiple features at different levels through short connections, upsampling, and downsampling, rather than simply splicing the same-level features of the encoder and decoder. It is precisely due to this reason that the decoder can perceive objects of different sizes in different sensory fields, thereby improving the segmentation performance of the model.
To be specific, U-Net++ uses a dense skip connection to establish a skip path between the encoder and decoder to make up for the lack of semantic similarity caused by simply splicing the encoding and decoding features at the same level in U-Net. The use of dense blocks in this model is inspired by DenseNet [39]. The output of the previous convolutional layer for the same dense block is integrated with the corresponding upsampling output of the dense block at the lower layer, which makes the semantic level of the encoded feature closer to the semantic level of the feature mapping that waits in the decoder. Moreover, a deep supervision strategy is adopted in U-Net++ to adjust the complexity of the model through pruning operations, thus striking a balance between speed and performance.
3.2.3. DoubleU-Net
DoubleU-Net is a new model that connects two U-Nets together. Structurally, its network can be roughly divided into two parts, NETWORK1 and NETWORK2, both of which are quite similar to U-Net, with slight differences in details. The VGG-19 module is used in the encoding process of NETWORK1, and the atrous spatial pyramid pooling (ASPP) block [9] is used in the intermediate process of encoding and decoding. In the ASPP module, atrous convolutions with different expansion rates are utilized to obtain multiscale object information and finally fuse these features to generate the final result. The squeeze-and-excitation (SE) block [40], which is used after the decoding process, is designed to reduce redundant information and transfer only the most relevant information.
More specifically, both NETWORK1 and NETWORK2 maintain the splicing of same-level encoding and decoding features in U-Net. However, the skip connection of NETWORK2 connects both the information of its own encoding network and the information of the NETWORK1 encoding network. The result of multiplying the input and output in NETWORK1 is used as the input to NETWORK2, so that the feature map output of NETWORK1 can be further improved by obtaining the information of the original input image again. Finally, the outputs of the two networks are spliced to retain both the final output characteristics and output characteristics of NETWORK1.
4. Proposed Model: U-Net_dc
Currently, segmentation networks based on the encoder–decoder structures, such as U-Net and its improved versions, are widely used in medical image segmentation. In this section, a novel improved U-Net-based model, named U-Net_dc, is proposed, as shown in Figure 7.
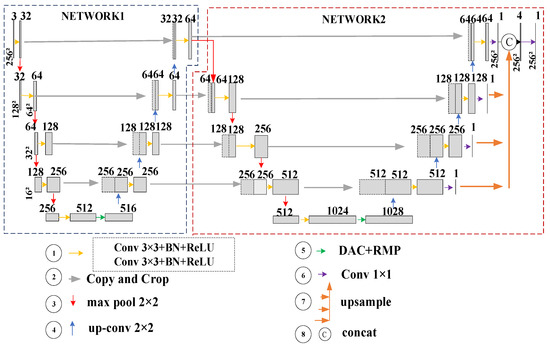
Figure 7.
The U-Net_dc schematic diagram.
First, by reference to the idea of DoubleU-Net [16], the proposed model utilizes a doubled U-Net size. The increase in the number of U-Net layers allows the model to learn deeper-level features, thus performing more accurate segmentation. Then, by utilizing the idea of FPN for fusing the feature maps of the last few layers together in producing the final output, the segmentation performance of the model is further improved by combining the advantages of low-level features and high-level features fused together. Finally, DAC and RMP modules are added between the encoder and decoder. The DAC module adopts cavity convolution with different expansion rates, so that receptive fields of different sizes can be obtained, and rich feature expression can be extracted better. The RMP module connects residuals of many pooling layers of different sizes together, so that objects of different sizes can be detected, and context information can be better obtained.
The main U-Net improvements, utilized by the proposed model, are described in the following subsections in detail.
4.1. U-Net Doubling
Even though the proposed model utilizes the DoubleU-Net idea of doubling the size of U-Net, it is not performed in the same way as in DoubleU-Net. Instead, the output of NETWORK1 is directly used as an input to NETWORK2. In addition, NETWORK1 and NETWORK2 require new feature fusion. In order to keep the number of channels of the two features consistent in the new feature fusion, the convolution of the last layer in NETWORK1 does not change the number of channels of input features. The skip connection between U-Net’s original encoder and decoder is retained, but then, in addition, a new skip connection between the decoding part of NETWORK1 and the encoding part of NETWORK2 is established. This way, when the encoding of NETWORK2 is performed, no feature information that had been previously lost due to continuous upsampling would be missed, so the extracted features would become richer, and segmentation would be more effective.
4.2. Multiscale Fusion
In the field of image segmentation, the fusion of features at different scales is an essential and important step to improve segmentation performance. As a neural network deepens, the features extracted from each of its layers vary greatly. High-level features tend to have lower resolution and give a perception of details but exhibit stronger semantic information. By contrast, low-level features have higher resolution and give a better perception of details but exhibit poorer semantic information. Therefore, fusing features at different levels can combine advantages of both sides and improve the segmentation performance of a model utilizing it. The existing feature fusion methods are generally divided into early fusion and late fusion, whereby the former can be divided into “add” and “concat” types. “Add” refers to a parallel strategy that combines two feature vectors into a complex vector, while “concat” means splicing two features together, with the final output feature dimension being the sum of the two feature dimensions. Late fusion follows an idea similar to FPN, which allows for trade-offs between speed and accuracy and enables more robust semantic information. The FPN schematic diagram is shown in Figure 8, where Ci (i = 2, 3, 4, 5) represent different convolutional groups, with C5 obtained after a 1 × 1 convolution. For Pj (j = 5, 4, 3), Pj-1 is obtained through the fusion of upsampling feature and Cj-1 features, with the final feature map generated after a 3 × 3 convolution.
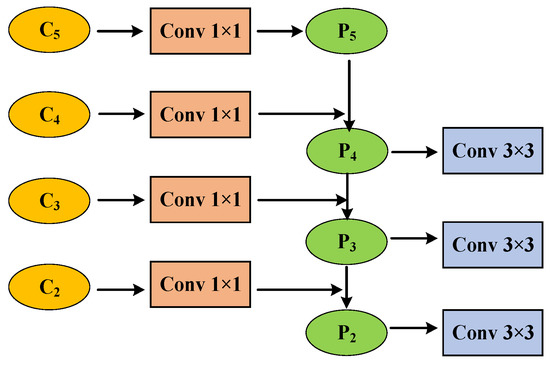
Figure 8.
The FPN schematic diagram.
In the case of the fusion of features at different levels in a CNN, the main problem encountered relates to the difference in feature expression at different levels. Simple connection and superimposition operations have limited impact on segmentation accuracy, so we attempt to combine the FPN multi-branch prediction structure to improve the U-Net model and lower this difference, thus fully utilizing the characteristics of each layer and improving the model’s segmentation performance.
4.3. Additional DAC and RMP Modules
4.3.1. Atrous Convolutions
Compared with ordinary convolutions, atrous convolution has a parameter of expansion rate that represents the size of the expansion in addition to the size of the convolutional kernel. So, in fact, ordinary convolutions are actually atrous convolutions with an expansion rate of 1. Atrous convolutions are mainly used to obtain receptive fields at different sizes while maintaining constant parameter values. Figure 9 illustrates different types of ordinary and atrous convolutions.
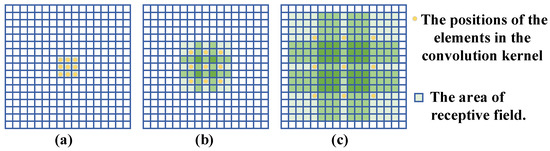
Figure 9.
An illustration of (a) ordinary convolution, with an expansion rate of 1 and receptive field of the convolutional kernel of 9 (3 × 3); (b) atrous convolution, with an expansion rate of 2 and receptive field of the convolutional kernel of 49 (7 × 7); and (c) atrous convolution, with an expansion rate of 4 and receptive field of the convolutional kernel of 225 (15 × 15).
4.3.2. Dense Atrous Convolution (DAC)
With reference to the idea of Inception-ResNet-V2 [41], DAC is composed of several atrous convolutions stacked in a cascade way, as shown in Figure 10.
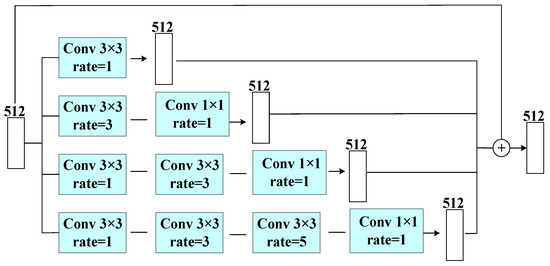
Figure 10.
The DAC module structure.
DAC contains four branches. The first branch only experiences a single 3 × 3 convolution with an expansion rate of 1. The second branch first undergoes a 3 × 3 convolution with an expansion rate of 3 to extract features with a larger receptive field, followed by a 1 × 1 convolution for ReLU activation. The third branch first undergoes two 3 × 3 convolutions with expansion rates of 1 and 3, respectively, for extracting features with different sizes of receptive fields, followed by a 1 × 1 convolution. The fourth branch goes through three 3 × 3 convolutions with expansion rates of 1, 3, and 5, respectively, followed by a 1 × 1 convolution. Finally, the feature maps extracted from these four branches are combined with the initial input image for producing the final output.
4.3.3. Residual Multi-Kernel Pooling (RMP)
RMP is a residual multi-kernel pooling module in which multiple effective visual fields are used to detect objects of different sizes, as shown in Figure 11. More specifically, RMP involves pooling operations on input images of 2 × 2, 3 × 3, 5 × 5, and 6 × 6 sizes, respectively, meaning that four receptive fields of varying sizes are used to obtain global context information. Then, in order to lower the weight dimension and the cost of computation, a 1 × 1 convolution is used after each pooled branch. Subsequently, the output results of the four branches are upsampled to restore the size of the input image. Finally, the original features, together with these four features, are concatenated, to produce the final output.
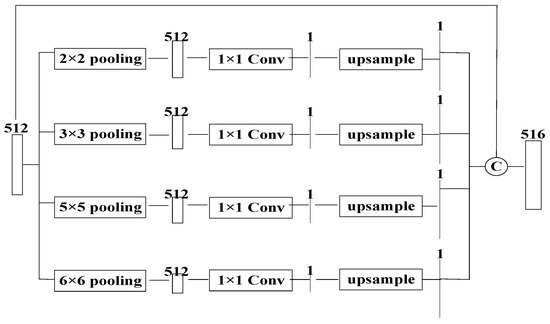
Figure 11.
The RMP module structure.
5. Experiments and Results
A series of experiments were conducted to compare the performance of the proposed U-Net_dc model with that of state-of-the-art models, namely, SegNet, PSPNet, U-Net, U-Net++, and DoubleU-Net. A five-fold cross validation was performed to eliminate the chance of experimental results arising from a single splitting of a dataset.
5.1. Datasets
The experiments were conducted on the private endometrial cancer cell dataset and the publicly available DSB2018 dataset, with the image size unified to 256 × 256 pixels.
The private endometrial cancer cell dataset was supplied by the Tsinghua University. Each image in this dataset contains both normal and cancer cells, which are different in shape, relatively dark in color, and clustered together. Due to the small number of medical images collected so far in this dataset, we used data enhancement methods such as horizontal flip, random directional rotation, and contrast enhancement to expand it to 650 pieces. In addition, we manually labeled the cancer cells in each image to create a label map, as shown in Figure 12 (the red ovals represent the area where the cancer cells are located).
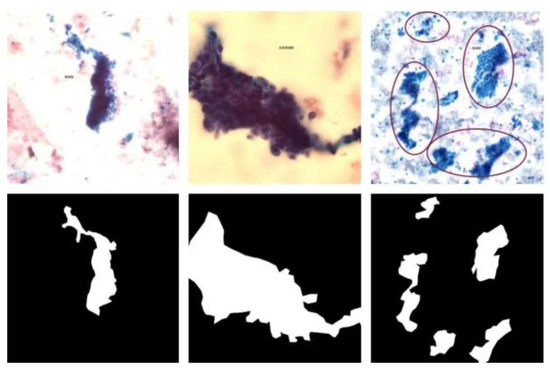
Figure 12.
Sample images of the endometrial cancer cell dataset.
The DSB2018 dataset is supplied by the Data Science Bowl segmentation challenge 2018 (DSB challenge 2018) [42]. The dataset includes 670 nuclei images from different modalities: brightfield vs. fluorescence. In the experiment, we unified the image size to 256 × 256 pixels, as shown in Figure 13.
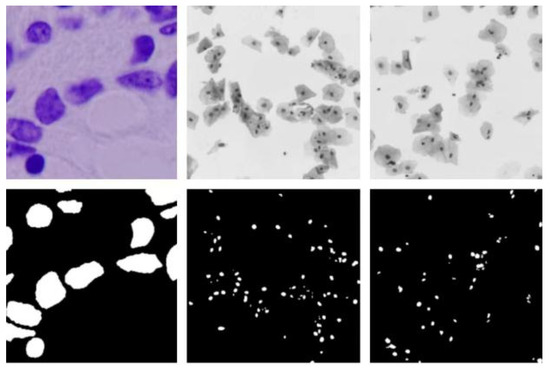
Figure 13.
Sample images of the DSB2018 dataset.
For conducting the experiments, we split the datasets into training, validation, and test sets, as shown in Table 1.

Table 1.
Dataset splitting.
5.2. Evaluation Metrics
The intersection-over-union (IoU), Dice coefficient, precision, and accuracy were used as evaluation metrics in the experiments conducted for performance comparison of models.
IoU is widely used for image segmentation as an evaluation metric of how well a model can separate objects from the background in images. It is calculated as follows:
where TP (true positives) represents the number of correctly identified pixels as being part of an object (i.e., a cancer cell, in our case), FN (false negatives) represents the number of incorrectly identified pixels as being not part of an object, and FP (false positives) represents the number of incorrectly identified pixels as being part of an object.
The Dice coefficient is used to calculate the similarity between two samples, as follows:
In addition to these two metrics, precision and accuracy were also used, calculated as follows:
where TN (true negative) represents the number of correctly identified pixels as being not part of an object.
5.3. Results
5.3.1. On Endometrial Cancer Cell Dataset
The results obtained on the endometrial cancer cell dataset, shown in Table 2, Table 3, Table 4, Table 5 and Table 6 and Figure 14, clearly demonstrated the superiority of the proposed U-Net_dc model over all state-of-the-art models considered, based on all evaluation metrics. More specifically, on each metric, the second-best-performing model was outperformed by 0.032 points according to IoU (the first runner-up here was DoubleU-Net), 0.020 points based on the Dice coefficient (the first runner-up here was DoubleU-Net), 0.013 points according to precision (the first runner-up here was U-Net), and 0.006 points based on accuracy (the first runners-up here were U-Net, U-Net++, and DoubleU-Net).
Table 2.
IoU comparison results on endometrial cancer cell dataset.
Table 3.
Dice coefficient comparison results on endometrial cancer cell dataset.
Table 4.
Precision comparison results on endometrial cancer cell dataset.
Table 5.
Accuracy comparison results on endometrial cancer cell dataset.
Table 6.
Overall comparison results on endometrial cancer cell dataset.
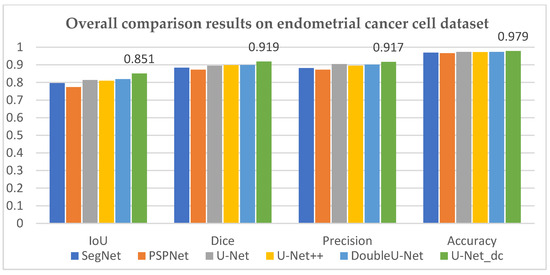
Figure 14.
Graphical presentation of the overall comparison results on endometrial cancer cell dataset.
5.3.2. On DSB2018 Dataset
The results obtained on the DSB2018 dataset, shown in Table 7, Table 8, Table 9, Table 10 and Table 11 and Figure 15, clearly demonstrated that the proposed U-Net_dc model outperformed all state-of-the-art models considered, based on all evaluation metrics, on this dataset too. More specifically, on each metric, the second-best performing model was outperformed by 0.021 points according to IoU (the first runners-up here were U-Net and U-Net++), 0.016 points based on the Dice coefficient (the first runners-up here were U-Net++ and DoubleU-Net), 0.008 points according to precision (the first runner-up here was U-Net++), and 0.002 points based on accuracy (the first runners-up here were U-Net, U-Net++, and DoubleU-Net).
Table 7.
IoU comparison results on DSB2018 dataset.
Table 8.
Dice coefficient comparison results on DSB2018 dataset.
Table 9.
Precision comparison results on DSB2018 dataset.
Table 10.
Accuracy comparison results on DSB2018 dataset.
Table 11.
Overall comparison results on DSB2018 dataset.
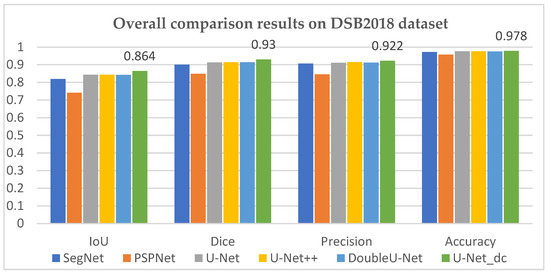
Figure 15.
Graphical presentation of the overall comparison results on DSB2018 dataset.
5.4. Discussion on Strengths and Weaknesses of Compared Models
The main advantage of the SegNet model is that it utilizes unpooling operation for upsampling, which allows one to reduce the number of model parameters and increase the speed of model training. However, the decoding process of SegNet only conducts upsampling and convolution operations without combining the feature information extracted during the coding process. Thus, the low-level features of images are ignored, and the SegNet performance in medical image segmentation is not particularly good because low-level features are also very important for medical images.
PSPNet uses a pyramid pooling module to aggregate the feature information of different regions, which makes the extracted feature information more abundant. However, this model only uses the last layer to do multi-scale fusion. Moreover, PSPNet integrates an adequate number of deep features but lacks sufficient shallow features, resulting in suboptimal detail segmentation. This is not conducive to the segmentation of medical images. The low-resolution information of medical images can be used for the identification of target objects, while the high-resolution information can be used for accurate segmentation.
U-Net combines low-resolution information and high-resolution information, while U-Net++ also integrates features of different levels through superposition, making the differences between the feature maps in fusion smaller. Therefore, U-Net and U-Net++ are very suitable for medical image segmentation, but their disadvantage relates to the fact that U-Net itself has a simple structure, and its network is not deep, which makes it difficult for these two models to extract deeper features of images.
DoubleU-Net is a concatenation of two U-Net networks. This increases the depth of the model, which allows it to extract deeper features of images. However, the final output of the model is just a concatenation of the outputs of two U-Net networks, and the deeper features extracted by the last few layers of the network are not well used.
The U-Net_dc model, proposed in this paper, expands twice the original U-Net model and carries out feature fusion in the last few layers of the network, which allows it to better extract and retain the deep information of images. In addition, U-Net_dc connects two U-Net networks by leaps and bounds and uses a multi-scale fusion method in the intermediate process of encoding and decoding, so as to enrich the extracted feature information. These U-Net improvements allow the proposed model to achieve better segmentation performance than the other models used in the presented comparison.
Recently, an adaptive squeeze-and-shrink image denoising [43] has been proposed. The authors applied this method in the preprocessing of cerebral microbleed (CMB) data to reduce the quality loss of input images and improve the performance of CMB detection. However, it is important to note that the proposed U-Net_dc model primarily improves image segmentation performance by leveraging deep feature information rather than relying solely on image preprocessing. This makes U-Net_dc more versatile and applicable to a wider range of scenarios. Unlike the aforementioned method that requires noise reduction processing for all medical image data, U-Net_dc effectively processes deep feature information, enabling more accurate detection of target objects.
The biggest challenge in segmenting endometrial cancer cells relates to the fact that the degree of cancer cell aggregation varies. Some cancer cells aggregate in large quantities, while others only aggregate in small quantities, resulting in different shapes and sizes of cancer cells after aggregation. Moreover, normal cells are scattered all around the cancer cells, and there may be an overlap with normal cells in the aggregated cancer cells. Second, cancer cells may undergo mutations, and the shape and size of mutated cancer cells may undergo significant changes. Therefore, although the proposed U-Net_dc model has certain advantages compared with the other five models, as demonstrated in the presented performance comparison, its segmentation results are not ideal. This can be attributed to the U-Net_dc’s relative weakness in handling shallow detail features extracted at the initial stages. To be specific, the U-Net_dc model transfers the shallow features backward successively through skip connections until they reach the last few layers, which carry out feature fusion to produce the final output. However, the entire process of feature transmission is relatively complicated, and the transmitted feature information may be inevitably lost. As a result, the final feature map may not contain shallow detailed feature information, or it may not contain correct shallow feature information. Therefore, in some cases, the proposed U-Net_dc model may not be able to achieve very accurate segmentation of cancer cells.
6. Conclusions
This paper has proposed a novel U-Net_dc model for performing better endometrial cancer cell image segmentation, based on the U-Net model with the following improvements:
- The original U-Net encoder and decoder were extended twice, as in [16], with an additional skip connection operation introduced between them, for better extraction of image features.
- Based on [19,20], the feature maps of the last few U-Net layers were upsampled to the same size and then concatenated together to produce the final output, which allowed the final feature map to retain many deep-level features.
- Dense atrous convolution (DAC) and residual multi-kernel pooling (RMP) [22] modules were introduced into the intermediate process of encoding and decoding, which allowed the model to obtain receptive fields of different sizes and better extract rich feature expression, on one side, and detect objects of different sizes and better obtain context information, on the other side.
The superiority of the proposed U-Net_dc model over five state-of-the-art models (SegNet, PSPNet, U-Net, U-Net++, and DoubleU-Net) in performing endometrial cancer cell image segmentation has been demonstrated by the presented results, obtained from experiments conducted on two datasets. More specifically, based on results obtained on the private endometrial cancer cell dataset, compared with the second-best-performing model, U-Net_dc managed to achieve an increase of 0.032 points for IoU, 0.020 points for Dice, 0.013 points for precision, and 0.006 points for accuracy. On the public DSB2018 dataset, the corresponding increases, achieved by the proposed U-Net_dc model in comparison with the first runner-up, were by 0.021 points for IoU, 0.016 points for Dice, 0.008 points for precision, and 0.002 points for accuracy.
Author Contributions
Conceptualization, D.Y. and Z.J.; methodology, R.C.; validation, I.G. and T.L.; formal analysis, D.Y. and Q.L.; writing—original draft preparation, D.Y.; writing—review and editing, I.G.; supervision, Z.J.; project administration, L.Z. and Z.J. All authors have read and agreed to the published version of the manuscript.
Funding
This publication has emanated from research conducted with the financial support of the National Key Research and Development Program of China under Grant No. 2017YFE0135700, the Tsinghua Precision Medicine Foundation under Grant No. 2022TS003, the Bulgarian National Science Fund (BNSF) under Grant No. KП-06-ИП-KИTAЙ/1 (KP-06-IP-CHINA/1), and the Telecommunications Research Centre (TRC) of University of Limerick, Ireland.
Data Availability Statement
Not applicable.
Conflicts of Interest
The authors declare no conflict of interest.
References
- Chua, L.O.; Roska, T. CNN Paradigm. IEEE Trans. Circuits Syst. I Fundam. Theory Appl. 1993, 40, 147–156. [Google Scholar] [CrossRef]
- Chen, H.; Zhang, Y.; Kalra, M.K.; Lin, F.; Chen, Y.; Liao, P.; Zhou, J.; Wang, G. Low-dose CT with a residual encoder-decoder convolutional neural network. IEEE Trans. Med. Imaging 2017, 36, 2524–2535. [Google Scholar] [CrossRef] [PubMed]
- Qassim, H.; Verma, A.; Feinzimer, D. Compressed residual-VGG16 CNN model for big data places image recognition. In Proceedings of the 2018 IEEE 8th Annual Computing and Communication Workshop and Conference (CCWC), Las Vegas, NV, USA, 27 February 2018; pp. 169–175. [Google Scholar]
- He, K.; Zhang, X.; Ren, S.; Sun, J. Deep residual learning for image recognition. In Proceedings of the IEEE Conference on Computer Vision and Pattern Recognition, Las Vegas, NV, USA, 26 June–1 July 2016; pp. 770–778. [Google Scholar]
- Liu, Z.; Lin, Y.; Cao, Y.; Hu, H.; Wei, Y.; Zhang, Z.; Lin, S.; Guo, B. Swin transformer: Hierarchical vision transformer using shifted windows. In Proceedings of the IEEE/CVF International Conference on Computer Vision, Montreal, QC, Canada, 10–17 October 2021; pp. 10012–10022. [Google Scholar]
- Liao, S.; Huang, C.; Liang, Y.; Zhang, H.; Liu, S. Solder Joint Defect Inspection Method Based on ConvNeXt-YOLOX. IEEE Trans. Compon. Packag. Manuf. Technol. 2022, 12, 1890–1898. [Google Scholar] [CrossRef]
- Long, J.; Shelhamer, E.; Darrell, T. Fully convolutional networks for semantic segmentation. In Proceedings of the IEEE Conference on Computer Vision and Pattern Recognition, Boston, MA, USA, 8–10 June 2015; pp. 3431–3440. [Google Scholar]
- Badrinarayanan, V.; Kendall, A.; Cipolla, R. Segnet: A deep convolutional encoder-decoder architecture for image segmentation. IEEE Trans. Pattern Anal. Mach. Intell. 2017, 39, 2481–2495. [Google Scholar] [CrossRef] [PubMed]
- Chen, L.-C.; Papandreou, G.; Kokkinos, I.; Murphy, K.; Yuille, A.L. Deeplab: Semantic image segmentation with deep convolutional nets, atrous convolution, and fully connected crfs. IEEE Trans. Pattern Anal. Mach. Intell. 2017, 40, 834–848. [Google Scholar] [CrossRef] [PubMed]
- Quan, B.; Liu, B.; Fu, D.; Chen, H.; Liu, X. Improved deeplabv3 for better road segmentation in remote sensing images. In Proceedings of the 2021 International Conference on Computer Engineering and Artificial Intelligence (ICCEAI), Shanghai, China, 27 August 2021; pp. 331–334. [Google Scholar]
- Chen, L.-C.; Zhu, Y.; Papandreou, G.; Schroff, F.; Adam, H. Encoder-decoder with atrous separable convolution for semantic image segmentation. In Proceedings of the European Conference on Computer Vision (ECCV), Munich, Germany, 8–14 September 2018; pp. 801–818. [Google Scholar]
- Zhao, H.; Shi, J.; Qi, X.; Wang, X.; Jia, J. Pyramid scene parsing network. In Proceedings of the IEEE Conference on Computer Vision and Pattern Recognition, Honolulu, HI, USA, 21–26 July 2017; pp. 2881–2890. [Google Scholar]
- Ronneberger, O.; Fischer, P.; Brox, T. U-net: Convolutional networks for biomedical image segmentation. In Proceedings of the Medical Image Computing and Computer-Assisted Intervention–MICCAI 2015: 18th International Conference, Munich, Germany, 5–9 October 2015; Springer: Berlin/Heidelberg, Germany, 2015; pp. 234–241. [Google Scholar]
- Zhou, Z.; Siddiquee, M.M.R.; Tajbakhsh, N.; Liang, J. U-Net++: A nested u-net architecture for medical image segmentation. In Proceedings of the Deep Learning in Medical Image Analysis and Multimodal Learning for Clinical Decision Support: 4th International Workshop, DLMIA 2018, and 8th International Workshop, ML-CDS 2018, Held in Conjunction with MICCAI 2018, Granada, Spain, 20 September 2018; Springer: Berlin/Heidelberg, Germany, 2018; pp. 3–11. [Google Scholar]
- Huang, H.; Lin, L.; Tong, R.; Hu, H.; Zhang, Q.; Iwamoto, Y.; Han, X.; Chen, Y.-W.; Wu, J. U-Net 3+: A full-scale connected U-Net for medical image segmentation. In Proceedings of the ICASSP 2020–2020 IEEE International Conference on Acoustics, Speech and Signal Processing (ICASSP), Barcelona, Spain, 4–9 May 2020; Barcelona International Convention Centre: Barcelona, Spain, 2020; pp. 1055–1059. [Google Scholar]
- Jha, D.; Riegler, M.A.; Johansen, D.; Halvorsen, P.; Johansen, H.D. Doubleu-net: A deep convolutional neural network for medical image segmentation. In Proceedings of the 2020 IEEE 33rd International Symposium on Computer-Based Medical Systems (CBMS), Rochester, MN, USA, 28–30 July 2020; pp. 558–564. [Google Scholar]
- Qin, X.; Zhang, Z.; Huang, C.; Dehghan, M.; Zaiane, O.R.; Jagersand, M. U2-Net: Going deeper with nested U-structure for salient object detection. Pattern Recognit. 2020, 106, 107404. [Google Scholar] [CrossRef]
- Zhang, L.; Zhang, J.; Shen, P.; Zhu, G.; Li, P.; Lu, X.; Zhang, H.; Shah, S.A.; Bennamoun, M. Block level skip connections across cascaded V-Net for multi-organ segmentation. IEEE Trans. Med. Imaging 2020, 39, 2782–2793. [Google Scholar] [CrossRef] [PubMed]
- Sun, B.-Y.; Zhang, X.-M.; Li, J.; Mao, X.-M. Feature fusion using locally linear embedding for classification. IEEE Trans. Neural Netw. 2009, 21, 163–168. [Google Scholar] [CrossRef] [PubMed]
- Lin, T.-Y.; Dollár, P.; Girshick, R.; He, K.; Hariharan, B.; Belongie, S. Feature pyramid networks for object detection. In Proceedings of the IEEE Conference on Computer Vision and Pattern Recognition, Honolulu, HI, USA, 21–26 July 2017; pp. 2117–2125. [Google Scholar]
- Wang, Z.; Chen, J.; Hoi, S.C. Deep learning for image super-resolution: A survey. IEEE Trans. Pattern Anal. Mach. Intell. 2020, 43, 3365–3387. [Google Scholar] [CrossRef] [PubMed]
- Gu, Z.; Cheng, J.; Fu, H.; Zhou, K.; Hao, H.; Zhao, Y.; Zhang, T.; Gao, S.; Liu, J. Ce-net: Context encoder network for 2d medical image segmentation. IEEE Trans. Med. Imaging 2019, 38, 2281–2292. [Google Scholar] [CrossRef] [PubMed]
- Li, Z.; Chen, X.; Jiang, J.; Han, Z.; Li, Z.; Fang, T.; Huo, H.; Li, Q.; Liu, M. Cascaded multiscale structure with self-smoothing atrous convolution for semantic segmentation. IEEE Trans. Geosci. Remote Sens. 2021, 60, 1–13. [Google Scholar] [CrossRef]
- Zhang, Z.H.; Yang, Z.; Sun, Y.; Wu, Y.F.; Xing, Y.D. Lenet-5 Convolution Neural Network with Mish Activation Function and Fixed Memory Step Gradient Descent Method. In Proceedings of the 2019 16th International Computer Conference on Wavelet Active Media Technology and Information Processing (ICCWAMTIP), Chengdu, China, 13 December 2019. [Google Scholar]
- Kim, J.H.; Lee, H.; Hong, S.J.; Kim, S.; Park, J.; Hwang, J.Y.; Choi, J.P. Objects segmentation from high-resolution aerial images using U-Net with pyramid pooling layers. IEEE Geosci. Remote Sens. Lett. 2018, 16, 115–119. [Google Scholar] [CrossRef]
- Krizhevsky, A.; Sutskever, I.; Hinton, G.E. Imagenet classification with deep convolutional neural networks. Commun. ACM 2017, 60, 84–90. [Google Scholar] [CrossRef]
- Szegedy, C.; Liu, W.; Jia, Y.; Sermanet, P.; Reed, S.; Anguelov, D.; Erhan, D.; Vanhoucke, V.; Rabinovich, A. Going deeper with convolutions. In Proceedings of the IEEE Conference on Computer Vision and Pattern Recognition, Boston, MA, USA, 8–10 June 2015; pp. 1–9. [Google Scholar]
- Szegedy, C.; Vanhoucke, V.; Ioffe, S.; Shlens, J.; Wojna, Z. Rethinking the inception architecture for computer vision. In Proceedings of the IEEE Conference on Computer Vision and Pattern Recognition, Las Vegas, NV, USA, 26 June–1 July 2016; pp. 2818–2826. [Google Scholar]
- Muhammad, U.; Wang, W.; Chattha, S.P.; Ali, S. Pre-trained VGGNet architecture for remote-sensing image scene classification. In Proceedings of the 2018 24th International Conference on Pattern Recognition (ICPR), Beijing, China, 21 August 2018; pp. 1622–1627. [Google Scholar]
- Xie, S.; Girshick, R.; Dollár, P.; Tu, Z.; He, K. Aggregated residual transformations for deep neural networks. In Proceedings of the IEEE Conference on Computer Vision and Pattern Recognition, Honolulu, HI, USA, 21–26 July 2017; pp. 1492–1500. [Google Scholar]
- Zeiler, M.D.; Fergus, R. Visualizing and understanding convolutional networks. In Proceedings of the Computer Vision–ECCV 2014: 13th European Conference, Zurich, Switzerland, 6–12 September 2014; Springer: Berlin/Heidelberg, Germany, 2014; pp. 818–833. [Google Scholar]
- Noh, H.; Hong, S.; Han, B. Learning deconvolution network for semantic segmentation. In Proceedings of the IEEE international Conference on Computer Vision, Santiago, Chile, 7–13 December 2015; pp. 1520–1528. [Google Scholar]
- Langer, S. Approximating smooth functions by deep neural networks with sigmoid activation function. J. Multivar. Anal. 2021, 182, 104696. [Google Scholar] [CrossRef]
- Soomro, T.A.; Hellwich, O.; Afifi, A.J.; Paul, M.; Gao, J.; Zheng, L. Strided U-Net Model: Retinal Vessels Segmentation using Dice Loss. In Proceedings of the International Conference on Digital Image Computing: Techniques and Applications, Canberra, Australia, 10–13 December 2018. [Google Scholar]
- Duan, K.; Keerthi, S.S.; Chu, W.; Shevade, S.K.; Poo, A.N. Multi-category classification by soft-max combination of binary classifiers. Mult. Classif. Syst. 2003, 2709, 125–134. [Google Scholar]
- Sandler, M.; Howard, A.; Zhu, M.; Zhmoginov, A.; Chen, L.-C. Mobilenetv2: Inverted residuals and linear bottlenecks. In Proceedings of the IEEE Conference on Computer Vision and Pattern Recognition, Salt Lake City, UT, USA, 18–22 June 2018; pp. 4510–4520. [Google Scholar]
- Iffe, S.; Szegedy, C. Batch normalization: Accelerating deep network training by reducing internal covariate shift. In Proceedings of the International Conference on Machine Learning, Lille, France, 6–11 July 2015; pp. 448–456. [Google Scholar]
- Schmidt-Hieber, J. Nonparametric regression using deep neural networks with ReLU activation function. Ann. Statist. 2020, 48, 1857–1897. [Google Scholar]
- Zhu, Y.; Newsam, S. Densenet for dense flow. In Proceedings of the 2017 IEEE International Conference on Image Processing (ICIP), Beijing, China, 17–20 September 2017; pp. 790–794. [Google Scholar]
- Hu, J.; Shen, L.; Sun, G. Squeeze-and-excitation networks. In Proceedings of the IEEE Conference on Computer Vision and Pattern Recognition, Salt Lake City, UT, USA, 18–22 June 2018; pp. 7132–7141. [Google Scholar]
- Szegedy, C.; Ioffe, S.; Vanhoucke, V.; Alemi, A. Inception-v4, inception-resnet and the impact of residual connections on learning. In Proceedings of the AAAI Conference on Artificial Intelligence, San Francisco, CA, USA, 4–9 February 2017; p. 31. [Google Scholar]
- Caicedo, J.C.; Goodman, A.; Karhohs, K.W.; Cimini, B.A.; Ackerman, J.; Haghighi, M.; Heng, C.; Becker, T.; Doan, M.; McQuin, C.; et al. Nucleus segmentation across imaging experiments: The 2018 Data Science Bowl. Nat. Methods 2019, 16, 1247–1253. [Google Scholar] [CrossRef] [PubMed]
- Liu, H.; Rashid, T.; Ware, J.; Jensen, P.; Austin, T.; Nasrallah, I.; Bryan, R.; Heckbert, S.; Habes, M. Adaptive Squeeze-and-Shrink Image Denoising for Improving Deep Detection of Cerebral Microbleeds. In Proceedings of the Medical Image Computing and Computer Assisted Intervention–MICCAI 2021: 24th International Conference, Strasbourg, France, 27 September–1 October 2021; Springer: Berlin/Heidelberg, Germany, 2021; pp. 265–275. [Google Scholar]


Disclaimer/Publisher’s Note: The statements, opinions and data contained in all publications are solely those of the individual author(s) and contributor(s) and not of MDPI and/or the editor(s). MDPI and/or the editor(s) disclaim responsibility for any injury to people or property resulting from any ideas, methods, instructions or products referred to in the content. |
© 2023 by the authors. Licensee MDPI, Basel, Switzerland. This article is an open access article distributed under the terms and conditions of the Creative Commons Attribution (CC BY) license (https://creativecommons.org/licenses/by/4.0/).