
Camera Pose Generation Based on Unity3D


Abstract
1. Introduction
- 1.
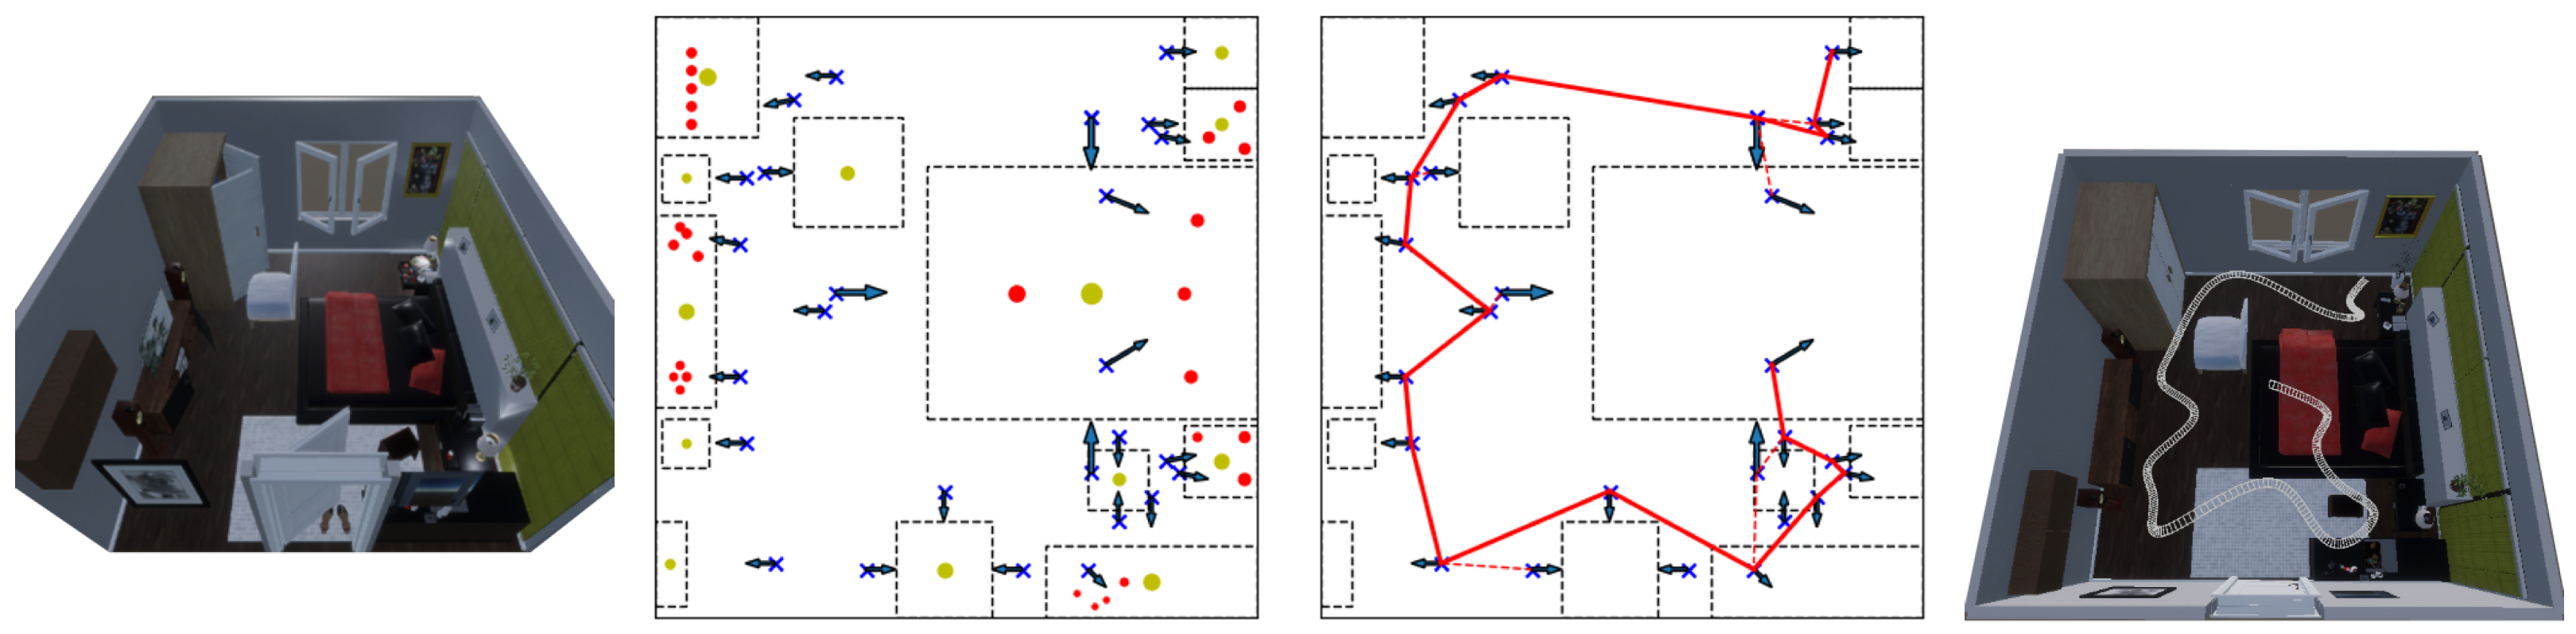
- In this study, we propose a hierarchical camera pose generation algorithm. The algorithm first generates coarse-grained keypoints based on indoor spatial objects, and then generates complete paths through an improved RRT* algorithm. The primary benefit of this algorithm is that it is entirely inspired by geometric information in the environment and does not rely on image information. Consequently, the method does not have to turn on camera rendering, which significantly reduces the time spent on running the model. The generation of a single trajectory requires approximately 500 ms, and the object capture rate is enhanced to around 80%.
- 2.
- In this study, we propose automatic image rendering and annotation methods in Unity Engine. When the camera trajectory is formed, it is made continuous and smoothed using Bessel curve [11] interpolation. The HD rendering pipeline of Unity Engine is used to render the image automatically, and the annotation information—such as instance segmentation and object detection—can be output by binding the NYU [12] category labels to the model.
- 3.
- In this study, we propose the development of an import module that facilitates the compatibility of diverse datasets with Unity Engine. The module facilitates the conversion of diverse model structures that are prevalent in mainstream datasets—including FBX, OBJ, and C4D—into triangular meshes that can be utilized by Unity Engine through the Delaunay segmentation algorithm. In this study, the method is successfully used on these datasets, and new image sets are generated. Comparison experiments are conducted between the generated image set and the original image set to validate the performance of this study’s method in object detection and SLAM tasks.
2. Related Work
2.1. Storage of Camera Poses
2.2. Camera Trajectory Generation
3. Methods
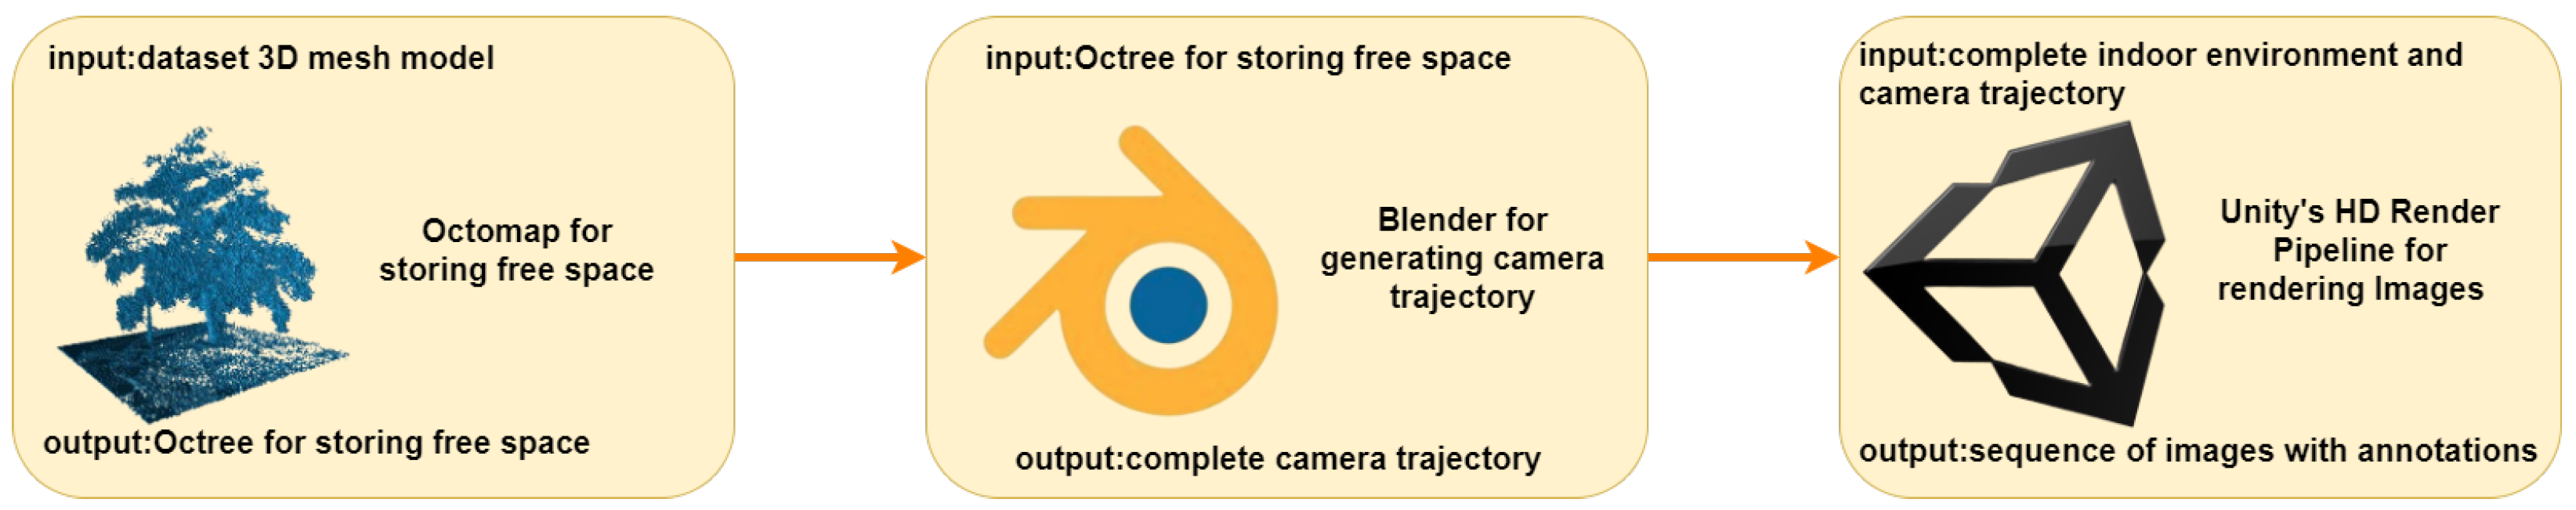
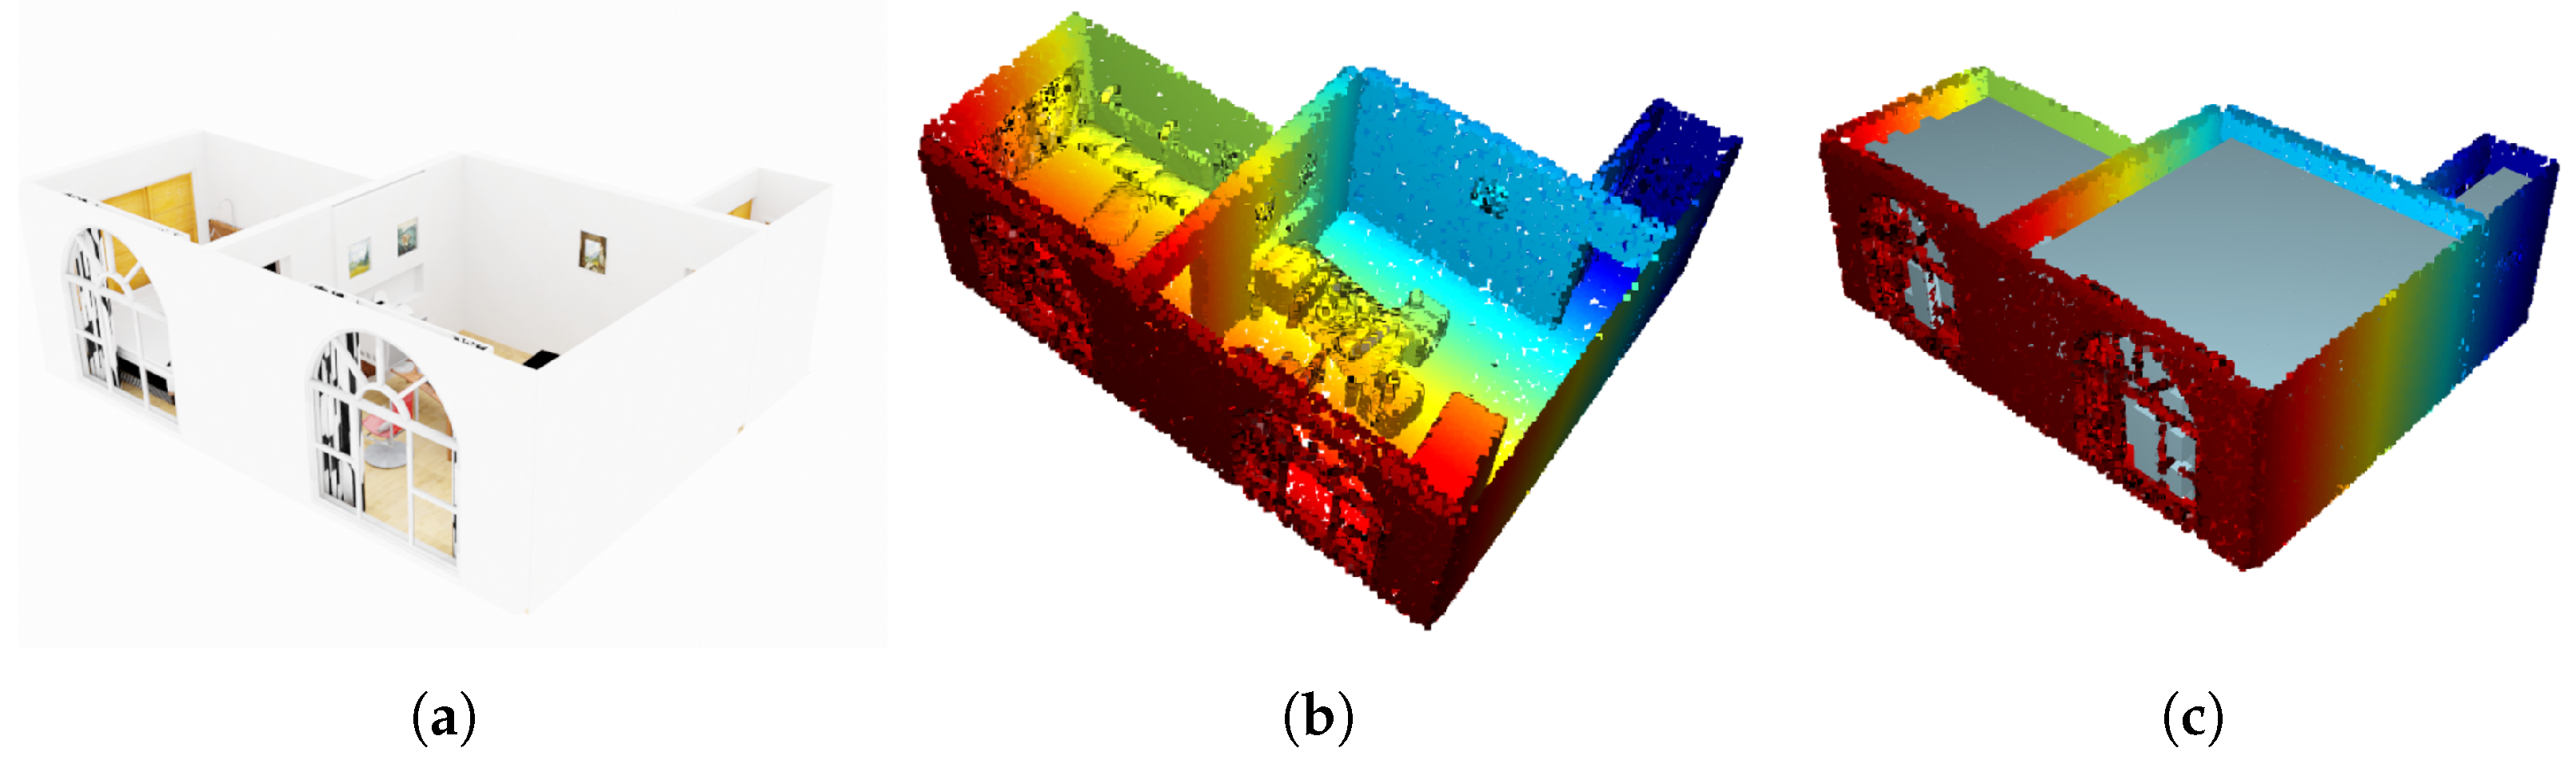
3.1. Data Mapping
3.2. Trajectory Generation
3.2.1. Single Large Object
3.2.2. Multiple Object
- (a)
- The small object is supported by the large object by gravity.
- (b)
- The small object is suspended by the large object.
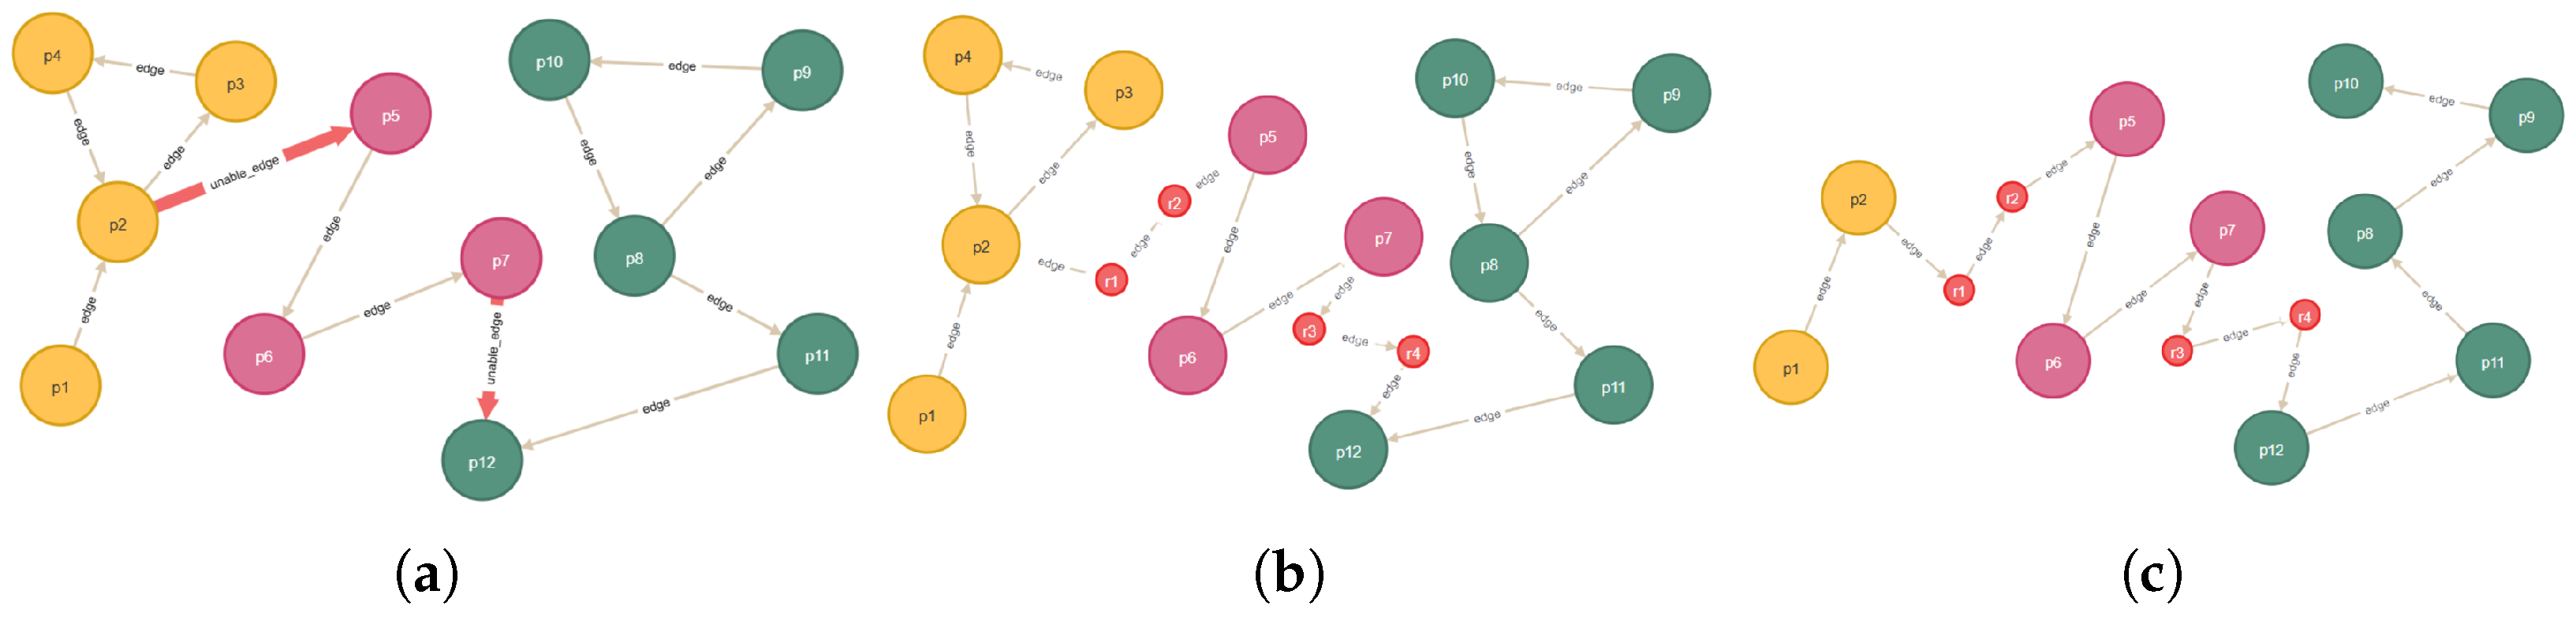
3.2.3. Path Planning
| Algorithm 1 Planning a route from a collection of position points. |
|
3.3. Data Processing
4. Experiments
4.1. Basic Metrics
4.2. Object Detection
4.3. SLAM Task
5. Conclusions
Author Contributions
Funding
Data Availability Statement
Conflicts of Interest
Abbreviations
| RRT* | rapidly exploring random tree star |
| SLAM | simultaneous localization and mapping |
| FOV | field of view |
| ORB-SLAM | oriented fast and brief SLAM |
| LSD-SLAM | large-scale direct SLAM |
| DSO | direct sparse odometry |
| ATE | absolute trajectory error |
| RE | reconstruction error |
| SR | success rate |
References
- Macario Barros, A.; Michel, M.; Moline, Y.; Corre, G.; Carrel, F. A comprehensive survey of visual slam algorithms. Robotics 2022, 11, 24. [Google Scholar] [CrossRef]
- Ramakrishnan, S.K.; Gokaslan, A.; Wijmans, E.; Maksymets, O.; Clegg, A.; Turner, J.; Undersander, E.; Galuba, W.; Westbury, A.; Chang, A.X.; et al. Habitat-matterport 3D dataset (HM3D): 1000 large-scale 3D environments for embodied AI. arXiv 2021, arXiv:2109.08238. [Google Scholar]
- McCormac, J.; Handa, A.; Leutenegger, S.; Davison, A.J. Scenenet rgb-d: 5m photorealistic images of synthetic indoor trajectories with ground truth. arXiv 2016, arXiv:1612.05079. [Google Scholar]
- Fu, H.; Cai, B.; Gao, L.; Zhang, L.X.; Wang, J.; Li, C.; Zeng, Q.; Sun, C.; Jia, R.; Zhao, B.; et al. 3d-front: 3d furnished rooms with layouts and semantics. In Proceedings of the IEEE/CVF International Conference on Computer Vision, Montreal, BC, Canada, 11–17 October 2021; pp. 10933–10942. [Google Scholar]
- Wang, W.; Zhu, D.; Wang, X.; Hu, Y.; Qiu, Y.; Wang, C.; Hu, Y.; Kapoor, A.; Scherer, S. Tartanair: A dataset to push the limits of visual slam. In Proceedings of the 2020 IEEE/RSJ International Conference on Intelligent Robots and Systems (IROS), Las Vegas, NV, USA, 24–28 October 2020; pp. 4909–4916. [Google Scholar]
- Tasora, A.; Serban, R.; Mazhar, H.; Pazouki, A.; Melanz, D.; Fleischmann, J.; Taylor, M.; Sugiyama, H.; Negrut, D. Chrono: An open source multi-physics dynamics engine. In Proceedings of the High Performance Computing in Science and Engineering: Second International Conference, HPCSE 2015, Soláň, Czech Republic, 25–28 May 2015; pp. 19–49. [Google Scholar]
- Elshakhs, Y.S.; Deliparaschos, K.M.; Charalambous, T.; Oliva, G.; Zolotas, A. A comprehensive survey on Delaunay triangulation: Applications, algorithms, and implementations over CPUs, GPUs, and FPGAs. IEEE Access 2024, 12, 12562–12585. [Google Scholar] [CrossRef]
- Noreen, I.; Khan, A.; Habib, Z. Optimal path planning using RRT* based approaches: A survey and future directions. Int. J. Adv. Comput. Sci. Appl. 2016, 7. [Google Scholar] [CrossRef]
- Geiger, A.; Lenz, P.; Stiller, C.; Urtasun, R. Vision meets robotics: The kitti dataset. Int. J. Robot. Res. 2013, 32, 1231–1237. [Google Scholar] [CrossRef]
- Du, W.; Beltrame, G. LiDAR-based Real-Time Object Detection and Tracking in Dynamic Environments. arXiv 2024, arXiv:2407.04115. [Google Scholar]
- Srivastava, H.M. An introductory overview of Bessel polynomials, the generalized Bessel polynomials and the q-Bessel polynomials. Symmetry 2023, 15, 822. [Google Scholar] [CrossRef]
- Silberman, N.; Hoiem, D.; Kohli, P.; Fergus, R. Indoor segmentation and support inference from rgbd images. In Proceedings of the Computer Vision–ECCV 2012: 12th European Conference on Computer Vision, Florence, Italy, 7–13 October 2012; pp. 746–760. [Google Scholar]
- Li, W.; Saeedi, S.; McCormac, J.; Clark, R.; Tzoumanikas, D.; Ye, Q.; Huang, Y.; Tang, R.; Leutenegger, S. Interiornet: Mega-scale multi-sensor photo-realistic indoor scenes dataset. arXiv 2018, arXiv:1809.00716. [Google Scholar]
- Roberts, M.; Ramapuram, J.; Ranjan, A.; Kumar, A.; Bautista, M.A.; Paczan, N.; Webb, R.; Susskind, J.M. Hypersim: A photorealistic synthetic dataset for holistic indoor scene understanding. In Proceedings of the IEEE/CVF international Conference on Computer Vision, Montreal, BC, Canada, 11–17 October 2021; pp. 10912–10922. [Google Scholar]
- Gharehbagh, A.K.; Judeh, R.; Ng, J.; von Reventlow, C.; Röhrbein, F. Real-time 3D Semantic Mapping based on Keyframes and Octomap for Autonomous Cobot. In Proceedings of the 2021 9th International Conference on Control, Mechatronics and Automation (ICCMA), Luxembourg, 11–14 November 2021; pp. 33–38. [Google Scholar]
- Pivoňka, T.; Přeučil, L. Stereo camera simulation in blender. In Proceedings of the Modelling and Simulation for Autonomous Systems: 7th International Conference, MESAS 2020, Prague, Czech Republic, 21 October 2020; pp. 206–216. [Google Scholar]
- Kazhdan, M.; Chuang, M.; Rusinkiewicz, S.; Hoppe, H. Poisson surface reconstruction with envelope constraints. In Computer Graphics Forum; Wiley Online Library: Hoboken, NJ, USA, 2020; Volume 39, pp. 173–182. [Google Scholar]
- Barrera, T.; Hast, A.; Bengtsson, E. Incremental spherical linear interpolation. In Proceedings of the The Annual SIGRAD Conference. Special Theme-Environmental Visualization, Gävle, Sweden, 24–25 November 2004; Linköping University Electronic Press: Linköping, Sweden, 2004; pp. 7–10. [Google Scholar]
- Peng, Y. Game Design Based on High-Definition Render Pipeline in Unity. Highlights Sci. Eng. Technol. 2024, 93, 167–178. [Google Scholar] [CrossRef]
- Zheng, Z.; Wang, P.; Liu, W.; Li, J.; Ye, R.; Ren, D. Distance-IoU loss: Faster and better learning for bounding box regression. In Proceedings of the AAAI Conference on Artificial Intelligence, New York, NY, USA, 7–12 February 2020; Volume 34, pp. 12993–13000. [Google Scholar]
- Chang, A.X.; Funkhouser, T.; Guibas, L.; Hanrahan, P.; Huang, Q.; Li, Z.; Savarese, S.; Savva, M.; Song, S.; Su, H.; et al. Shapenet: An information-rich 3d model repository. arXiv 2015, arXiv:1512.03012. [Google Scholar]
- TurboSquid. Available online: http://www.turbosquid.com/ (accessed on 26 February 2025).
- Wang, A.; Chen, H.; Liu, L.; Chen, K.; Lin, Z.; Han, J.; Ding, G. Yolov10: Real-time end-to-end object detection. arXiv 2024, arXiv:2405.14458. [Google Scholar]
- Zhao, Y.; Lv, W.; Xu, S.; Wei, J.; Wang, G.; Dang, Q.; Liu, Y.; Chen, J. Detrs beat yolos on real-time object detection. In Proceedings of the IEEE/CVF Conference on Computer Vision and Pattern Recognition, Seattle, WA, USA, 17–18 June 2024; pp. 16965–16974. [Google Scholar]
- Gong, M.; Wang, D.; Zhao, X.; Guo, H.; Luo, D.; Song, M. A review of non-maximum suppression algorithms for deep learning target detection. In Proceedings of the Seventh Symposium on Novel Photoelectronic Detection Technology and Applications, Kunming, China, 5–7 November 2020; SPIE: Bellingham, WA, USA, 2021; Volume 11763, pp. 821–828. [Google Scholar]
- Mur-Artal, R.; Montiel, J.M.M.; Tardos, J.D. ORB-SLAM: A versatile and accurate monocular SLAM system. IEEE Trans. Robot. 2015, 31, 1147–1163. [Google Scholar] [CrossRef]
- Engel, J.; Schöps, T.; Cremers, D. LSD-SLAM: Large-scale direct monocular SLAM. In Proceedings of the European Conference on Computer Vision, Zurich, Switzerland, 6–12 September 2014; pp. 834–849. [Google Scholar]
- Engel, J.; Koltun, V.; Cremers, D. Direct sparse odometry. IEEE Trans. Pattern Anal. Mach. Intell. 2017, 40, 611–625. [Google Scholar] [CrossRef] [PubMed]


| 3D-FRONT | |||
 |  | 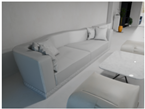 | 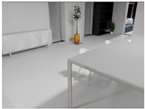 |
| SceneNet RGB-D | |||
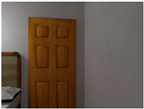 |  |  |  |
| Hypersim | |||
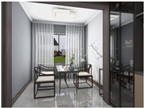 | 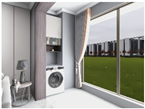 |  | 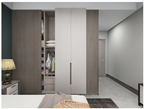 |
| Dataset | Room Style | Room Size (Met) | Object Number | Capture Rate (%) | Average Area Share (%) | Time (ms) |
|---|---|---|---|---|---|---|
| Suite | 49.7 | 94.2 | 25.5 | 324 | ||
| 3D-FRONT | Office | 38.7 | 89.5 | 27.4 | 243 | |
| Studio | 25.8 | 92.2 | 26.2 | 212 | ||
| Living room | 78.2 | 78.5 | 15.2 | 425 | ||
| SceneNet RGB-D | Office | 102.5 | 74.9 | 13.8 | 522 | |
| Kitchen | 82.7 | 75.1 | 19.5 | 466 | ||
| Living room | 52.5 | 81.3 | 28.6 | 304 | ||
| Hypersim | Dining room | 56.3 | 85.6 | 29.8 | 353 | |
| Bedroom | 49.2 | 88.9 | 26.7 | 295 |
| Training Data | YOLOv10 | RT-DETR | |||||
|---|---|---|---|---|---|---|---|
| 3D-FUTURE | 0.595 | 0.728 | 0.656 | 0.618 | 0.572 | 0.716 | 0.727 |
| Ours | 0.602 | 0.708 | 0.640 | 0.625 | 0.557 | 0.722 | 0.731 |
| SceneNet | 0.528 | 0.694 | 0.575 | 0.582 | 0.515 | 0.522 | 0.536 |
| Ours | 0.688 | 0.754 | 0.620 | 0.644 | 0.602 | 0.688 | 0.693 |
| Hypersim | 0.565 | 0.702 | 0.633 | 0.715 | 0.544 | 0.602 | 0.633 |
| Ours | 0.594 | 0.768 | 0.625 | 0.745 | 0.575 | 0.615 | 0.638 |
| Training Data | ORB—SLAM | LSD-SLAM | DSO | ||||||
|---|---|---|---|---|---|---|---|---|---|
| SR (%) | (cm) | SR (%) | (cm) | SR (%) | (cm) | ||||
| SceneNet | 0.17 | 0.75 | 0.44 | 0.72 | 0.35 | 0.72 | 0.42 | 0.62 | 0.67 |
| Ours | 0.09 | 0.82 | 0.42 | 0.78 | 0.52 | 0.77 | 0.38 | 0.72 | 0.69 |
| Hypersim | 0.18 | 0.85 | 0.35 | 0.65 | 0.63 | 0.66 | 0.35 | 0.75 | 0.48 |
| Ours | 0.07 | 0.80 | 0.33 | 0.73 | 0.58 | 0.71 | 0.33 | 0.69 | 0.56 |
Disclaimer/Publisher’s Note: The statements, opinions and data contained in all publications are solely those of the individual author(s) and contributor(s) and not of MDPI and/or the editor(s). MDPI and/or the editor(s) disclaim responsibility for any injury to people or property resulting from any ideas, methods, instructions or products referred to in the content. |
© 2025 by the authors. Licensee MDPI, Basel, Switzerland. This article is an open access article distributed under the terms and conditions of the Creative Commons Attribution (CC BY) license (https://creativecommons.org/licenses/by/4.0/).
Share and Cite
Luo, H.; Luo, W.; Yang, W. Camera Pose Generation Based on Unity3D. Information 2025, 16, 315. https://doi.org/10.3390/info16040315
Luo H, Luo W, Yang W. Camera Pose Generation Based on Unity3D. Information. 2025; 16(4):315. https://doi.org/10.3390/info16040315
Chicago/Turabian StyleLuo, Hao, Wenjie Luo, and Wenzhu Yang. 2025. "Camera Pose Generation Based on Unity3D" Information 16, no. 4: 315. https://doi.org/10.3390/info16040315
APA StyleLuo, H., Luo, W., & Yang, W. (2025). Camera Pose Generation Based on Unity3D. Information, 16(4), 315. https://doi.org/10.3390/info16040315