Abstract
Nanoparticles are used in various fields, including fuel cells, energy conversion devices, and sensors, because of their large surface area and excellent catalytic properties. Although various methods of synthesizing nanoparticles are available, the most popular is the solution-phase reduction of metal ions. Electrodeposition is a method of reducing metal ions in solution and is widely used because of its various advantages. In this study, Ag nanoparticles with a narrow size distribution were evenly dispersed on the surface of an electrode by applying electrodeposition in an agarose hydrogel medium instead of in solution, confirming the feasibility of Ag deposition in agarose hydrogel, even at a lower reduction potential than that in solution. These results are attributed to the electrolyte effect owing to the hydrophilic backbone of the agarose hydrogel and the gel effect, which reduces unexpected convection. H2O2 was detected by using the Ag nanoparticles synthesized in agarose hydrogel, and the limit of detection for H2O2 was found to be 4.82 µM, with a dynamic range of 1–500 µM. The nanoparticle synthesis platform proposed in this study is expected to be actively used for the synthesis of other metal/nonmetal nanoparticles.
1. Introduction
Nanostructured metals deposited on diverse substrates have played a pivotal role in the development of technological applications, including microelectronics [1,2], sensing [3,4], electroplating [5], energy storage [6,7], and the enhancement of Raman scattering [8] and electrocatalysis [9,10]. Metal nanoparticles have a high surface-to-volume ratio, with the capability to interact with target molecules, good electrical and catalytic properties, and a large number of active sites [11]. The properties of metal nanoparticles differ from those of the corresponding bulk materials. Among the various strategies for fabricating nanocomposites, electrochemical deposition is a practical alternative to gaseous phase deposition under vacuum, such as vapor deposition, sputtering, chemical vapor deposition [12,13], and in the solution phase, such as printing and dip-coating [14,15]. Electrochemical techniques can be used as not only facile methods for fabricating metal nanoparticles, but also versatile analytical tools for manipulating the electrochemical behavior. The potential applied to the working electrode and the duration can affect important properties of nanoparticles, such as the size, density, morphology, and electrocatalytic effects [16].
Aqueous electrolytes are typically used in conventional electrodeposition processes; however, they have some limitations, including gas evolution, the need for complexing agents, water pollution in industrial use, and irregular deposition caused by natural convection for long-term electrolysis [17,18]. To overcome the limitations of aqueous solvents, several alternative media, such as organic solvents or ionic liquids, have been used, but the toxicity, volatility, and poor solubility of simple metal salts are the major barriers to their application [19,20,21,22].
A hydrogel is a three-dimensional (3D) network comprising a hydrophilic functional group of polymer chains, which can imbibe a large amount of water without dissolving [23,24]. The unique structures and properties of hydrogels provide useful applications in many research areas, including tissue engineering [25], drug delivery [26,27], biosensors [28], and energy storage and conversion fields [29]. Agarose is a widely used material among various types of hydrogels because it is inexpensive, non-toxic, and easy to synthesize and has high structural flexibility. Agarose is a linear polysaccharide consisting of 1,3-linked -D-galactopyranose and 1,4-linked 3,4-anhydro--L-galactopyranose repeating units [30]. Recently, Hwang et al. used a hydrogel pen (HYPER) for the electrodeposition of platinum between pyramid-shaped agarose and a gold substrate by controlling the contact area [31]. We also reported the mass transport properties of solutes on the agarose interface, which precluded the effect of natural convection on the long-term electrochemistry [32].
The selective, rapid, and quantitative determination of hydrogen peroxide (H2O2) has attracted considerable attention because of the essential role of this compound in the food [33], pharmaceutical [34], clinical [35], cosmetic [36], and biochemical industries [37]. Various analytical methods have been employed to trace H2O2, including chromatography [38], fluorescence [39], chemiluminescence [40], and electrochemical methods [41,42]. Among these techniques, electrochemical analysis is the most suitable owing to its speed, low detection limit, simple instrumentation, and real-time measurement capabilities. Electrochemical detection of H2O2 is commonly based on the use of enzymes as signal transducers [43]. Although enzyme-based sensors have an ultra-low detection limit for analytes, their application to H2O2 is limited because of their inherent poor stability, which causes denaturation. Moreover, the catalytic activity and selectivity for H2O2 are significantly reduced by other interfering substances with similar detection potentials, such as dopamine, uric acid, catecholamine, and ascorbic acid. Because of these disadvantages of enzyme-based electrochemical sensing for H2O2, metal nanoparticles are prospectively good alternatives for replacing enzyme transducers owing to their outstanding conductivity, long-term stability, and excellent electrocatalytic activity [41,44].
Herein, we report a simple method for the electrodeposition of Ag nanoparticles on indium tin oxide (ITO) by using agarose hydrogel media. Agarose-based Ag deposition exhibits numerous desirable characteristics, such as well-dispersed and uniform particles and adjustable properties, compared with the conventional solution-phase process. Electrodeposition is a versatile method of controlling the shape and size of metal nanoparticles on a conducting surface by adjusting the preparation conditions [45,46]. Therefore, the size of the Ag nanoparticles can be controlled by adjusting the deposition time without any interference (i.e., natural convection), as confirmed by performing field-emission scanning electron microscopy (FE-SEM) analysis of the particle morphology. Metal nanoparticles are considered the most promising alternatives to enzymes for electrochemical detection [47]. In this study, the electrocatalytic activity of Ag nanoparticles for H2O2 sensing is evaluated using an electrochemical method. Many methods of fabricating metal nanoparticles in bulk solutions are known and widely used; however, hydrogel-based methods of synthesizing nanocomposites have rarely been studied. Therefore, our approach is expected to be a good candidate for the synthesis of various types of metal nanoparticles. The electrochemical setup for Ag deposition and H2O2 sensing using agarose hydrogel are depicted in Scheme 1.
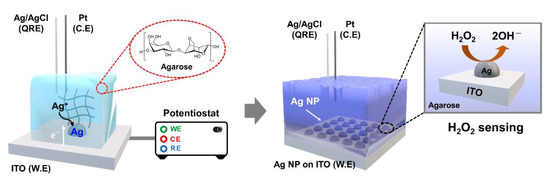
Scheme 1.
Schematic of cell configuration for the electrodeposition of Ag nanoparticles on ITO and H2O2 sensing.
2. Experimental
2.1. Materials
Agarose (Low EEO), silver nitrate (AgNO3, 97%), potassium perchlorate (KClO4, 99.9%), and nitric acid (HNO3, ~70%) were obtained from Sigma-Aldrich (St. Louis, MO, USA). Perchloric acid (HClO4, 70%) and hydrogen peroxide (H2O2, 30%) were purchased from Acros Organic and Fisher Chemical, respectively. Silver was electrodeposited on indium tin oxide (ITO)-coated glass (Omniscience, Yongin-si, Republic of Korea, 10 Ω cm−2 sheet resistance). The ITO was cleaned with acetone and isopropanol in an ultrasonic bath for 5 min and dried under a N2 stream. All chemicals and reagents used in this work were of reagent grade. Water (>18 MΩ·cm) was obtained from a Millipore Milli-Q purification system.
2.2. Preparation of Agarose Hydrogel for Electrochemical Measurement
The agarose solutions (3.2 wt%) were prepared in a microwavable cylindrical container equipped with a sealing cap. The solution in the container was heated under microwave (700 W power) until the agarose was completely dissolved. The dissolved solution was placed in a vacuum desiccator to remove air bubbles that disrupted the gel. The prepared agarose solution (viscous and transparent) was poured into a glass mold and cooled slowly in a humidity-controlled chamber. The solidified agarose was cut into the desired sizes, carefully separated from the glass mold, and stored in distilled water. Before the electrochemical measurements, the agarose gels were immersed in an aqueous solution of redox molecules and a supporting electrolyte for 12 h to achieve complete equilibrium. For the electrochemical measurements, a redox material containing agarose gel was installed in a homemade cell.
2.3. Electrochemical and FE-SEM Measurement
Electrochemical measurements were performed in a conventional three-electrode cell using a CHI 601e potentiostat (CH Instruments, Austin, TX, USA). Indium tin oxide (ITO; 2.5 × 2.5 cm) was used as the working electrode, and a Pt wire and Ag/AgCl wire were used as the counter electrode and quasi-reference electrode, respectively, and were positioned inside the agarose gel. A homemade cell equipped with a vertical press was used to ensure conformal contact between the agarose hydrogel and ITO electrode. The surface morphology of the electrodeposited Ag on ITO was characterized by using FE-SEM (TESCAN, MIRA III, 15 kV, WD = 9.9~10.3 mm) which was equipped with detector for imaging of secondary electron. Additionally, the chemical composition were analyzed by the FE-SEM equipped with energy dispersive spectrometry (EDS, Oxford Instruments, Oxford, UK).
2.4. Electrodeposition of Ag on ITO and Electrochemical H2O2 Reduction
The electrochemical deposition of Ag on ITO is potentiostatically similar to that in the aforementioned cell configuration. Agarose gel was immersed in a mixture of 1 mM AgNO3, 5 mM KClO4, and 1 mM HClO4 as a soaking solution which was adjusted to pH 4 (see Figure S1 in the Supplementary Materials). Cyclic voltammetry (CV) scans were recorded in the range of 0.4 to −0.5 V at a scan rate of 50 mV/s. Chronoamperometry (CA) for Ag deposition was performed by applying −0.35 V (vs. Ag/AgCl quasi-reference electrode (QRE)) to the ITO working electrode in contact with the agarose hydrogel. To ensure a conformal contact, constant pressure was applied between agarose hydrogel and ITO by home-made press machine. The electrocatalytic effect of Ag on ITO (Ag deposition time: 10 s, Figure S2) for H2O2 detection was determined by performing CV and chronocoulometry (CC) in an electrochemical buffer (EB; 0.1 M phosphate buffer and 700 mM NaCl; pH 7.4) with different concentrations of H2O2.
3. Results and Discussion
The scanning electron microscopy (SEM) images show the morphology of the bare ITO electrode before and after three CV cycles. The bare ITO electrode showed densely attached grains with crystalline particles of approximately 30 nm in diameter (Figure 1b). This structure imparted highly conductive properties to the ITO surface. Figure 1c shows the SEM micrograph after three CV cycles, in which the ITO surface remained stable without any damage caused by ITO reduction or oxygen evolution.
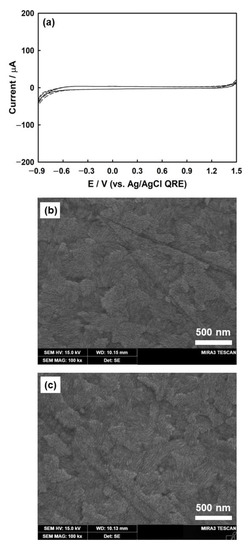
Figure 1.
Three cycles of CVs for bare ITO electrode (a) in a solution of 1 mM HClO4 and 5 mM KClO4 (scan rate, v = 100 mV/s). SEM image of bare ITO (b) before and (c) after three cycles of CV.
ITO was used as the working electrode for the electrodeposition of Ag nanoparticles. Although ITO has low electrical resistivity (~10−4 Ω·cm) with high transparency to UV-vis light (>90% transmittance), it is known that electrochemically reduced ITO electrodes turn dark brown in color and are less conductive [48,49]. To prevent this reduction, the ITO electrode was evaluated by employing CV to check its stability within the potential windows for the electrodeposition of silver. Figure 1a shows that ITO was stable in the supporting electrolyte over the potential range of +1.3 V to −0.7 V. ITO was reduced at a potential more negative than −0.7 V, and oxygen evolution was initiated at a potential more positive than +1.3 V.
The electrochemical process of silver deposition on the ITO substrate was studied using CV in solution and agarose hydrogel (Figure 2). In the solution (Figure 2a), two distinct peaks related to the reduction of silver ions and the oxidation of silver previously deposited on the ITO surface are observed. The sharp increase in the cathodic current at −0.2 V is an indication of an increase in silver nucleation and particle growth, reaching the cathodic peak current (Ipc) of −176 mA/cm2 at −0.376 V. The reaction related to the peak current (Ipc) is indicated by Equation (1):
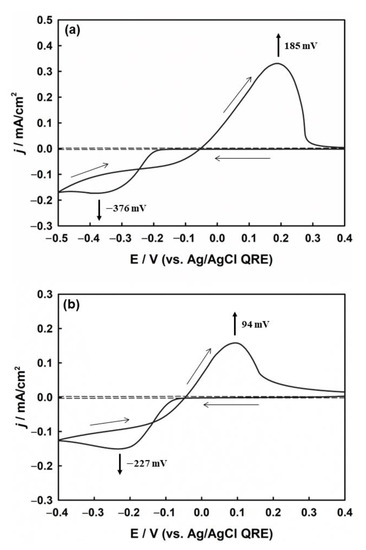
Figure 2.
CVs of silver redox process on ITO electrode (a) in solution and (b) in agarose hydrogel, both containing 2 mM AgNO3, 1 mM HClO4, and 5 mM KClO4. The dotted line represents the background signal without AgNO3. Scan rate: 50 mV/s.
The deposition potential between metal ions and the foreign substrate is generally higher than that between the same metal particles due to crystallographic substrate-metal misfit, except in the case of underpotential deposition [17]. Therefore, the deposition of Ag+ on the ITO electrode was more negative than the formal potential of Ag+/Ag. However, during the positive scan, the oxidation of silver began from the same silver surface that had already been deposited onto the ITO surface. Owing to the difference in the deposition and stripping potentials, a crossover between the cathodic and anodic current traces occurred. Therefore, crossover is another method of forming metal nuclei on the electrode [50].
Figure 2b shows the cyclic voltammogram for the electrochemical deposition of Ag on the ITO substrate in the agarose hydrogel. From the electrochemical analysis, it was confirmed that the agarose hydrogel was not adsorbed on the surface of the synthesized Ag nanoparticles. (see Figure S3 in the Supplementary Materials). The CV profile was similar to that in solution, but presented different onset potentials for silver deposition. The decrease in both the cathodic and anodic overpotentials compared to those in solution suggests that silver deposition in agarose is more favorable than in solution, which is assumed to be due to the higher interaction and stabilization between charged silver ions and the hydrophilic moieties of the agarose polymer backbone.
To confirm the mass transport properties of silver ions in the agarose media, the CV of the silver deposition process was measured by varying the scan rate in the agarose hydrogel. As shown in Figure 3a, the cathodic and anodic currents both increased as the scan rate increased from 5 to 100 mV/s.
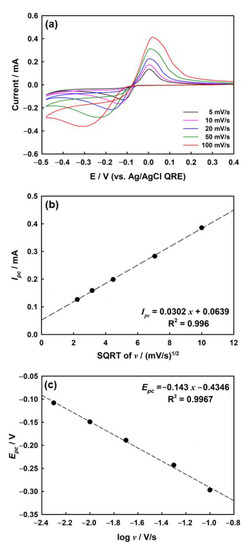
Figure 3.
(a) CVs of ITO electrode in agarose hydrogel containing 2 mM AgNO3, 1 mM HClO4, and 5 mM KClO4 depending on scan rate. (b) Plots of cathodic peak current (Ipc) vs. square root of the scan rate (v) and (c) dependence of peak potential, Epc, vs. log v in 4.8 wt% of agarose hydrogel.
A linear relationship between the cathodic peak current (Ipc) and square root of the scan rate (v) was observed for the silver deposition process (Figure 3b). Linearity is generally observed in electrochemical reactions in which the mass transport of redox molecules is mostly governed by the diffusion process [51]. Therefore, the main factor affecting mass transfer in agarose hydrogels is diffusion, whereas other factors (i.e., convection and migration) are not worth considering at normal scan rates [32].
Figure 3c shows the change in the cathodic peak potential (Epc) according to the log (scan rate, v) for the electrodeposition of silver on ITO in agarose hydrogel. The coefficient of charge transfer (α) is calculated to be 0.38 at room temperature (298 K) by using Equation (2) [52,53]:
where R is the gas constant, T is the absolute temperature, α is the charge-transfer coefficient, n is the number of electrons in the rate-determining step, and F is the Faraday constant.
│Ep – Ep/2│ = 1.857RT/αnF
Silver was electrodeposited on the ITO electrode under two conditions: in solution and agarose hydrogel. Figure 4a show the SEM images of the Ag deposits formed at 0.35 V (vs. Ag/AgCl QRE) over 10 s in solution, demonstrating a broad range of sizes (refer Figure S4a and Figure S5a in the Supplementary Materials) and irregular shapes. This suggests that controlling the morphology or distribution of the deposited nanoparticles is difficult in the solution phase, which is assumed to be caused by uncontrollable mass transport properties (i.e., natural convection). Ag deposition in the agarose hydrogel (refer Figure S4b and Figure S5b in the Supplementary Materials) afforded nanoparticles with a regular shape, which were well-distributed laterally compared to those obtained via solution-phase electrodeposition (Figure 4b). Additionally, the total amount of Ag nanoparticles on ITO was approximately 7.265 × 10⁻¹² mol/cm2 using anodic stripping voltammetry (see Figure S6 in the Supplementary Materials). We assumed that the interaction between the Ag+ ions and the hydrophilic polymer network of the hydrogel can reduce natural convection [32], which causes irregular transport of the solute to the electrode surface. The transport of metal ions to the electrode surface is crucial for the electrodeposition of metal nanoparticles. The pore structure of the agarose hydrogel could be controlled by varying its concentration. From these results, the agarose hydrogel appeared not only to be a good template, but also a well-controllable reaction medium for the electrochemical deposition of metal nanoparticles.
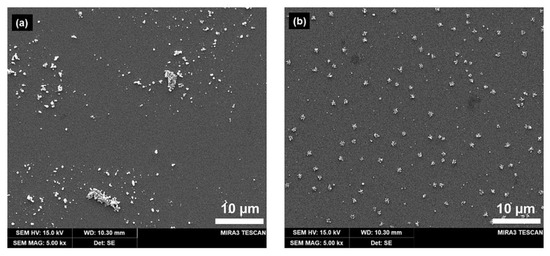
Figure 4.
SEM images of silver clusters electrodeposited on ITO electrode (a) in solution, (b) in agarose hydrogel (3.2 wt%) from a solution containing 1 mM AgNO3, 1 mM HClO4, and 5 mM KClO4. Electrodeposition was performed at −0.35 V (vs. Ag/AgCl quasi-reference electrode (QRE)) for 10 s.
The influence of the duration of application of the potential (hereinafter, potential duration) on silver deposition in the agarose hydrogel was determined by varying the deposition time using a ITO working electrode. Small metal particles have adjustable properties (e.g., magnetic, optical, and electronic) that can be tuned based on the structure, interparticle density, and particle size. In a typical electrodeposition process, the potential duration applied to the electrodes influences the nucleation and crystal growth of the metal nanoparticles [17,46].
Figure 5 shows the SEM micrograph of the Ag-deposited ITO electrode surface when a potential of −0.35 V against the Ag/AgCl QRE is applied for durations of 0.5 to 10 s in the silver-containing agarose hydrogel. The SEM images show marked differences in the size and morphology of the particles with an increasing deposition time. As shown in Figure 5a, after electrodeposition of 1.0 mM AgNO3 for 0.5 s, silver deposits with a diameter less than 100 nm are obtained. This indicates that the onset of silver nucleation occurs earlier than 0.5 s. Although uneven, at longer deposition times, the size of the silver deposits increases owing to the aggregation of small clusters (Figure 5a–f). Precise control of the size and morphology is beyond the scope of this work, and the well-controlled fabrication of electrodeposited nanoparticles is still a challenging technique that depends on various parameters. Nonetheless, Ag nanomaterials of various sizes were successfully fabricated on the ITO electrode surface in agarose hydrogel by controlling the deposition time.
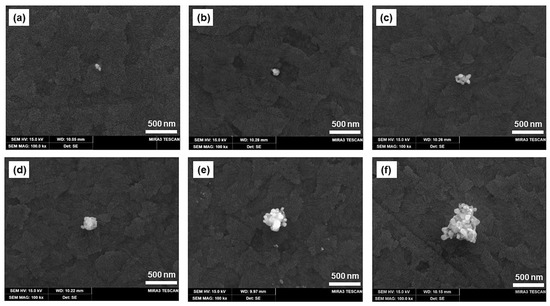
Figure 5.
SEM micrographs of silver nanoparticles deposited on ITO electrode in agarose hydrogel containing 1 mM AgNO3 at a potential of 0.35 V at deposition times of (a) 0.5 s, (b) 1.0 s, (c) 1.5 s, (d) 2.0 s, (e) 5.0 s, and (f) 10.0 s.
Silver particles are known to act as electrocatalysts for H2O2 reduction [52]. H2O2 is reduced on the electrode via the following mechanism [54]:
The net reduction of H2O2 in solution is given as
To confirm the electrocatalytic properties of the prepared Ag nanostructures, the electroreduction of H2O2 was characterized by employing CV within the stable potential range of the ITO electrode in a deaerated 0.1 M phosphate-buffered solution (pH 7.4) containing 1.0 mM H2O2, at a scan rate of 100 mV/s (Figure 6a). The current response of the bare ITO electrode (black line) for H2O2 is small, indicating negligible electrocatalytic activity. In the absence of H2O2 (blue dotted line), even the ITO electrode modified with Ag nanoparticles exhibits a weak current, similar to that of bare ITO without H2O2. In both cases, the H2O2 reduction signals are negligible. However, the strongest catalytic reduction current is observed for the Ag-modified ITO electrode in the presence of H2O2 at −0.6 V vs. Ag/AgCl QRE. This suggests that H2O2 can be reduced only on the Ag surface of the ITO electrode, and the Ag-ITO electrode possesses excellent electrocatalytic capability for H2O2 reduction.
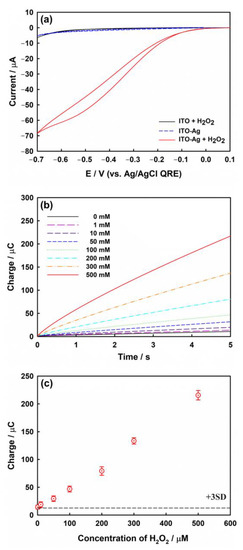
Figure 6.
(a) CVs obtained with bare ITO (black line) and ITO electrode modified with Ag nanoparticles in the presence (red line) or absence of 1.0 mM H2O2 (blue dotted line) in phosphate buffer (pH 7.4). Scan rate: 100 mV/s. (b) CCs obtained at −0.6 V in phosphate buffer (pH 7.4) containing various concentrations (1, 10, 50, 100, 200, 300, and 500 μM) of H2O2. (c) Calibration plot for the charge values at 5 s in panel (b). The error bars represent the standard deviation (SD) of three independent measurements. All data were corrected by the mean value of the double layer charging current determined from five measurements at zero concentration of H2O2. The dotted line shows three times the SD of the charging current obtained at zero concentration of H2O2. Ag deposition condition: potential of −0.35 V (vs. Ag/AgCl QRE) for 10.0 s.
To investigate the analytical application of the modified electrode for H2O2 sensing, chronocoulograms were acquired for the Ag-modified ITO electrodes using different concentrations of H2O2 (Figure 6b). In chronocoulometry (CC) [55], the integrated current at a given period of time is used as the sensing signal. These signals show superior reproducibility over those obtained by using potential sweep techniques such as CV. The capacitive charging current, as the background level in CV, can be a major obstacle in electrochemical sensing, whereas the effect of the capacitive charging current in CC can be sufficiently reduced by the integration process under sufficiently long-term measurements. The typical charge-time response is proportional to the H2O2 concentration in the range of 1.0–500 μM. The mean charge value at 5.0 s in the absence of H2O2 is 10.7 μC, and the standard deviation (SD) is 0.65 μC. Figure 6c shows the calibration plot for the charge data obtained at 5.0 s presented in Figure 6b. The estimated limit of detection (LOD) using Equation (6) for this sensing platform is ca. 4.83 μM.
where Sb is the SD of the blank and m is the slope of the corresponding calibration curve (refer Figure S7 in the Supplementary Materials) [56]. To confirm the selectivity of our sensor system, amperometric i-t response was obtained in the presence of interference molecule such as nitrate, glucose, and ascorbic acid (refer Figure S8 in the Supplementary Materials). These results reveal that the developed hydrogel-based Ag-ITO sensor exhibits excellent performance in terms of high sensitivity and selectivity as well as low detection limit, comparable to those of other non-enzymatic H2O2 sensors (see Table 1).
LOD = 3Sb/m

Table 1.
Comparison of various non-enzymatic H2O2 sensors based on nanomaterials.
4. Conclusions
In this study, we successfully deposited Ag nanoparticles on an ITO electrode in agarose hydrogel. Electrodeposition of Ag nanoparticles in agarose hydrogels has the following advantages over deposition in solution: (1) nanoparticles can be deposited with relatively mild reduction potentials; (2) nanoparticles are evenly dispersed and deposited on the electrode surface; (3) the sizes of the synthesized nanoparticles are relatively homogeneous. These advantages may be attributed to the hydrophilic backbone of the agarose hydrogel and the minimization of unexpected convection. Ag nanoparticles synthesized in agarose hydrogel, as a solid electrolyte, showed good sensing ability for H2O2. The LOD of our sensing platform for H2O2 detection was 4.83 µM, with a dynamic range of 1–500 µM. The LOD and dynamic range were extremely low compared with those observed in several recent studies. The proposed method for nanoparticle electrosynthesis in agarose hydrogel is not limited to Ag. Agarose hydrogels can be actively used for the synthesis of various metal and non-metal nanoparticles and are expected to be used as important nanoparticles or nanocatalyst synthetic media.
Supplementary Materials
The following supporting information can be downloaded at: https://www.mdpi.com/article/10.3390/nano13010048/s1, Figure S1: Cyclic voltammetry of silver deposition on ITO using agarose hydrogel (3.2 wt%) as function of pH in 2 mM AgNO3, 1 mM HClO4, and 5 mM KClO4. pH was adjusted by HNO3. Scan rate: 10 mV/s; Figure S2: The calibration plot for the H2O2 oxidation charge values of chronocoulograms obtained at −0.6 V according to the Ag deposition time. The H2O2 sensing experiment conducted in 0.1 M phosphate buffer (pH 7.4) and 700 mM NaCl with 300 μM H2O2. The error bars represent the three independent measurements; Linear sweep voltammetry (LSV) with bare ITO (black line) and electrodeposition of Ag on ITO in solution (blue line), in agarose hydrogel (red line) from a solution containing 1 mM H2O2 in phosphate buffer (pH 7.4). Electrodeposition was performed at −0.35 V (vs. Ag/AgCl QRE) for 5 s. The indicated numbers are each onset potential; Figure S4: The size distribution histograms for silver nanoparticles deposited on ITO in solution (a), in agarose hydrogel (b); Figure S5: SEM micrographs of ITO surface upon electrodeposition of silver (a) in solution, (b) in agarose hydrogel at both ×50 k magnification; Figure S6: Anodic stripping voltammetry curve on silver nanoparticles electrodeposited on ITO prepared the same as in Figure 4(b); Figure S7: Calibration plot for the charge values at 5 s in Figure 6(b) against the concentration of H2O2; Figure S8: Amperometric responses of Ag nanoparticles modified ITO in Ar-saturated phosphate buffer (pH 7.4) with addition of 0.5 mM interference molecules (ascorbic acid, glucose, nitrate) and 0.5 mM H2O2.
Author Contributions
Conceptualization, B.-K.K. and K.P.; methodology, J.K. and K.P.; software, J.K., B.-K.K. and K.P.; validation, J.K., B.-K.K. and K.P.; formal analysis, B.-K.K. and K.P.; investigation, J.K. and K.P.; resource, B.-K.K. and K.P.; writing—original draft preparation, K.P.; writing—review and editing, B.-K.K. and K.P.; supervision, K.P.; project administration, B.-K.K. and K.P.; funding acquisition, B.-K.K. and K.P. All authors have read and agreed to the published version of the manuscript.
Funding
K.P. acknowledges the support from the Basic Science Research Program of the Research Institute for Basic Sciences (RIBS) of Jeju National University through the National Research Foundation of Korea (NRF), funded by the Ministry of Education (2019R1A6A1A10072987). This research was also supported by the Basic Science Research Program through the National Research Foundation of Korea (NRF), funded by the Ministry of Education (NRF-2022R1I1A3072996). B.K. was supported by the Basic Science Research Program through the National Research Foundation of Korea (NRF), funded by the Ministry of Education (2021R1A6A1A10039823) and the National Research Foundation (NRF) of Korea, funded by the Ministry of Science and ICT (NRF-2021R1A2C4002069).
Institutional Review Board Statement
Not applicable.
Informed Consent Statement
Not applicable.
Data Availability Statement
Not applicable.
Acknowledgments
We sincerely appreciate the editor and reviewer to improve our work by constructive comments.
Conflicts of Interest
The authors declare that they have no competing interests.
References
- Liu, Q.; Chen, D.; Kang, Z. One-step electrodeposition process to fabricate corrosion-resistant superhydrophobic surface on magnesium alloy. ACS Appl. Mater. Interfaces 2015, 7, 1859–1867. [Google Scholar] [CrossRef] [PubMed]
- Zhao, M.; Balachandran, R.; Patterson, Z.; Gouk, R.; Verhaverbeke, S.; Shadman, F.; Keswani, M. Contactless bottom-up electrodeposition of nickel for 3D integrated circuits. RSC Adv. 2015, 5, 45291–45299. [Google Scholar] [CrossRef]
- Qiu, Z.; Tang, D. Nanostructure-based photoelectrochemical sensing platforms for biomedical applications. J. Mater. Chem. B 2020, 8, 2541–2561. [Google Scholar] [CrossRef] [PubMed]
- Ravindran, A.; Chandran, P.; Khan, S.S. Biofunctionalized silver nanoparticles: Advances and prospects. Colloids Surf. B Biointerfaces 2013, 105, 342–352. [Google Scholar] [CrossRef] [PubMed]
- Sun, X.; Zhang, X.; Ma, Q.; Guan, X.; Wang, W.; Luo, J. Revisiting the Electroplating Process for Lithium-Metal Anodes for Lithium-Metal Batteries. Angew. Chem. Int. Ed. Engl. 2020, 59, 6665–6674. [Google Scholar] [CrossRef]
- Arico, A.C.; Bruce, P.; Scrosati, B.; Tarascon, J.-M.; Schalkwijk, W.V. Nanostructured materials for advanced energy conversion and storage devices. Nat. Mater. 2005, 4, 366–377. [Google Scholar] [CrossRef]
- Pomerantseva, E.; Bonaccorso, F.; Feng, X.; Cui, Y.; Gogotsi, Y. Energy storage: The future enabled by nanomaterials. Science 2019, 366, 6468. [Google Scholar] [CrossRef]
- Ren, B.; Liu, G.K.; Lian, X.B.; Yang, Z.L.; Tian, Z.Q. Raman spectroscopy on transition metals. Anal. Bioanal. Chem. 2007, 388, 29–45. [Google Scholar] [CrossRef]
- Ma, M.; Trzesniewski, B.J.; Xie, J.; Smith, W.A. Selective and Efficient Reduction of Carbon Dioxide to Carbon Monoxide on Oxide-Derived Nanostructured Silver Electrocatalysts. Angew. Chem. Int. Ed. Engl. 2016, 55, 9748–9752. [Google Scholar] [CrossRef]
- Liu, H.; Park, J.; Chen, Y.; Qiu, Y.; Cheng, Y.; Srivastava, K.; Gu, S.; Shanks, B.H.; Roling, L.T.; Li, W. Electrocatalytic Nitrate Reduction on Oxide-Derived Silver with Tunable Selectivity to Nitrite and Ammonia. ACS Catal. 2021, 11, 8431–8442. [Google Scholar] [CrossRef]
- Jamkhande, P.G.; Ghule, N.W.; Bamer, A.H.; Kalaskar, M.G. Metal nanoparticles synthesis: An overview on methods of preparation, advantages and disadvantages, and applications. J. Drug Deliv. Sci. Technol. 2019, 53, 101174. [Google Scholar] [CrossRef]
- Cioffi, N.; Colaianni, L.; Ieva, E.; Pilolli, R.; Ditaranto, N.; Angione, M.D.; Cotrone, S.; Buchholt, K.; Spetz, A.L.; Sabbatini, L.; et al. Electrosynthesis and characterization of gold nanoparticles for electronic capacitance sensing of pollutants. Electrochim. Acta 2011, 56, 3713–3720. [Google Scholar] [CrossRef]
- Caschera, D.; Federici, F.; Zane, D.; Focanti, F.; Curulli, A.; Padeletti, G. Gold nanoparticles modified GC electrodes: Electrochemical behaviour dependence of different neurotransmitters and molecules of biological interest on the particles size and shape. J. Nanopart. Res. 2009, 11, 1925–1936. [Google Scholar] [CrossRef]
- Baig, N.; Kammakakam, I.; Falath, W. Nanomaterials: A review of synthesis methods, properties, recent progress, and challenges. Mater. Adv. 2021, 2, 1821–1871. [Google Scholar] [CrossRef]
- Abbott, A.P.; Griffith, J.; Nandhra, S.; O’Connor, C.; Postlethwaite, S.; Ryder, K.S.; Smith, E.L. Sustained electroless deposition of metallic silver from a choline chloride-based ionic liquid. Surf. Coat. Technol. 2008, 202, 2033–2039. [Google Scholar] [CrossRef]
- Pei, A.; Zheng, G.; Shi, F.; Li, Y.; Cui, Y. Nanoscale Nucleation and Growth of Electrodeposited Lithium Metal. Nano Lett. 2017, 17, 1132–1139. [Google Scholar] [CrossRef] [PubMed]
- Grujicic, D.; Pesic, B. Electrodeposition of copper: The nucleation mechanisms. Electrochim. Acta 2002, 47, 2901–2912. [Google Scholar] [CrossRef]
- Park, K.; Kim, E.; Park, J.H.; Hwang, S. Influence of an active vibration isolator and electrochemical cell design on electrochemical measurements to minimize natural convection. Electrochem. Commun. 2017, 82, 93–97. [Google Scholar] [CrossRef]
- Suryanto, B.H.R.; Gunawan, C.A.; Lu, X.; Zhao, C. Tuning the electrodeposition parameters of silver to yield micro/nano structures from room temperature protic ionic liquids. Electrochim. Acta 2012, 81, 98–105. [Google Scholar]
- Kazeminezhad, I.; Barnes, A.C.; Holbrey, J.D.; Seddon, K.R.; Schwarzacher, W. Templated electrodeposition of silver nanowires in a nanoporous polycarbonate membrane from a nonaqueous ionic liquid electrolyte. Appl. Phys. A 2007, 86, 373–375. [Google Scholar] [CrossRef]
- Simka, W.; Puszczyk, D.; Nawrat, G. Electrodeposition of metals from non-aqueous solutions. Electrochim. Acta 2009, 54, 5307–5319. [Google Scholar] [CrossRef]
- Abbott, A.P.; El Ttaib, K.; Frisch, G.; Ryder, K.S.; Weston, D. The electrodeposition of silver composites using deep eutectic solvents. Phys. Chem. Chem. Phys. 2012, 14, 2443–2449. [Google Scholar] [CrossRef] [PubMed]
- Mahinroosta, M.; Jomeh Farsangi, Z.; Allahverdi, A.; Shakoori, Z. Hydrogels as intelligent materials: A brief review of synthesis, properties and applications. Mater. Today Chem. 2018, 8, 42–55. [Google Scholar] [CrossRef]
- Herrmann, A.; Haag, R.; Schedler, U. Hydrogels and Their Role in Biosensing Applications. Adv. Healthc. Mater. 2021, 10, e2100062. [Google Scholar] [CrossRef]
- Tang, J.D.; Mura, C.; Lampe, K.J. Stimuli-Responsive, Pentapeptide, Nanofiber Hydrogel for Tissue Engineering. J. Am. Chem. Soc. 2019, 141, 4886–4899. [Google Scholar] [CrossRef]
- Vashist, A.; Vashist, A.; Gupta, Y.K.; Ahmad, S. Recent advances in hydrogel based drug delivery systems for the human body. J. Mater. Chem. B 2014, 2, 147–166. [Google Scholar] [CrossRef]
- Dreiss, C.A. Hydrogel design strategies for drug delivery. Curr. Opin. Colloid Interface Sci. 2020, 48, 1–17. [Google Scholar] [CrossRef]
- Khajouei, S.; Ravan, H.; Ebrahimi, A. DNA hydrogel-empowered biosensing. Adv. Colloid Interface Sci. 2020, 275, 102060. [Google Scholar] [CrossRef]
- Xu, W.; Huang, L.-B.; Wong, M.-C.; Chen, L.; Bai, G.; Hao, J. Environmentally Friendly Hydrogel-Based Triboelectric Nanogenerators for Versatile Energy Harvesting and Self-Powered Sensors. Adv. Energy Mater. 2017, 7, 1601529. [Google Scholar] [CrossRef]
- Pernodet, N.; Maaloum, M.; Tinland, B. Pore size of agarose gels by atomic force microscopy. Electrophoresis 1997, 18, 55–58. [Google Scholar] [CrossRef]
- Kang, H.; Hwang, S.; Kwak, J. A hydrogel pen for electrochemical reaction and its applications for 3D printing. Nanoscale 2015, 7, 994–1001. [Google Scholar] [CrossRef]
- Kim, B.-K.; Park, K. Mass Transport Properties and Influence of Natural Convection for Voltammetry at the Agarose Hydrogel Interface. J. Electrochem. Sci. Technol. 2022, 13, 347–353. [Google Scholar] [CrossRef]
- Juven, B.J.; Pierson, M.D. Antibacterial Effects of Hydrogen Peroxide and Methods for Its Detection and Quantitationt. J. Food Prot. 1996, 59, 1233–1241. [Google Scholar] [CrossRef] [PubMed]
- Wang, J.; Lin, Y.; Chen, L. Organic-phase biosensors for monitoring phenol and hydrogen peroxide in pharmaceutical antibacterial products. Analyst 1993, 118, 277–280. [Google Scholar] [CrossRef] [PubMed]
- Lopez-Lazaro, M. Dual role of hydrogen peroxide in cancer: Possible relevance to cancer chemoprevention and therapy. Cancer Lett. 2007, 252, 1–8. [Google Scholar] [CrossRef]
- Bautista, P.; Mohedano, A.F.; Gilarranz, M.A.; Casas, J.A.; Rodriguez, J.J. Application of Fenton oxidation to cosmetic wastewaters treatment. J. Hazard Mater. 2007, 143, 128–134. [Google Scholar] [CrossRef]
- Niethammer, P.; Grabher, C.; Look, A.T.; Mitchison, T.J. A tissue-scale gradient of hydrogen peroxide mediates rapid wound detection in zebrafish. Nature 2009, 459, 996–999. [Google Scholar] [CrossRef]
- Ivanova, A.S.; Merkuleva, A.D.; Andreev, S.V.; Sakharov, K.A. Method for determination of hydrogen peroxide in adulterated milk using high performance liquid chromatography. Food Chem. 2019, 283, 431–436. [Google Scholar] [CrossRef]
- Abo, M.; Urano, Y.; Hanaoka, K.; Terai, T.; Komatsu, T.; Nagano, T. Development of a highly sensitive fluorescence probe for hydrogen peroxide. J. Am. Chem. Soc. 2011, 133, 10629–10637. [Google Scholar] [CrossRef]
- Lee, D.; Khaja, S.; Velasquez-Castano, J.C.; Dasari, M.; Sun, C.; Petros, J.; Taylor, W.R.; Murthy, N. In vivo imaging of hydrogen peroxide with chemiluminescent nanoparticles. Nat. Mater. 2007, 6, 765–769. [Google Scholar] [CrossRef]
- Chen, W.; Cai, S.; Ren, Q.Q.; Wen, W.; Zhao, Y.D. Recent advances in electrochemical sensing for hydrogen peroxide: A review. Analyst 2012, 137, 49–58. [Google Scholar] [CrossRef] [PubMed]
- Luo, Y.; Liu, H.; Rui, Q.; Tian, Y. Detection of Extracellular H2O2 Released from Human Liver Cancer Cells Based on TiO2 Nanoneedles with Enhanced Electron Transfer of Cytochrome c. Anal. Chem. 2009, 81, 3035–3041. [Google Scholar] [CrossRef]
- Mao, L.; Osborne, P.G.; Yamamoto, K.; Kato, T. Continuous On-Line Measurement of Cerebral Hydrogen Peroxide Using Enzyme-Modified Ring-Disk Plastic Carbon Film Electrode. Anal. Chem. 2002, 74, 3684–3689. [Google Scholar] [CrossRef] [PubMed]
- Yang, D.; Ni, N.; Cao, L.; Song, X.; Alhamoud, Y.; Yu, G.; Zhao, J.; Zhou, H.B. Silver doped mesoporous silica nanoparticles based electrochemical enzyme-Less sensor for determination of H2O2 released from live cells. Micromachines 2019, 10, 268. [Google Scholar] [CrossRef] [PubMed]
- Qin, X.; Wang, H.; Wang, X.; Miao, Z.; Fang, Y.; Chen, Q.; Shao, X. Synthesis of dendritic silver nanostructures and their application in hydrogen peroxide electroreduction. Electrochim. Acta 2011, 56, 3170–3174. [Google Scholar] [CrossRef]
- Kim, B.-K.; Seo, D.; Lee, J.Y.; Song, H.; Kwak, J. Electrochemical deposition of Pd nanoparticles on indium-tin oxide electrodes and their catalytic properties for formic acid oxidation. Electrochem. Commun. 2010, 12, 1442–1445. [Google Scholar] [CrossRef]
- Katz, E.; Willner, I.; Wang, J. Electroanalytical and Bioelectroanalytical Systems Based on Metal and Semiconductor Nanoparticles. Electroanalysis 2004, 16, 19–44. [Google Scholar] [CrossRef]
- Liu, L.; Yellinek, S.; Valdinger, I.; Donval, A.; Mandler, D. Important Implications of the Electrochemical Reduction of ITO. Electrochim. Acta 2015, 176, 1374–1381. [Google Scholar] [CrossRef]
- Kim, B.-K.; Lee, J.Y.; Park, J.H.; Kwak, J. Electrochemical detection of dopamine using a bare indium–tin oxide electrode and scan rate control. J. Electroanal. Chem. 2013, 708, 7–12. [Google Scholar] [CrossRef]
- Sandmann, G.; Dietz, H.; Plieth, W. Preparation of silver nanoparticles on ITO surfaces by a double-pulse method. J. Electroanal. Chem. 2000, 491, 78–86. [Google Scholar] [CrossRef]
- Amatore, C.; Szunerits, S.; Thouin, L.; Warkocz, J.-S. The real meaning of Nernst’s steady diffusion layer concept under non-forced hydrodynamic conditions. A simple model based on Levich’s seminal view of convection. J. Electroanal. Chem. 2001, 500, 62–70. [Google Scholar] [CrossRef]
- Bard, A.J.; Faulkner, L.R. Electrochemical Methods Fundamentals and Applications, 2nd ed.; Wiley: New York, NY, USA, 2000. [Google Scholar]
- Su, C.; An, M.; Yang, P.; Gu, H.; Guo, X. Electrochemical behavior of cobalt from 1-butyl-3-methylimidazolium tetrafluoroborate ionic liquid. Appl. Surf. Sci. 2010, 256, 4888–4893. [Google Scholar]
- Meng, F.; Yan, X.; Liu, J.; Gu, J.; Zou, Z. Nanoporous gold as non-enzymatic sensor for hydrogen peroxide. Electrochim. Acta 2011, 56, 4657–4662. [Google Scholar] [CrossRef]
- Anson, F.C.; Osteryoung, R.A. Chronocoulometry: A Convenient, Rapid and Reliable Technique for Detection and Determination of Adsorbed Reactants. J. Chem. Educ. 1983, 60, 293–296. [Google Scholar] [CrossRef]
- Harris, D.C.; Lucy, C.A. Quantitative Chemical Analysis, 10th ed.; Freeman and Company: New York, NY, USA, 2022. [Google Scholar]
- Sophia, J.; Muralidharan, G. Amperometric sensing of hydrogen peroxide using glassy carbon electrode modified with copper nanoparticles. Mater. Res. Bull. 2015, 70, 315–320. [Google Scholar]
- Kong, L.; Ren, Z.; Zheng, N.; Du, S.; Wu, J.; Tang, J.; Fu, H. Interconnected 1D Co3O4 nanowires on reduced graphene oxide for enzymeless H2O2 detection. Nano Res. 2014, 8, 469–480. [Google Scholar] [CrossRef]
- Brzózka, A.; Brudzisz, A.; Jeleń, A.; Kozak, M.; Wesół, J.; Iwaniec, M.; Sulka, G.D. A comparative study of electrocatalytic reduction of hydrogen peroxide at carbon rod electrodes decorated with silver particles. Mater. Sci. Eng. B 2021, 263, 114801. [Google Scholar] [CrossRef]
- Dang, W.; Sun, Y.; Jiao, H.; Xu, L.; Lin, M. AuNPs-NH2/Cu-MOF modified glassy carbon electrode as enzyme-free electrochemical sensor detecting H2O2. J. Electroanal. Chem. 2020, 856, 113592. [Google Scholar] [CrossRef]
- Sheng, Q.; Shen, Y.; Zhang, J.; Zheng, J. Ni doped Ag@C core–shell nanomaterials and their application in electrochemical H2O2 sensing. Anal. Methods 2017, 9, 163–169. [Google Scholar]
- Kumar, V.; Gupta, R.K.; Gundampati, R.K.; Singh, D.K.; Mohan, S.; Hasan, S.H.; Malviya, M. Enhanced electron transfer mediated detection of hydrogen peroxide using a silver nanoparticle-reduced graphene oxide-polyanlilne fabricated electrochemical sensor. RCS Adv. 2018, 8, 619–631. [Google Scholar]
- Ngamaroonchote, A.; Sanguansap, Y.; Wutikhun, T.; Karn-Orachai, K. Highly branched gold–copper nanostructures for non-enzymatic specific detection of glucose and hydrogen peroxide. Microchim. Acta 2020, 187, 559. [Google Scholar] [CrossRef] [PubMed]


Disclaimer/Publisher’s Note: The statements, opinions and data contained in all publications are solely those of the individual author(s) and contributor(s) and not of MDPI and/or the editor(s). MDPI and/or the editor(s) disclaim responsibility for any injury to people or property resulting from any ideas, methods, instructions or products referred to in the content. |
© 2022 by the authors. Licensee MDPI, Basel, Switzerland. This article is an open access article distributed under the terms and conditions of the Creative Commons Attribution (CC BY) license (https://creativecommons.org/licenses/by/4.0/).