Article

Depth-Resolved Phase Analysis of Expanded Austenite Formed in Austenitic Stainless Steel

Leibniz Institute of Surface Engineering (IOM), D-04318 Leipzig, Germany
*
Author to whom correspondence should be addressed.
Coatings 2020, 10(12), 1250; https://doi.org/10.3390/coatings10121250
Submission received: 30 November 2020 / Revised: 15 December 2020 / Accepted: 16 December 2020 / Published: 18 December 2020
(This article belongs to the Special Issue Design, Characterization and Applications of Functional Coatings)

Abstract

:
Expanded austenite γN formed after nitrogen insertion into austenitic stainless steel and CoCr alloys is known as a hard and very wear resistant phase. Nevertheless, no single composition and lattice expansion can describe this phase with nitrogen in solid solution. Using in situ X-ray diffraction (XRD) during ion beam sputtering of expanded austenite allows a detailed depth-dependent phase analysis, correlated with the nitrogen depth profiles obtained by time-of-flight secondary ion mass spectrometry (ToF-SIMS) or glow discharge optical emission spectroscopy (GDOES). Additionally, in-plane XRD measurements at selected depths were performed for strain analysis. Surprisingly, an anomalous peak splitting for the (200) expanded peak was observed for some samples during nitriding and sputter etching, indicating a layered structure only for {200} oriented grains. The strain analysis as a function of depth and orientation of scattering vector (parallel/perpendicular to the surface) is inconclusive.

1. Introduction

Stainless steels, characterized by a self-healing Cr-rich oxide film on the surface [1], have been employed in a variety of applications. Adding Ni (and Mn or N) stabilizes the high temperature face centered cubic (fcc) phase down to cryogenic temperatures. While exhibiting excellent corrosion resistance, ease of formability and weldability, they have low hardness and poor tribological properties [2]. Attempts to nitride this class of materials for increased hardness started in the 1970s with the availability of plasma treatments to remove the native surface oxide and to provide active species at temperatures below 500 °C [3,4,5,6]. This temperature limitation is caused by the thermally activated formation of CrN precipitates which trap Cr atoms and prevent the repassivation of the surface by Cr2O3 [7].
The resulting phase obtained upon nitriding is commonly called expanded austenite, characterized by a variable but high N content between 20 and 40 at.% and an anisotropic lattice expansion with each group of planes exhibiting a different expansion [8,9]. According to X-ray diffractometry (XRD), the d-spacing for (200) planes is always the largest with the d-spacing for (111) being generally the smallest [10]. Of course, this should lead to a change of the lattice symmetry away from fcc. However, even using high-order diffractometry data obtained with synchrotron radiation does not lead to an unequivocal identification of the lattice structure [11].
One part of the problem is the investigation of thin films formed on bulk substrates where additional biaxial stress could be present and measurements only in Bragg–Brentano geometry will solely probe the lattice spacing perpendicular to the surface. Starting from the known anisotropy of the elastic modulus of austenitic stainless steel, different orientation-dependent strains could be realized [10,12]. Yet, compositional gradients arising from the gradual change in the N concentration are not included in this model.
Alternative models attempting to explain the anomalous lattice expansion include stacking faults [13,14] or stress gradients [15]. Even the amplitude of the residual stress is controversial. In situ stress measurements during nitriding point toward a maximum stress level of around 1.5 GPa [16] with a yield strength of expanded austenite similar to that of austenitic stainless steel. However, reports of compressive stresses up to −7.5 GPa are available [17], arguing that solid solution strengthening by the inserted N can increase the yield strength within expanded austenite while the stress within the substrate is much smaller.
Nevertheless, XRD measurements at varying angles will always incur a variation of the information depth when changing the orientation of the scattering vector or the effective path of the X-rays. At the same time, plastic flow within the expanded austenitic steel introduces dislocations and changes the scattering intensity as a function of the polar angle [12]. In an extreme case, glancing angle measurements can falsely report the steel substrate above the expanded austenite layer [18]. This artefact is caused by the strong texture as the scattering amplitude decreases by 2–3 orders of magnitude upon reduction in the incidence angle. In summary, expanded austenite is a quite challenging system for XRD analysis. Thus, here an advanced experimental setup is employed for gaining further information on this system not accessible by existing conventional measurements.
Combining a conventional laboratory XRD setup including a high vacuum XRD chamber with a broad-beam low energy ion implantation experiment provides a powerful tool for fundamental investigations of functional surfaces [19]. Here, in situ XRD during Ar+ ion beam etching of expanded austenite allows depth-resolved information (for a sample in a steady state) with a depth resolution much smaller than the information depth, which is of the order of the attenuation length (~2.5 µm for austenitic stainless steel with and without additional N [20]). Additionally, time-resolved (and depth integrated) information during nitriding can be obtained and compared with the depth-resolved data. Furthermore, stopping the etching process at a defined depth permits a detailed investigation with ex situ XRD methods.
Though the formation of expanded austenite using N insertion into austenitic stainless steels appears to be well investigated, there are still surprises to be encountered. While [21] focuses on in situ investigations during phase formation, there are hints in Figure 1 of that manuscript about an anomalous behavior of the (200) γN reflection during the nitriding process. The present manuscript tries to elucidate this phenomenon: is it a temporal effect or related with a layered structure? Additionally, the question regarding what kind of information can be extracted from a combination of in-plane and out-of-plane XRD measurements will be addressed.

2. Materials and Methods

As material, the austenitic stainless steel AISI 316Ti (corresponding to X6CrNiMoTi17.12.2, DIN 1.4571) was used with discs cut from a rod (diameter 20 mm). Grinding was performed until all residual martensite has been removed with gentle polishing applied to avoid the reappearance of this phase. When establishing this procedure, all intermediate steps were checked by XRD measurements, consequently any ferritic or martensitic inclusions were below the detection limit.
A comprehensive summary of the experimental set-up can be found in [19] with a short description provided here: the system consists of two separate vacuum chambers for independent control of the vacuum conditions. The sample chamber, where the heatable sample holder is positioned, is attached to an X-ray diffractometer in Bragg–Brentano geometry. In the second chamber, the broad-beam low energy ion source is placed. Both chambers are connected via a gate valve.
The complete system consists of four components (i) a broad-beam ion source with a high long-term stability with homogeneous ion current distribution within the ion beam; (ii) a fast sample temperature control system able to compensate the thermal load changes induced by switching the ion beam on and off; (iii) an experimental design mitigating the deposition of the sputtered material on the windows through which the X-rays enter and exit the vacuum chamber; (iv) a fast 1D detector allowing spectra to be taken every 116 s. Just by varying the ion species, different “operation modes” can be employed with either etching by sputtering or phase formation by implantation and diffusion as the dominating process.
For nitriding by nitrogen low energy ion implantation, a mass flow of 5.5 sccm through the ion beam source resulted in a working pressure of 1.5 × 10⁻² Pa. At an ion energy of 0.8 keV, an ion current density of up to 130 µA/cm2 can be realized. Of course, corrections for charge exchange collisions and the molecule to atomic ion ratio have to be included for converting the current density into a particle flux density [21]. Before starting the ion implantation, the samples were heated to the desired temperature. Upon starting the ion bombardment, the heating power was reduced to maintain the temperature. While sputtering will also be present, leading to the removal of about 1 µm/hour under these conditions, the diffusion process of nitrogen inside austenitic steel is the dominating process with a typical total layer thickness of 5–7 µm after 1 h at 400 °C and even after [22].
For Ar+ ion etching, argon gas was introduced into the ion source, operated at 0.95 keV with different ion current densities to adjust the sputter rate between fast sputtering with low depth resolution and slow sputtering with high depth resolution. Using an electronic beam switch [23] allows a controlled variation of the current density while maintaining the plasma discharge in the ion beam source and hence the profile shape of the resulting ion beam. The samples were heated to 180 °C before starting the sputtering and maintained at this temperature. This temperature is slightly above the equilibrium temperature using the Ar+ ion beam for irradiating the samples, thus thermally induced peak shifts [24] during the experiment were avoided or reduced in amplitude while no additional phase transformations were induced at this temperature. Of course, the increase in temperature from room temperature will induce a small but known lattice expansion.
In addition to low energy ion implantation, plasma immersion ion implantation was used to produce a set of identically nitrided samples [25]: the chosen parameters were 90 min. at 450 °C with 8 kV high voltage pulses. During the first 18 min, a pulse repetition rate of 5 kHz was used. After reaching the temperature a lower frequency of 1.65 was sufficient to maintain this temperature. XRD measurements confirmed that identical samples were obtained in the same batch with no variations associated with the positioning on the substrate holder.
In addition to the in situ XRD measurements with a Cu anode in Bragg–Brentano geometry in the angular range of 2θ = 35°–54°, ex situ XRD measurements were conducted at room temperature after the end of the experiments using another XRD set-up with a cross-beam optics set for parallel beam geometry and with additional in-plane measurement functionality (Rigaku Ultima IV, Tokyo, Japan). In-plane measurements (sensitive for grains with lattice planes oriented perpendicular to the sample surface) were performed with 1.35° or 1.8° incident angles using a 2.5° parallel slit collimator and a 2.5° in-plane parallel slit analyzer.
The nitrogen depth profiles and the thickness of the nitrogen-containing layer at the end of the nitriding experiments were obtained using two different methods—glow discharge optical emission spectroscopy (GDOES) and time-of-flight secondary ion mass spectrometry. The GDOES measurements followed the ISO standard 16962:2005-10 with a crater size of 2.5 mm and a typical step size in the depth profiles of about 1.5 nm. SIMS analysis of the samples was performed with 15 keV 69Ga+ ions for the analysis and 2 keV O2+ ions for sputter profiling. The respective scan areas were 100 × 100 μm2 and 300 × 300 μm2 to avoid crater edge effects. The ion beam current for analysis was about 2 pA with the ion beam current for sputtering around 700 nA, resulting in a surface removal rate of about 0.7–0.9 nm/s for the selected beam size. By measuring the respective crater depth, the thickness of the nitrided layers was determined assuming a constant sputter rate within the implanted layer with no degradation of the profile edges due to sputter roughening within the crater [26].

3. Results

Figure 1 presents a contour plot of spectra obtained using in situ XRD during low energy ion nitriding of austenitic stainless steel 1.4571 at 450 °C. After switching on the ion beam, the peaks originating from the expanded austenite phase appeared quite fast due to the high ion current density [21]. At the same time, the intensity of the substrate XRD reflections decreased as the layer grew. While the (111) γN reflection shows a gradual shift toward lower diffraction angles (increasing lattice expansion), accompanied by a small reduction in width and a saturation of the intensity after ~30 min. (i.e., layer thickness larger than information depth of ~2.5 µm), the (200) γN reflection exhibits a much more complex behavior.
Here, an initial lattice expansion exhibiting a maximum intensity at an angle of 2θ ≈ 47.5° is present at 20–30 min, followed by a decrease in the intensity of this reflection and the appearance of another reflection around 2θ ≈ 46°, corresponding to an even larger lattice expansion after 50 min. The latter reflection continues to grow in intensity with time, albeit at lower values than for the (111) reflection and saturating after more than 2 h. Additionally, “shadows” of the most intense reflections are visible between 2θ values of 36° and 38°, caused by the W component in the incident X-ray beam.
In the first section of this manuscript, this peculiar behavior is investigated in more detail to find out whether there are limitations in the processing conditions or alloy composition where this effect is observed. Additionally, combining time-resolved XRD measurements during nitriding with depth-resolved XRD measurements during ion beam etching allowed us to distinguish between a temporal phase transition and a layered structure where underlying layers were covered by a different phase growing on the surface.

3.1. Peculiarities of (200) Reflection for the Expanded Phase

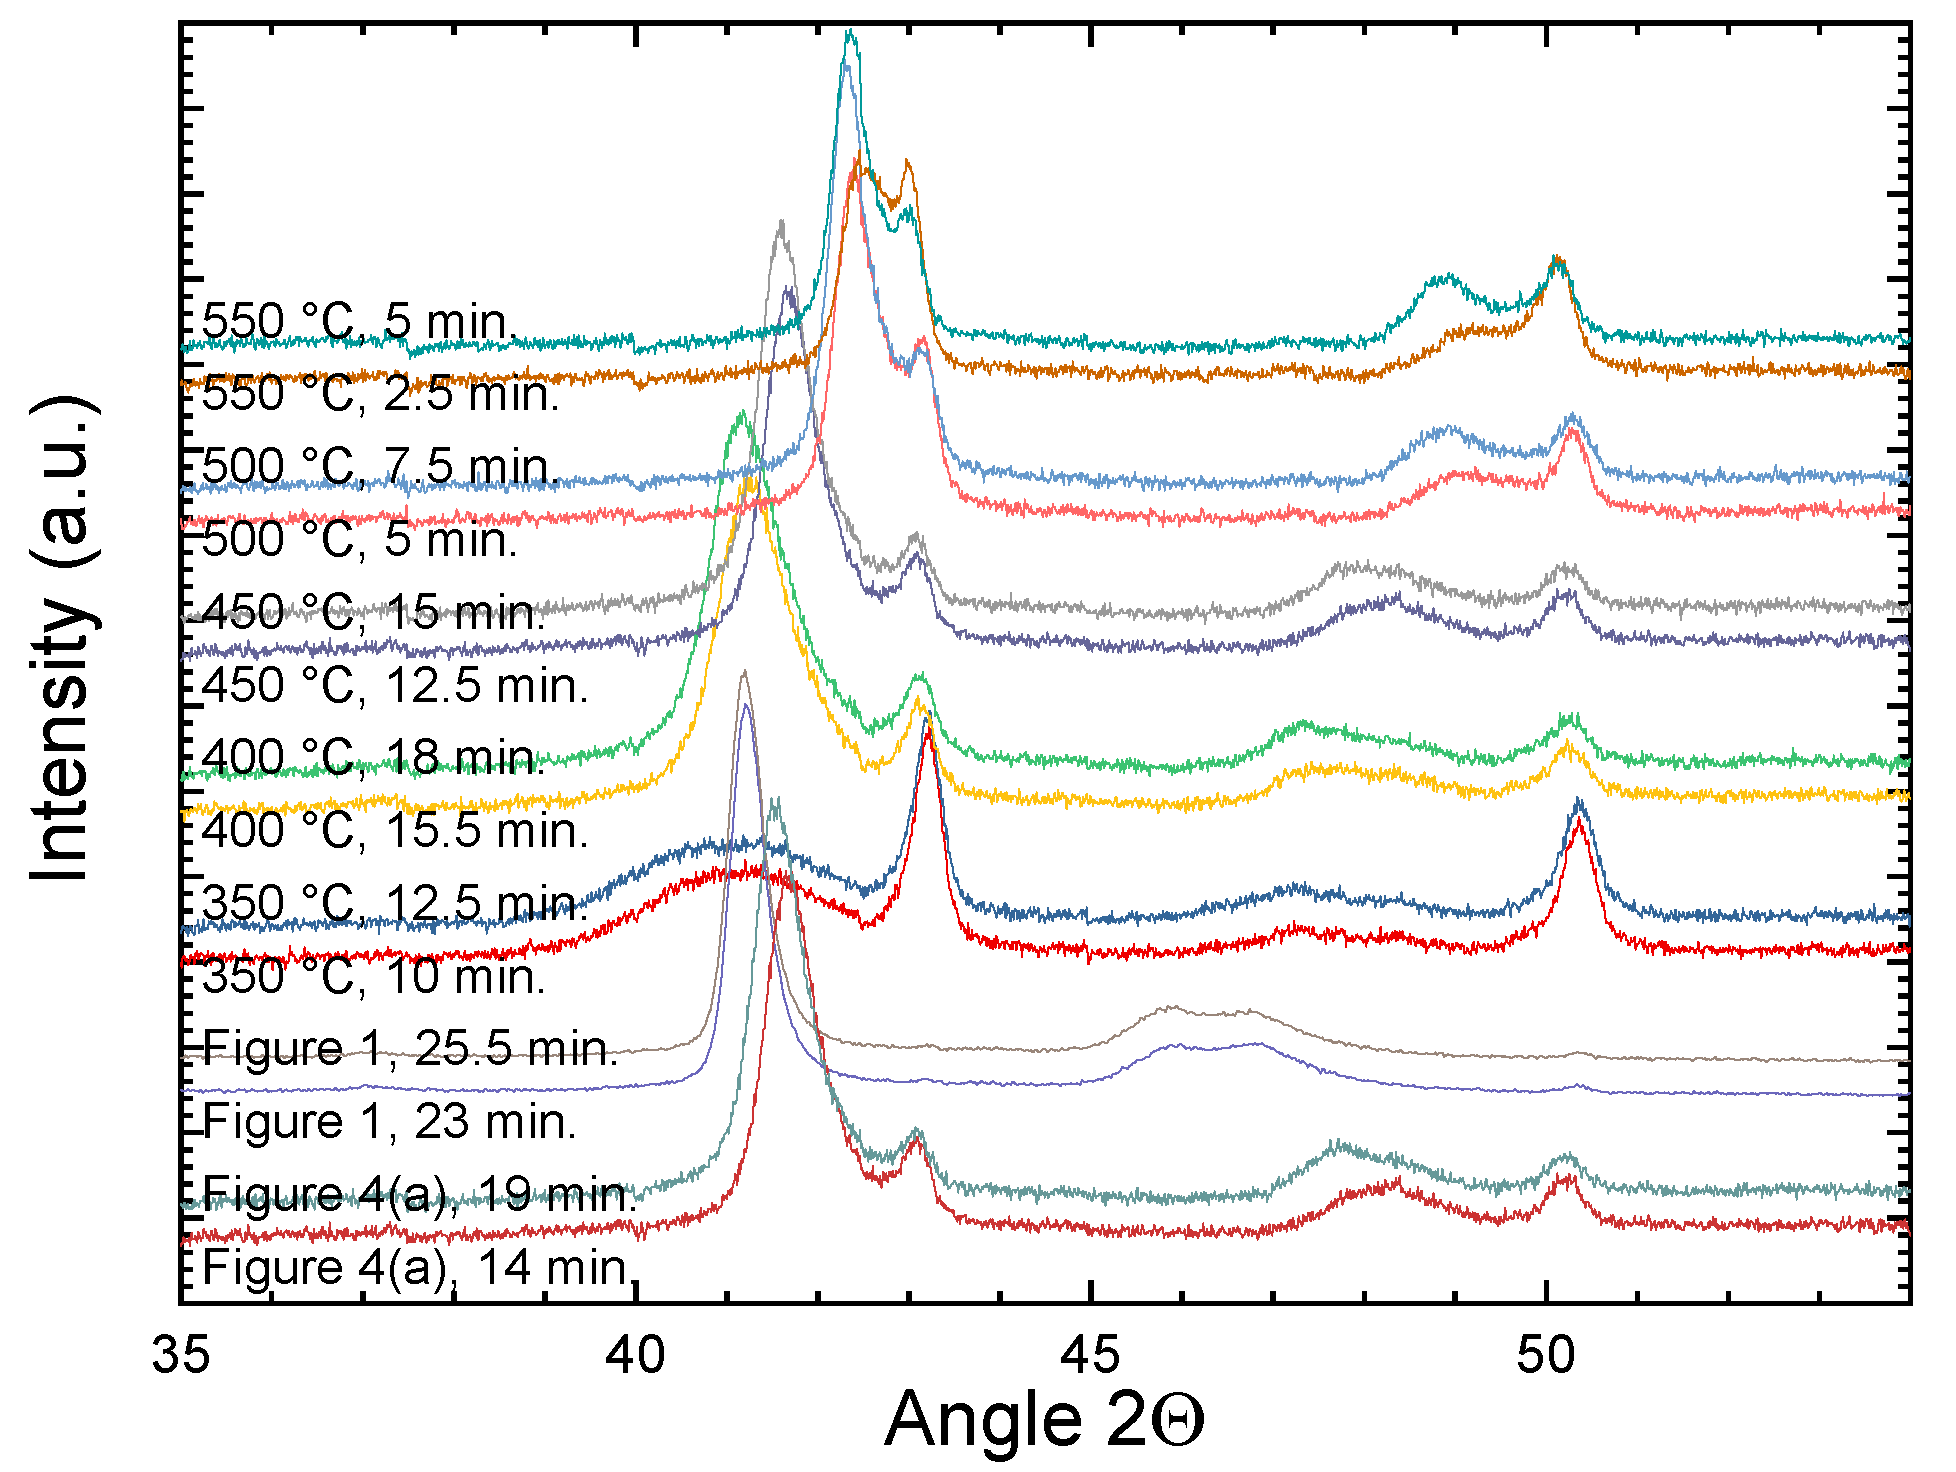
Figure 2 presents selected spectra measured during nitriding showing this transition described above for different temperatures between 350 and 550 °C for the alloy 1.4571. In general, higher temperatures (and higher ion current densities) lead to a faster growth of the expanded phase and a smaller lattice expansion. For all temperatures, the data for alloy 1.4571 show a distinct transition within the (200) γN peak where, apparently, two separate phases with different lattice expansions are concurrently present at the indicated process times during nitriding. The dependence of the peak width itself on processing temperature and nitrogen supply is known but not completely understood [21,27,28].
Using samples cut from rods of the alloy 1.4301, this effect is much less pronounced and near the noise level as the texture of the samples is different: there are much more {111} oriented grains than {200} oriented grains [29]. Thus, ascertaining this effect is quite difficult. It has to be mentioned that there are some samples where this effect has not been observed during nitriding experiments employing in situ XRD. Currently, no clear prediction is possible; however, high current densities and or high ion energy favor the appearance of this intermediate phase.
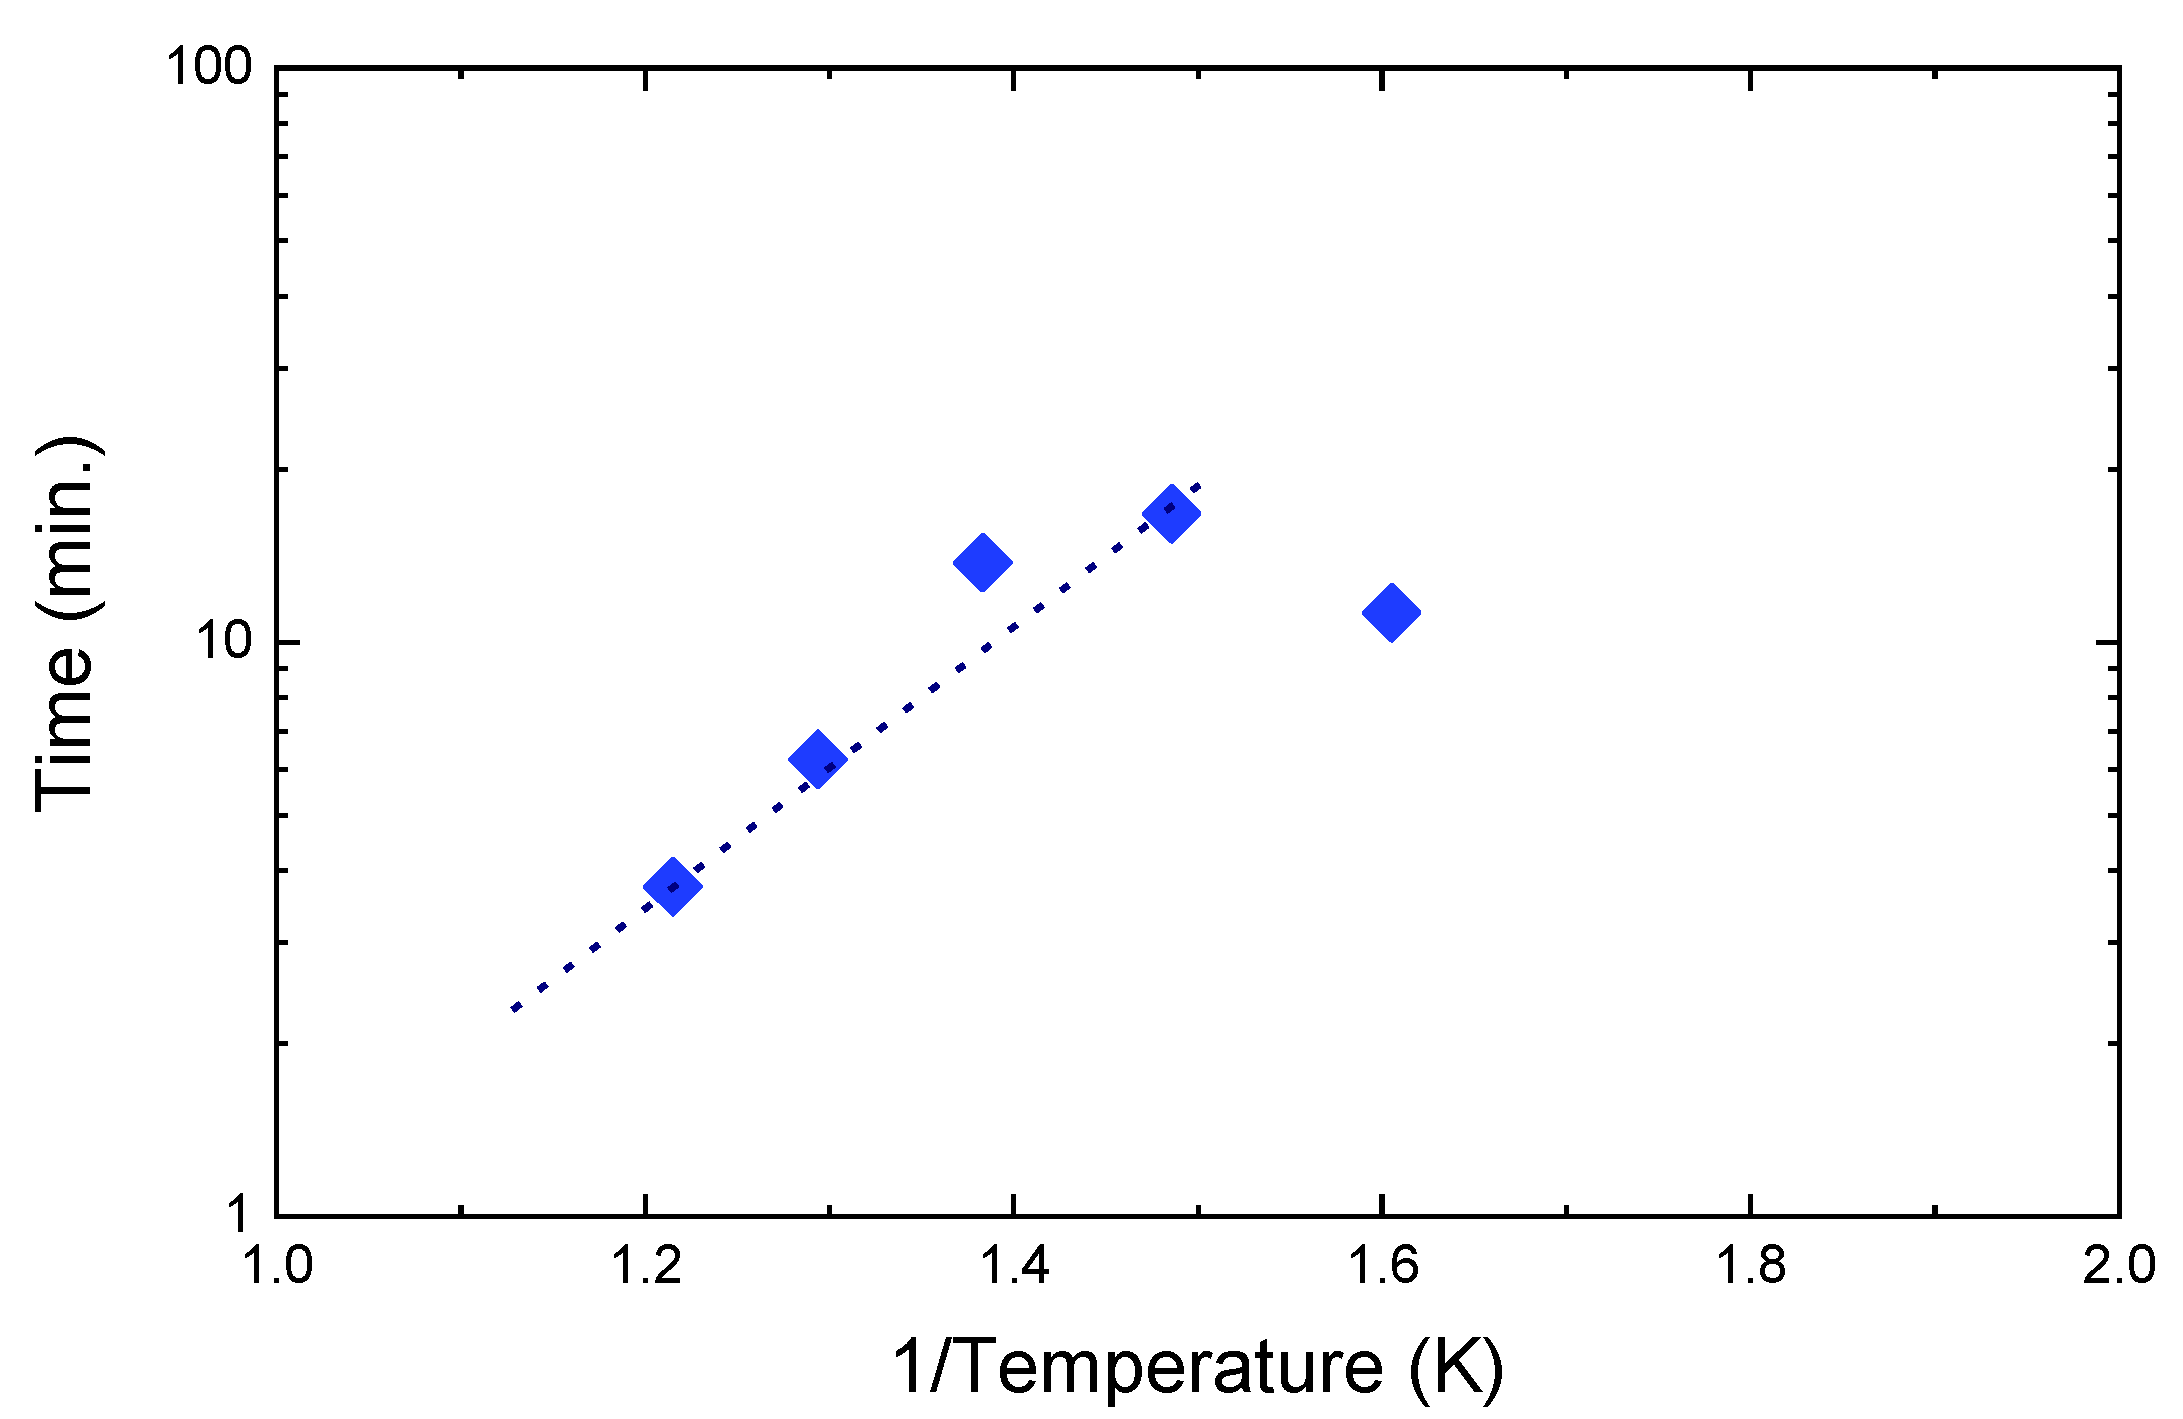
When plotting the exact time during nitriding where this transition between the two expanded phases is occurring vs. the reciprocal nitriding temperature (cf. Figure 3), a very weak thermally activated effect was observed. Additionally, for the lowest temperature of 350 °C, a faster transition was recorded than for 400 °C. As the growth of the expanded layer into the bulk is similarly thermally activated, yet with an activation energy of around 0.8–1.0 eV [30], this figure seems to indicate that a phase transition of the expanded phase at the beginning of the expanded austenite formation alone cannot explain this effect. It has to be pointed out that the transient appearance of this lower lattice expansion is visible only for a very short time (around 20 min or less); thus, this effect will not be observed when using processing times of several hours and only ex situ XRD.
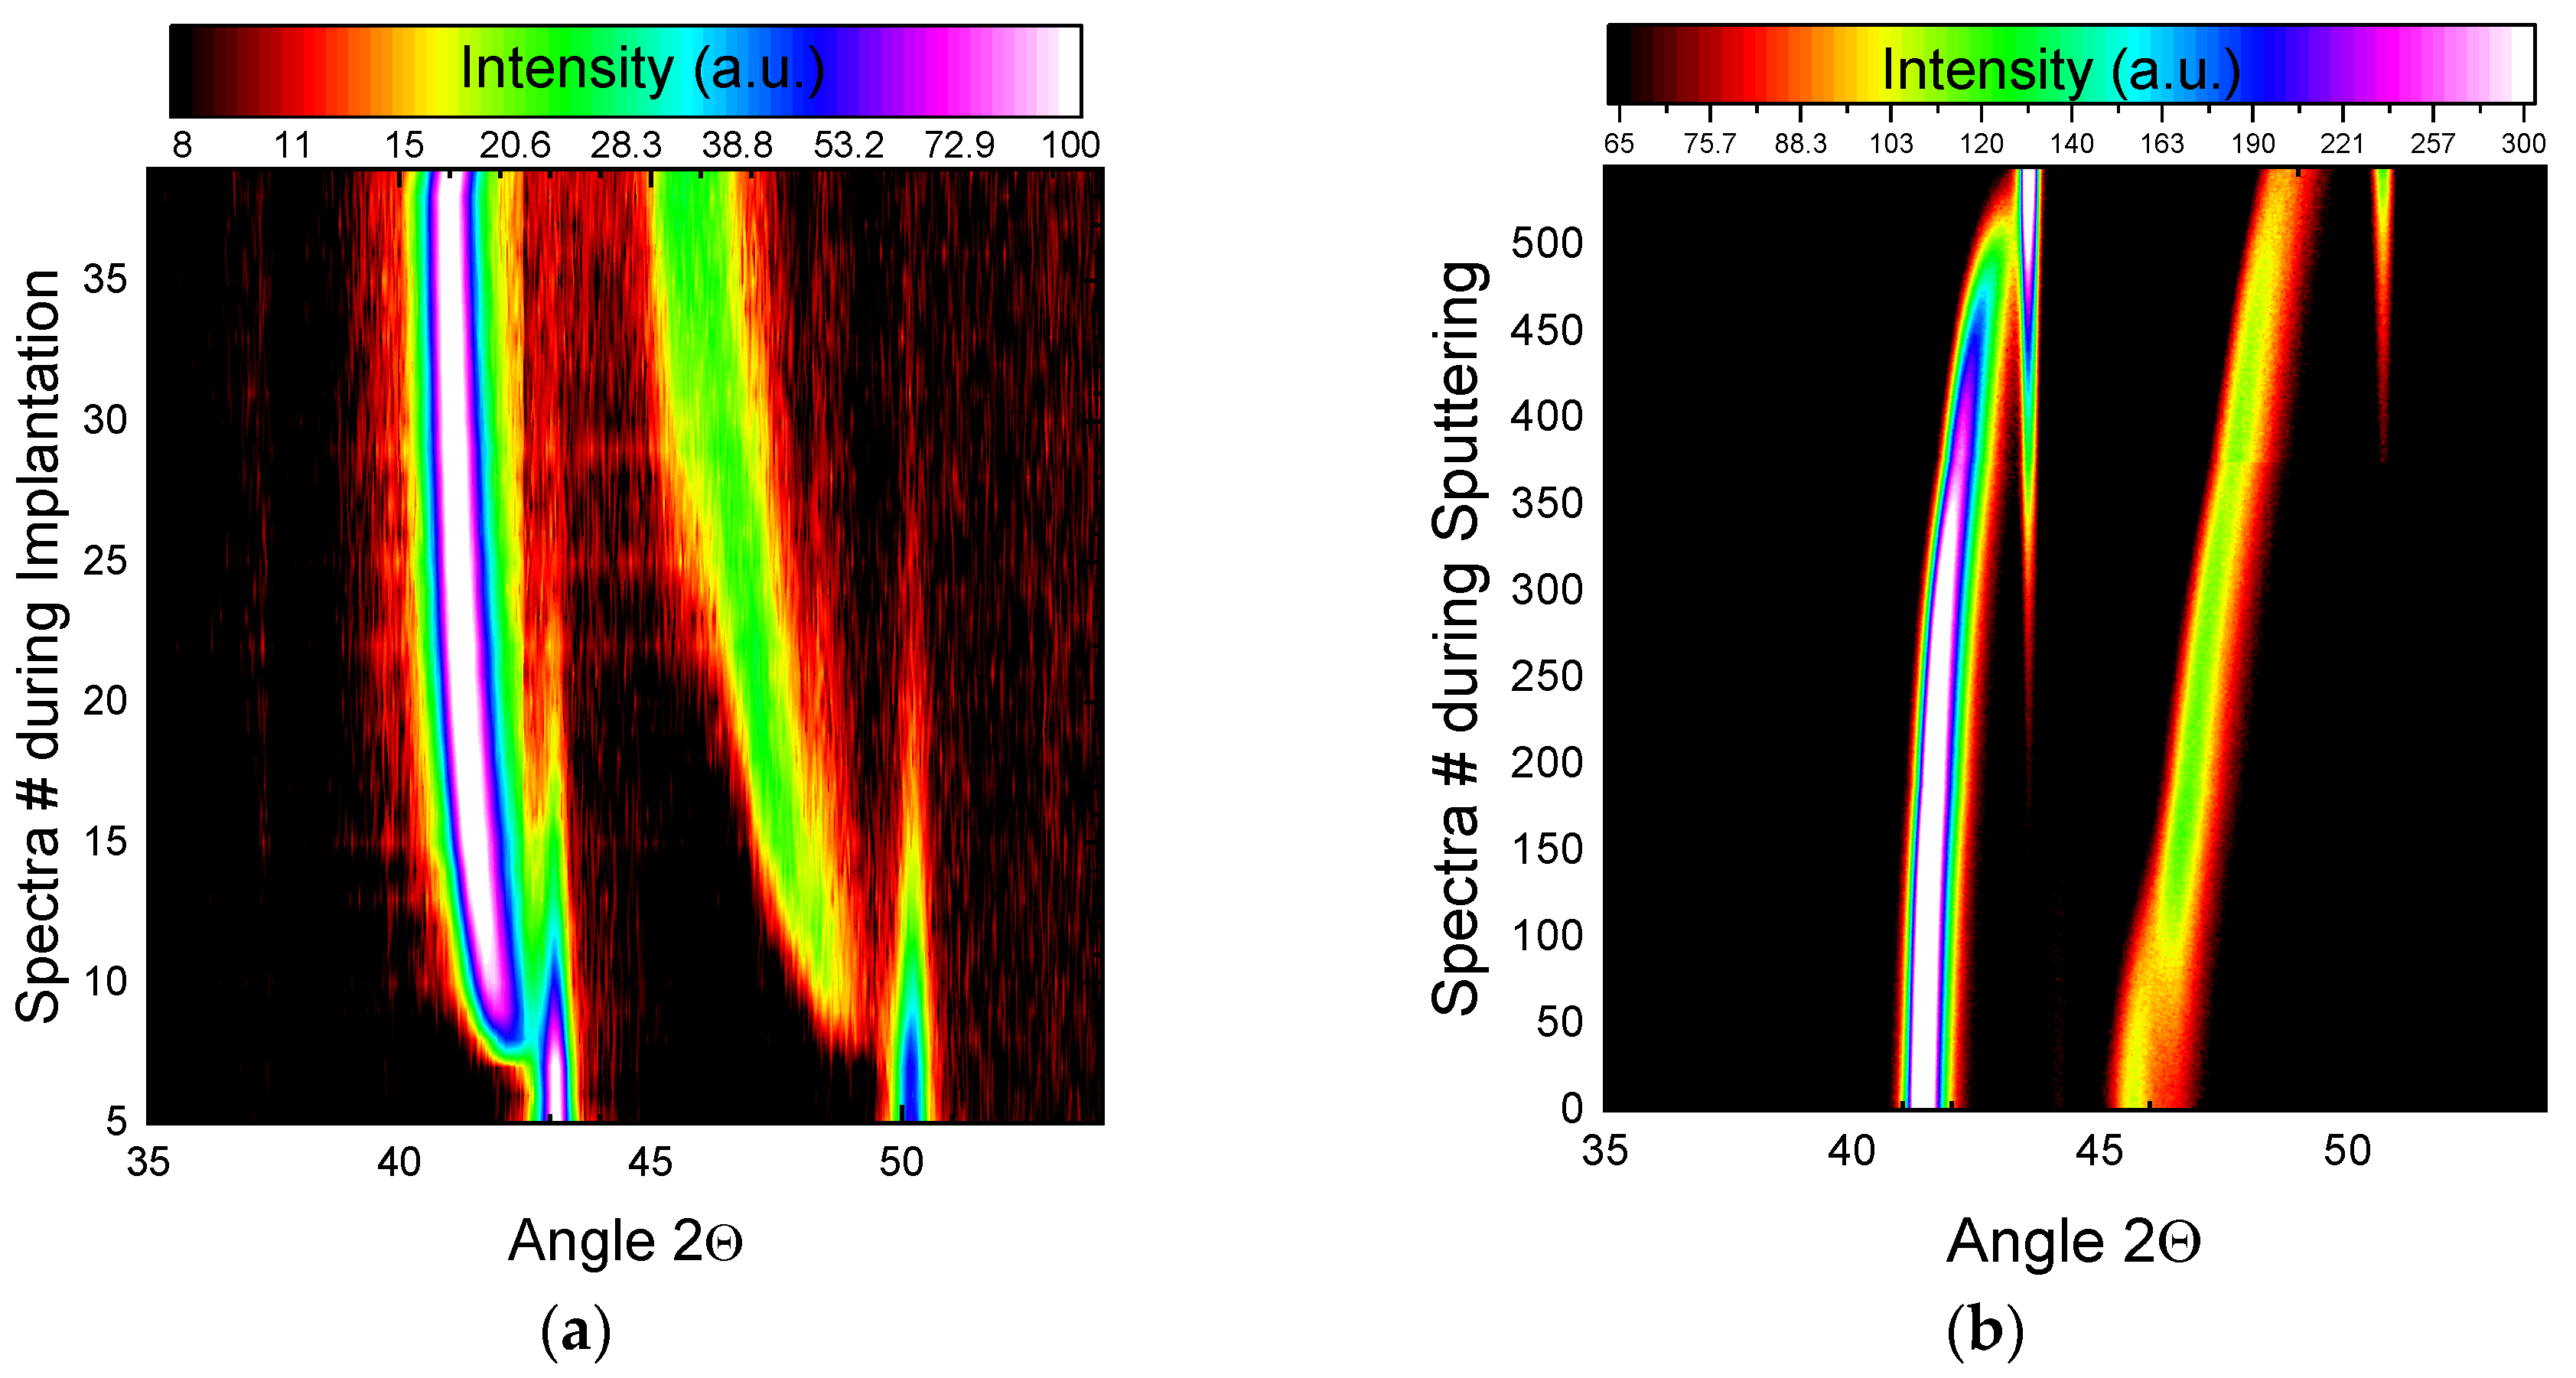
Figure 4 presents a comparison of the in situ XRD measurements during nitriding in panel (a) and Ar+ ion beam etching in panel (b). This sample of steel 1.4571 was implanted at 450 °C with a current density of 130 µA/cm2 using 0.8 kV acceleration voltage. For the sputter etching, 0.95 keV Ar+ ions at a reduced current density were employed for a low sputter rate of about 0.05 nm/s while the sample temperature was held constant at 180 °C.
In panel (a), the peculiarity for the (200) γN peak can be clearly observed during nitriding with the initially present peak at a lower lattice expansion showing a maximum at around 11 min before the second peak with a larger expansion starts to growth in intensity. At later stages, the initial peak disappears while the second peak remains. The data taken during the ion etching process—shown in panel (b)—follow the same behavior in reverse, with the peak presenting a larger lattice expansion only found near the surface. It is completely replaced by the peak with a lower expansion after less than 30 min. As the sputter yield depends strongly on the grain orientation, a homogeneously thick layer is sputtered faster for {111} oriented grains than for {200} oriented grains [19]. However, this effect is not correlated with the observed changes in the lattice expansion and should thus not distract the reader.
The peculiarities found in XRD do correspond to a layered structure for the {200} oriented grains only. As the same behavior was observed for nitriding and sputter etching, this effect does not represent a phase transformation. For the {111} oriented grains, no such effect was observed even after prolonged inspection of the measured data. For grains with any other orientation, no such effect was detectable due to the restricted geometry of the in situ XRD setup. While the sputter etching allows a depth-dependent measurement, the information depth is still given by the attenuation length of the X-ray (for stainless steel and Cu Kα radiation about 2.5 µm [20]). With an estimated thickness of the surface layer of around 700–800 nm, the reflected intensity from the underlying layer with a reduced lattice expansion is so small so that no clear unequivocal signal is present in conventional (ex situ) measurements. For glancing angle measurements, the sublayer will be even less visible.
By using differential spectra, a much higher depth resolution of less than 100 nm is possible [19]. Yet, the exponential decay of the intensity with increasing depth still ascertains that most of the information originates from the near surface region. Nevertheless, a much smaller depth resolution (compared to the penetration depth) is only obtained for the case of a layer disappearing during sputtering: the more abruptly the intensity vanishes, the smaller the interface width. This width is a clear indicator of the interface roughness, either from the layered structure itself or from an artificial broadening of the interface during sputtering by the impinging ions [31]. In contrast, a gradual increase in the intensity will be always observed when deeper layers become visible as the overlayer is removed, thus yielding an artificially large transition zone. When interpreting depth-resolved information, this inherent asymmetry in the depth resolution has to be kept in mind.
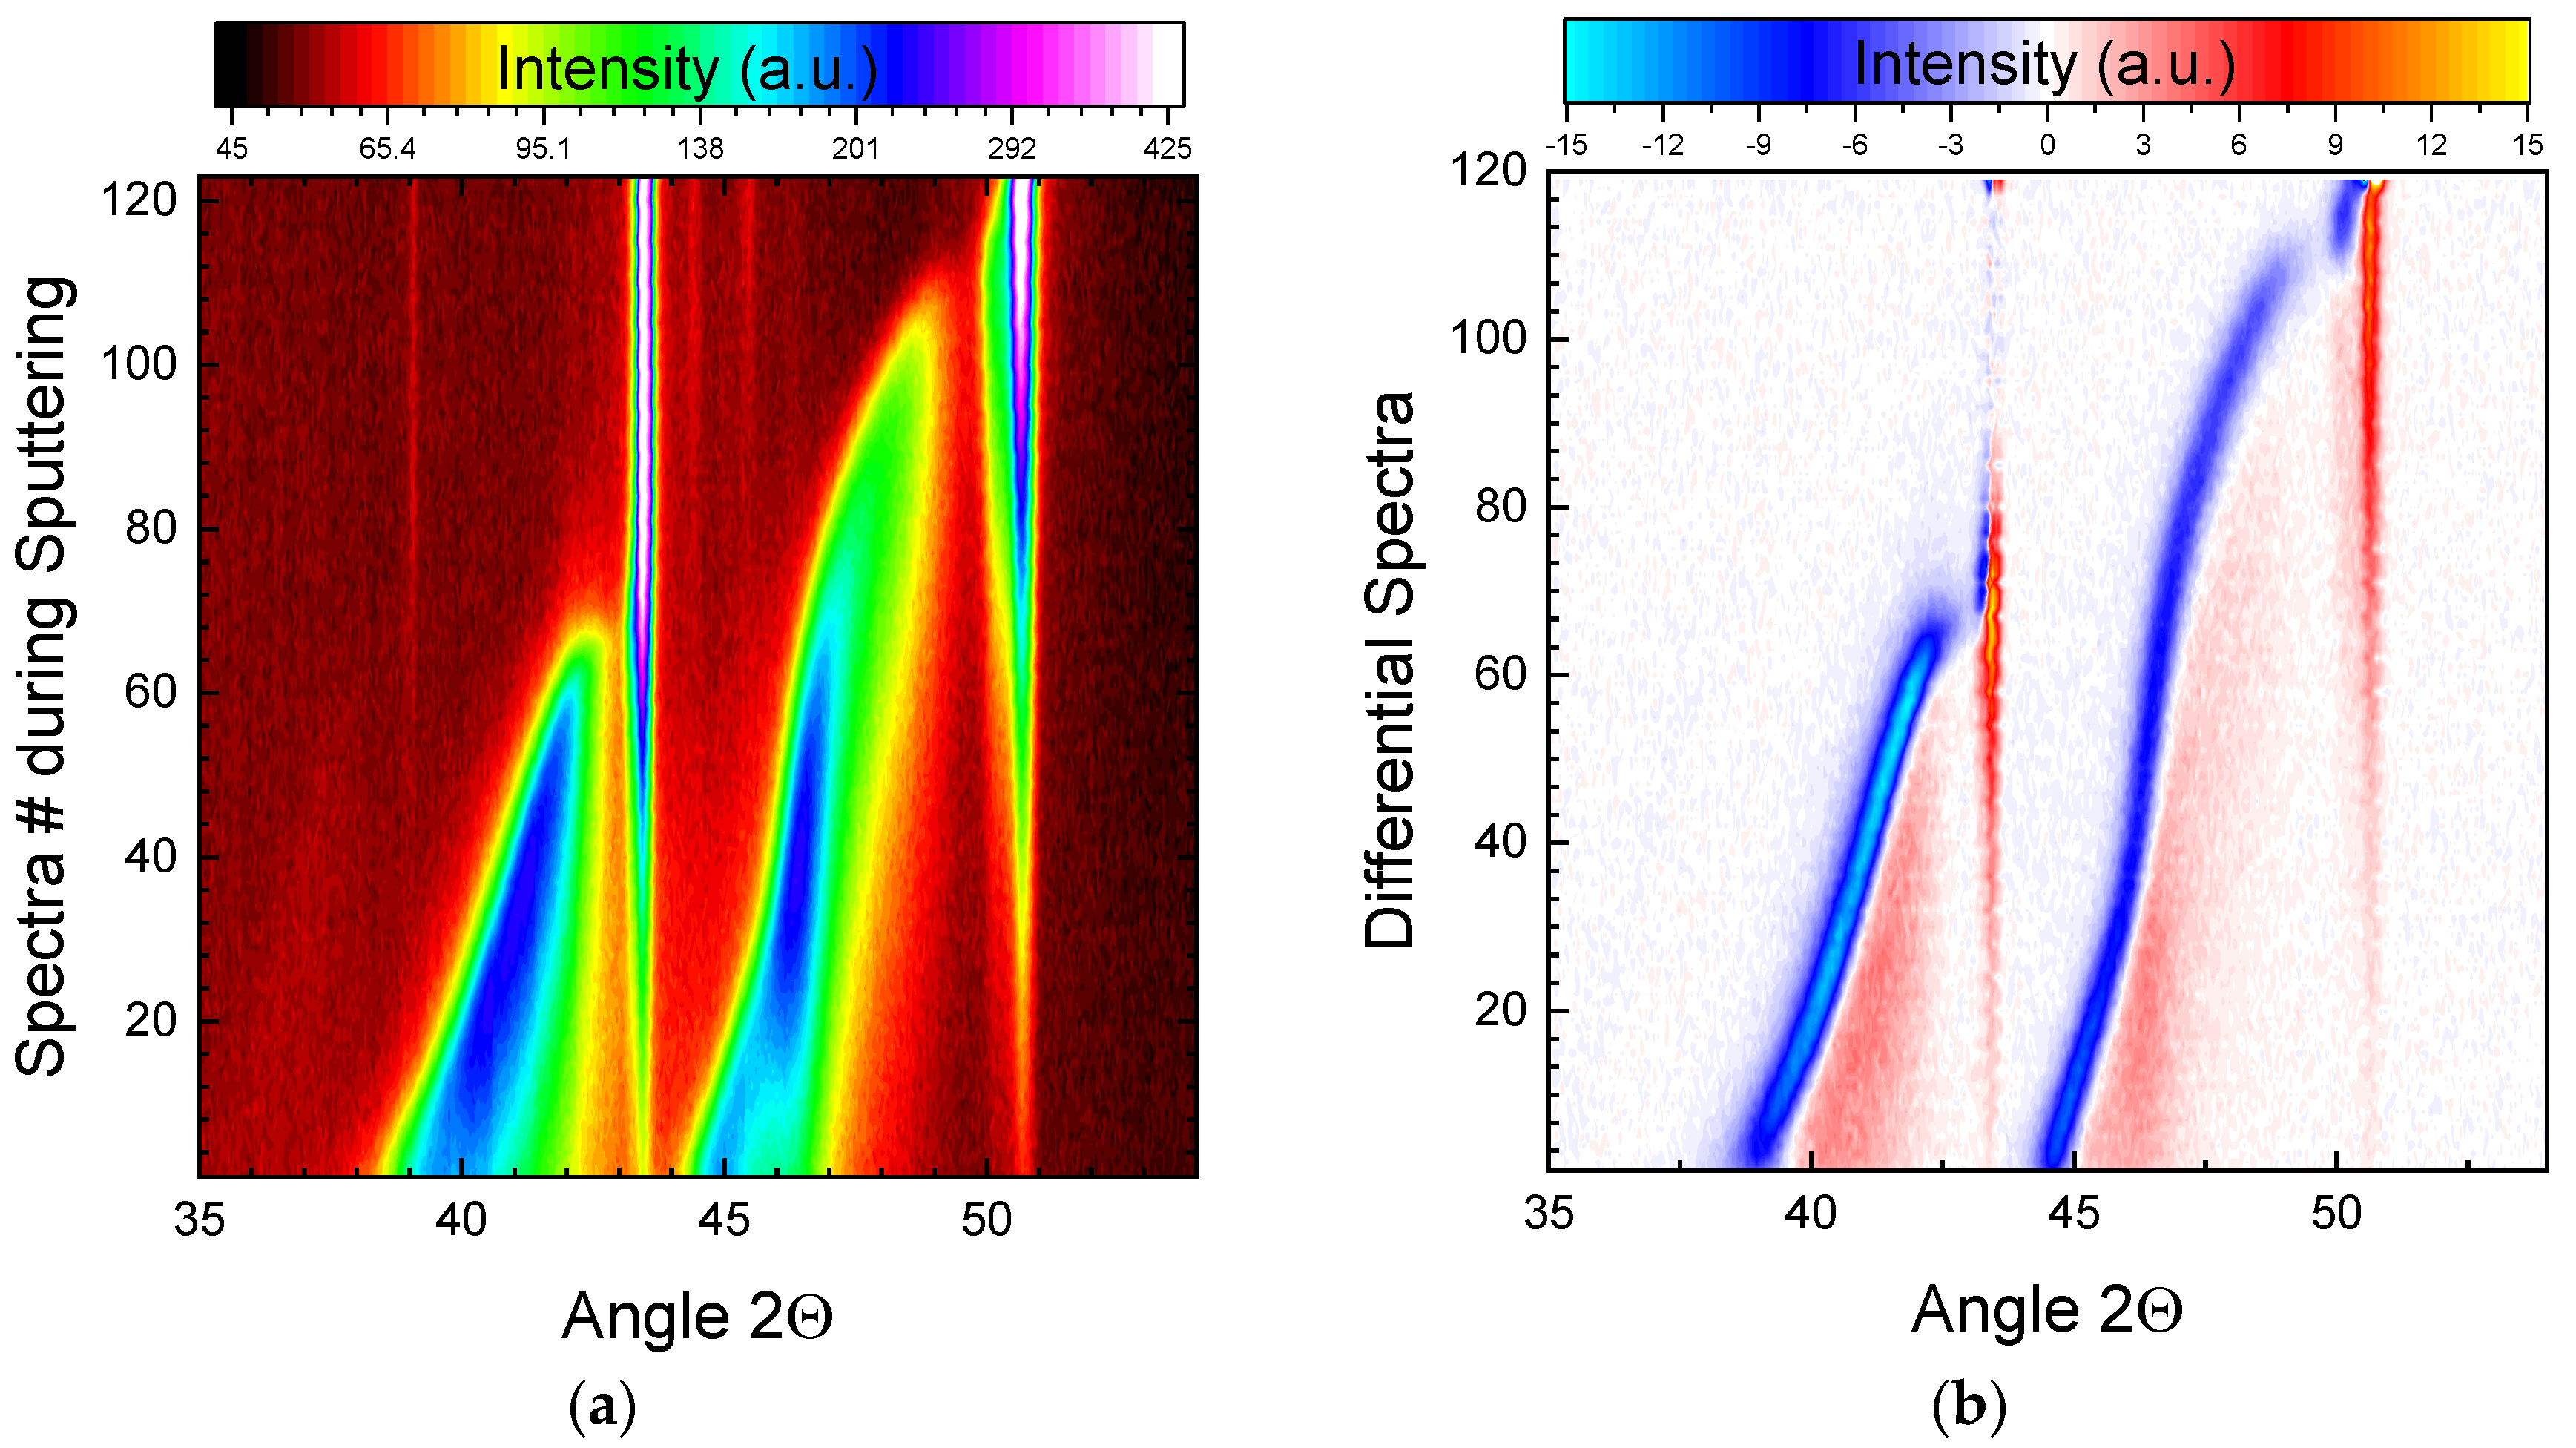
Hence, a comparison of the spectra as measured with the differential spectra provides complementary data with some features visible only in one of the data sets: as depicted in Figure 5, panel (a) clearly shows the transition between the two expanded phases for the {200} oriented grains, which is not directly apparent in the differential spectra of panel (b). At the same time, the evolution of the lattice expansion with depth is more easily followed in the latter panel. Additionally, slight oscillations in the position of the substrate reflections indicate minor instabilities in the temperature control of the sample during Ar+ ion beam etching.
Starting from the surface, a gradual increase in the reflected intensity toward the right of the peak maximum for both (111) and (200) reflections for the expanded phase is observed in panel 5(b), together with a faster decrease in the intensity toward the left of the maximum: the maximum itself —where the intensity is constant—shifts toward larger angles with an increasing sputter depth, indicating a continuous reduction in the lattice expansion. The intensity of the two substrate reflections increases throughout the experiment, leading to very narrow and intense peaks. For the (111) oriented grains, the intensity saturates around spectrum 65 (corresponding to a time of 125 min) while no such effect is observed for the (200) oriented grains until the end of the experiments. The clear distinction in the time evolution between the two phases is caused by the different sputter yields of these two classes of grains. Most important, no sudden peak shifts were observed. Thus, relaxation of elastic strain due to the removal of an overlayer during the sputter etching process can be excluded.
The sample used for obtaining the data presented in Figure 5 will be used in the following section for detailed depth-resolved investigations. For comparison, the nitrogen content as a function of depth, obtained by SIMS, is plotted in Figure 6. The typical plateau-like behavior followed by a rather abrupt decrease near the end of the profile corresponds to the nitrogen depth profiles for other expanded austenite samples [28]. No additional carbon is present throughout the expanded austenite layer. However, beside a minor surface contamination, carbon was found near the interface in a comparable amount to the nitrogen content. This pushing ahead of the residual carbon by the incoming nitrogen is a well-established fact [9,10]. Replacing nitrogen by carbon, i.e., a carburizing instead of a nitriding process, leads to the identical formation of a metastable expanded austenitic lattice. Yet, the higher diffusivity of carbon using the identical interstitial sites as nitrogen will result in thicker layers with a lower carbon concentration. Combined nitrocarburizing processes (which includes in the extreme case nitriding and only residual carbon in solid solution in the base material as happens here) will result in a duplex layer structure [32]. With increasing processing time and temperature, the segregation into this two-layer structure will be more complete.
It has to be kept in mind that the orientation-dependent sputter yield, strongly visible in Figure 5, also influences the sputter depth profiling during SIMS, where an average across several differently oriented grains was obtained. Thus, an artificial broadening of the nitrogen depth profile, compared with the atomically abrupt transition observed in scanning electron microscope (SEM) cross-sections [33] is visible. However, the variation in the sputter rate as a function of grain orientation during SIMS with 2 keV oxygen ions [26] is smaller than the variation for 850 eV Ar+ ions employed for depth profiling using in situ XRD. Hence, the broadening implied in Figure 5a is larger than that for either SIMS, GDOES or nuclear reaction analysis [31].
In contrast, an influence of the grain orientation on the diffusion rate, i.e., layer thickness, has not been observed for either low energy ion nitriding or nitriding using PIII—with both methods using low pressure and high ion energies [33,34]—contrary to results from other methods including plasma (assisted) nitriding showing this orientation-dependent layer growth in the literature [10,35]. Hence, the interface between the expanded phase and the substrate was always at the same depth, independent of the grain orientation, for the current experiments.

3.2. Depth-Dependent Investigations

Before starting depth-dependent investigations using a combination of in situ and ex situ XRD measurements, the nitrogen depth profile is compared with the depth-resolved lattice expansion. Using the differential spectra from Figure 5b, the expanded phase present just at the transient surface can be identified. The angle where the intensity increase has stopped and is changing into a decrease was calculated from the zero-crossing of the curves. Thus, an identification of the lattice expansion at the surface is possible, avoiding the influence of the deeper lying layers. Figure 7a shows the resulting data with the peak position shifting initially rather slowly, followed by a rather fast or even abrupt transition near the interface. For the (111) reflections, this effect is more pronounced than for the (200) reflection. It has to be kept in mind that with increasing depth, the roughness increases and thus the depth resolution decreases, smearing out this transition. Apparently, there is no expanded phase present with lattice expansions below ~3%, in agreement with published data on the phase diagram of expanded austenite, which show a gap in this region [36].
Figure 7b compares the lattice expansion with the occupancy of the vacancies, i.e., nitrogen content, as a function of depth using the depth-dependent data from Figure 7a normalized to the layer thickness—i.e., correcting for the orientation-dependent sputter yield. While the nitrogen content decreases continuously, there is a considerable amount of variation from a purely linear behavior visible, especially when investigating the second derivative. Interestingly, this structure in the nitrogen depth profile is closely mirrored by the lattice expansion, especially for the {200} oriented grains. Hence, it may be assumed that the nitrogen content is the main determining factor for the lattice expansion as a function of depth. Thus, Vegard’s law yielding a linear relation between vacancy occupation and lattice constant should be valid as reported in the literature [37,38], albeit with different prefactors for both investigated orientations in the current experiment. Information on eventually varying nitrogen content as a function of orientation [39] is not available from the present experiments.
As summarized in Table 1, detailed ex situ investigations were performed at four different depths, encompassing all regions of interest from Figure 5a. Figure 8 presents the corresponding spectra obtained during in-plane XRD measurements at those selected depths. The ex situ measurements allow a larger measurement range for the angle 2θ than in the in situ measurements. At the same time, the broad slits necessary to maintain a finite data collection time lead to rather broad peaks in the resulting in-plane spectra. The information depth is strongly reduced in these measurements due to the geometry; thus, only information from the actual surface is present—no substrate peaks are visible.
Except for the immediate surface (at depth of spectrum #0), all five peaks associated with expanded austenite can be identified, yet the peaks at higher angles become progressively weaker. This effect can be explained by the texture of the base material. With increasing sputter time, thus increasing depth from the surface toward the interface, the peaks shift toward the right, indicating a reduced lattice expansion with depth. While this effect appears to be similar to that shown in Figure 7, more detailed investigations are necessary to identify strain or lattice expansion perpendicular and parallel to the surface.
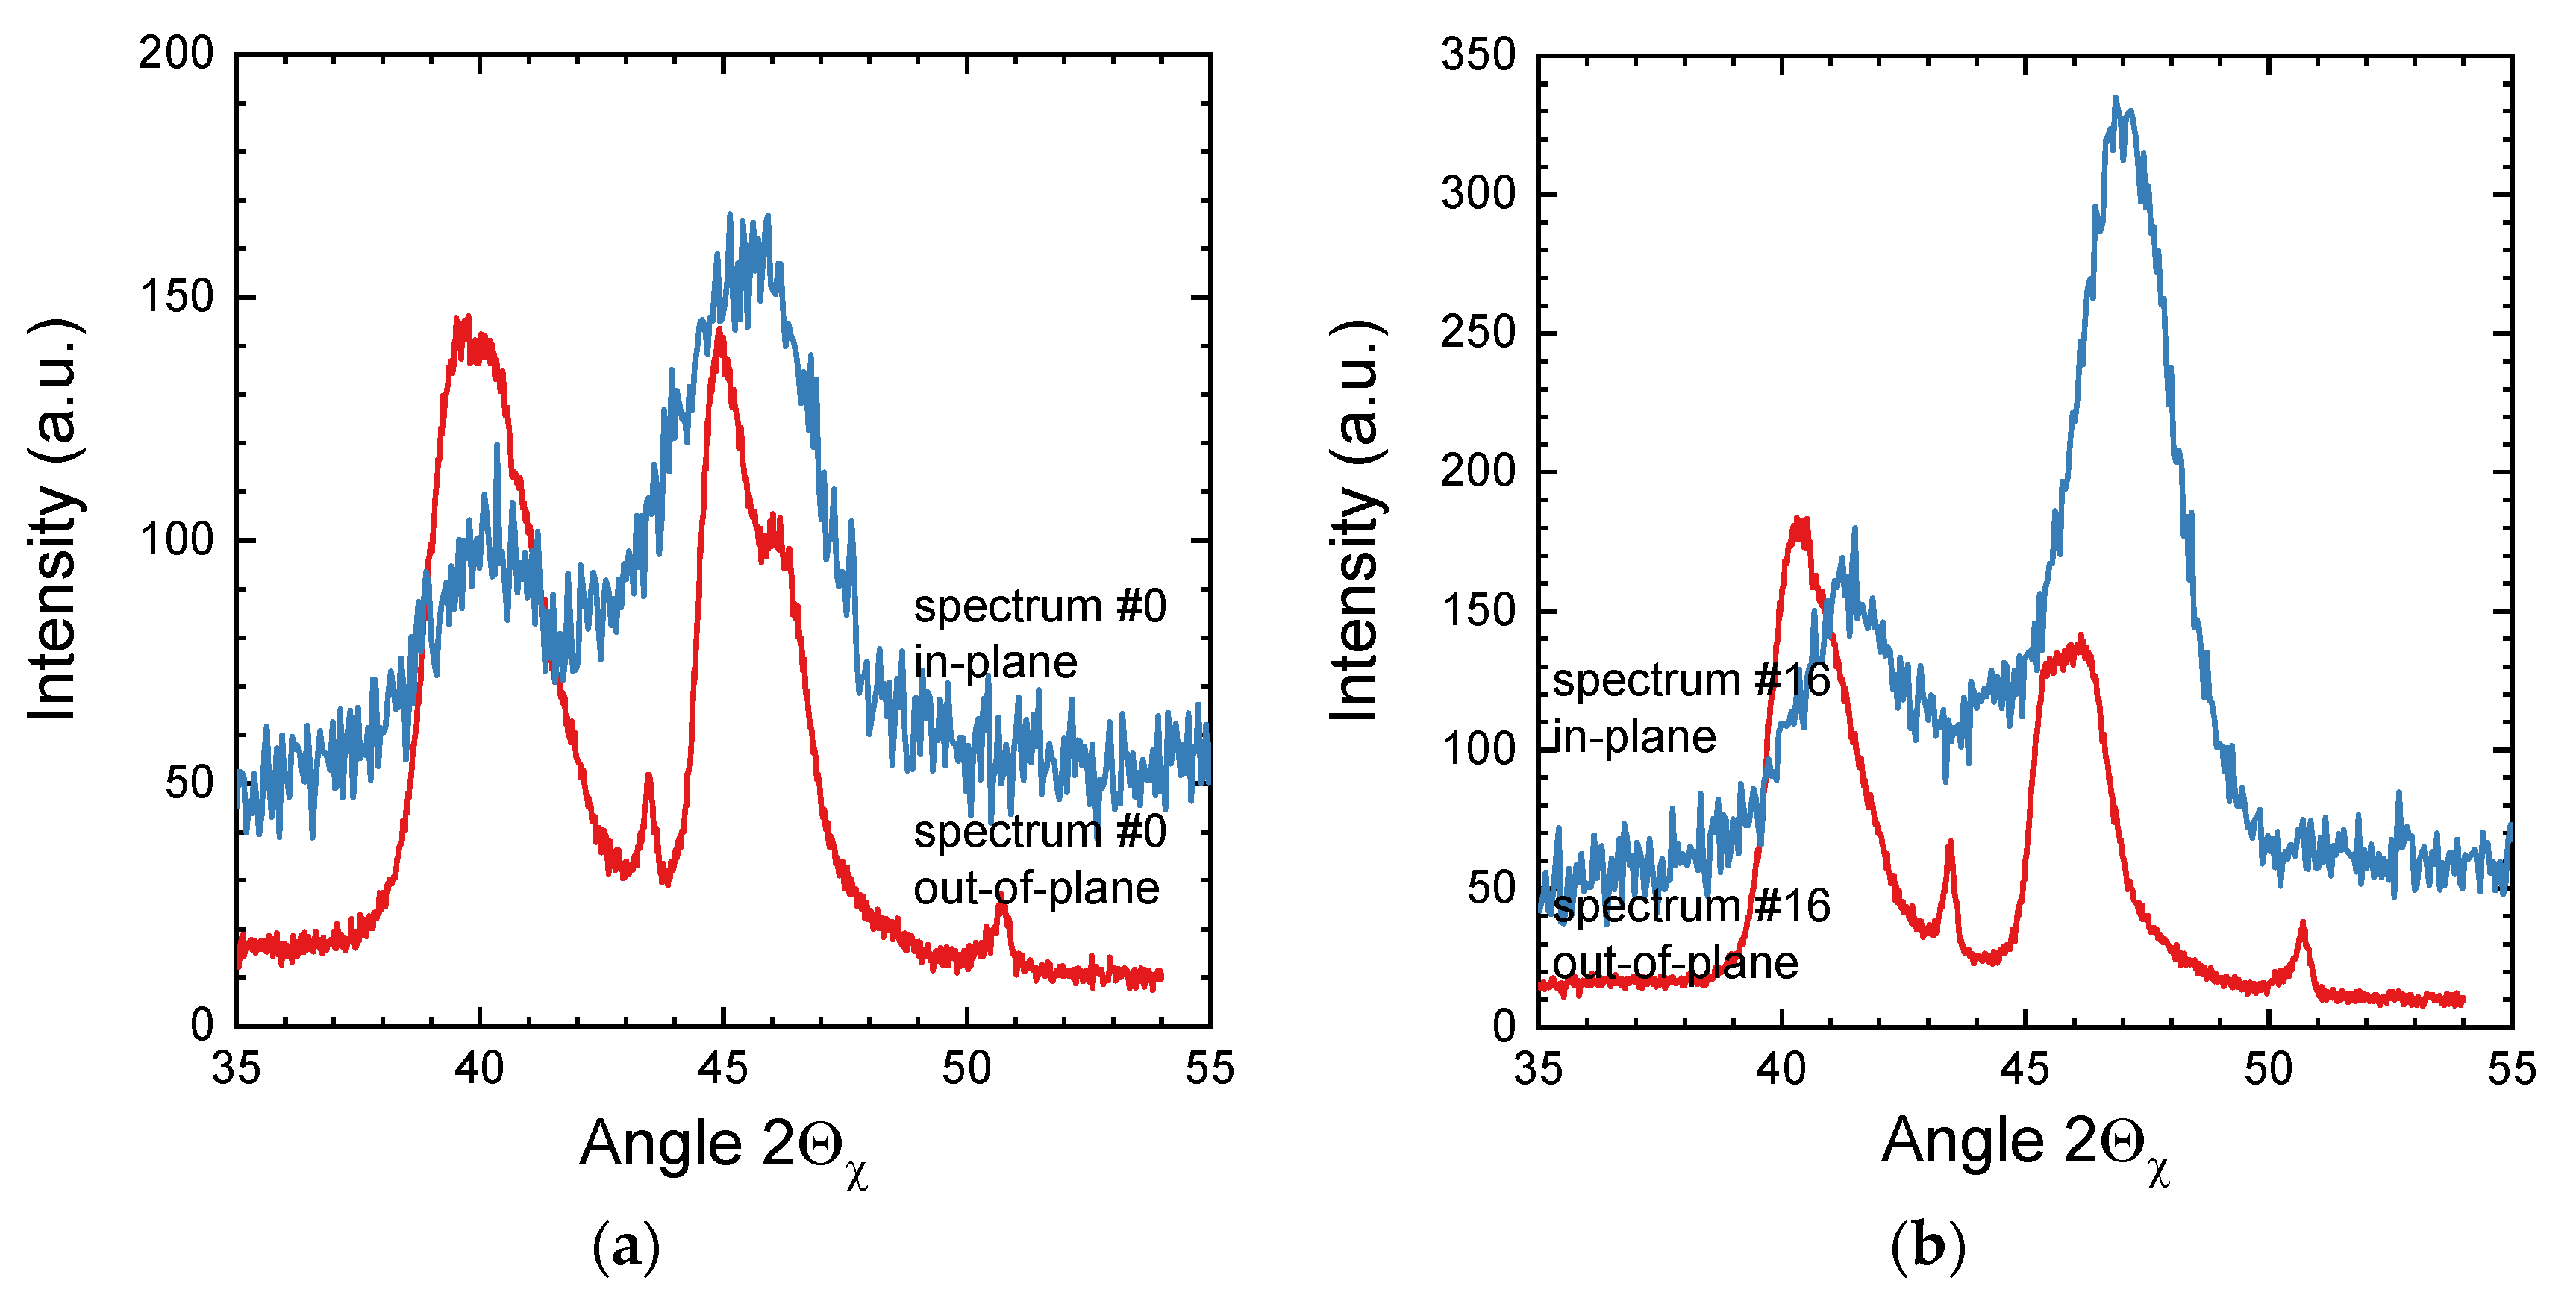
Figure 9 presents the comparison of in-plane (scattering vector parallel to surface) with out-of-plane (scattering vector perpendicular to surface, i.e., in situ XRD) measurements for these four different positions within the expanded austenite layer. The differences noted for Figure 8 still apply: very high surface sensitivity for in-plane vs. substrate visible for out-of-plane measurements and peak broadening due to wide slits for in-plane vs. peak broadening due to probing depths with different nitrogen content for out-of-plane measurements. At the same time, the relative intensities for the (111) and (200) reflections are strongly influenced by the three-dimensional orientation distribution function. This may explain the relatively high intensity of the (200) reflections for the expanded phase, which reach or even surpass the intensity of the (111) reflections for these in-plane measurement, which is in contrast to the out-of-plane measurements shown in Figure 5 for the same sample.
Starting with the original surface before any sputtering, Figure 9a compares the in-plane and out-of-plane XRD spectra. In addition to the peaks of the expanded phase present at the surface, the out-of-plane spectrum shows substrate peaks and a shoulder on the right side of the (200) peak, which corresponds to the buried expanded phase with a reduced lattice expansion. The strain for {111} oriented grains appears to be nearly identical for both directions whereas the in-plane (200) reflection exhibits a slightly smaller strain than the out-of-plane (200) reflection.
Figure 9b presents the spectra obtained after sputtering step 16: here, a clear anisotropic strain is visible for both grain orientations with higher strains perpendicular to the surface than parallel to the surface. However, the absolute anisotropy is much larger for the {200} oriented grains. No information on any potential peak splitting parallel to the surface is available due to the larger peak width for these in-plane measurements.
Continuing to sputter step 35, the large strain anisotropy for the {200} oriented grains remains whereas the strain for the {111} oriented grains is again nearly identical, as shown in Figure 9c. The situation for the last sputter step, presented in Figure 9d, changes again; now the in-plane strain for the {100} oriented grains is actually slightly larger than the out-of-plane strain, whereas the large anisotropy already observed for the (200) peaks in the last sputter step is even more pronounced.
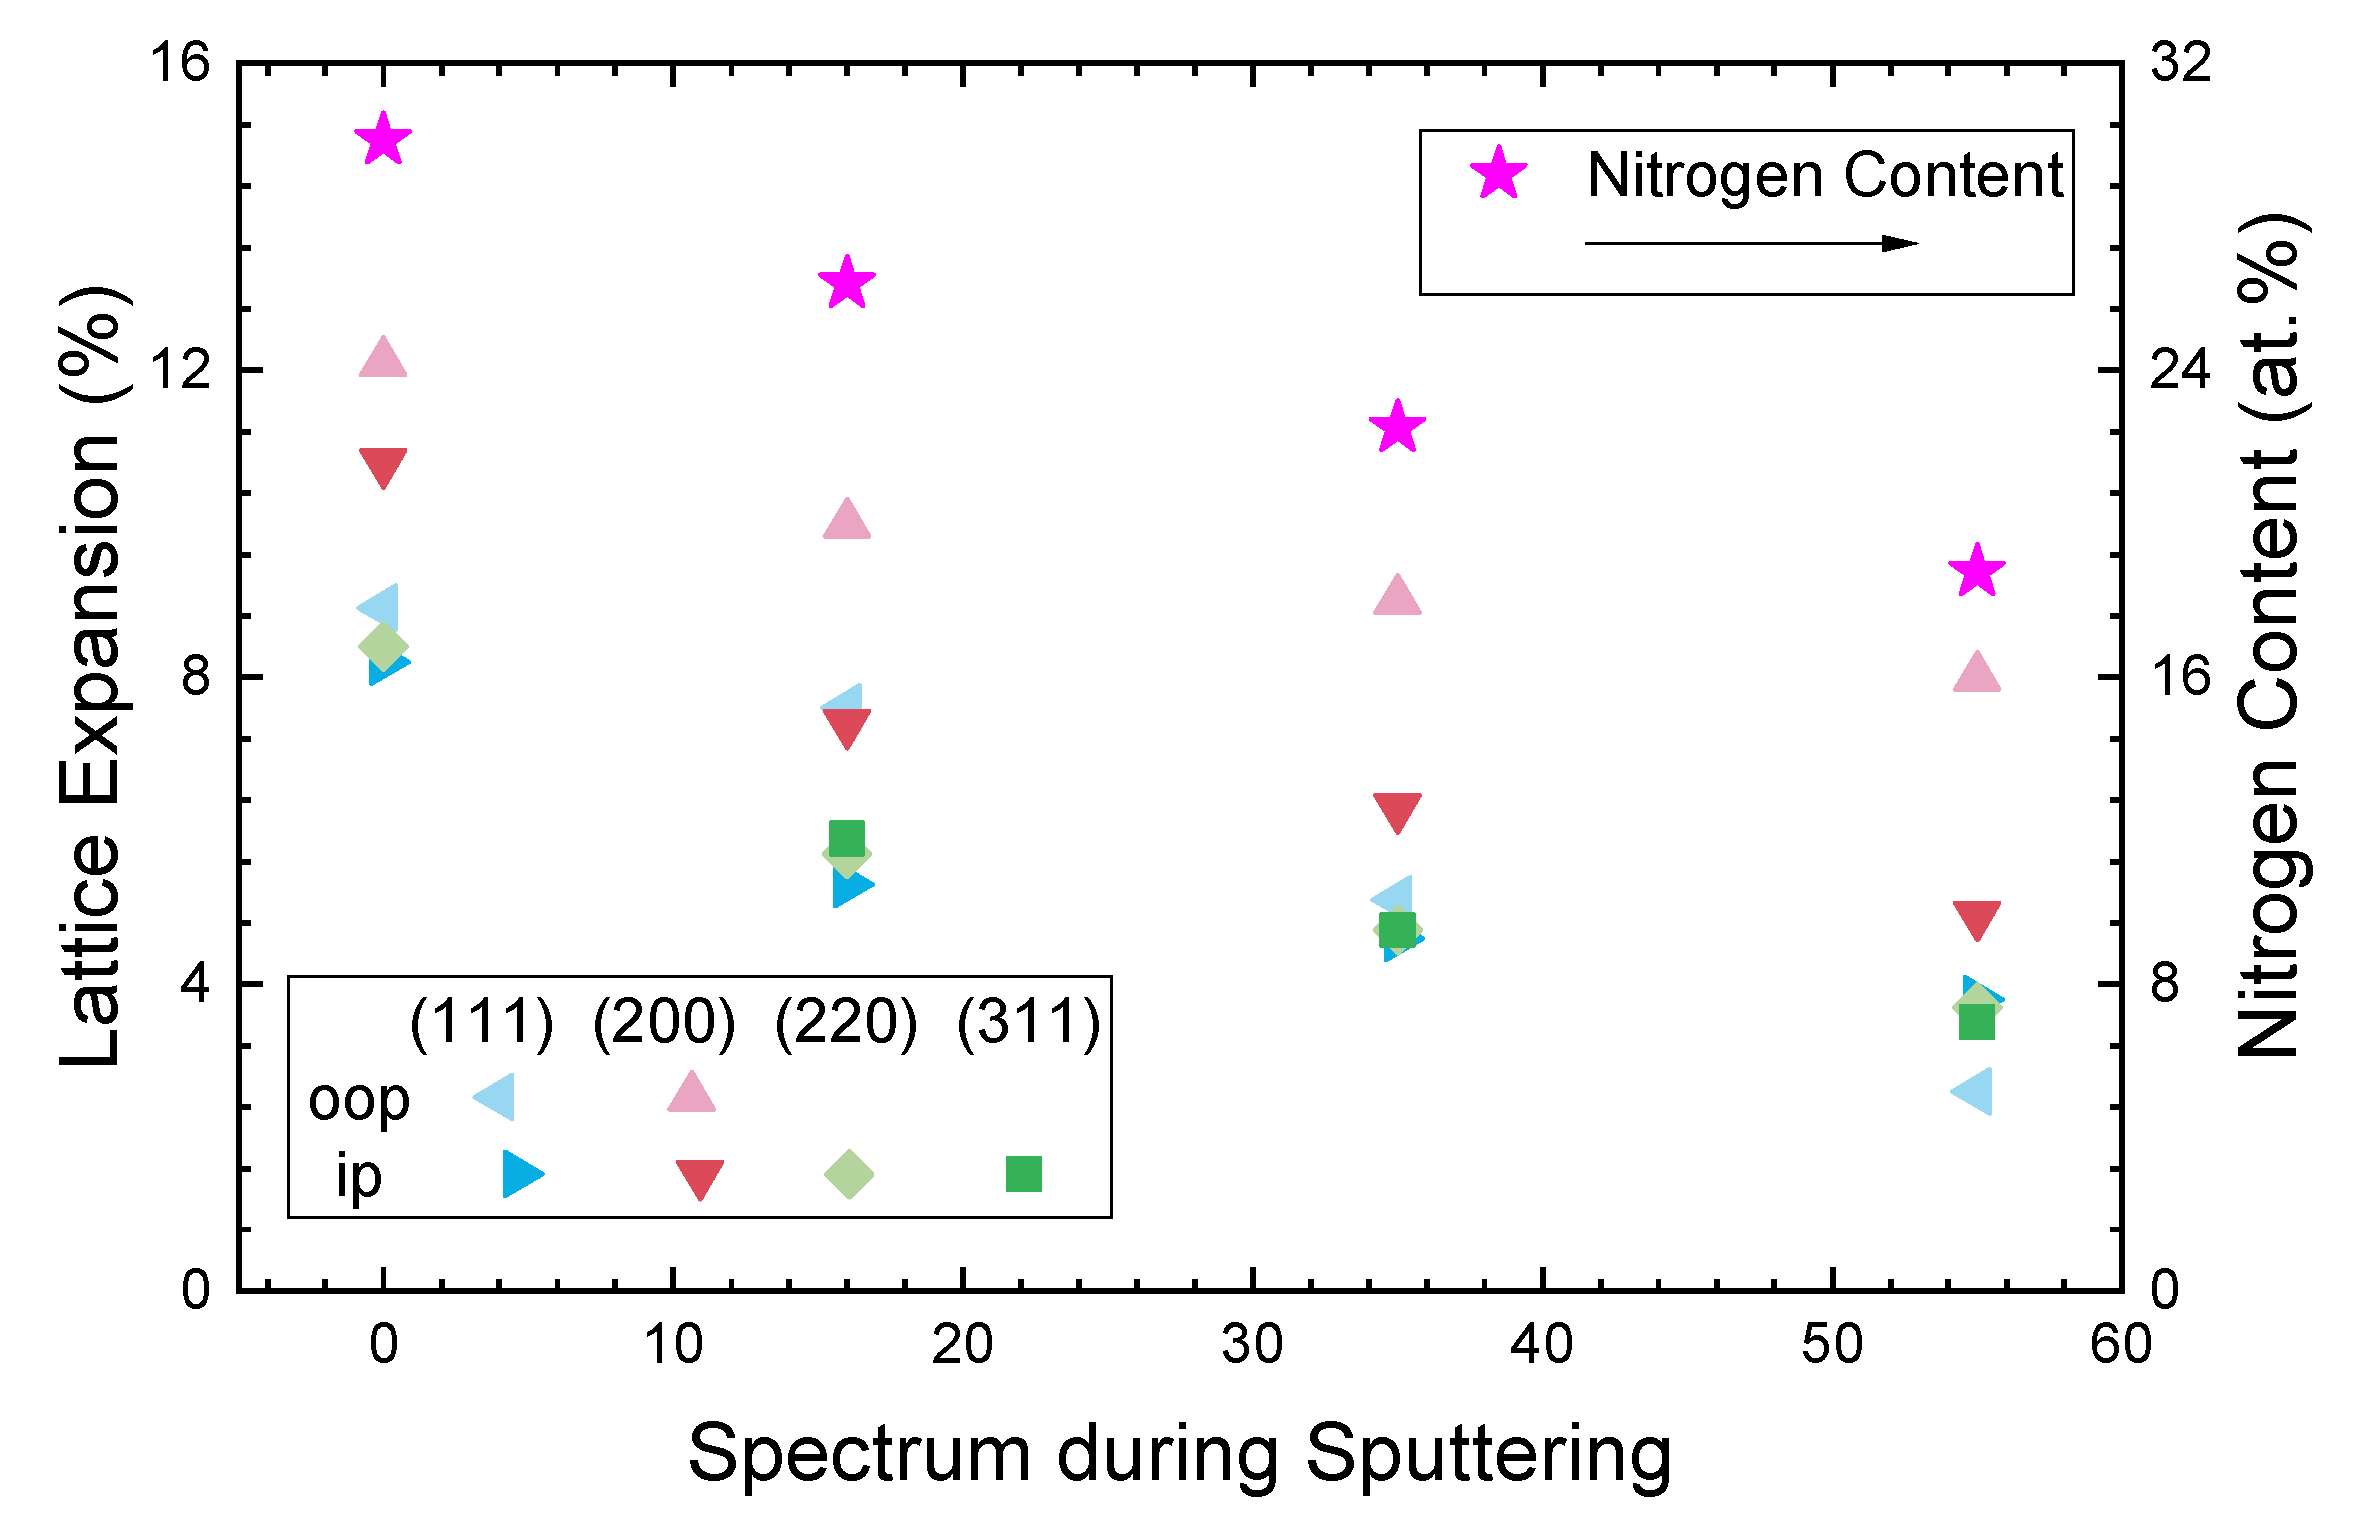
Figure 10 provides a summary of the lattice expansion as a function of grain orientation, measurement geometry and sputter depth. For the out-of-plane measurements, this is a repetition of the presentation already provided in Figure 7, albeit now reduced to the four sputter depths at which in-plane measurements have been performed. For the {200} oriented grains, a strong increase in the anisotropy of the strain was observed toward the interface with the non-nitrided austenitic steel substrate, yet the absolute lattice expansion decreased. In contrast, the relative strain for the (111) reflection, while decreasing monotonically for both the in-plane and out-of-plane measurements, showed a different ratio (however, with a much smaller amplitude); near the interface at sputter step 55, the out-of-plane strain was larger than the in-plane strain. Additionally, data for the (220) and (311) reflections measured in in-plane geometry are shown which exhibited a general tendency for the (111) in-plane reflection.

4. Discussion

The combination of ion implantation and sputter etching with in situ XRD is a powerful tool for time- or depth-resolved information on diffusion and phase formation, which has been exemplified for expanded austenite. Two effects have been identified and necessitate further discussion—identification of sublayers in {200} oriented grains as well as strain distribution parallel and perpendicular to the surface as a function of depth [40].
The first effect is clearly independent from the layered structures reported for Ni-containing alloys [27]. There, the effect denominated as γN1N2 layers was observed for both investigated grain orientations with a relative large reduction in the lattice expansion (the expansion for the γN2 component is less than 50% of the expansion for the γN1 component) commensurate to the much lower nitrogen content. Browsing the extensive literature on expanded austenite for similar observations, it is difficult to find reports on implantation times of 30 min or less where this effect should be most pronounced.
While [41] presents spectra that may be similar (especially for 420–440 °C treatment temperature), nitrocarburizing was performed. Though the bulk of the carbon was found to be much deeper than the nitrogen (yet beyond the XRD information depth), a finite surface concentration of 2–5 at.% is reported. This carbon/nitrogen gradient could lead to a double-feature or peak-splitting as different layers are probed simultaneously. For the (111) reflection, a small but finite splitting cannot be excluded from the presented data. Any influence of carbon contamination on the presented data in Section 3.1. can be excluded from the SIMS data.
Reducing the fcc symmetry of expanded austenite to a face-centered tetragonal (fct) symmetry could explain the observation when the orientation of the fct phase changes (abruptly) with depth or changes the symmetry from fct to fcc with depth—e.g., assuming a surface induced effect. Here, the Ni–Cr–N compound (NiCr)4N observed after nitriding of the alloy Ni80Cr20 is reported in the literature with the (200) orientation found to be perpendicular to the surface and the (002) orientation parallel to the surface [42]. Although there is no information on the depth distribution of this phase available, which appears in addition to an expanded austenite phase and is not just replacing it. Additionally, no such behavior has been reported for the γ’-Fe4N phase (which is congruent to the fct (NiCr)4N phase), which is completely different from the expanded austenite found for nitriding of austenitic stainless steel.
Even assuming a surface induced change in the preferred orientation of an fct structure, the transition depth of around 600–800 nm (when using two depth profiles shown in Figure 4b and Figure 5) is rather high. Normally, influences of the surface on symmetry breaking and the relative stability of differently oriented phases are restricted to a few tens of nanometers or even less [43,44]. Thus, doubts about the viability of this possible mechanism exist, making the casual link quite unlikely. Nevertheless, a combination of ion beam sputter etching and in-plane XRD measurements should help to clarify the situation and understand the underlying physics. While martensitic/ferritic inclusions on the surface are below the detection limit of XRD, any residual influences of these phases on the formation of the layered structure cannot be ruled out at this stage, yet a plausible mechanism is not directly conceivable. However, sputter removal of the material during ion nitriding will remove around 1 µm/hour. Thus, there should be no trace of the original surface after nitriding.
As shown in Section 3.2, there is an apparently clear situation from the out-of-plane measurements performed during sputter etching, permitting the clear identification of the layered structure only for the {200} oriented grains. In contrast, it becomes immediately confusing when the in-plane measurements are added—the assumption of an fct structure with the orientation of the main axis changing at the transition point is not at all supported by the extended data. Actually, the same class of crystallites is probed for the {200} oriented grains perpendicular and parallel to the surface. Consequently, any such shift or rotation is clearly not present. Thus, the origin of the two sublayer has to remain open.
Extending the analysis of the in-plane measurement toward other oriented grains should allow an identification of the stress derived from the orthogonal strain measurements. Nevertheless, no unequivocal statement can be provided due to the present data. At least, combining the nitrogen depth profiles and the strain data as a function of depth in the current experiment points toward a strong correlation between Vegard’s law and the measured lattice constant. However, additional biaxial stress is present, as known from the literature [10,12,17]. Yet, even the presented measurements of in-plane and out-of-plane diffraction data do not allow the determination of absolute values and perhaps even direction of stress (compressive or tensile).

5. Summary and Conclusions

In situ XRD is a powerful tool in combination with ion bombardment for implantation or sputter etching where time- and depth-resolved information can be obtained, the latter one limited only by the surface or interface roughness degraded by the ion bombardment. Even for the well investigated system of nitrogen in austenitic stainless steel, novel results for the structure within the expanded austenite layer have been obtained: the {200} oriented grains show a substructure of two different lattice expansions under some processing conditions.
At the same time, a comparison of in-plane and out-of-plane strain measurements yielded undecisive results. Further investigations for both topics are necessary to elucidate underlying processes and help toward a better understanding of expanded austenite. Here, further investigations including comparisons with other samples and alternative XRD techniques (conventional sin2ψ measurements are still handicapped by the changing information depth during the measurement) are mandatory. After establishing clear tendencies as a function of depth and treatment condition, these data should be used as input for the existing models on stress formation and evolution in expanded austenite.

Author Contributions

Conceptualization, D.M. and S.M.; funding acquisition, D.M.; methodology, D.M.; investigation, D.M., P.S., J.W.G., and S.M.; formal analysis, S.M. and P.S.; writing—original draft, S.M.; writing—review and editing, D.M. and J.W.G.; All authors have read and agreed to the published version of the manuscript.

Funding

This research was funded by Deutsche Forschungsgemeinschaft, grant number MA 4426/5-1.

Conflicts of Interest

The authors declare no conflict of interest.

References

  1. Washko, S.D.; Aggen, G. Wrought Stainless Steels. In ASM Handbook; ASM International: Materials Park, OH, USA, 1997; Volume 1, pp. 841–907. [Google Scholar]
  2. McGuire, M.F. Stainless Steels for Design Engineers; ASM International: Materials Park, OH, USA, 2008; ISBN 978-0-87170-717-8. [Google Scholar]
  3. Lerner, R.M. Glow-discharge nitriding of Nitralloy 135M and AISI304 stainless steel. J. Iron Steel Inst. 1972, 210, 631–632. [Google Scholar]
  4. Lebrun, J.-P.; Michel, H.; Gantois, M. Nitruration par bombardement ionique des aciers inoxydables 18-10. Mémoires Sci. La Rev. Métallurgie 1972, 69, 727–738. [Google Scholar]
  5. Somers, M.A.J.; Christiansen, T.L. Low temperature surface hardening of stainless steel. In Thermochemical Surface Engineering of Steels; Mittemeijer, E.J., Somers, M.A.J., Eds.; Woodhead Publishing: Oxford, UK, 2015; pp. 557–579. ISBN 978-0-85709-592-3. [Google Scholar] [CrossRef]
  6. Ichii, K.; Fujimura, K.; Takase, T. Microstructure, corrosion resistance, and hardness of the surface layer in ion nitrided 18-8 stainless steel. Netsu Shori 1985, 25, 191–195. [Google Scholar]
  7. Sun, Y.; Haruman, E. Low temperature plasma surface alloying of austenitic stainless steels. Solid State Phenom. 2006, 118, 85–90. [Google Scholar] [CrossRef]
  8. Zhang, Z.L.; Bell, T. Structure and corrosion resistance of plasma nitrided stainless steel. Surf. Eng. 1985, 1, 131–136. [Google Scholar] [CrossRef]
  9. Borgioli, F. From austenitic stainless steel to expanded austenite-s phase: Formation, characteristics and properties of an elusive metastable phase. Metals 2020, 10, 187. [Google Scholar] [CrossRef] [Green Version]
  10. Czerwiec, T.; He, H.; Marcos, G.; Thiriet, T.; Weber, S.; Michel, H. Fundamental and innovations in plasma assisted diffusion of nitrogen and carbon in austenitic stainless steels and related alloys. Plasma Process. Polym. 2009, 6, 401–409. [Google Scholar] [CrossRef]
  11. Fewell, M.P.; Priest, J.M. High-order diffractometry of expanded austenite using synchrotron radiation. Surf. Coat. Technol. 2008, 202, 1802–1815. [Google Scholar] [CrossRef]
  12. Mändl, S.; Rauschenbach, B. Anisotropic strain in nitrided austenitic stainless steel. J. Appl. Phys. 2000, 88, 3323–3329. [Google Scholar] [CrossRef]
  13. Velterop, L.; Delhez, R.; de Keijser, T.H.; Mittemeijer, E.J.; Reefman, D. X-ray diffraction analysis of stacking and twin faults in f.c.c. metals: A revision and allowance for texture and non-uniform fault probabilities. J. Appl. Crystallogr. 2000, 33, 296–306. [Google Scholar] [CrossRef]
  14. Brink, B.K.; Ståhl, K.; Christiansen, T.L.; Oddershede, J.; Winther, G.; Somers, M.A.J. On the elusive crystal structure of expanded austenite. Scr. Mater. 2017, 131, 59–62. [Google Scholar] [CrossRef] [Green Version]
  15. Christiansen, T.; Somers, M.A.J. Avoiding ghost stress on reconstruction of stress-and composition-depth profiles from destructive X-ray diffraction depth profiling. Mater. Sci. Eng. A 2006, 424, 181–189. [Google Scholar] [CrossRef]
  16. Sienz, S.; Mändl, S.; Rauschenbach, B. In-situ stress measurements during low energy nitriding of stainless steel. Surf. Coat. Technol. 2002, 156, 185–189. [Google Scholar] [CrossRef]
  17. Christiansen, T.L.; Hummelshøj, T.S.; Somers, M.A.J. Expanded austenite, crystallography and residual stress. Surf. Eng. 2010, 26, 242–247. [Google Scholar] [CrossRef]
  18. Lutz, J.; Manova, D.; Gerlach, J.W.; Störmer, M.; Mändl, S. Interpretation of glancing angle and bragg-brentano XRD Measurements for CoCr alloy and austenitic stainless steel after PIII nitriding. IEEE Trans. Plasma Sci. 2011, 39, 3056–3060. [Google Scholar] [CrossRef]
  19. Manova, D.; Mändl, S. Perspectives: In-situ XRD measurements to explore phase formation near surface region. J. Appl. Phys. 2019, 126, 200901. [Google Scholar] [CrossRef]
  20. Henke, B.L.; Gullikson, E.M.; Davis, J.C. X-ray interactions: Photoabsorption, scattering, transmission, and reflection at E = 50–30000 eV, Z = 1–92. Data Nucl. Data Tables 1993, 54, 181–342. [Google Scholar] [CrossRef] [Green Version]
  21. Manova, D.; Mändl, S.; Gerlach, J.W.; Hirsch, D.; Neumann, H.; Rauschenbach, B. In situ X-ray diffraction investigations during low energy ion nitriding of austenitic stainless steel grade 1.4571. J. Phys. D Appl. Phys. 2014, 47, 365301. [Google Scholar] [CrossRef]
  22. Mändl, S. Nitriding of stainless steel: PIII or low energy nitriding? Plasma Proc. Polym. 2007, 4, 239–245. [Google Scholar] [CrossRef]
  23. Neumann, H.; Tartz, M.; Scholze, F.; Chassé, T.; Kersten, H.; Leiter, H. Broad beam ion sources for electrostatic space propulsion and surface modification processes: From roots to present applications. Contrib. Plasma Phys. 2007, 47, 487–497. [Google Scholar] [CrossRef]
  24. Brink, B.; Ståhl, K.; Christiansen, T.L.; Somers, M.A.J. Thermal expansion and phase transformations of nitrogen-expanded austenite studied with in situ synchrotron X-ray diffraction. J. Appl. Crystallogr. 2014, 47, 819–826. [Google Scholar] [CrossRef]
  25. Dienelt, J.; Zimmer, K.; Scholze, F.; Dathe, B.; Neumann, H. Generation of a pulsed ion beam with a tuned electronic beam switch. Plasma Sources Sci. Technol. 2003, 12, 489–494. [Google Scholar] [CrossRef]
  26. Manova, D.; Lutz, J.; Mändl, S. Sputtering effects during plasma immersion ion implantation of metals. Surf. Coat. Technol. 2010, 204, 2875–2880. [Google Scholar] [CrossRef]
  27. Williamson, D.L.; Davis, J.A.; Wilbur, P.J. Effect of austenitic stainless steel composition on low-energy, high-flux, nitrogen ion beam processing. Surf. Coat. Technol. 1998, 103, 178–184. [Google Scholar] [CrossRef]
  28. Blawert, C.; Weisheit, A.; Mordike, B.L.; Knoop, F.M. Plasma immersion ion implantation of stainless steel: Austenitic stainless steel in comparison to austenitic-ferritic stainless steel. Surf. Coat. Technol. 1996, 85, 15–27. [Google Scholar] [CrossRef]
  29. Manova, D.; Günther, C.; Bergmann, A.; Mändl, S.; Neumann, H.; Rauschenbach, B. Influence of temperature on layer growth as measured by in-situ XRD observation of nitriding austenitic stainless steel. Nucl. Instrum. Methods B 2013, 307, 310–314. [Google Scholar] [CrossRef]
  30. Williamson, D.L.; Ozturk, O.; Wei, R.; Wilbur, P.J. Metastable phase formation and enhanced diffusion in f.c.c. alloys under high dose, high flux nitrogen implantation at high and low ion energies. Surf. Coat. Technol. 1994, 65, 15–27. [Google Scholar] [CrossRef]
  31. Manova, D.; Díaz, C.; Pichon, L.; Abrasonis, G.; Mändl, S. Comparability and accuracy of nitrogen depth profiling in nitrided austenitic stainless steel. Nucl. Instrum. Methods B 2015, 349, 106–113. [Google Scholar] [CrossRef]
  32. Blawert, C.; Mordike, B.L.; Collins, G.A.; Short, K.T.; Jirásková, Y.; Schneeweiss, O.; Perina, V. Characterisation of duplex layer structures produced by simultaneous implantation of nitrogen and carbon into austenitic stainless steel X5CrNi189. Surf. Coat. Technol. 2000, 128, 219–225. [Google Scholar] [CrossRef]
  33. Mändl, S.; Dunkel, R.; Hirsch, D.; Manova, D. Intermediate stages of CrN precipitation during PIII nitriding of stainless steel. Surf. Coat. Technol. 2014, 258, 722–726. [Google Scholar] [CrossRef]
  34. Manova, D.; Lotnyk, A.; Mändl, S.; Neumann, H.; Rauschenbach, B. CrN precipitation and elemental segregation during the decay of expanded austenite. Mater. Res. Express 2016, 3, 066502. [Google Scholar] [CrossRef]
  35. Martinavičius, A.; Abrasonis, G.; Möller, W.; Templier, C.; Rivière, J.P.; Declémy, A.; Chumlyakov, Y. Anisotropic ion-enhanced diffusion during ion nitriding of single crystalline austenitic stainless steel. J. Appl. Phys. 2009, 105, 93502. [Google Scholar] [CrossRef]
  36. Christiansen, T.; Somers, M. Controlled dissolution of colossal quantities of nitrogen in stainless steel. Met. Mater. Trans. 2006, 37A, 675–682. [Google Scholar] [CrossRef]
  37. Ledbetter, H.M.; Austin, M.W. Dilation of an fcc Fe–Cr–Ni alloy by interstitial carbon and nitrogen. Mater. Sci. Technol. 1987, 3, 101–104. [Google Scholar] [CrossRef]
  38. Manova, D.; Lutz, J.; Gerlach, J.W.; Neumann, H.; Mändl, S. Relation between lattice expansion and nitrogen content in expanded phase after nitrogen insertion in austenitic stainless steel and CoCr alloys. Surf. Coat. Technol. 2011, 205, S290–S293. [Google Scholar] [CrossRef]
  39. Wu, D.; Kahn, H.; Dalton, J.C.; Michal, G.M.; Ernst, F.; Heuer, A.H. Orientation dependence of nitrogen supersaturation in austenitic stainless steel during low-temperature gas-phase nitriding. Acta Mater. 2014, 79, 339–350. [Google Scholar] [CrossRef]
  40. Fonović, M.; Leineweber, A.; Robach, O.; Jägle, E.A.; Mittemeijer, E. The nature and origin of “double expanded austenite” in Ni-based Ni–Ti alloys developing upon low temperature gaseous nitriding. J. Met. Mater. Trans. 2015, 46, 4115–4131. [Google Scholar] [CrossRef]
  41. Jafarpour, S.M.; Puth, A.; Dalke, A.; Böcker, J.; Pipa, A.V.; Röpcke, J.; van Helden, J.-P.; Biermann, H. Solid carbon active screen plasma nitrocarburizing of AISI 316L stainless steel in cold wall reactor: Influence of plasma conditions. J. Mater. Res. Technol. 2020, 9, 9195–9205. [Google Scholar] [CrossRef]
  42. Manova, D.; Hirsch, D.; Gerlach, J.W.; Mändl, S.; Neumann, H.; Rauschenbach, B. In-situ Investigation of phase formation during low energy ion nitriding of Ni80Cr20 alloy. Surf. Coat. Technol. 2014, 259, 434–441. [Google Scholar] [CrossRef]
  43. Gai, Z.; Lin, W.; Burton, J.; Fuchigami, K.; Snijders, P.C.; Ward, T.Z.; Tsymbal, E.Y.; Shen, J.; Jesse, S.; Kalinin, S.V.; et al. Chemically induced Jahn–Teller ordering on manganite surfaces. Nat. Commun. 2014, 5, 4528. [Google Scholar] [CrossRef] [Green Version]
  44. Panigrahi, P.; Hussain, T.; Araujo, C.M.; Ahuja, R. Hole induced Jahn Teller distortion ensuing ferromagnetism in Mn-MgO: Bulk, surface and one dimensional structures. J. Phys. Condens Matter. 2014, 26, 265801. [Google Scholar] [CrossRef] [PubMed]
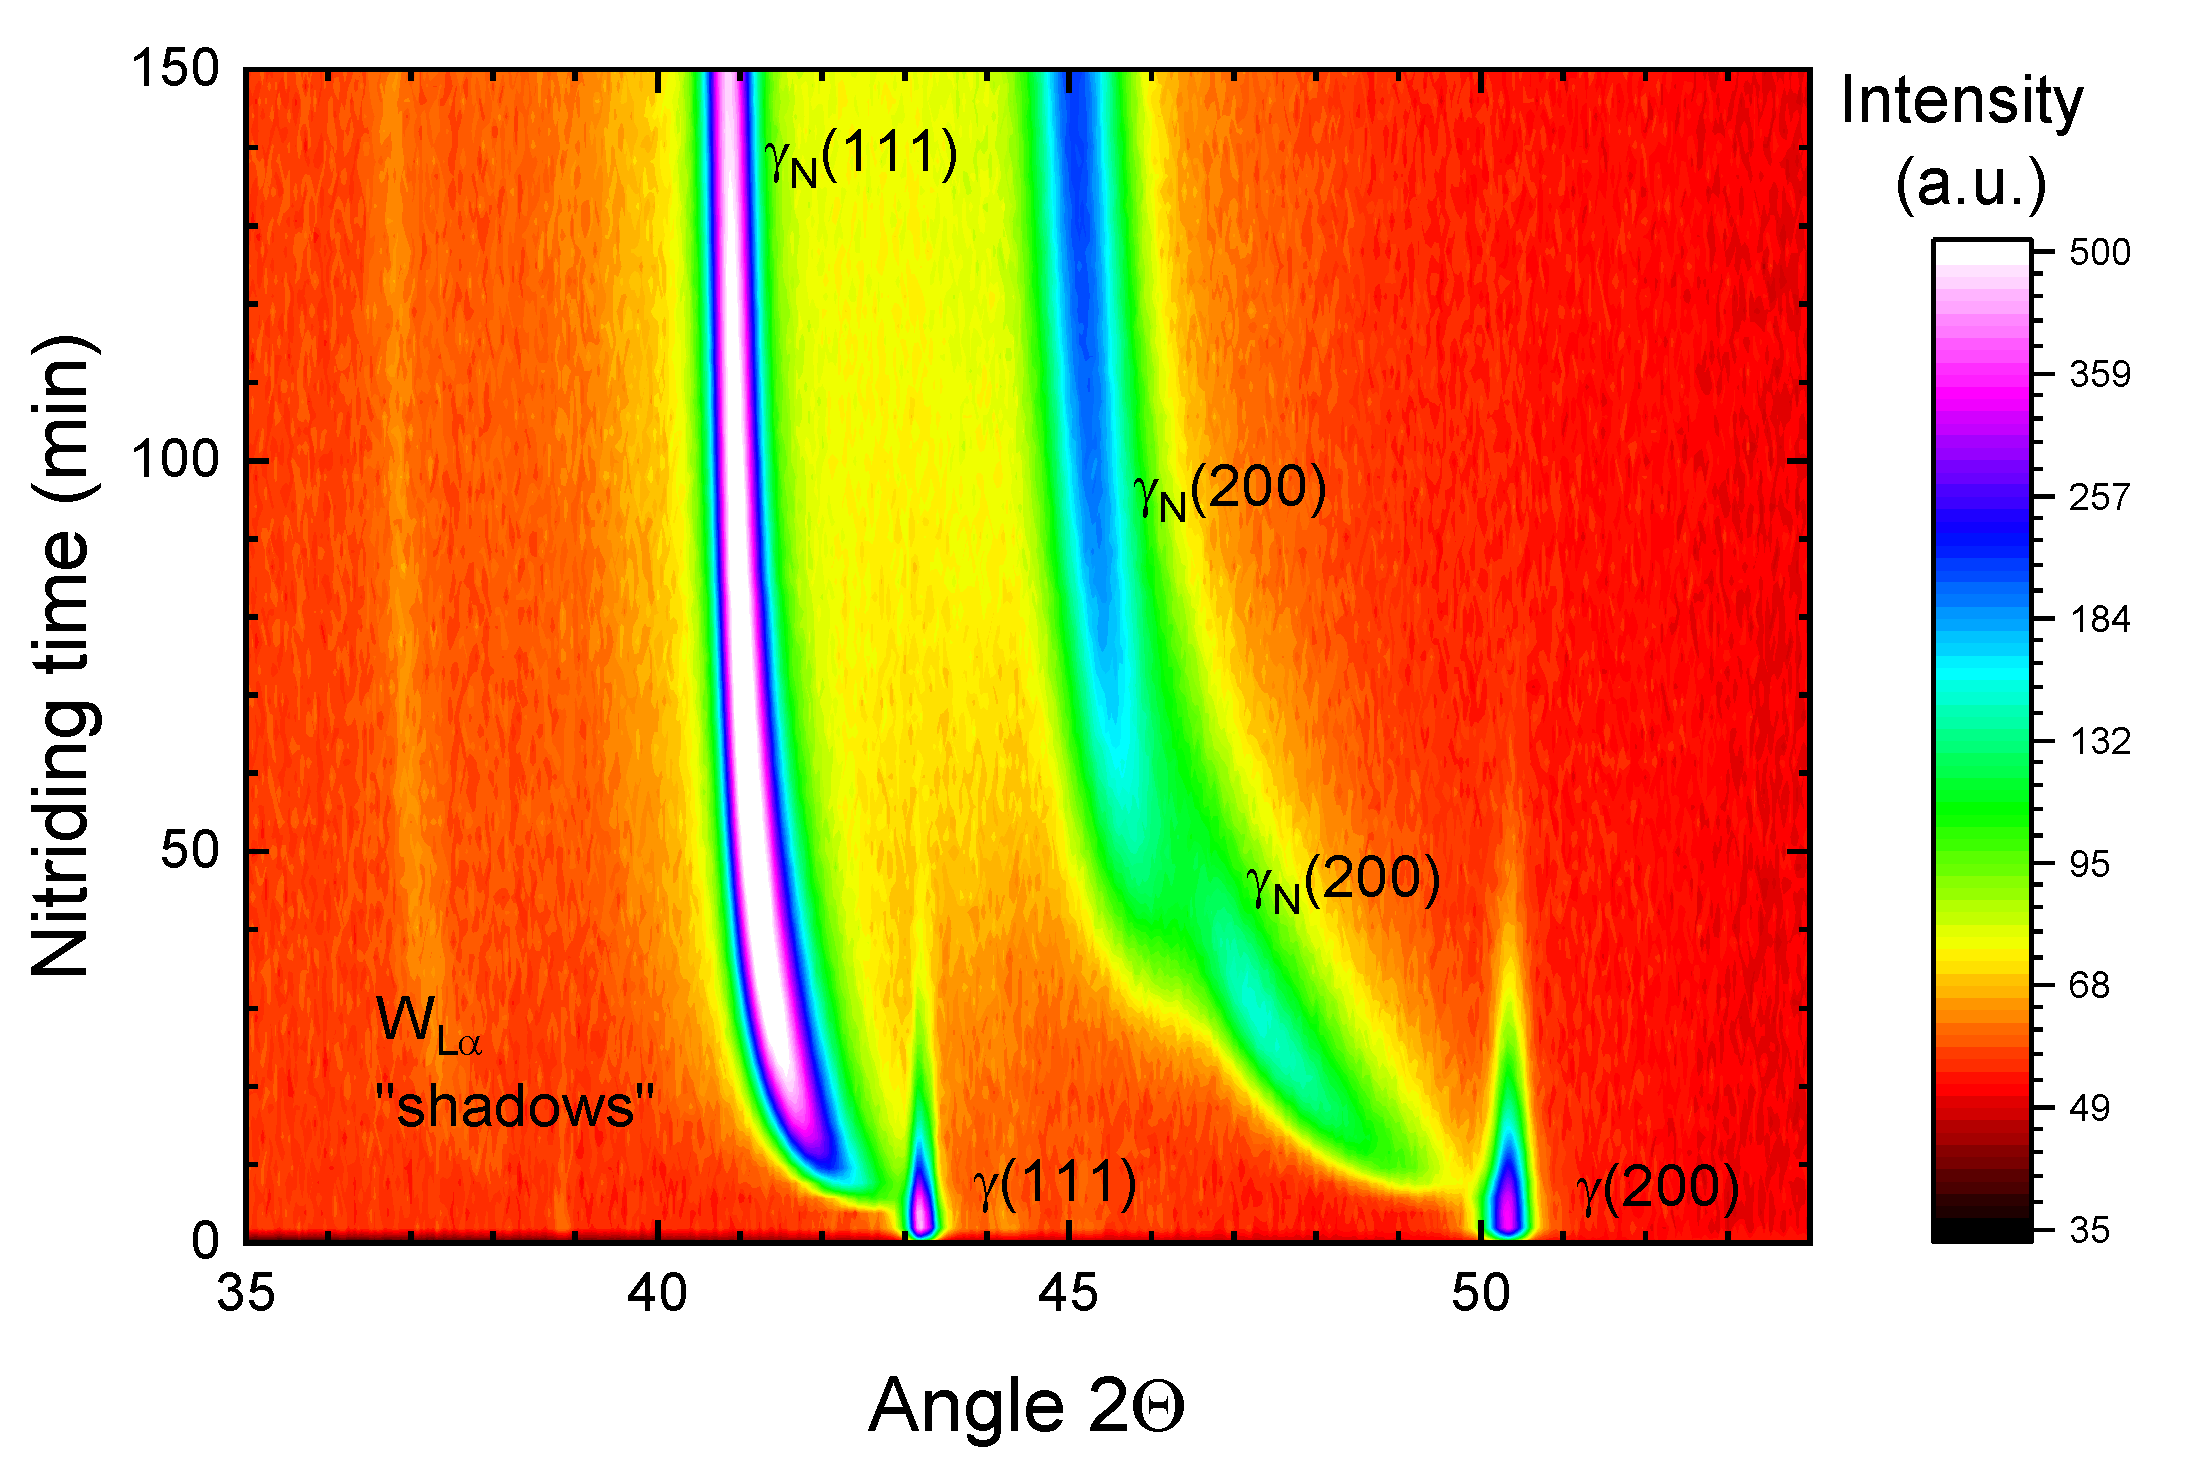
Figure 1. This is a contour plot of a series of successively measured X-ray diffraction (XRD) spectra, showing the phase evolution as a function of nitriding time at 450 °C substrate temperature using steel alloy 1.4571 at a nitrogen ion current density of 60 µA/cm2.
Coatings 10 01250 g001
Figure 2. Selected spectra taken during a temperature series for low energy ion nitriding of steel 1.4571 [21] at different temperatures for a fixed ion current density of 130 µA/cm2, together with two spectra each from the experimental results depicted in Figure 1 and Figure 4a. The spectra from the experiment depicted in Figure 1 were measured with a newer detector and thus show less noise than the others.
Coatings 10 01250 g002
Figure 3. Plot of time after start of nitriding where identical intensities are observed for both (200) peak components using the data from Figure 2 at a fixed ion current density of 130 µA/cm2. The dotted line corresponds to an activation energy of 20 meV, and should be used as a guide for the eye.
Coatings 10 01250 g003
Figure 4. (a) Steel 1.4571 nitrided at 450 °C for 80 min. including the initial heating phase without ion bombardment; (b) Ar+ ion etching of the same sample. The total nitrided layer thickness is about 3.3 µm.
Coatings 10 01250 g004
Figure 5. (a) In situ XRD spectra obtained during Ar+ ion sputtering (sputter rate approximately 0.3 nm/s) for a sample nitrided using plasma immersion ion implantation (PIII) at 450 °C for 90 min; (b) differential spectra for the data presented in panel (a), highlighting the differences between successive spectra.
Coatings 10 01250 g005
Figure 6. Nitrogen and carbon depth profile for the sample depicted in Figure 5 as obtained by secondary ion mass spectrometry (SIMS) and calibrated by glow discharge optical emission spectroscopy.
Coatings 10 01250 g006
Figure 7. (a) Peak position for expanded austenite as a function of depth using the differential spectra from Figure 5b; (b) comparison of lattice expansion and nitrogen content as a function of depth normalized for the different sputter rates.
Coatings 10 01250 g007
Figure 8. Summary of the in-plane measurements across the whole angular range. The spectrum number indicates the sputter depth at which the ex situ XRD data have been measured.
Coatings 10 01250 g008
Figure 9. Comparison of in-plane and out-of-plane measurements for following depths, respective sputter steps: (a) step 0; (b) step 16; (c) step 35; (d) step 55.
Coatings 10 01250 g009aCoatings 10 01250 g009b
Figure 10. Comparison of lattice expansion as a function of grain orientation and XRD geometry for the sputter steps listed in Table 1. The respective measurement type (in-plane—ip vs. out-of-plane—oop) and the reflections are coded by color and symbol.
Coatings 10 01250 g010
Table 1. List of positions where extensive ex situ XRD investigations were performed.
Spectra #Comment
0surface
16transition in (200) exp. phase
35bulk of exp. phase
55end of (111) exp. phase
Publisher’s Note: MDPI stays neutral with regard to jurisdictional claims in published maps and institutional affiliations.