Article

Characterization of Pure Rutile Titania Nanoparticle Prepared by Feasible Method for Coatings and Visible Light-Driven Dye Removal Application

by
Jothi Ramalingam Rajabathar
1,*,†,
Hamad A. Al-Lohedan
1,†,
Selvaraj Arokiyaraj
2,†,
Zuheir A. Issa
1,
Chandra Sekhar Dash
3,
Sundararajan Murugesan
4,
Shaik K. Khadheer Pasha
5,
Dhaifallah M. Al-dhayan
1 and
Jimmy Nelson Appaturi
6
1
Department of Chemistry, College of Science, King Saud University, P.O. Box 2455, Riyadh 11451, Saudi Arabia
2
Department of Food Science and Biotechnology, Sejong University, Gwangjin-gu, Seoul 05006, Korea
3
Department of Electronics and Communication Engineering, Centurion University of Technology and Management, Bhubaneswar 752050, Odisha, India
4
PG & Research Department of Physics, Paavendhar College of Arts & Science, Salem 636121, India
5
Functional Nanomaterials and Polymer Nanocomposite Laboratory, Department of Physics, VIT-AP University, Amaravati 522501, India
6
School of Chemical Sciences, Universiti Sains Malaysia, Gelugor 11800, Pulau Pinang, Malaysia
*
Author to whom correspondence should be addressed.
Equally contributing author.
Coatings 2021, 11(10), 1150; https://doi.org/10.3390/coatings11101150
Submission received: 23 July 2021 / Revised: 5 September 2021 / Accepted: 17 September 2021 / Published: 23 September 2021
(This article belongs to the Collection Advanced Surface Coating of Nanoparticles)

Abstract

:
The pure phase of rutile titanium dioxide or titania (R-TiO2) was prepared by means of a strong acidic sol–gel process followed by treatment using a hydrothermal method. The as-prepared titania nanoparticles existed purely in the rutile phase instead of the mixed anatase phase of the respective titania (R-TiO2). The optimized reaction condition and precursor usage were the critical parameters for the formation of the particle size and uniform crystallinity of the rutile phase of TiO2 nanoparticle fabrication. XRD (X-ray diffraction), and Raman spectroscopic techniques were utilized to confirm the formation of the pure rutile phase of titania. SEM (scanning electron microscope) and TEM (Transmission electron microscope) images showed the cauliflower-like morphology of the as-prepared R-TiO2; reduced particle sizes of below 5 nm were observed and confirmed through high resolution images. The catalytic activity of the as-prepared R-TiO2 was tested under visible light irradiation for methylene blue dye degradation reactions. Dye degradation occurred very effectively, even at higher concentrations of methylene blue (MB), at reduced time intervals from 5 to 3 h of reaction time. The as-prepared rutile phase of pure titania nanoparticles was applied in a catalysis application for the purpose of inducing various types of organic dye degradation or catalytic transformation in the presence of visible light.

1. Introduction

Amorphous-form titanium dioxide has limited photocatalytic applications due to the presence of higher degrees of defects that promote rapid electron–hole recombination. The three main crystalline forms of titania are rutile, anatase and brookite [1,2,3]. Anatase and rutile are the ones that have been extensively studied since brookite is rather difficult to isolate and prepare in its pure form [4,5]. The rutile phase the most stable, whereas the metastable phases are anatase and brookite [6]. Among the three phases, anatase is the more active as a photo catalyst and for use in crystallization substances by means of hydrothermal methods from aqueous solutions at elevated temperatures, as well as for the formation of single crystals, which are solely subject to mineral solubility at high pressure in hot water [7,8,9]. Controlling the composition and structure of metal oxide nanoparticles is the main focus of this study, with the objective of tailoring their catalytic activity and enhancing the surface properties of their active sites.
The achievement of satisfactory sizes of nanoparticles is dependent on the preparation conditions of hydrothermal treatment, and the preparation should aim to provide high purity, a particle size distribution with a uniform crystal structure, and materials with high crystallinity and controlled morphology [10]. Various mixed phases of TiO2 materials are prepared by means of the hydrothermal method, utilizing titanium trichloride as the source of Ti and for regulating the ratio of anatase and rutile. The titania (TiO2) nanoparticles (NPs) prepared using the above methods can coexist in the following mixed phases: anatase/brookite, anatase/rutile and anatase/rutile/brookite [11]. The diphase of titania provides effective photo-degradation for the degradation of levofloxacin instead of triphase in TiO2 [12]. Another recent application related to the versatility of rutile-grade TiO2 pigment accompanied with alumina and zirconia was synthesized in an inhibited environment. For comparison, it was observed that the coated pigment displayed better durability and optical characteristics than the titania obtained in a conventional manner [13]. Recently, rutile-phase titania film exhibited a flower-like structure with unprotected (110) and (111) facets; this was prepared with the aid of hydrothermal techniques, in the absence of additive agents, with different additions of silver from 0.5 to 2 wt.% [14]. The flower-like features enhanced the active surface area of the titanium oxide film [14,15,16]. Furthermore, 1 wt.% silver particle doping caused the maximum methylene blue degradation to occur, which was 20% greater than that of the undoped titanium oxide film. The synergistic effect for both the (110) and (111) facets and the Ti3+-oxygen vacancy from the silver nanoparticle played a pivotal role in the lowering of the band gap, and behaved in a similar manner to an electron trap [15]. Suzuki, H. et al. reported the preparation of tin oxide nanorods that were heteroepitaxially grown on rutile titanium oxide film by means of a hydrothermal method. The heat temperature (Tc) reliance of SnO2-TiO2 nanocrystals showed enhanced photocatalytic activity towards the ethanol to acetaldehyde oxidation reaction processes. The mechanism of higher efficiency due to the high electron mobility in the SnO2 NRs and the existence of proficient electron transfer band levels were found [16]. Hence, in the present study, pure rutile TiO2 was synthesized using various concentrations of nitric acid treatment followed by a hydrothermal process. The effect of strong acid treatment, and the optimization conditions for the formation of uniform structures and as-prepared rutile TiO2 nanoparticles, were characterized by various surface physico-chemical techniques and further tested for visible light assisted MB dye degradation. The main objective of the present study was to fabricate the rutile phase of TiO2 and avoid the formation of other mixed phases through the use of different acid concentration treatments in the hydrothermal synthesis process. We mainly focused on the study of catalytic performance instead of characterizing the morphology of visible light-assisted dye degradation activity. Insights on the mechanisms of the best-formed catalysts were also revealed.

2. Materials and Methods

2.1. Preparation of Rutile TiO2 Hydrothermal Method

Vivid concentrations of xM HNO3 (x = 2, 4, 6, 8 and 10 M) were treated with Titanium (IV) butoxide (0.007 M) and this clear solution was poured into a Teflon lined autoclave (HNZXIB, Chennai, India) and positioned in an oven at 453 K for 2 h. After completion of the hydrothermal process, the container was cooled to room temperature and the precipitate inside the container was filtered and washed with de-ionized water several times until the pH of 7 was reached. In a hot air oven, the precipitate was allowed to dry in order to obtain white crystalline powder of the rutile phase of TiO2. The powder was calcined at 773 K for 2 h in a muffle furnace. The above procedure was repeated with different molar concentrations of HNO3 solution (2, 4, 6, 8 and 10 M) to prepare various TiO2 materials. All of the powders were allowed to dry at 453 K for 2 h in an oven and further dried with the aid of a muffle furnace that was calcined for 2 h at a temperature of 773 K.

2.2. Material Characterization

The instrumental techniques used for the characterization of the prepared materials were powder X-ray diffraction (Miniflex 600, Urbana, IL, USA), BET surface area analysis (NOVA 2200e, Quntachrome instruments, Boynton Beach, FL, USA), optical microscopy (OLYMPUS BX-35,Tokyo, Japan), DR UV-Vis spectroscopy ( UV-2600, Shimadzu, Tokyo, Japan), FT-IR spectroscopy (FTIR-8400, Shimadzu, Tokyo, Japan,), Raman spectroscopy (JEOL, Tokyo, Japan), scanning electron microscopy (SEM, JEOL, Tokyo, Japan), and transmission electron microscopy (TEM, JEOL-JEM-2100F, Tokyo, Japan). The materials were prepared using various concentrations of HNO3 by means of the hydrothermal method; these materials are listed in Table 1.

2.3. Band Gap Evolution of Synthesized Rutile TiO2

The transformation of the DRS spectrum was performed at a magnitude that was proportional to the extinction coefficient (α) with the aid of the Kubelka–Munk function (Equation (1)):
The obtained DRS spectrum was transformed to a magnitude that was proportional to the extinction coefficient (α) through the Kubelka–Munk function (Equation (1)):
F(R) = (1 − R)2/2R
where R is the reflectance and F(R) is the Kubelka–Munk function. The band gap energies (Eg) were obtained from the plot of the modified K-M, [F(R)hυ]1/2 vs. the wavelength of the absorbed light for the indirect allowed transitions. Eg could also be calculated according to Equation (2):
Eg = hc/λ = 1240/λ
where Eg, h, c, λ are the band gap energy, Planck’s constant, light velocity (m/s), and wavelength (nm), respectively. A Varian, Cary 5000 UV-Visible-NIR Spectrometer (Oxford instruments, Abingdon, UK) was utilized to obtain the DR UV- Vis spectra of the synthesized samples.

2.4. Photocatalytic Study of Synthesized Rutile Titania Catalysts

The experimental apparatus was placed in a cylindrical quartz photo-reactor (HEBER SCIENTIFIC, Chennai, India, immersion type photoreactor) with 500 cm3 capacity, which was used for the degradation study of methylene blue to evaluate the photocatalytic activity of the prepared samples. About 50 mL of methylene blue aqueous solution was loaded into the quartz reactor. The solution was mixed with a catalyst that weighed approximately 0.05 g. Prior to the photocatalytic reaction, the reactor was kept stirring for 5 min and 5 mL of the solution was taken to assess the initial/zero hour concentration. The solution was irradiated using a Visible lamp (300 W, Visible, 230 V, AC, Philips, Shanghai, China). For the purpose of cooling the reaction system, the Pyrex vessel was filled with circulating water. The concentration of MB in the water was determined every 1 h using a UV-Visible spectrophotometer (Perkin Elmer, Waltham, MA, USA). The measurements were performed at the maximum characteristic absorption wavelength of methylene blue obtained at 663 nm.

3. Results

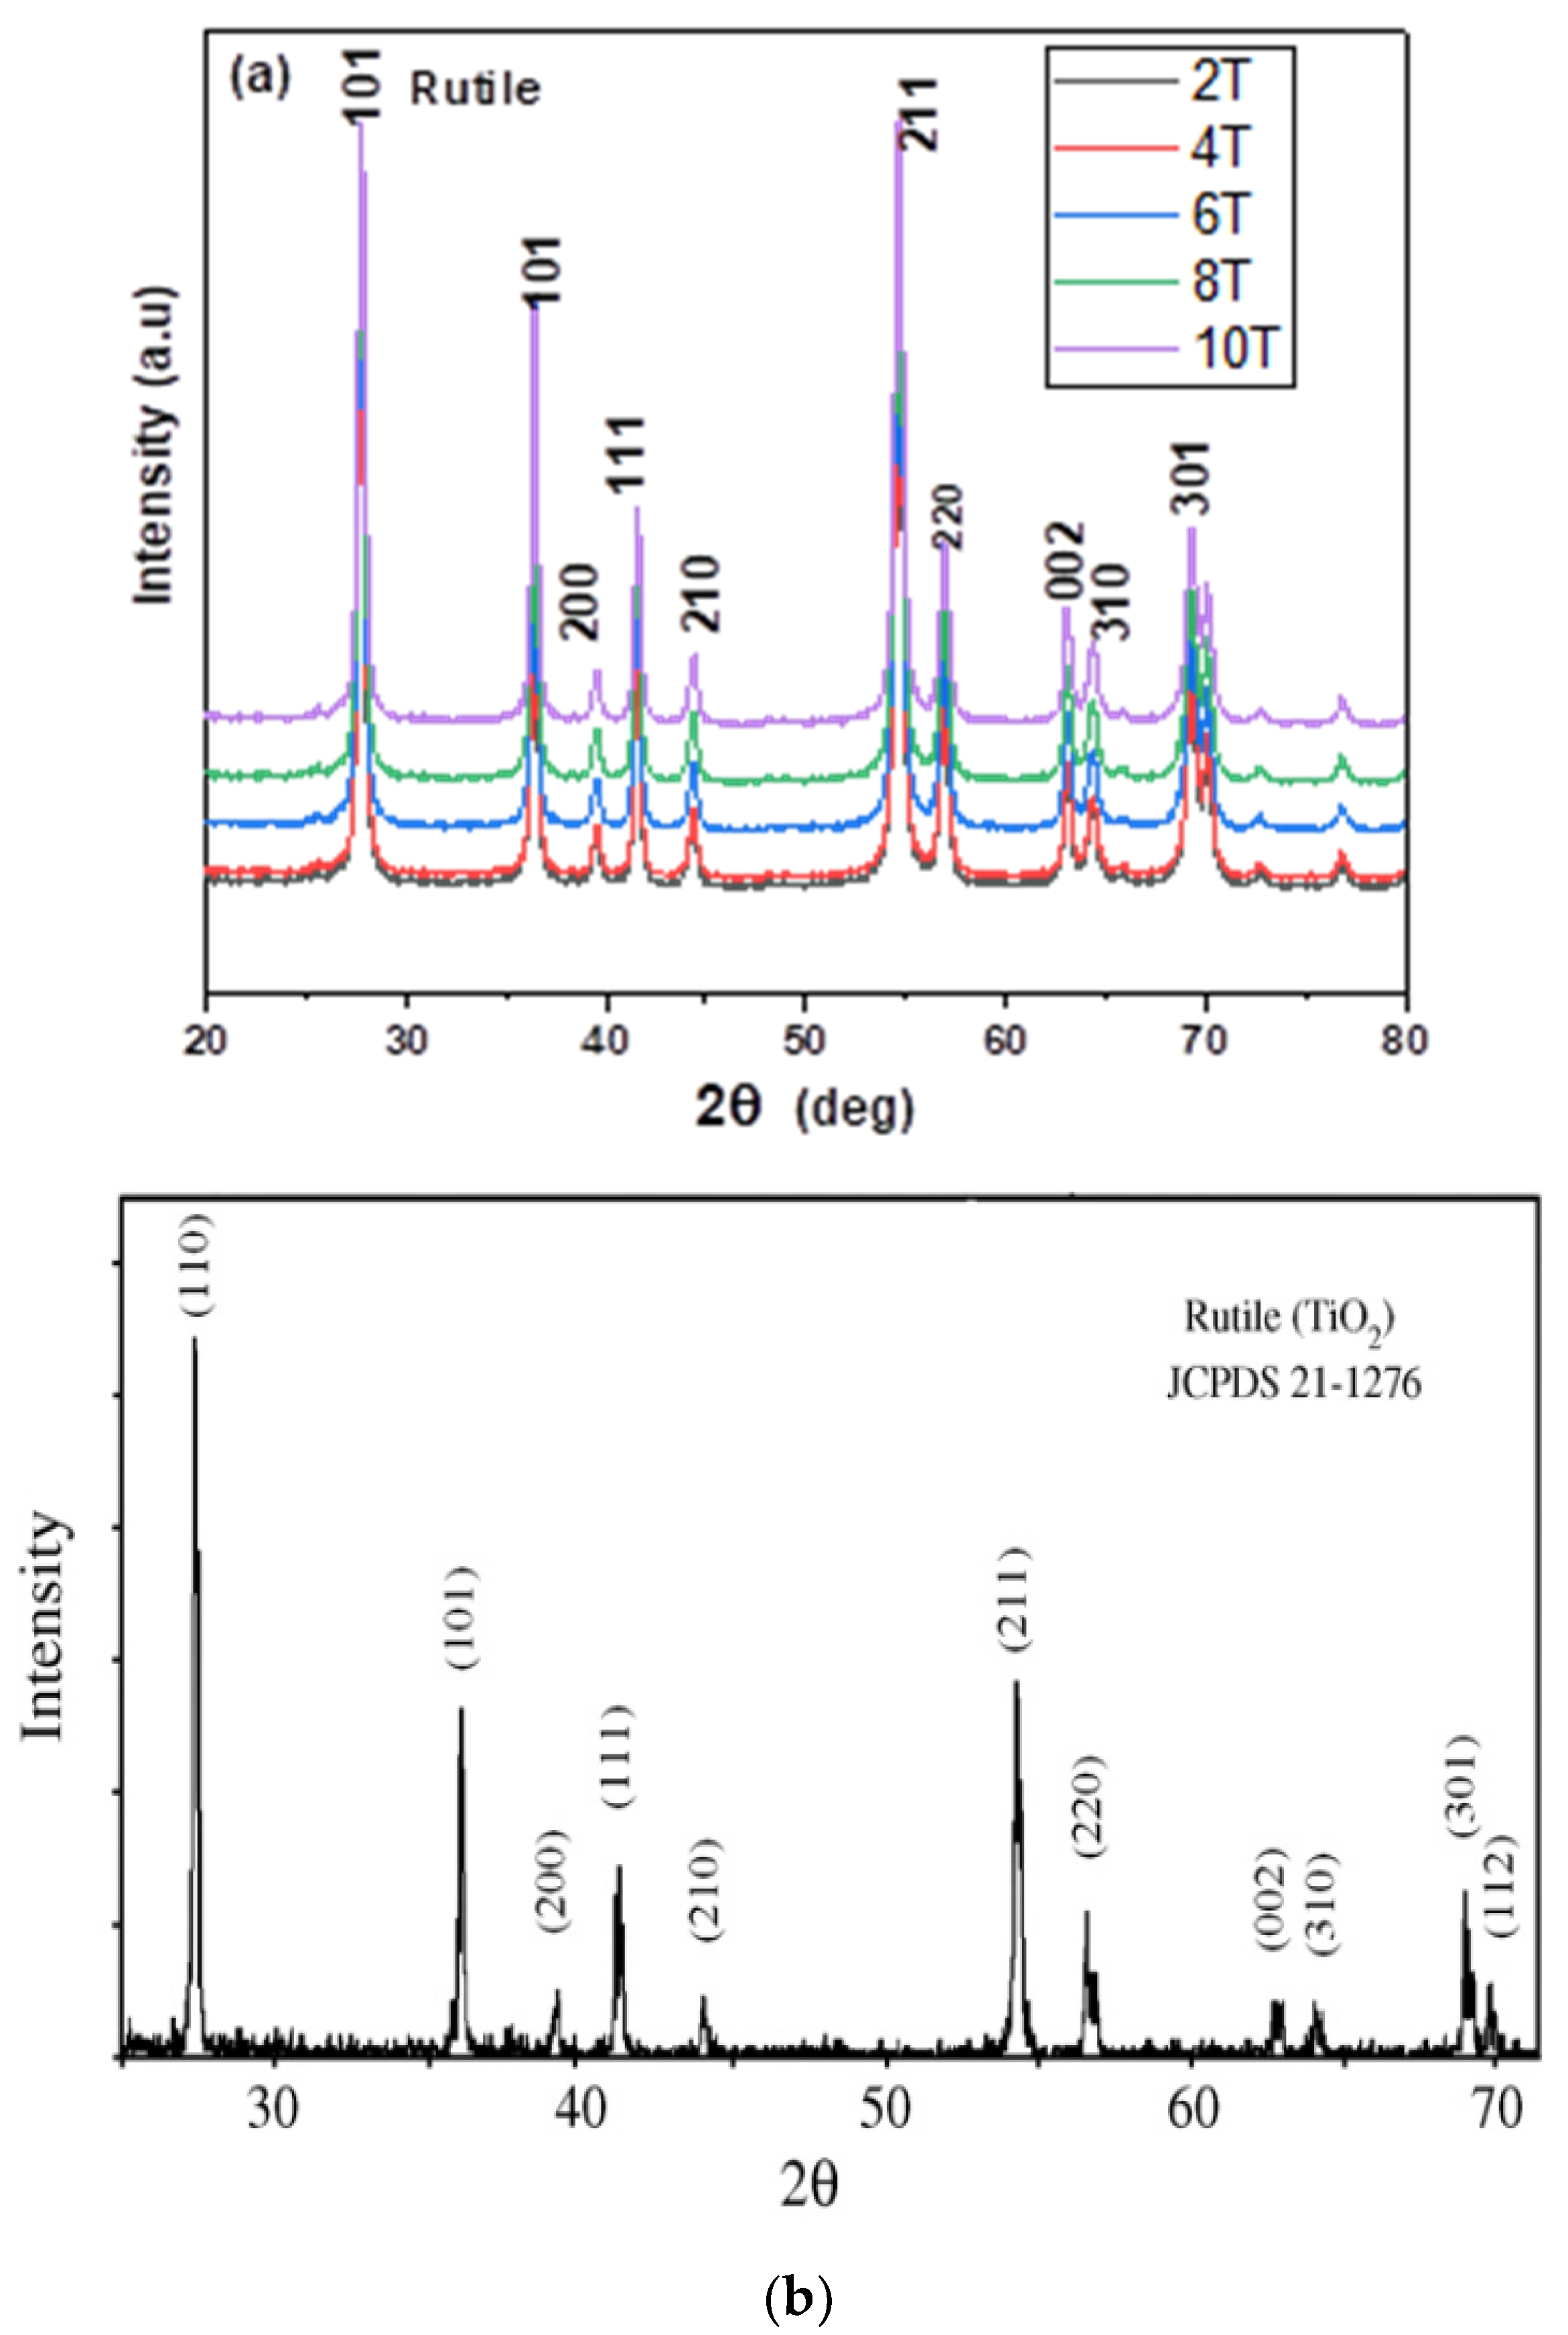
3.1. Crystallinity and Surface Area Characterization

The X-ray diffraction pattern showed high crystallinity with well-resolved feature characteristics that corresponded to rutile TiO2 (Figure 1). The XRD pattern obtained was in good agreement with the JCPDS file. Thus, the conditions of hydrothermal reactions followed in the present study were solely responsible for the formation of high pure phase formation [16,17]. Figure 1a shows the XRD pattern for rutile TiO2 and that the pattern obtained for 4T possessed peaks corresponding to the planes of TiO2 at 2ϴ = 27.4 (110), 36.0 (101), 39.1 (200), 41.2 (111), 44.0 (210), 54.3 (211), 56.6 (220), 62.7 (002), 64.0 (310) and 69.0 (301), respectively [18,19,20]. This pattern showed high crystallinity with well-resolved feature characteristics that corresponded to rutile TiO2, and the respective 2ϴ values were very well-matched with the 21-1276 JCPDS data [21]. All catalysts prepared via the nitric acid concentration route demonstrated the formation of similar XRD patterns with slight differences in terms of their crystalline intensity formation with respect to the increases in the concentration of nitric acid added during the synthesis process. Similar crystalline patterns were obtained for the rutile titania samples (2T to 10T). Figure 1b shows the reported refence XRD pattern of rutile titania with the 21-1276 JCPDS data and that the crystalline plane hkl values were very well matched with our prepared rutile titania sample [18,19,20]. The specific surface area of the prepared materials was determined using the Brunauer–Emmett–Teller (BET) method [21,22]. The BET surface area (BSA) of the hydrothermally prepared pure TiO2 was 105.5 m2/g, which was higher than the value of 53.6 m2/g obtained for commercially available TiO2 (Degussa P25 TiO2) [23,24,25].
Higher surface areas are useful in terms of the efficiency of photosensitive activity as they imply the presence of a larger contact surface area that is exposed to the reactants. The enhanced surface area particle sizes attained for the materials synthesized via the hydrothermal method under the desired conditions were compared with commercial titania (Degussa-P25). Table 2 shows the tabulated particle size and surface area (SA) values. The SA of the 8T (43 m2/g) and P25 was found to be comparatively lower compared to the 2T and 4T of rutile TiO2 prepared using the hydrothermal method. Decreased surface areas and increased particle sizes were obtained for higher concentrations of nitric acid added during the application of the hydrothermal method, which resulted in the formation of particles of large size in the cases of the 8T and 10T samples.

3.2. Morphology and Optical Property Characterization

In order to understand the morphology of the prepared materials, an investigation was conducted using an optical microscope. Images of the prepared rutile TiO2 obtained using the optical microscope are shown in the following figures (Figure 2a–e). Figure 2a,b shows the optical images of 2T and 4T of rutile titania prepared via the hydrothermal route, which appeared as irregular particles and non-uniformly shaped materials. However, in the case of images 6T to 10T (Figure 2c–e), the particles appeared to be more spherical in nature. The particles were not very clear since due to their very small sizes. In order to investigate the band structure or molecular energy levels of the synthesized samples, DR UV–Vis spectroscopy was utilized since the UV light excitation produced photo generated electrons and holes. Figure 3a shows the DR UV-Vis spectrum of hydrothermally prepared TiO2 that was calcined at 773 K. With the aid of a Tauc plot, the band gap energy was deduced utilizing the relation 1239.8/λ and Equations (1) and (2). In the DR UV-Vis spectrum, a broad strong absorption peak can be seen at 410 nm, which corroborates the bandgap value of 3.0 eV deduced from the expressions provided in Equations (1) and (2). This peak occurred as a result of charge transfer from the valence band, which basically comprised the 2p orbitals of the O2− ions of the conduction band, which was made of the 3d t2g orbitals of the Ti4+ cations [26,27].
To find out the bandgap value of as-prepared rutile titania nanoparticles, a Tauc plot was utilized in the present study. In order to determine the optical band gap of the as-prepared nanotubes that were thermally treated at 250 °C for 2 h, UV-Visible diffuse reflectance spectra were recorded (Figure 3a, inset). The 2T and 4T samples showed absorption peaks in the UV region. However, a red shift of the absorption edge (i.e., lower energy) was obtained. The indirect optical band gap energy of the rutile titania nanoparticles was calculated by plotting the function (F(R) hυ) 0.5 vs. hυ (Tauc plot) and extrapolating the linear part of the curve (Figure 3b). The Eg value obtained for the as-prepared sample was 2.6 eV (2T Rutile TiO2) and 2.3 eV (4T Rutile TiO2). The reductions in band gap values were due to the formation of oxygen and hydrogen vacancies, which induced defect states and reduced the bandgap of the rutile titania nanoparticles (Sun et al., 2015). The 4T exhibited two bandgap values (Figure 3b), suggesting the presence of at least two phases: one is major rutile phase formation and second is likely belongs to some sort of anatase phase of TiO2.
In general, two mixed phases are common in the case TiO2 materials. In the XRD, no major anatase peak, with higher intensity, was observed. Some unidentified peak, of lesser intense, was formed. However, 95% of the peaks of the as-synthesized 2T to 10T rutile TiO2 were consistent with the JCPDS data on rutile TiO2.
The prepared titania samples exhibited four active modes and A1g, B1g, B2g and Eg symmetry, and matched with the reported data on the single-crystal rutile TiO2 at 143 (B1g), 447 (Eg), 612 (A1g), and 826 (B2g) cm−1 [3]. In Figure 4, the two intense peaks at 443 (Eg) and 609 (A1g) cm−1 are comparable with that present in the rutile phase of single-crystal TiO2 [14,15]. The Raman peak at 233 cm−1 corresponds to the compound vibration peak that occurred due to the multiple phonon-scattering processes, and it is also considered to be a characteristic Raman peak of rutile-type TiO2. Additionally, a smaller peak is seen at the greater Raman shift of B1g (140 cm−1), which is in line with previous reports on the Raman characteristics of rutile TiO2 [12].
The Raman features of the rutile phase are far less widely characterized. A red shift, attributed to non-stoichiometric effects, was reported for the Eg rutile mode, and a random shift was reported for the A1g rutile mode (Figure 4). Thus, the Raman spectrum confirms the formation of rutile TiO2 under hydrothermal reaction conditions, as observed in the powder XRD pattern. As a result of the Ti–O stretching vibration, a band at ~469 cm−1 in the FT-IR spectrum was seen (Figure 5) [20]. The characteristic bonding vibration of the adsorbed water molecule was observed due to the existence of band at ~1640 cm−1. Because of the stretching vibrations of the –OH groups, bands were observed in the range of 3400–2750 cm−1. Additionally the existence of –OH groups on the surface was observed to be polar due to the bands that were noticed in the range of 3000–4000 and 1400–1700 cm−1. As a result of the CO2 vibration, a band was noticed at 2363 cm−1. The complete hydrolysis of titanium alkaloids to TiO2 nanoparticles over the course of calcination was ensured by the non-existence of characteristic peaks of the –OH groups in the 1200–1000 cm−1 band [20,21,22,23,24].
Figure 6 shows the scanning electron micrographs of the synthesized rutile titania nanoparticles of the (6T) samples treated through the acid route (Figure 6a). It shows that the group of titania nanoparticles formed cauliflower-shaped particles that split into individual nanorods of titania (Figure 6b). Figure 6c,d shows the rutile titania prepared with higher concentrations of added nitric acid followed by a hydrothermal treatment process. Figure 6c shows a highly magnified image of the formation of aggregated particles with un-uniform spherical cauliflower morphology, and Figure 6d shows the same sample at a higher magnification (10 µm scale). For comparison purposes, only 6M and 10M rutile samples prepared via the concentrated route are shown in Figure 6c,d; the preparation of all samples followed the same morphology, which was similar to that used to obtain the XRD patterns, and there were no significant differences in their crystalline and spherical morphologies after treatment with different concentrations of nitric acid. Increases in the acid concentration caused breakdowns in flower-shaped morphology, which can be observed in Figure 6d. In reports found in the literature, the rutile phase of the titania formation with cauliflower-shaped particles was not reported in detail [20,21,22,23]. The formation of a specific structural morphology due to the reaction conditions and the strong acid treatment caused such specific structures to occur for the as-synthesized pure rutile phase of the titania sample [23]. In optimized conditions, such as 4T, 6T and 8T, the shape of the cauliflower morphology stayed very uniform, and the increase in the concentration of nitric acid slightly disturbed uniform formation of the morphology.
Figure 7 shows the HR-TEM images at highly magnified regions of the as-prepared rutile TiO2 nanoparticles. The fine nanoparticle formation observed with uniform particle sizes in the form of fine sphere shapes of the rutile titania (6T) particle is shown in Figure 7a,b [24,25]. The as-prepared rutile TiO2 prepared at higher acid concentrations (8T) shrank the nanorod of titania particle, which is clearly visible in Figure 7b.

3.3. Photocatalytic Activity of Rutile TiO2 under Visible Light and Direct Sunlight Irradiation

In the coming section, the photo-light sensitivity and catalytic activity characteristics of the as-synthesized rutile titania are compared with those of a commercial TiO2 Degussa sample (P25). The present study highlights the catalytic characteristics of the as-prepared pure rutile phase titania in the presence of visible light and direct sunlight irradiation for the purpose of studying methylene blue dye degradation. Figure 8a shows the degradation of the MB solution in the presence of commercial Degussa P25 as a function of time. Degussa P25 shows activity due to the presence of 75% anatase phase mixed with rutile phase. The photocatalytic activity increased with respect to the irradiation time, and the degradation was analyzed using the absorbance spectrum. However, even after 5 h reaction time, the MB degradation was low and it showed considerably less intense absorption peaks in the UV-Vis spectrum when using P25 TiO2. Overall, the results show that the 4T sample 4T had the best catalytic activity.
Figure 8b shows the degradation of MB solution in the presence of 2T as a function of time. As the time increased, the degradation also increased. At 5h of visible light irradiation, improved MB degradation was achieved, as indicated by the absorption spectrum in Figure 8b. It shows comparatively a higher MB degradation rate as compared to P25. Figure 8c shows the degradation of the MB solution in the presence of 4T as a function of time. As the time increased, the degradation also increased. However, the degradation was improved and colorless dye solution was obtained, as compared to P25. Figure 8d shows the degradation of MB in the presence of 6T; the degradation increased as the time increased. The comparative MB degradation was lower for 2T as compared to 4T, 6T and 8T rutile titania in the presence of visible light irradiation.
Figure 9a depicts the degradation of the MB solution in the presence of 8T as a function of time. With increase in time, the degradation also surged. At 5 h, MB was more degraded, as indicated by the UV-Visible absorption spectrum. It shows a comparatively higher MB degradation rate as compared to P25. Thus, the prepared 10T rutile titania was actively photosensitive for MB degradation under visible light conditions. Figure 9b depicts the degradation of the MB solution in the presence of 10T as a function of time. With increase in time, the degradation also increased under visible light conditions. Figure 9c,d shows the MB degradation in the presence of direct sunlight and it shows the extra-ordinary catalytic activity that occurred under optimized reaction conditions. The catalyst prepared under the optimized acid concentration conditions of 4T and 6T played an important role in terms of structural morphology as well as photocatalytic activity. The degradation of MB occurred via the reaction of electrons and holes generated by the as-prepared rutile type photosensitive titania catalyst for MB degradation [26]. The fast degradation of MB occurred due to the effective absorption and utilization of visible light energy and, thus, reduced the electron–hole recombination. The faster reduction rate was the main reason for the enhanced photosensitive activity. The degradation of MB, using various concentration routes for prepared rutile TiO2 activity, gradually increased and, with higher concentrations of the nitric acid-treated catalyst TiO2 (10T), showed a decreasing trend. The as-prepared rutile TiO2 followed the order 2T < 4T > 6T < 8T > 10T. The fluctuations in the catalytic results were due to the surface functional group that was present on the surface of the TiO2 lattice, which depended on the optimized acid treatment process. In our case, 4T (4 M nitric acid) treatment provided the best catalytic activity. Figure 10 shows the schematic bar diagram image of the effect of visible light and sunlight irradiation on the as-prepared rutile titania photo catalysts. The rutile titania prepared via higher nitric acid-concentration routes of above 6 M, such as those used for 8T and 10T rutile titania, did not show considerable increases in dye degradation for methylene blue and showed lower performance than the titania catalysts prepared via the 4T and 6T routes. The as-prepared 4T and 6T rutile TiO2 showed complete color transformation and enhanced degradation in the case of direct sunlight irradiation.
No degradation was observed in the absorbance spectrum of a blank MB solution, without any photosensitive material, which was maintained in the dark. The reduction in the concentration of MB under sunlight and visible-light irradiation, and the presence of the synthesized samples, ensured the photosensitive activity of rutile TiO2 due to the generation of active catalytic sites as a result of nitric acid treatment in hydrothermal conditions. Figure 11a shows the kinetic evaluation of MB dye degradation using kinetic models such as Langmuir and Freundlich isotherms. The adsorbent and adsorbate behaviors on the catalyst surface can be analyzed using the kinetic parameters obtained from the two different models [24]. The tables in Figure 11c,d reveal that the reaction rate depended purely on the concentration of MB and was directly proportional to the higher degradation efficiency. At higher MB dye solution concentrations, the absorption capacity (qe) of the catalyst increased. The R2 value was accurate for the MB concentration of 750 ppm compared with the other concentrations. The calculated slope and intercept parameters of the absorption capacity for the MB concentration are given in Figure 11c,d.
At high concentrations of the dye compound, from 500 to 1500 mg/L, a gradual decrease in the rutile titania catalyst was observed. By increasing the concentration of the dye from 1000 to 1500 mg/L, the reactivity decreased linearly. The above kinetic models and parameters suggest that the MB dye degradation followed a pseudo-second order reaction. Moreover, dye solution concentrations below 1000 mg/L provided effective degradation rates and efficient results in the presence of the as-prepared rutile TiO2.
Insights regarding the mechanisms of various rutile titania catalysts prepared using nitric acid concentration methods are demonstrated below, and show the effective degradation rates attained under direct sunlight irradiation instead of conventional UV or controlled visible light irradiation. The uniform textural and flower-shaped structural properties of the as-prepared rutile titania was the main reason for the effective photo light absorption and enhanced the photosensitive property. It is plausible that the mechanism, due to the O2 and the OH radicals and in the aqueous medium, can efficiently react with the dye pollutants, and that the ejection of electrons and the creation of holes in the valence band and conduction band is directly proportional to the reduced band gap value of the synthesized rutile titania photocatalysts. In the present method, the pure rutile phase of TiO2 prepared by 4 M HNO3 (4T) and (6T) could produce efficient dye degradation results due to the enriched presence of surface-bound OH species on the surface of the cauliflower-shaped titania particles [26,27]. The increase in surface-active sites with flower-like morphology enhanced the electron–hole recombination rate and showed higher efficiency. The optimized concentration of rutile titania prepared via the 4T and 6T HNO3 routes caused the complete degradation of the dye molecules into non-toxic substances. The photosensitive response of rutile TiO2 is represented in Figure 12.

4. Conclusions

Owing to the simplicity and versatility that was achieved for the process of treating acids of different concentrations, the adopted hydrothermal method was optimized for the production of the pure phase of rutile titania. The XRD and HR-TEM images clearly confirmed the formation of pure rutile phase with uniform cauliflower-shaped morphology under optimized conditions. The specific surface area and cauliflower-like morphology further demonstrated the improved direct sunlight sensitivity and generation of catalytic active sites in the structure of rutile titania. The as-prepared 4T, 6T and 8T rutile TiO2 samples, which were further explored due to their solar harvesting ability, showed higher concentrations of methylene blue dye degradation. In future, the enhanced photosensitivity obtained as a result of the tailored textural and uniform morphology of rutile TiO2 materials prepared by means of a hydrothermal method under harsh (strong acid) conditions, and the as-prepared rutile TiO2, could be utilized in coating applications for solar energy harvesting purposes in various industrial hybrid applications.

Author Contributions

Conceptualization, J.R.R. and H.A.A.-L.; methodology, J.R.R. and D.M.A.-d.; validation, C.S.D., S.K.K.P. and Z.A.I.; formal analysis, Z.A.I.; investigation, S.M.; resources, C.S.D.; data curation, S.A. and D.M.A.-d.; writing—original draft preparation, J.N.A. and S.M.; writing—review and editing, J.R.R.; visualization, J.R.R. and S.M.; supervision, J.R.R. and H.A.A.-L.; funding acquisition, H.A.A.-L. All authors have read and agreed to the published version of the manuscript.

Funding

The authors thank the Research Support Project number: (RSP-2021/54) for financial support, and also thank King Saud University, Riyadh, Saudi Arabia.

Institutional Review Board Statement

Not applicable.

Informed Consent Statement

Not applicable.

Data Availability Statement

Data is contained within the article.

Acknowledgments

The authors acknowledge the Researchers Supporting Project Number (RSP-2021/54) King Saud University, for financial supports, Riyadh, Saudi Arabia.

Conflicts of Interest

The authors declare no conflict of interest.

References

  1. Su, R.; Christensen, M.; Shen, Y.; Kibsgaard, J.; Elgh, B.; Vang, R.T.; Bechstein, R.; Wendt, S.; Palmqvist, A.; Iversen, B.B.; et al. Rapid synthesis of porous, mixed phase titania films with tailored orientation of rutile for enhanced photocatalytic performance. J. Phys. Chem. C 2013, 117, 27039–27046. [Google Scholar] [CrossRef]
  2. Veréb, G.; Manczinger, L.; Bozsó, G.; Sienkiewicz, A.; Forró, L.; Mogyorósi, K.; Hernadi, K.; Dombi, A. Comparison of the photocatalytic efficiencies of bare and doped rutile and anatase TiO2 photocatalysts under visible light for phenol degradation and E. coli inactivation. Appl. Catal. B: Environ. 2013, 129, 566–574. [Google Scholar] [CrossRef]
  3. Ramalingam, R.J.; Munirah D., A.; Al-Lohedan, H.A.; Prabhakarn, A.; Kandasamy, T.; Jimmy Nelson, A. Preparation, characterization and Morphologies insights of ZnO nanodisk–TiO2-coated SWCNT thin film composites for catalytic sensor application, surface and interface analysis. Surf. Interface Anal. 2021, 53, 395–405. [Google Scholar] [CrossRef]
  4. Nithya, N.; Bhoopathi, G.; Magesh, G.; Kumar, C.D.N. Neodymium doped TiO2 nanoparticles by sol-gel method for antibacterial and photocatalytic activity. Mater. Sci. Semicond. Process. 2018, 83, 70–82. [Google Scholar] [CrossRef]
  5. Wang, Y.; Cheng, H.; Hao, Y.; Ma, J.; Li, W.; Cai, S. Preparation, characterization and photoelectrochemical behaviors of Fe(III)-doped TiO2 nanoparticles. J. Mater. Sci. 1999, 34, 3721–3729. [Google Scholar] [CrossRef]
  6. Zhang, P.; Yin, S.; Sato, T. Synthesis of iron-containing nitrogen-doped titania by hydrothermal method and its photocatalytic activity. Res. Chem. Intermed. 2011, 37, 479–485. [Google Scholar] [CrossRef]
  7. Anju, K.; Thankapan, R.; Rajabathar, J.R.; Al-Lohedan, H.A. Hydrothermal synthesis of nanosized (Fe, Co, Ni)-TiO2 for enhanced visible light photosensitive applications. Optik 2018, 165, 408–415. [Google Scholar] [CrossRef]
  8. Ramalingam, R.J.; Shukla, A.K.; Kombaiah, K.; Vijaya, J.J.; Tawfeek, A.M. Synthesis, characterization and optical properties of sulfur and fluorine doped ZnO nanostructures for visible light utilized catalysis. Optik 2017, 148, 325–331. [Google Scholar] [CrossRef]
  9. Latha, P.; Prakash, K.; Karuthapandian, S. Effective photodegradation of CR & MO dyes by morphologically controlled cerium oxide nanocubes under visible light illumination. Optik 2018, 154, 242–250. [Google Scholar] [CrossRef]
  10. Da Silva, E.P.; Rubira, A.F.; Ferreira, O.P.; Silva, R.; Muniz, E.C. In situ growth of manganese oxide nanosheets over titanium dioxide nanofibers and their performance as active material for supercapacitor. J. Colloid Interface Sci. 2019, 555, 373–382. [Google Scholar] [CrossRef] [PubMed]
  11. Ohno, T.; Lee, S.Y.; Yang, Y. Fabrication of morphology-controlled TiO2 photocatalyst nanoparticles and improvement of photocatalytic activities by modification of Fe compounds. Rare Met. 2015, 34, 291–300. [Google Scholar] [CrossRef] [Green Version]
  12. Lin, X.; Sun, M.; Gao, B.; Ding, W.; Zhang, Z.; Anandan, S.; Umar, A. Hydrothermally regulating phase composition of TiO2 nanocrystals toward high photocatalytic activity. J. Alloys Compd. 2021, 850, 156653. [Google Scholar] [CrossRef]
  13. George, J.; Gopalakrishnan, C.; Manikuttan, P.; Mukesh, K.; Sreenish, S. Preparation of multi-purpose TiO2 pigment with improved properties for coating applications. Powder Technol. 2021, 377, 269–273. [Google Scholar] [CrossRef]
  14. Kumari, K.; Reeshma, R.; Arunkumar, D.; Meti, S.; Rahman, M. Fabrication of Ag/PDMS-TiO2 flexible piezoresistive pressure sensor. Phys. B Condens. Matter 2020, 597, 412386. [Google Scholar] [CrossRef]
  15. Kumar, R.; El-Shishtawy, R.M.; Barakat, M.A. Synthesis and characterization of Ag-Ag2O/TiO2@polypyrrole heterojunction for enhanced photocatalytic degradation of methylene blue. Catalysts 2016, 6, 76. [Google Scholar] [CrossRef]
  16. Hamed, N.; Ahmad, M.; Hairom, N.H.H.; Faridah, A.; Mamat, M.; Mohamed, A.; Suriani, A.; Nafarizal, N.; Fazli, F.; Mokhtar, S.; et al. Dependence of photocatalysis on electron trapping in Ag-doped flowerlike rutile-phase TiO2 film by facile hydrothermal method. Appl. Surf. Sci. 2020, 534, 147571. [Google Scholar] [CrossRef]
  17. Suzuki, H.; Awa, K.; Naya, S.-I.; Tada, H. Heat treatment effect of a hybrid consisting of SnO2 nanorod and rutile TiO2 with heteroepitaxial junction on the photocatalytic activity. Catal. Commun. 2020, 147, 106148. [Google Scholar] [CrossRef]
  18. Ramalingam, R.J.; Radhika, T.; Ranjan, P.R.; Sayed, S.R.; Al-Lohedan, H.A.; Moydeen, A.M.; Al-Dhayan, D.M. Platinum nanoparticle decorated rutile titania synthesized by surfactant free hydrothermal method for visible light catalysis for dye degradation and hydrogen production study. Int. J. Hydrog. Energy 2019, 44, 23959–23968. [Google Scholar] [CrossRef]
  19. Morad, I.; Alshehri, A.; Mansour, A.; Wasfy, M.; El-Desoky, M. Facile synthesis and comparative study for the optical performance of different TiO2 phases doped PVA nanocomposite films. Phys. B Condens. Matter 2020, 597, 412415. [Google Scholar] [CrossRef]
  20. Lin, Y.; Jiang, Z.; Zhu, C.; Zhang, R.; Hu, X.; Zhang, X.; Zhu, H.; Lin, S.H. The electronic structure, optical absorption and photocatalytic water splitting of (Fe + Ni)-codoped TiO2: A DFT + U study. Int. J. Hydrog. Energy 2017, 42, 4966–4976. [Google Scholar] [CrossRef]
  21. Hamed, A.; Mahyar, M.; Razieh, K.; Sadrnezhaad, S.K. Sonochemical preparation of TiO2 nanoparticles. Mater. Lett. 2007, 61, 4561. [Google Scholar]
  22. Mousavi, D.-S.; Asen, P.; Shahrokhian, S.; Irajizad, A. Three-dimensional hybrid of iron–titanium mixed oxide/nitrogen-doped graphene on Ni foam as a superior electrocatalyst for oxygen evolution reaction. J. Colloid Interface Sci. 2020, 563, 241–251. [Google Scholar] [CrossRef] [PubMed]
  23. Tiwari, A.; Shukla, A.; Choi, S.S.; Lee, S.-M. Surface modified nanostructured-TiO2 thin films for removal of Congo red. Korean J. Chem. Eng. 2018, 35, 2133–2137. [Google Scholar] [CrossRef]
  24. Park, H.-G.; Kim, J.I.; Kang, M.; Yeo, M.-K. The effect of metal-doped TiO2 nanoparticles on zebrafish embryogenesis. Mol. Cell. Toxicol. 2014, 10, 293–301. [Google Scholar] [CrossRef]
  25. Guo, L.; Zhang, K.; Han, X.; Zhao, Q.; Wang, D.; Fu, F.; Liang, Y. Highly efficient visible-light-driven photo-Fenton catalytic performance over FeOOH/Bi2WO6 composite for organic pollutant degradation. J. Alloys Compd. 2020, 816, 152560. [Google Scholar] [CrossRef]
  26. Djellabi, R.; Ghorab, M.; Cerrato, G.; Morandi, S.; Gatto, S.; Oldani, V.; Di Michele, A.; Bianchi, C. Photoactive TiO2–montmorillonite composite for degradation of organic dyes in water. J. Photochem. Photobiol. A Chem. 2014, 295, 57–63. [Google Scholar] [CrossRef] [Green Version]
  27. Ye, P.; Wu, M.M.; Wei, M.; Yang, Z.; Han, Q.F. Preparation, Characterization and Properties of BiOCl1-xIx and BiOBr1-xIx Solid Solution, Guang Pu Xue Yu Guang Pu Fen Xi/Spectroscopy Spectr. Analysts 2019, 39, 2443–2449. [Google Scholar] [CrossRef]
Figure 1. (a) XRD pattern of the concentrations of nitric acid in acid-treated rutile TiO2 prepared using the hydrothermal method (2T-10T); (b) reference XRD pattern with JCPDS data on the crystalline structure of rutile TiO2. Reprinted with permission from ref. [21]. Copyright 2007 Elsevier License Terms And Conditions.
Coatings 11 01150 g001
Figure 2. Optical images of (a) 2T, (b) 4T, (c) 6T, (d) 8T and (e) 10T.
Coatings 11 01150 g002
Figure 3. DRS-UV spectrum of (a) absorbance and (b) the (αhυ)0.5 vs. hv plot.
Coatings 11 01150 g003
Figure 4. Raman Spectra of rutile TiO2 (4T).
Coatings 11 01150 g004
Figure 5. FT-IR spectra of rutile TiO2 (4T).
Coatings 11 01150 g005
Figure 6. (a,b) SEM image magnifications of rutile titanium oxide prepared by means of the 6 M nitric acid treatment method (6T) at higher and lower magnification scale values. (c,d) Rutile titania (10T) prepared using the 10 M nitric acid treatment method.
Coatings 11 01150 g006
Figure 7. (a) HR-TEM images of rutile TiO2 (6T) prepared by means of the hydrothermal method; (b) HR-TEM images of rutile TiO2 (8T) prepared using the hydrothermal method.
Coatings 11 01150 g007
Figure 8. (a) Reaction conditions: P25—0.05 g; MB—0.001 g; time—5 h. (b) Reaction conditions: degradation of MB using 2T titania—0.0502 g; MB—0.0010 g; time—5 h. (c) Reaction conditions: degradation of MB using 4T—0.0500 g; MB—0.0010 g; time—5 h. (d) Degradation of MB using 6T, catalyst weight: 0.0522 g; MB—0.0010 g; time—5 h.
Coatings 11 01150 g008
Figure 9. (a) MB using 8T. Reaction conditions: 8T—0.050 g; MB—0.001 g; time—5 h. (b) Reaction conditions: 10T—0.0517 g; MB—0.0010 g; time—5 h. (c) Reaction conditions: 4T—0.05 g; MB—0.001 g; time—4 h. (d) Reaction conditions: 6T—0.05 g; MB—0.001 g; time—4 h.
Coatings 11 01150 g009
Figure 10. The MB degradation efficiency at rutile TiO2 catalyst prepared via different routes at 500 mg/L MB concentration.
Coatings 11 01150 g010
Figure 11. Kinetic evaluation of different concentrations of MB degradation under two rutile titania catalysts prepared using different acid treatments. (a) Langmuir kinetic isotherm (b) Freundlich isotherm (c) Langmuir kinetic study at various concentration effect (d) Freundlich kinetic study at various concentration effect (e) kinetic parameter derived from Langmuir curve at different concertation (f) kinetic parameter derived from Freundlich curve at different concertation.
Coatings 11 01150 g011
Figure 12. Schematic image of MB degradation under sunlight irradiation and the possible formation of side products.
Coatings 11 01150 g012
Table 1. Materials prepared using the hydrothermal method.
S. No.Concentration of HNO3 (M)Temperature (K), Time (hours)Sample
Identification
1.2453, 22T
2.4453, 24T
3.6453, 26T
4.8453, 28T
5.10453, 210T
Table 2. BET surface area values of the rutile phase TiO2 samples.
Sl. No.MaterialBET Surface Area (m2/g)Particle Size (nm)
1.TiO2 (Commercial-P25)~5026.5
2.TiO2 (2T)11014.9
3.TiO2 (4T)78.320.3
4.TiO2 (6T)49.032.5
5.TiO2 (8T)43.557.4
Publisher’s Note: MDPI stays neutral with regard to jurisdictional claims in published maps and institutional affiliations.

