Article

Numerical Analysis of the Interactions between Plasma Jet and Powder Particles in PS-PVD Conditions

1
State Key Laboratory for Mechanical Behavior of Materials, School of Materials Science and Engineering, Xi’an Jiaotong University, Xi’an 710049, China
2
Institute for Research on Ceramics (IRCER), CNRS-University of Limoges, 87068 Limoges, France
*
Author to whom correspondence should be addressed.
Coatings 2021, 11(10), 1154; https://doi.org/10.3390/coatings11101154
Submission received: 30 August 2021 / Revised: 16 September 2021 / Accepted: 20 September 2021 / Published: 24 September 2021
(This article belongs to the Special Issue Plasma Sprayed Coatings)

Abstract

:
Plasma spray-physical vapor deposition (PS-PVD) refers to a very low-pressure (~100 Pa) deposition process in which a powder is injected in a high-enthalpy plasma jet, and mostly vaporized and recondensed onto a substrate to form a coating with a specific microstructure (e.g., columnar). A key issue is the selection of the powder particle size that could be evaporated under specific spray conditions. Powder evaporation takes place, first, in the plasma torch between the injection location and nozzle exit and, then, in the deposition chamber from the nozzle exit to the substrate location. This work aims to calculate the size of the particles that can be evaporated in both stages of the process. It deals with an yttria-stabilized zirconia powder and two commercial plasma torches operated at different arc powers with gas mixtures of argon and helium or argon and hydrogen. First, it used computational fluid dynamics simulations to calculate the velocity and temperature fields of the plasma jets under very low-pressure plasma conditions. Then, it estimated the evaporation of the particles injected in both plasma jets assuming an isothermal evaporation process coupled with momentum and heat transfer plasma-particle models in a rarefied plasma. The calculations showed that, for different powers of the Ar–H2 and the Ar–He operating conditions of this study, the heat flux from the plasma jet to particles inside the torch is much higher than that transferred in the deposition chamber while the specific enthalpy transferred to particles is comparable. The argon-helium mixture is more efficient than the argon-hydrogen mixture to evaporate the particles. Particles less than 2 μm in diameter could be fully evaporated in the Ar–He plasma jet while they should be less than 1 µm in diameter in the Ar–H2 plasma jet.

1. Introduction

Plasma spray-physical vapor deposition (PS-PVD) is a surface engineering process that makes it possible to elaborate coatings with different microstructures [1,2,3,4,5]: columnar thermal barrier coatings (TBCs) with high strain tolerance [6,7,8], dense electrolyte layer for solid oxide fuel cells (SOFC) or gas separation membranes, and so on [9]. The process is operated at very low pressure (50–200 Pa). It aims to combine the principle of a plasma spray technique (injection of a powder in a direct current (DC) plasma jet) and that of physical vapor deposition (coating essentially made by condensation from the vapor phase to the solid phase). It also benefits from the high deposition rate of plasma spraying. Because of the very low chamber pressure in PS-PVD [10], the plasma jet may extend up to 2 m in length and 200–400 mm in diameter. However, under such pressures the momentum and heat transfer between the plasma flow and particles is reduced due to the rarefaction effect. Therefore, the melting and full evaporation of the coating powder is much more difficult than under conventional air plasma spray conditions [11,12,13].
To improve the heating and evaporation of the powders in the very low-pressure plasma jet and achieve coating by condensation from the vapor phase, different methods are proposed in the literature. The straightforward method is to increase the electric power of the plasma torch. For instance, Song et al. by combined two commercial plasma torches and developed an axial bi-cathode plasma torch with axial powder injection that reaches an electric power of about 80 kW [14]. Commercial high-power plasma torches (e.g., O3CP torch from Oerlikon Metco), generally used with a mixture of argon and helium or argon and hydrogen as plasma-forming gas, are operated at power up to ~180 kW to vaporize the processed powder [15]. Another method proposed by Chen et al., used a mechanical shroud of the plasma jet issuing from the torch to restrain its radial expansion and increase the plasma gas density and the plasma-particle interactions [16,17].
Furthermore, specific powders have been developed: e.g., spray-dried powder 6700 from Oerlikon Metco (Figure 1) with particle size smaller than 20–25 µm. The particles are weakly agglomerated and break when injected in the plasma torch to release the sub-micron primary particles that can be more easily evaporated.
Different numerical simulations have made it possible to better understand the evaporation of these particles and the link with the coating microstructure under PS-PVD conditions. Mauer et al. [12,18] explained that the models used for investigating the acceleration and heating of particles under atmospheric plasma conditions could not be applied in the free molecular flow that prevails in the torch nozzle. Using the model proposed by Chen for particles injected in a rarefied plasma flow [19,20,21,22,23,24], Mauer [12] concluded that “the feedstock treatment along the very first trajectory segment between injector and jet expansion plays a key role”. He found that with an Ar (35 slm)-He (60 slm) plasma jet at a net power of 60 kW, YSZ particles up to 0.92 µm in diameter could be evaporated in the torch nozzle while with an Ar (100 slm)/H2 (10 slm) plasma jet only particles up to 0.55 µm in diameter could be evaporated. Anwaar et al. [25] with a similar model predicted that the size of the particles that could be evaporated between the injection location and plasma torch nozzle exit ranged between 0.65 and 1.5 µm when the net power of the plasma torch was varied between 50 and 70 kW.
However, Liu et al. [26] noticed that, if the heat flux transferred to the particles in the plasma jet issued from the torch is one to two orders of magnitude lower than that in the nozzle, the trajectory of the particles in the open plasma jet is much longer than in the nozzle. Therefore, the heating of the particles in the low-pressure chamber cannot be ignored. This was also confirmed by the work of Chen et al. [17] that compared the microstructure of coatings obtained with and without plasma jet shrouding in the deposition chamber. Therefore, to determine the optimal particle size for particle evaporation and an operating window to achieve a specific coating microstructure with a given plasma torch, it is necessary to estimate the vaporization rate both in the torch nozzle and deposition chamber. The problem is then to calculate the temperature and velocity fields of the plasma jet in the low-pressure (<200 Pa) chamber. A recent study showed that computational fluid dynamics (CFD) could be used under PS-PVD conditions provided that the plasma net power is high enough [27,28] as no continuum breakdown was noticed under such conditions.
To determine the size of the particles that can be evaporated in the whole PS-PVD process (in the torch nozzle and deposition chamber) operated with different plasma gas mixtures (Ar–H2 and Ar–He) at torch net powers higher than 40 KW, this study used a CFD approach combined with a model of particle dynamics and evaporation. The latter model used the Chen approach [19,20,21,22,23,24] to calculate the heat transfer to a particle exposed to a rarefied plasma flow.

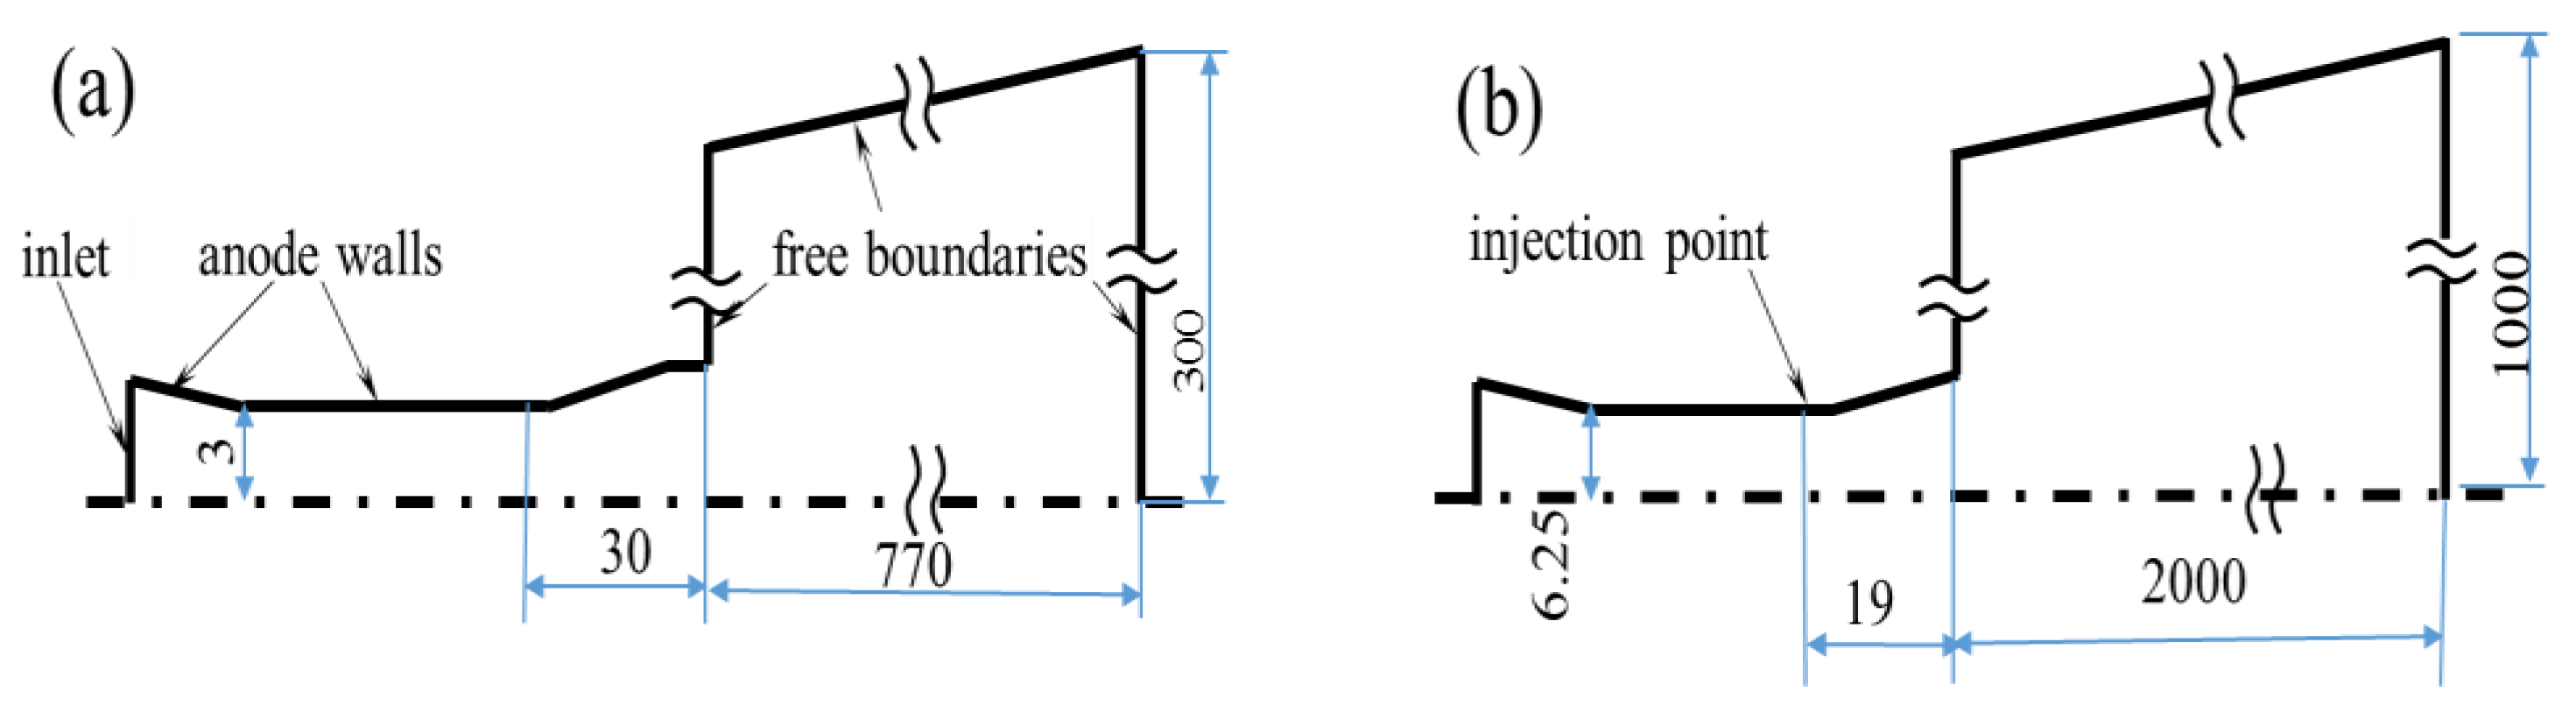
2. Operating Conditions

The current PS-PVD systems are operated with a wide range of plasma arc power from 20 to 180 kW and mixtures of argon and hydrogen or argon and helium [29,30], the secondary gas making it possible to increase the specific enthalpy and thermal conductivity of the plasma gas.
In this work, two commercial plasma torches (F4 and O3CP from Zurich, Switzerland), often used in PS-PVD, were selected with the operating conditions showed in Table 1. These plasma conditions were chosen from the conditions recommended by the torch manufacturer thanks to some experimental optimization tests.

3. Numerical Model

3.1. Plasma Jet Modeling

The physical processes being modelled are overly complex under PS-PVD conditions. Hence, the models require many simplifying assumptions. It is needed to strike a balance between the level of accuracy required for the results and the complexity level of the model. The main assumptions used in this study are listed below. A two-dimensional axi-symmetrical and compressible flow model was used to calculate the plasma jet characteristics in both the plasma torch and very low-pressure deposition chamber. As the particles are supposed to follow the plasma jet axis as explained in the next section, and a previous study [31] showed that the plasma jet in the deposition chamber does not show 3D effect, a 2D model of the plasma flow was assumed sufficient for this study.
The plasma was supposed optically thin and in local thermodynamic equilibrium (LTE). The plasma generation in the torch was modeled with the volume power method described by Mariaux et al. [32]. The plasma properties were a function of temperature and pressure. The effect of the powder vapor on the gas properties was neglected as the study deals with isolated particles and not with an actual powder with a given particle size distribution.
The set of discretized Reynolds-averaged Navier–Stokes equations was solved with the CFD code Fluent.17 (ANSYS, Inc., Canonsburg, PA, USA) using the density-based solver for high-speed compressible flows, an implicit numerical scheme, a time-derivative preconditioning algorithm-AUSM and the shear–stress transport (SST) k-ω model of turbulence. The latter was chosen because of its ability to control the production and dissipation of turbulent energy at low Reynolds numbers, and, especially, in the viscous sublayer of near-wall regions without using near-wall laws. The model is described in detail in [27,28,33].
The computational domains are shown in Figure 2. They included the nozzle-anode of the plasma torch and a conical frustum that corresponded to the expansion of the plasma jet in the deposition chamber [27,28].

3.2. Particle Dynamics and Heating

The processing of particles under PS-PVD conditions involves (i) the injection and breaking of the agglomerated particles inside the plasma torch nozzle, (ii) the acceleration and (iii) heating, melting and evaporation of the primary particles released by the agglomerated particles. The objective of the calculation, as explained in the introduction, is to determine the maximum size of YSZ particles that can be evaporated under specific plasma conditions. To do this, this study did not consider a powder characterized by a particle size distribution; it considered one particle of a specific size, whose trajectory in the plasma jet from the injection point is on the plasma jet axis. The particle was injected into the plasma jets whose temperature and velocity fields were computed by the CFD model presented in Section 3.1.
The velocity, time of flight and evaporation of the particles were calculated with the approach proposed by Chen et al. for particles processed in plasma jets under rarefaction conditions. The Knudsen number (Kn) can be used to define the rarefaction of a flow. It is defined as the ratio of the molecular mean free path to a characteristic physical length scale (diameter of the particle in this study). Actually, under PS-PVD conditions, the pressure drops rapidly from the powder injection point (20–25 kPa) inside the torch nozzle to the deposition chamber (<200 Pa). Under such pressure conditions, the mean free path length of the plasma elementary particles (ions, molecules, atoms and electrons) is large in comparison with the powder particle diameter (sub-micron scale) [12,34] and Kn > 10. The processing of the powder in the plasma jet is affected by the rarefaction effect. The rarefaction or Knudsen effect, represented by Knudsen number, for which the Navier–Stokes equations and the Fourier heat conduction equation break down, may cause the flow and heat transfer behavior to change considerably by moving particles injected into the plasma jet.
Therefore, the velocity, time of flight and evaporation of the particles were calculated with the approach proposed by Chen et al. for particles processed in plasma jet under rarefied plasma conditions [19,20,21,22,23,24]. It makes it possible to calculate the drag force exerted by the plasma jet on the powder particles, and the plasma-particle heat transfer [12,25]. The calculations were based on the following assumptions drawn from [12,19,20,21,22,23,24,25]:
(1)
The powder particles are spherical; their size is much larger than the mean free path length of the plasma particles; the thickness of the plasma sheath around the particles is much less than their diameter;
(2)
The plasma consists of atoms, singly ionized ions, and electrons that follow a Maxwell velocity distribution function;
(3)
Electron emission and radiation from the powder particle surface are neglected;
(4)
Ions colliding with the particle surface recombine with electrons emitted by the surface and electrons colliding with the particle surface are absorbed by the surface;
(5)
Complete diffuse reflection is assumed for all atoms leaving the particle surface;
(6)
The effect of powder particle evaporation on the drag force exerted by the gas flow and plasma heat transfer is not taken into account;
(7)
The powder particle surface has a steady floating potential.
If the drag force, FD, is supposed to be the only force exerted on the particle, the velocity of the particle can be calculated from Equation (1):
m p d v p d t = F D
where m p and v p are the mass and velocity of the particle, respectively.
The drag force is a function of the size of the particle, relative velocity between gas flow and particle and, properties of the fluid. These properties are expressed through the drag coefficient CD.
F D = C D π d p 2 4 ρ v rel 2 2
where dp is the particle diameter, ρ is the density of the fluid and v rel   is the relative velocity between the plasma flow and particles.
Equation (1) can, thus, be written as:
m p d v p d t = F D = m p v p d v p d x = C D π d p 2 ρ v rel 2 8
If the gas velocity and density as well as the drag coefficient are assumed constant, Equation (3) can be easily integrated and yields [35]:
v p = v 3 ρ x C D 2 ρ p d p
where v is the gas velocity and x the distance traveled from the particle since the injection point.
Chen et al. showed that under the assumptions listed above, the drag coefficient, CD, can be expressed as [20,23]:
C D = 2 ( S h 4 + S h 2 1 / 4 S h 4 e r f ( S h ) + 1 + 2 S h 2 2 S h 3 π exp ( S h 2 ) + π 3 S h T w T h )
where T w and T h are the powder particle surface and plasma heavy particles temperature, respectively, and S h is the speed ratio related to the plasma heavy particles. It is defined as
S h = v rel 2 k B T h / m h
where k B   is the Boltzmann constant and m h the plasma heavy particle mass.
Under isothermal evaporation conditions, the evaporation rate of a particle can be calculated from the heat flux transferred from the plasma gas with the following expression (Equation (7)).
4 π r 2 p × ( d r p d t ) × ρ p × Δ H evap = 4 π r 2 p × q ¯
where r p is the radius of the particle, d r p d t is the evaporation rate of the particle and q ¯ is the averaged heat flux from the plasma (W/ m 2 ) calculated by integrating the current heat flux density, q(x), along the particle trajectory:
q ¯ = 1 x 2 x 1 x = x 1 x = x 2 q ( x ) d x
Equation (7) yields
d r p d t = K evap
where
K evap = q ¯ ρ p Δ H evap
is the evaporation constant.
The radius of the in-flight particle at time t is thus given by:
r p , r = r p , 0 K evap t
where r p , r   is the radius of the residual particle and r p , 0   is the particle diameter at t = 0.
In rarefied gas flows [19] the heat flux density q(x) can be expressed as
q ( x ) = q a + q i + q e
where q a ,   q i and q e are the heat flux brought by the atoms, ions and electrons, respectively.
The flux to the whole surface of the particle can be calculated from:
Q j = q j × π d p 2
where the subscripts j = a, i and e for atoms, ions and electrons, respectively.
According to Chen’s approach [19,21,24], the heat flux density can be calculated as follows:
For atoms,
Q a π d p 2 = 1 8 a a n a v ¯ a k B T h { ( S h 2 + 5 2 2 T w T h ) exp ( S h 2 ) + π S h ( S h 4 + 3 S h 2 + 3 4 T w T h 2 S h 2 T w T h ) e r f ( S h ) }
For ions,
Q i π d p 2 = 1 8 a i n i v ¯ i k B T h { ( π ( 1 2 S h + S h ) e r f ( S h ) + exp ( S h 2 ) ) × ( S h 2 + 5 2 2 T w T h + E ion W s a i k B T h + e Φ k B T h ) π 2 S h e r f ( S h ) }
Additionally, for electrons,
Q e π d p 2 = 1 8 n e v ¯ e exp ( e Φ k B T e ) ( 2 k B T e + W s )
where a j   is the thermal accommodation coefficient ( a j = 1 corresponds to complete thermal accommodation), n j   is the number density of gas species per unit volume,   E ion is the ionization energy of the plasma gas (16.8 eV for Ar–H2 and 21.9 eV for Ar–He), W s is the electron work function for the coating (YSZ) material (4.3 eV), e is the electron charge 1.602 × 10⁻¹⁹ C and Φ is the floating potential over the sphere surface.
v ¯ j   is the thermal motion speed of the plasma gas species; it is expressed as
v ¯ j = 8 k B T j / π m j
As proposed by Chen [24], the floating potential, Φ can be calculated as:
Φ = k B T e { ln m i T e m e T i ln [ 1 2 exp ( S h 2 ) + π 4 ( 1 + S h 2 ) e r f ( S h ) ] }

4. Results and Discussion

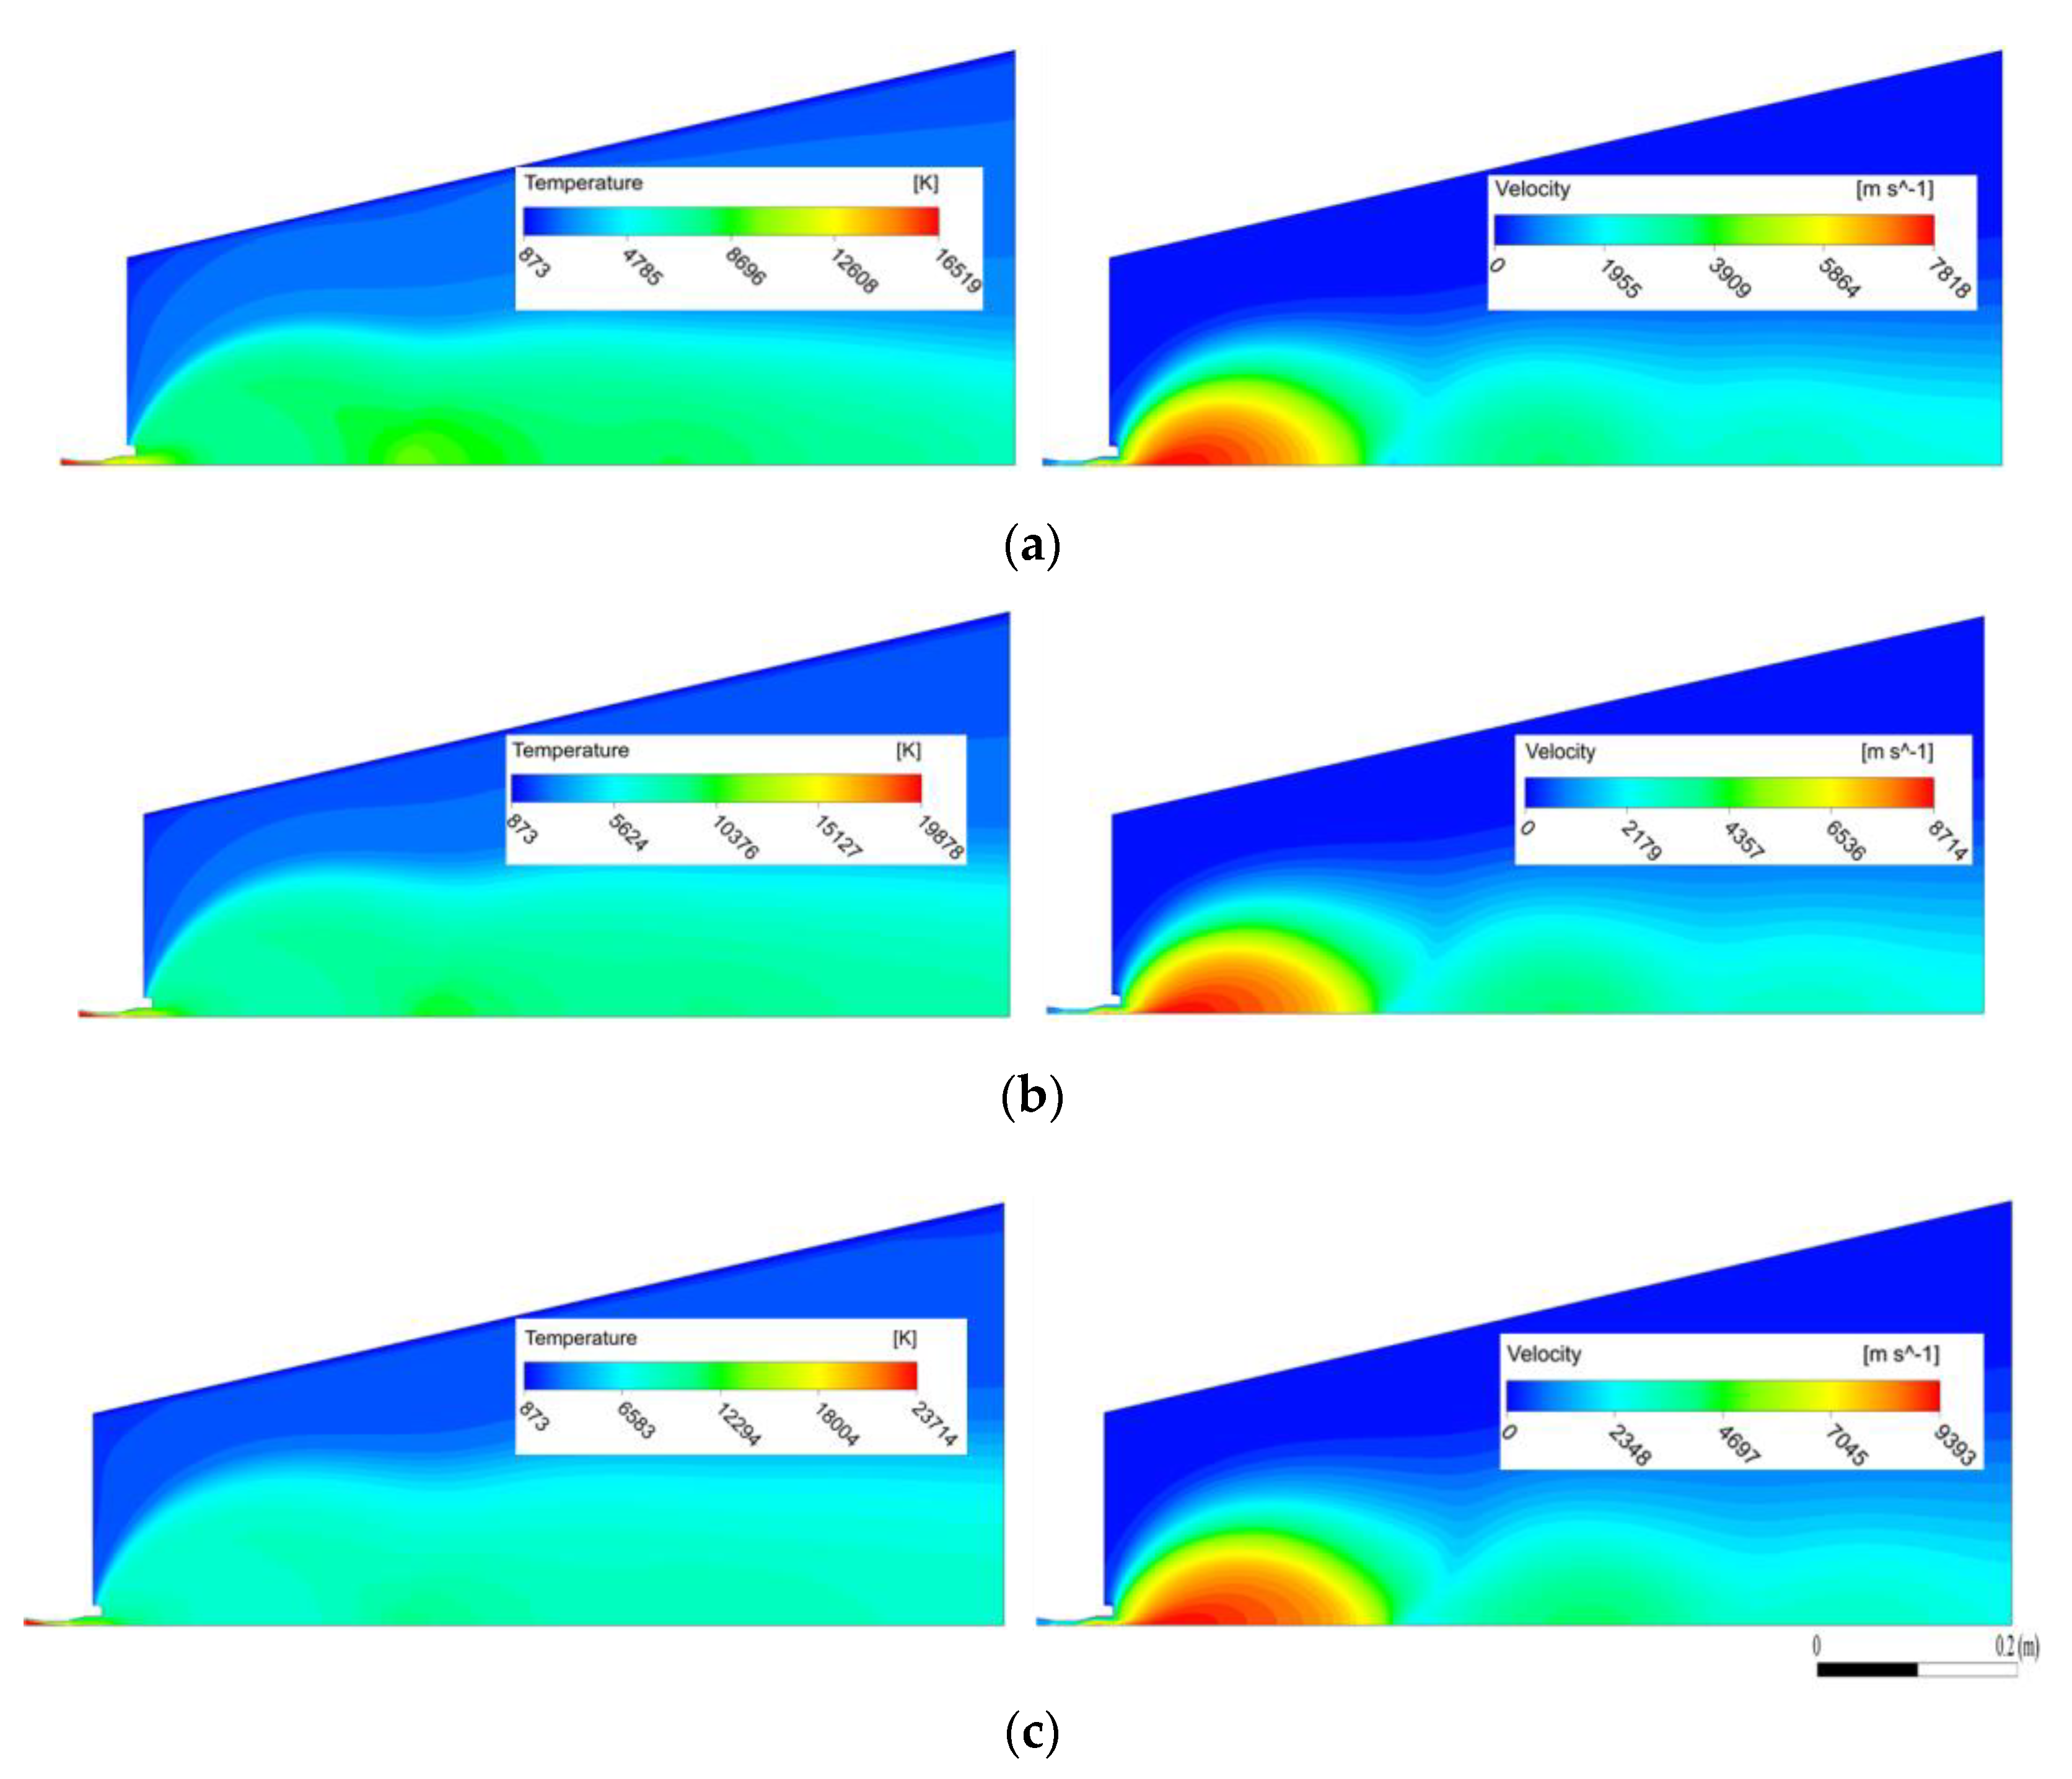
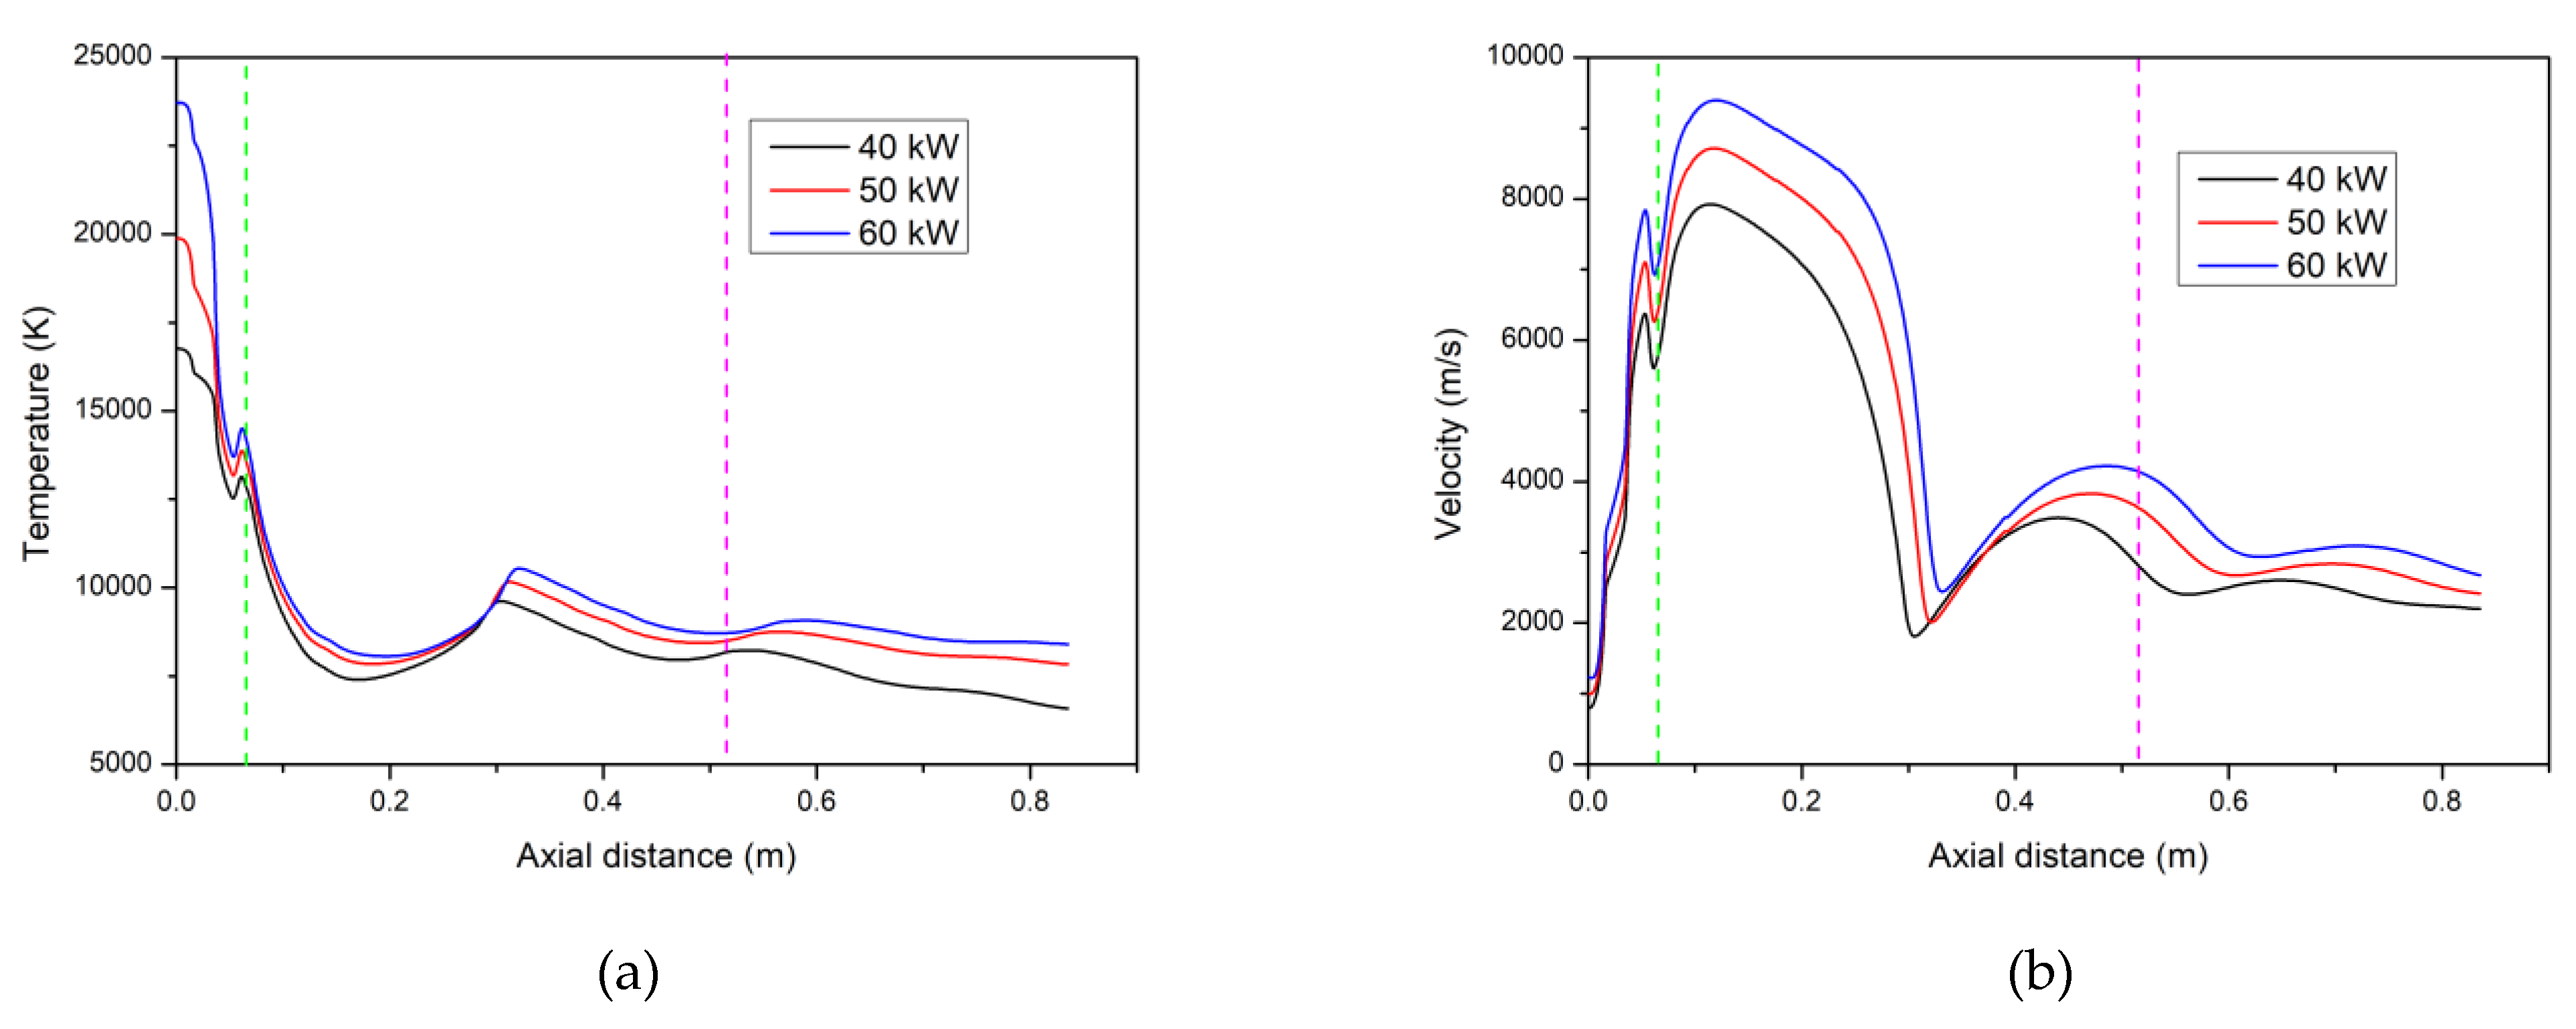
4.1. Temperature and Velocity Fields of the Ar–H2 Plasma Jet

Figure 3 and Figure 4 show the effect of the net power input in the plasma flow on the gas temperature and velocity fields and, on the variation of the plasma jet temperature and velocity along the jet axis, respectively, for the Ar–H2 plasma jet at a chamber pressure of 100 Pa. The hot plasma jet expands first through the divergent part of the nozzle where it accelerates up to 6000–7800 m/s depending on the torch power. It then exits the nozzle with the characteristics of an under-expanded flow as described in [28], as the chamber pressure is much lower than the pressure at the torch nozzle exit (about 15 kPa). The plasma flow exhibits an expansion zone ended by a Mach disk and followed first by a subsonic zone and then a supersonic zone accompanied by brutal changes in velocity and temperature when the plasma jet goes through a shock. The locations of the maximum values of temperature correspond to the compression zones that are accompanied by an abrupt temperature increase while the locations of the maximum values of velocity correspond to the expansion zones.
An increase in the plasma torch net power results in an increase in the plasma jet specific enthalpy (Table 1), temperature and velocity. The temperature increase is much more important inside the torch than in the free flow that expands in the deposition chamber. The plasma reaches temperatures of about 23,500, 20,000 and 17,000 K in the torch, about 14,200, 13,600 and 12,800 K at the nozzle exit and about 8700, 8500 and 8000 K at the substrate location (0.45 m) from the nozzle exit, for a torch power of 40, 50 and 60 kW, respectively. The high temperature in the plasma torch are explained by the presence of the arc that converts the electric current to heat [36] and also by the high specific enthalpy of the Ar–H2 gas mixture due to the addition of hydrogen that increases the enthalpy and decreases the gas mass flow rate. The lower temperatures after the nozzle exit can be explained by the energy consumed by the dissociation of the hydrogen molecules. Whatever the torch power, the jet velocity is still higher than 2000 m/s at the substrate location.

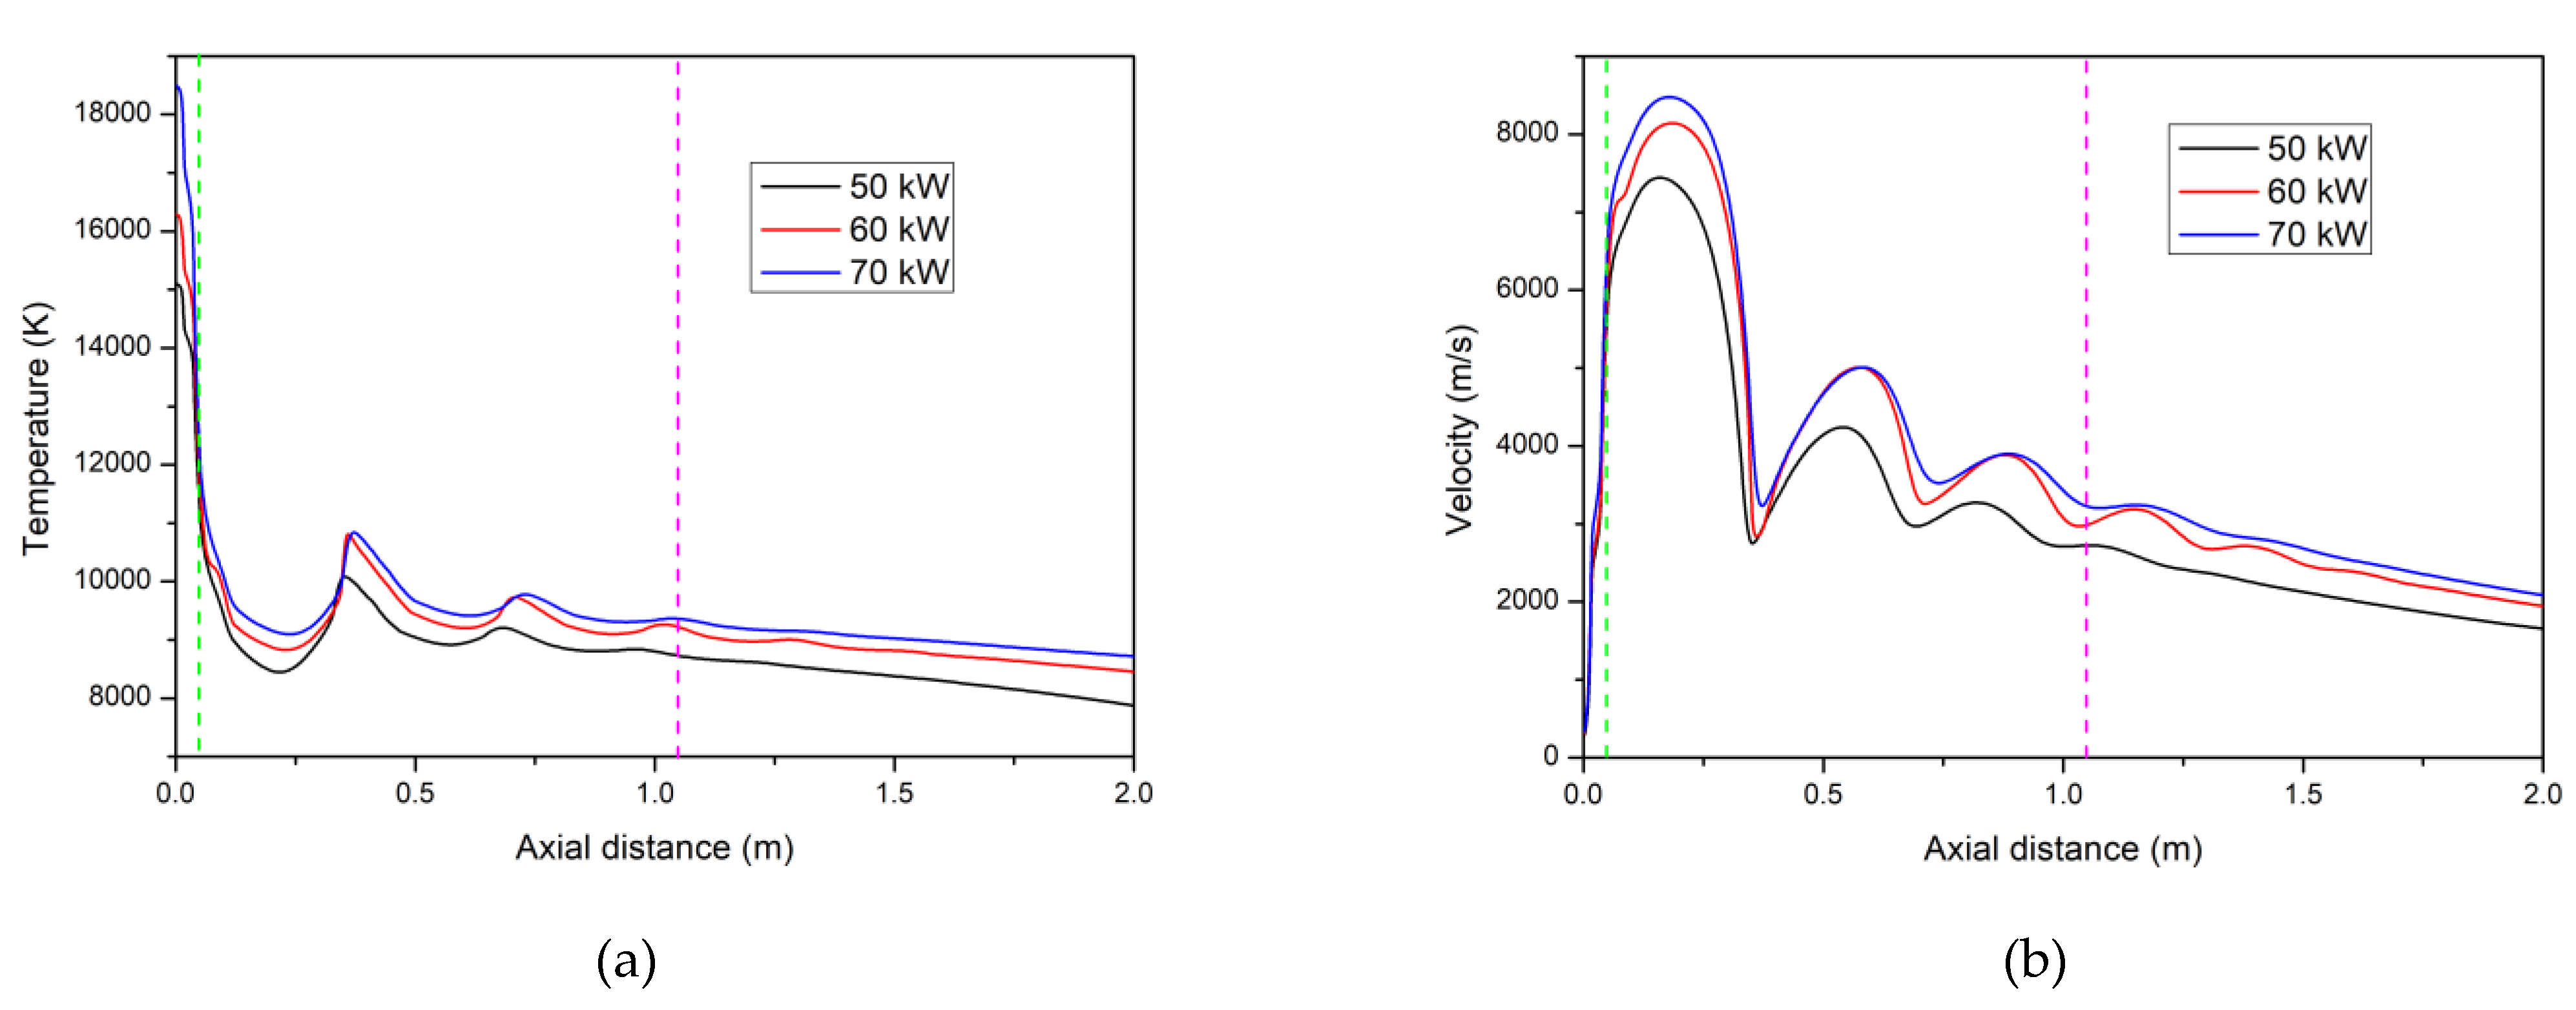
4.2. The Temperature and Velocity Distribution of Ar–He Plasma Jet

Figure 5 and Figure 6 show the effect of the net power input in the plasma flow on the gas temperature and velocity fields and, on the variation of the plasma jet temperature and velocity along the jet axis, respectively, for the Ar–He plasma jet at a chamber pressure of 100 Pa. The plasma jet exhibits the same characteristics of an under-expanded gas flow as the Ar–H2 plasma jet. It also presents the same trend with an increase in the torch power, i.e., an increase in the gas velocity and temperature. However, the increase is less marked than with the Ar–H2 plasma. This can be explained by the lower enthalpy of helium compared to hydrogen (e.g., at 20,000 K, 2.61 × 10⁸ J/kg against 2.21 × 10⁹ J/kg for hydrogen), higher mass flow rate of the gas mixture (0.00187 kg/s for Ar–He and 0.0012 kg/s for Ar–H2) and higher viscosity of helium (e.g., at 20,000 K, 2.44 × 10⁻⁴ against 1.00 × 10⁻⁵ for H2).
The higher viscosity of the Ar–He gas mixture also hinders the radial expansion of the jet and its mixing with the gas contained in the deposition chamber. After the nozzle exit, the Ar–He plasma jet has, thus, a higher temperature than the Ar–H2 plasma jet for the same torch net power and maintains this higher temperature over a long distance: e.g., for a power of 60 kW, the Ar–He temperature is about 9500 K at 0.2 m and 9000 K at 0.8 m while it is 9000 and 7500 K, respectively, for the Ar–H2 plasma jet.
At a distance of 2 m from the nozzle exit, the gas temperature is still higher than 8000 K. The high-power plasma torch operated with gas mixtures of argon and helium requires a longer low-pressure deposition chamber than the lower plasma torch operated with argon-hydrogen mixtures. This will result in longer residence times of the processed particles in the deposition chamber.

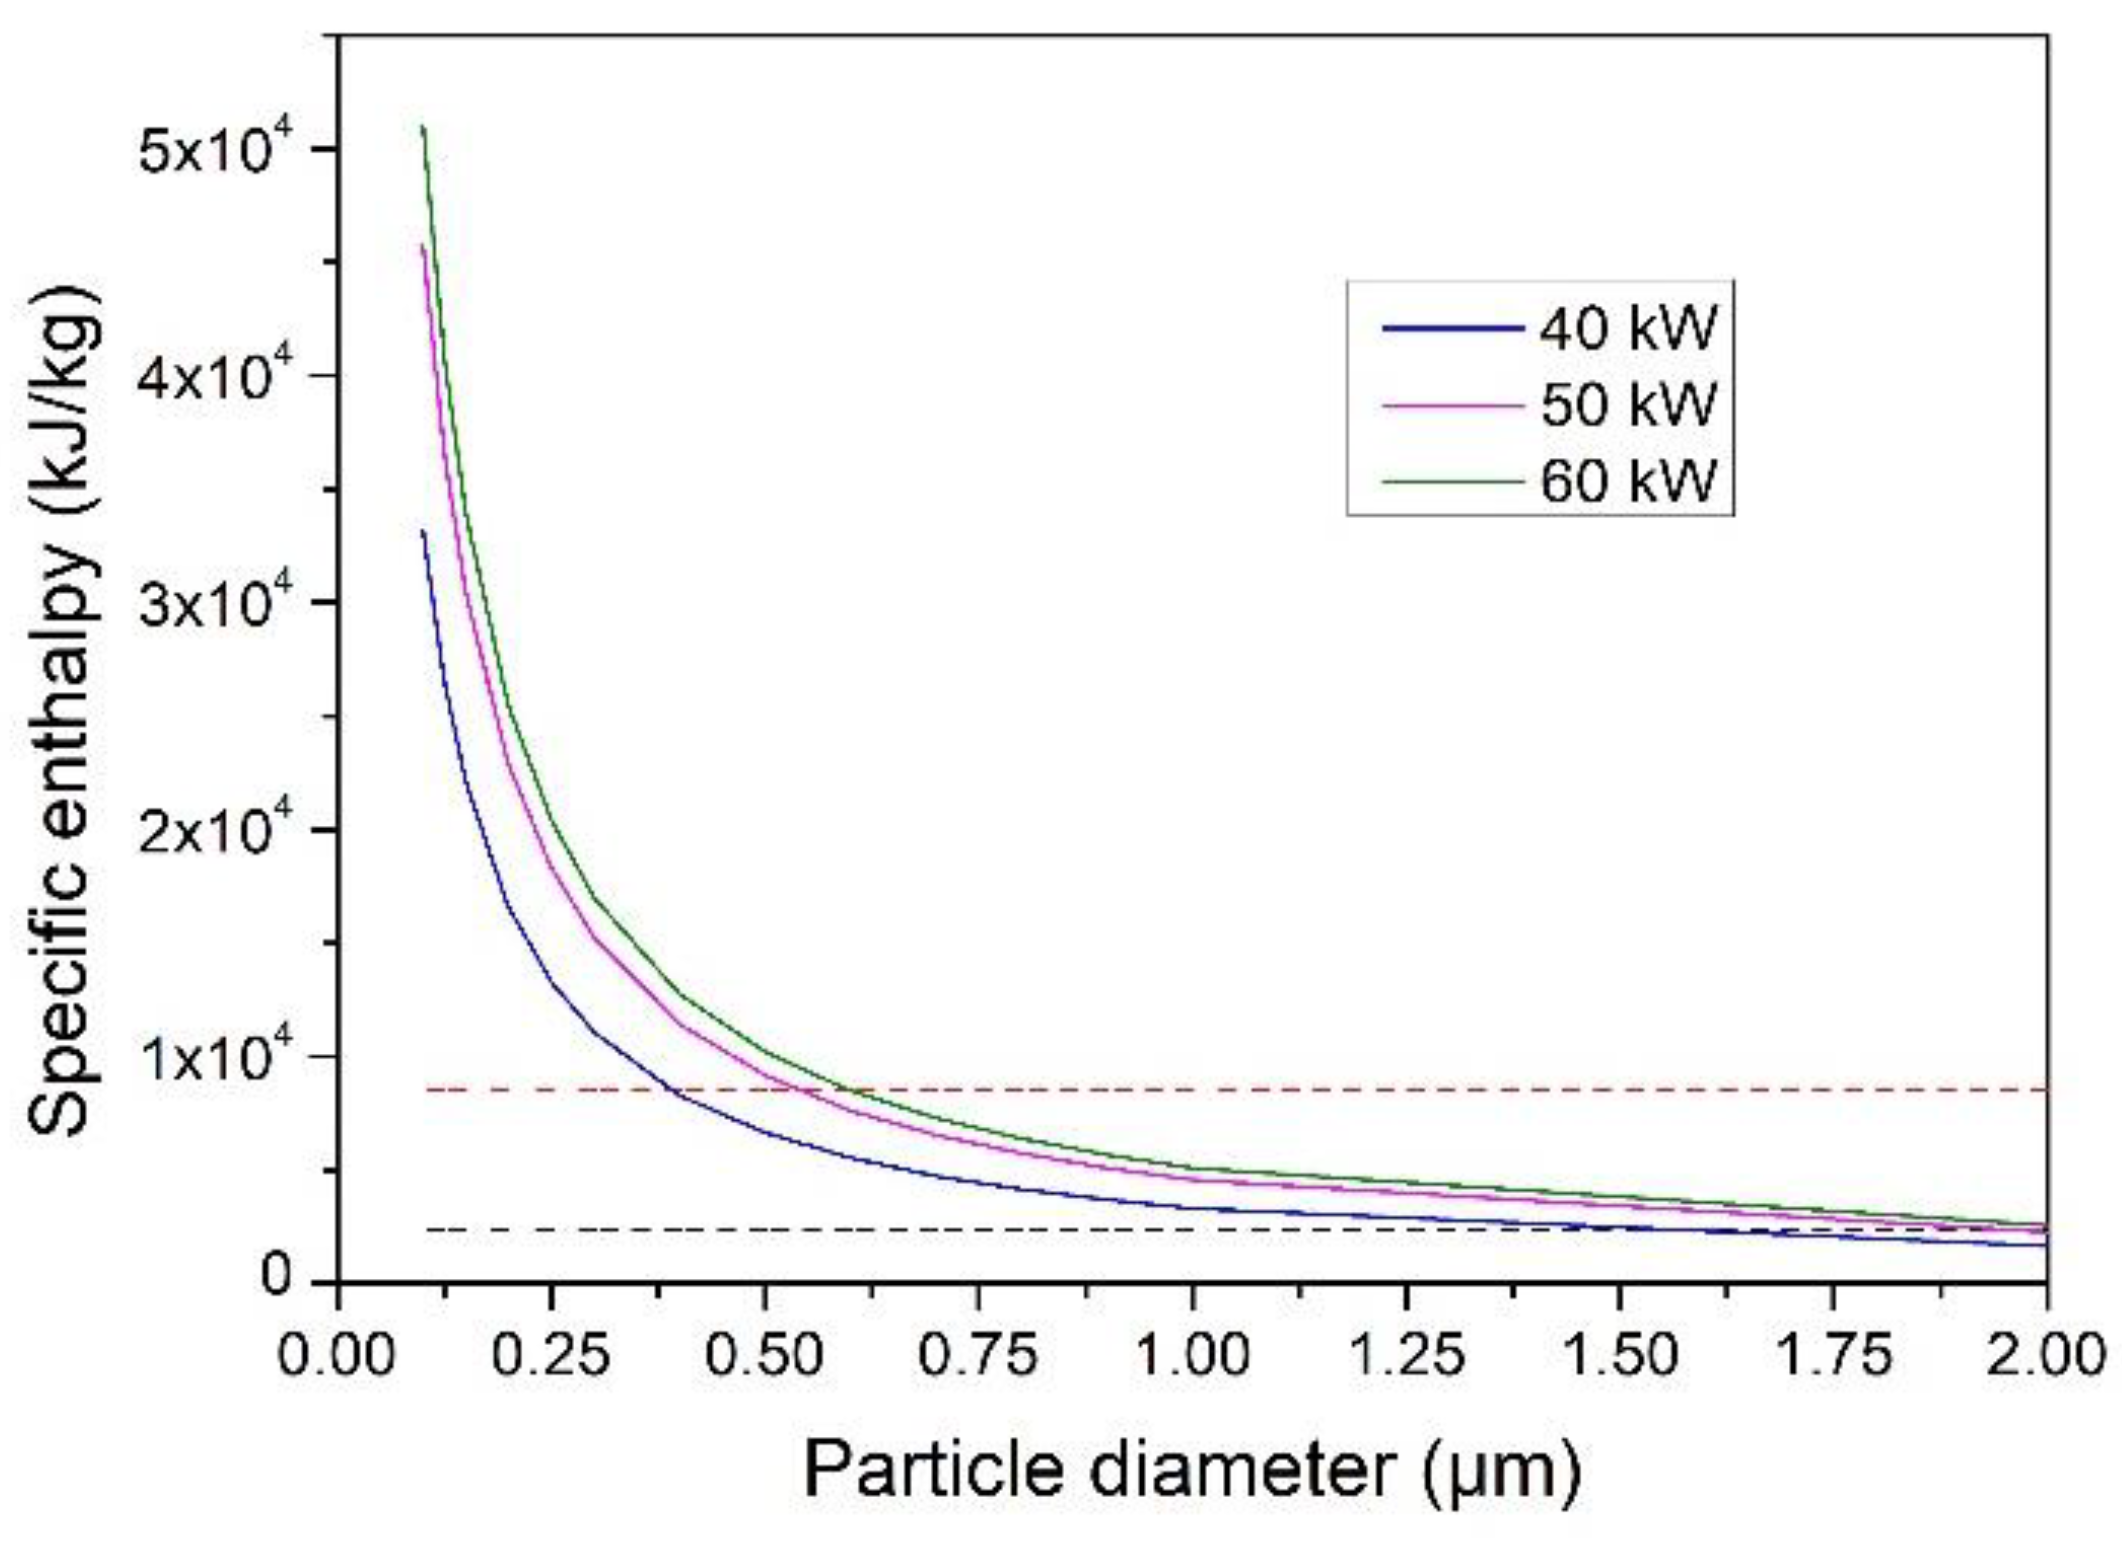
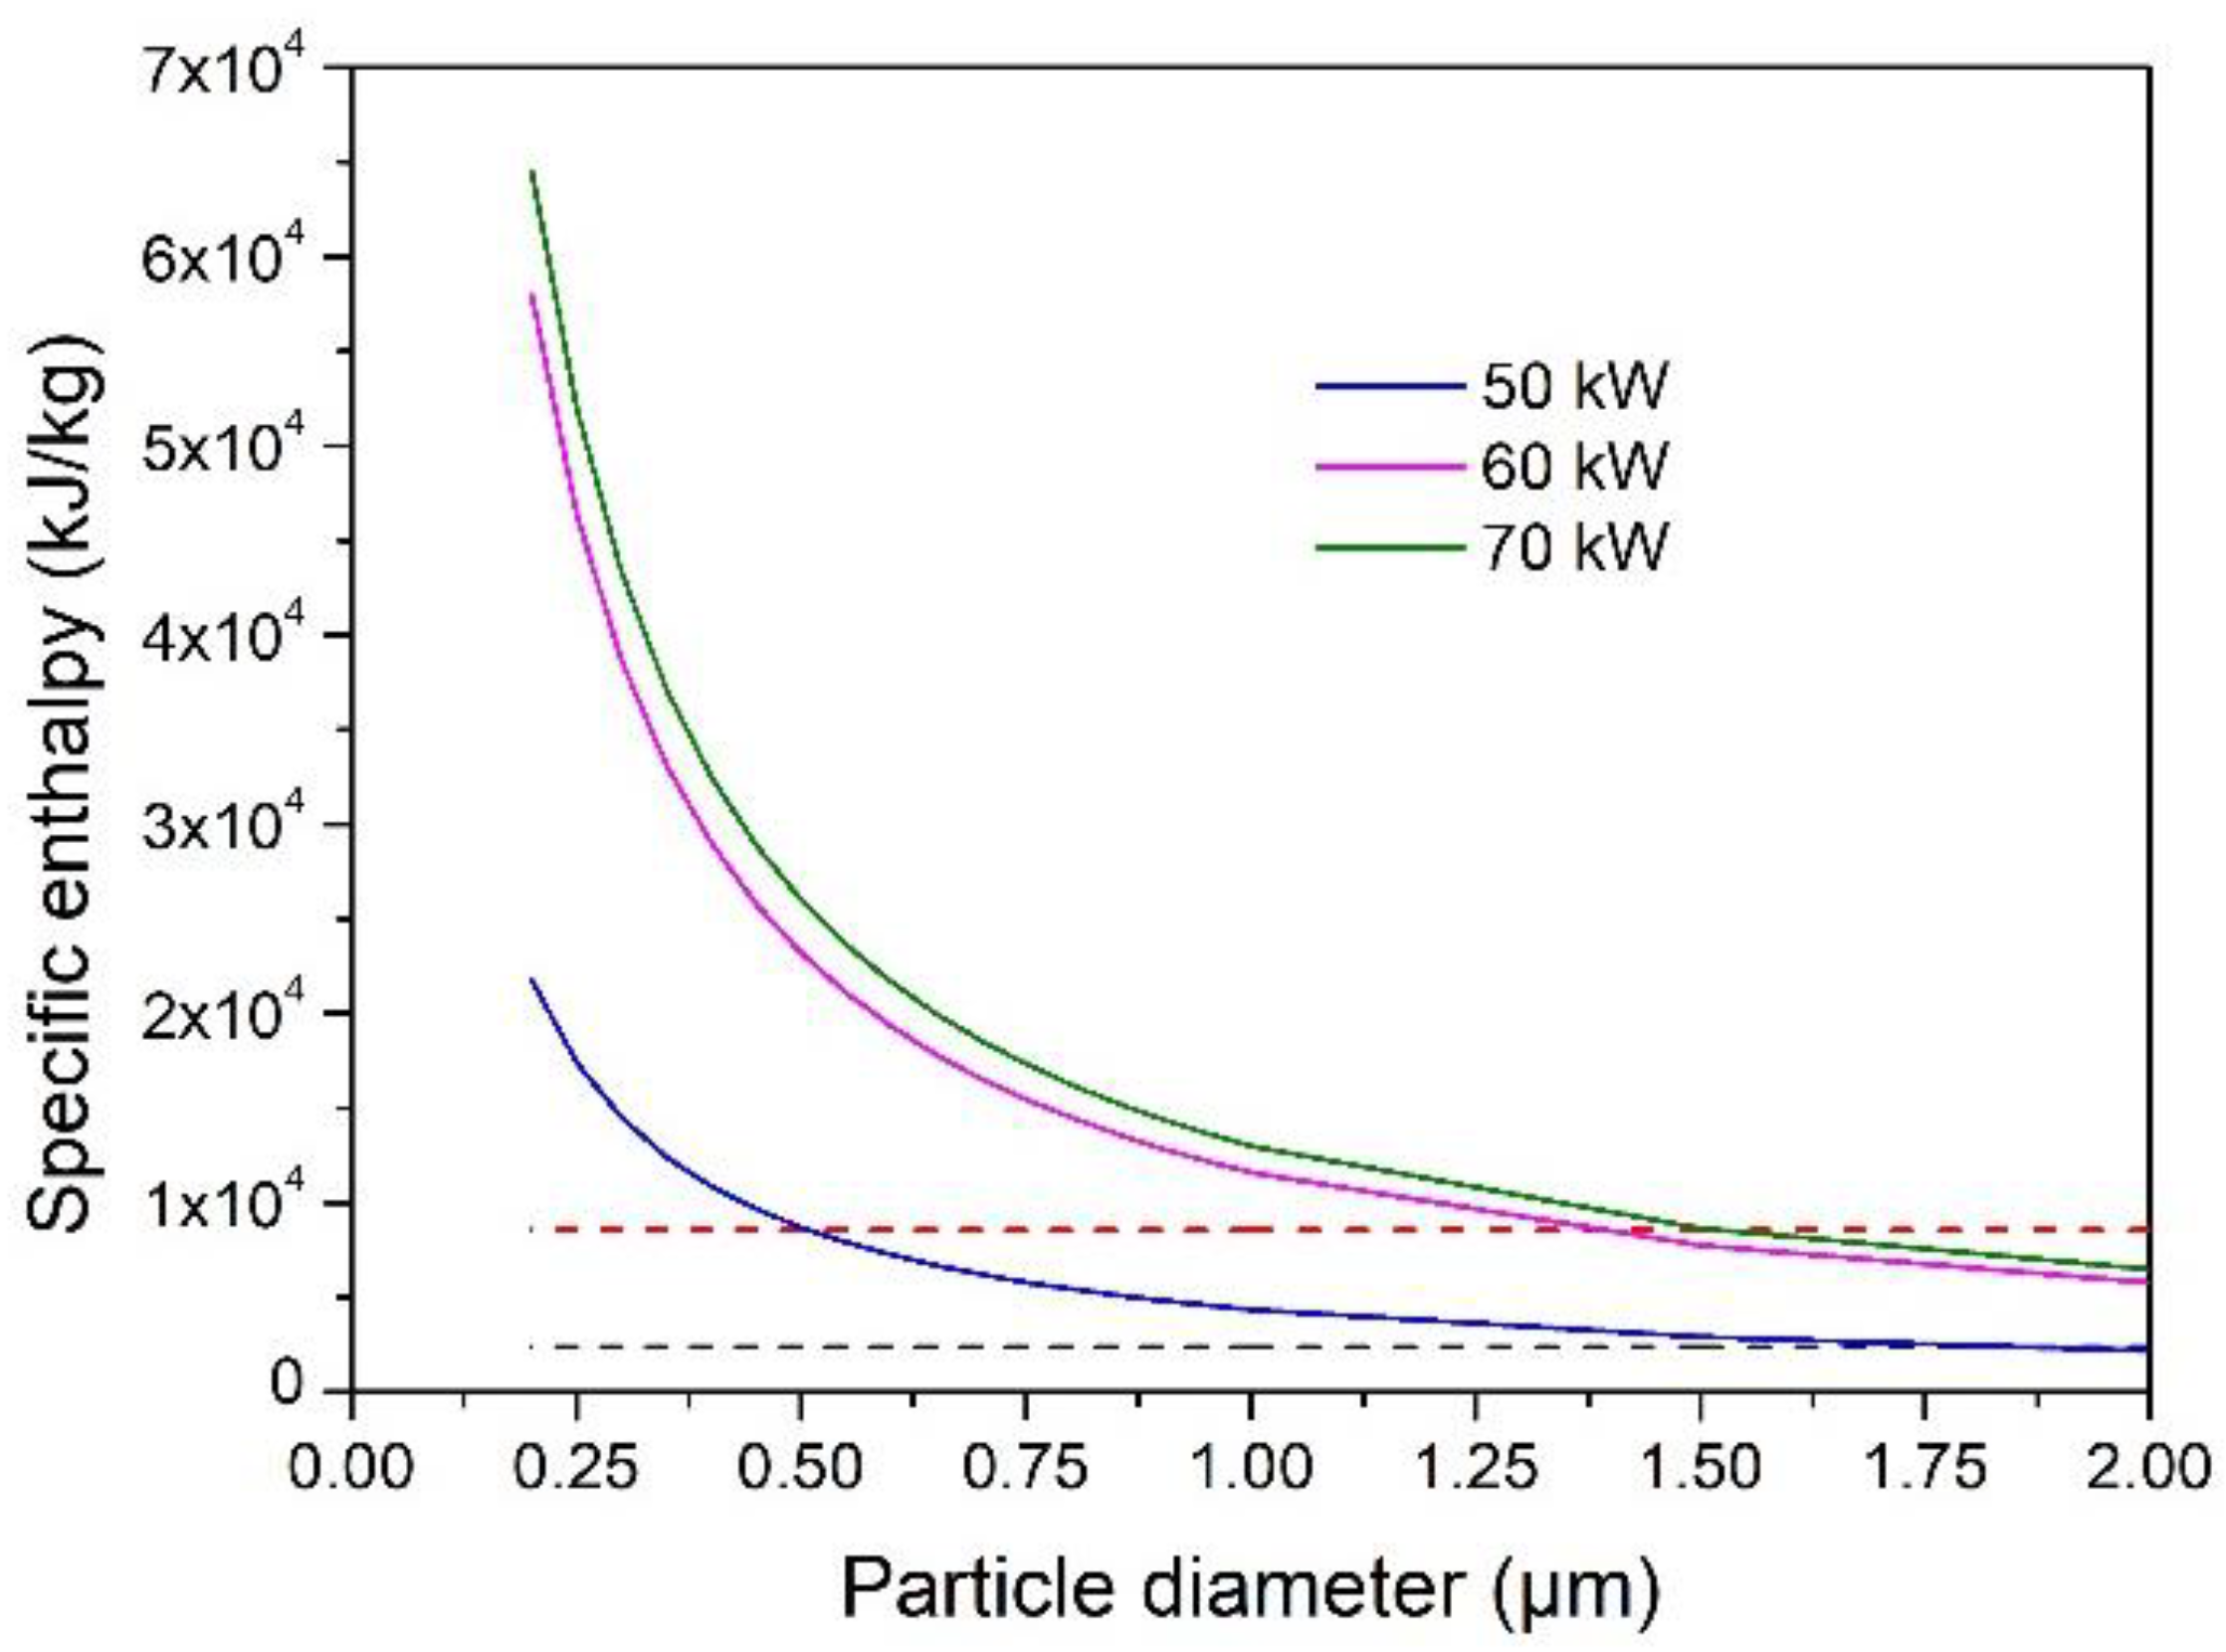
4.3. Evaporation Capacity of YSZ Particle Processed in an Ar–H2 Plasma Jet

Figure 7 shows the surface heat flux transferred by the plasma gas to a YSZ spherical particle of 1 µm diameter, at the particle injection point, torch nozzle exit and stand-off distance, respectively, for plasma torch net powers of 40, 50 and 60 kW. The heat flux to particles at the injection location inside the plasma torch is about 1.5 to 2.5 times higher than at the nozzle exit and at the substrate location. As showed by Chen et al. [22], the Knudsen effect significantly reduces the drag force as well as the heat transfer experienced by the particles processed into the plasma flow. This effect is increased when the gas pressure decreases as it does between the powder injection point, nozzle exit and substrate location. It brings about a decrease in the heat transfer to particles. However, the latter increases with the arc net power, essentially because of the increase in gas temperature that brings about an increase in the charged species (ions and electrons). Actually [22,24], in a rarefied plasma flow, the heat flux can mainly be attributed to atoms at low gas temperatures and charged species at high temperatures, and the ionization degree of the plasma increases with the plasma gas temperature.
The particle is accelerated up to about 1510, 1610 and 1800 m/s from the injection point to the nozzle exit for plasma powers of 40, 50 and 60 kW, respectively. The resulting residence time of the particle (Table 2) inside the torch is as low as 30–40 µs while it is about four times longer in the free jet due to a longer path length and a decrease in velocity due to the expansion of the gas in the low-pressure deposition chamber. Therefore, the particle is intensively heated in the plasma torch for a short time and moderately heated for a much longer time in the free jet. The decrease in particle residence time with an increase in the torch power is low as an increase in the torch power has a moderate effect on the gas velocity (Figure 4b).
Figure 8 shows the specific enthalpy gained by a 1-µm particle during its travel inside the plasma torch, as a function of particle diameter, for the three different net arc powers considered in this study. The specific enthalpy is defined as the total enthalpy of the particle divided by its mass and was calculated by assuming a linear development of the heat flux curve between injection and nozzle exit and integrating over time. The two horizontal dotted lines indicate the melting and vaporization specific enthalpies of the YSZ material. This representation is similar to that used by Mauer in [12] and Anwaar [25]. The particles that can be fully vaporized at the nozzle exit are 0.40, 0.53 and 0.58 µm in diameter for torch net powers of 40, 50 and 60 kW, respectively.
Figure 9 shows the same data as Figure 8 for the specific enthalpy gained by the particles during their flight in the free jet, from the torch exit to the deposition location, 450 mm downstream of the nozzle exit. At this distance, the particles that can be completely vaporized in the free jet are 0.32, 0.38 and 0.41 µm in diameter, for net torch powers of 40, 50 and 60 kW, respectively, while they are 0.40, 0.53 and 0.58 µm inside the plasma torch. This result is easily explained by the decrease in the heat transferred to the particles in the free jet, even if their residence time is much longer than inside the torch. The decrease in the heat transfer to particles is essentially due to the Knudsen effect and decrease of gas temperature and ionized species.
These numerical simulations show that, even if the size of the YSZ particles that can be fully vaporized in the free flow is lower than that evaporated inside the plasma torch, the particle evaporation continues in the free jet leading to an “evaporable” diameter slightly higher than those predicted at the exit of the plasma torch. The predicted “evaporable” diameters are comparable to those obtained by other authors under PS-PVD conditions [17,26]. In particular, Mauer [12] estimated that the YSZ particles should have a diameter less than 1 µm to be fully evaporated inside the plasma torch when the latter is operated at a net power of 60 kW with an argon-hydrogen mixture.
Under the conditions of this study, the total size of the YSZ particles that can be fully vaporized from the injection point to the substrate standoff distance are 0.42, 0.58 and 0.65 µm, for torch net powers of 40, 50 and 60 kW, respectively (Figure 10). An increase in the arc power results in an increase in the size of the fully vaporized particles: from 0.42 to 0.65 µm when the power is increased from 40 to 60 kW. However, the effect is limited by the rarefaction effect on small particles in the free jet and a decrease in the particle residence time because of an increase in the gas velocity with the net arc power. The maximum “evaporable “particle size remains lower than 1 μm. Increasing the arc power does not seem to be the most effective way to increase the size of the fully vaporized particles under the operating conditions used for the Ar–H2 plasma jet in this study.

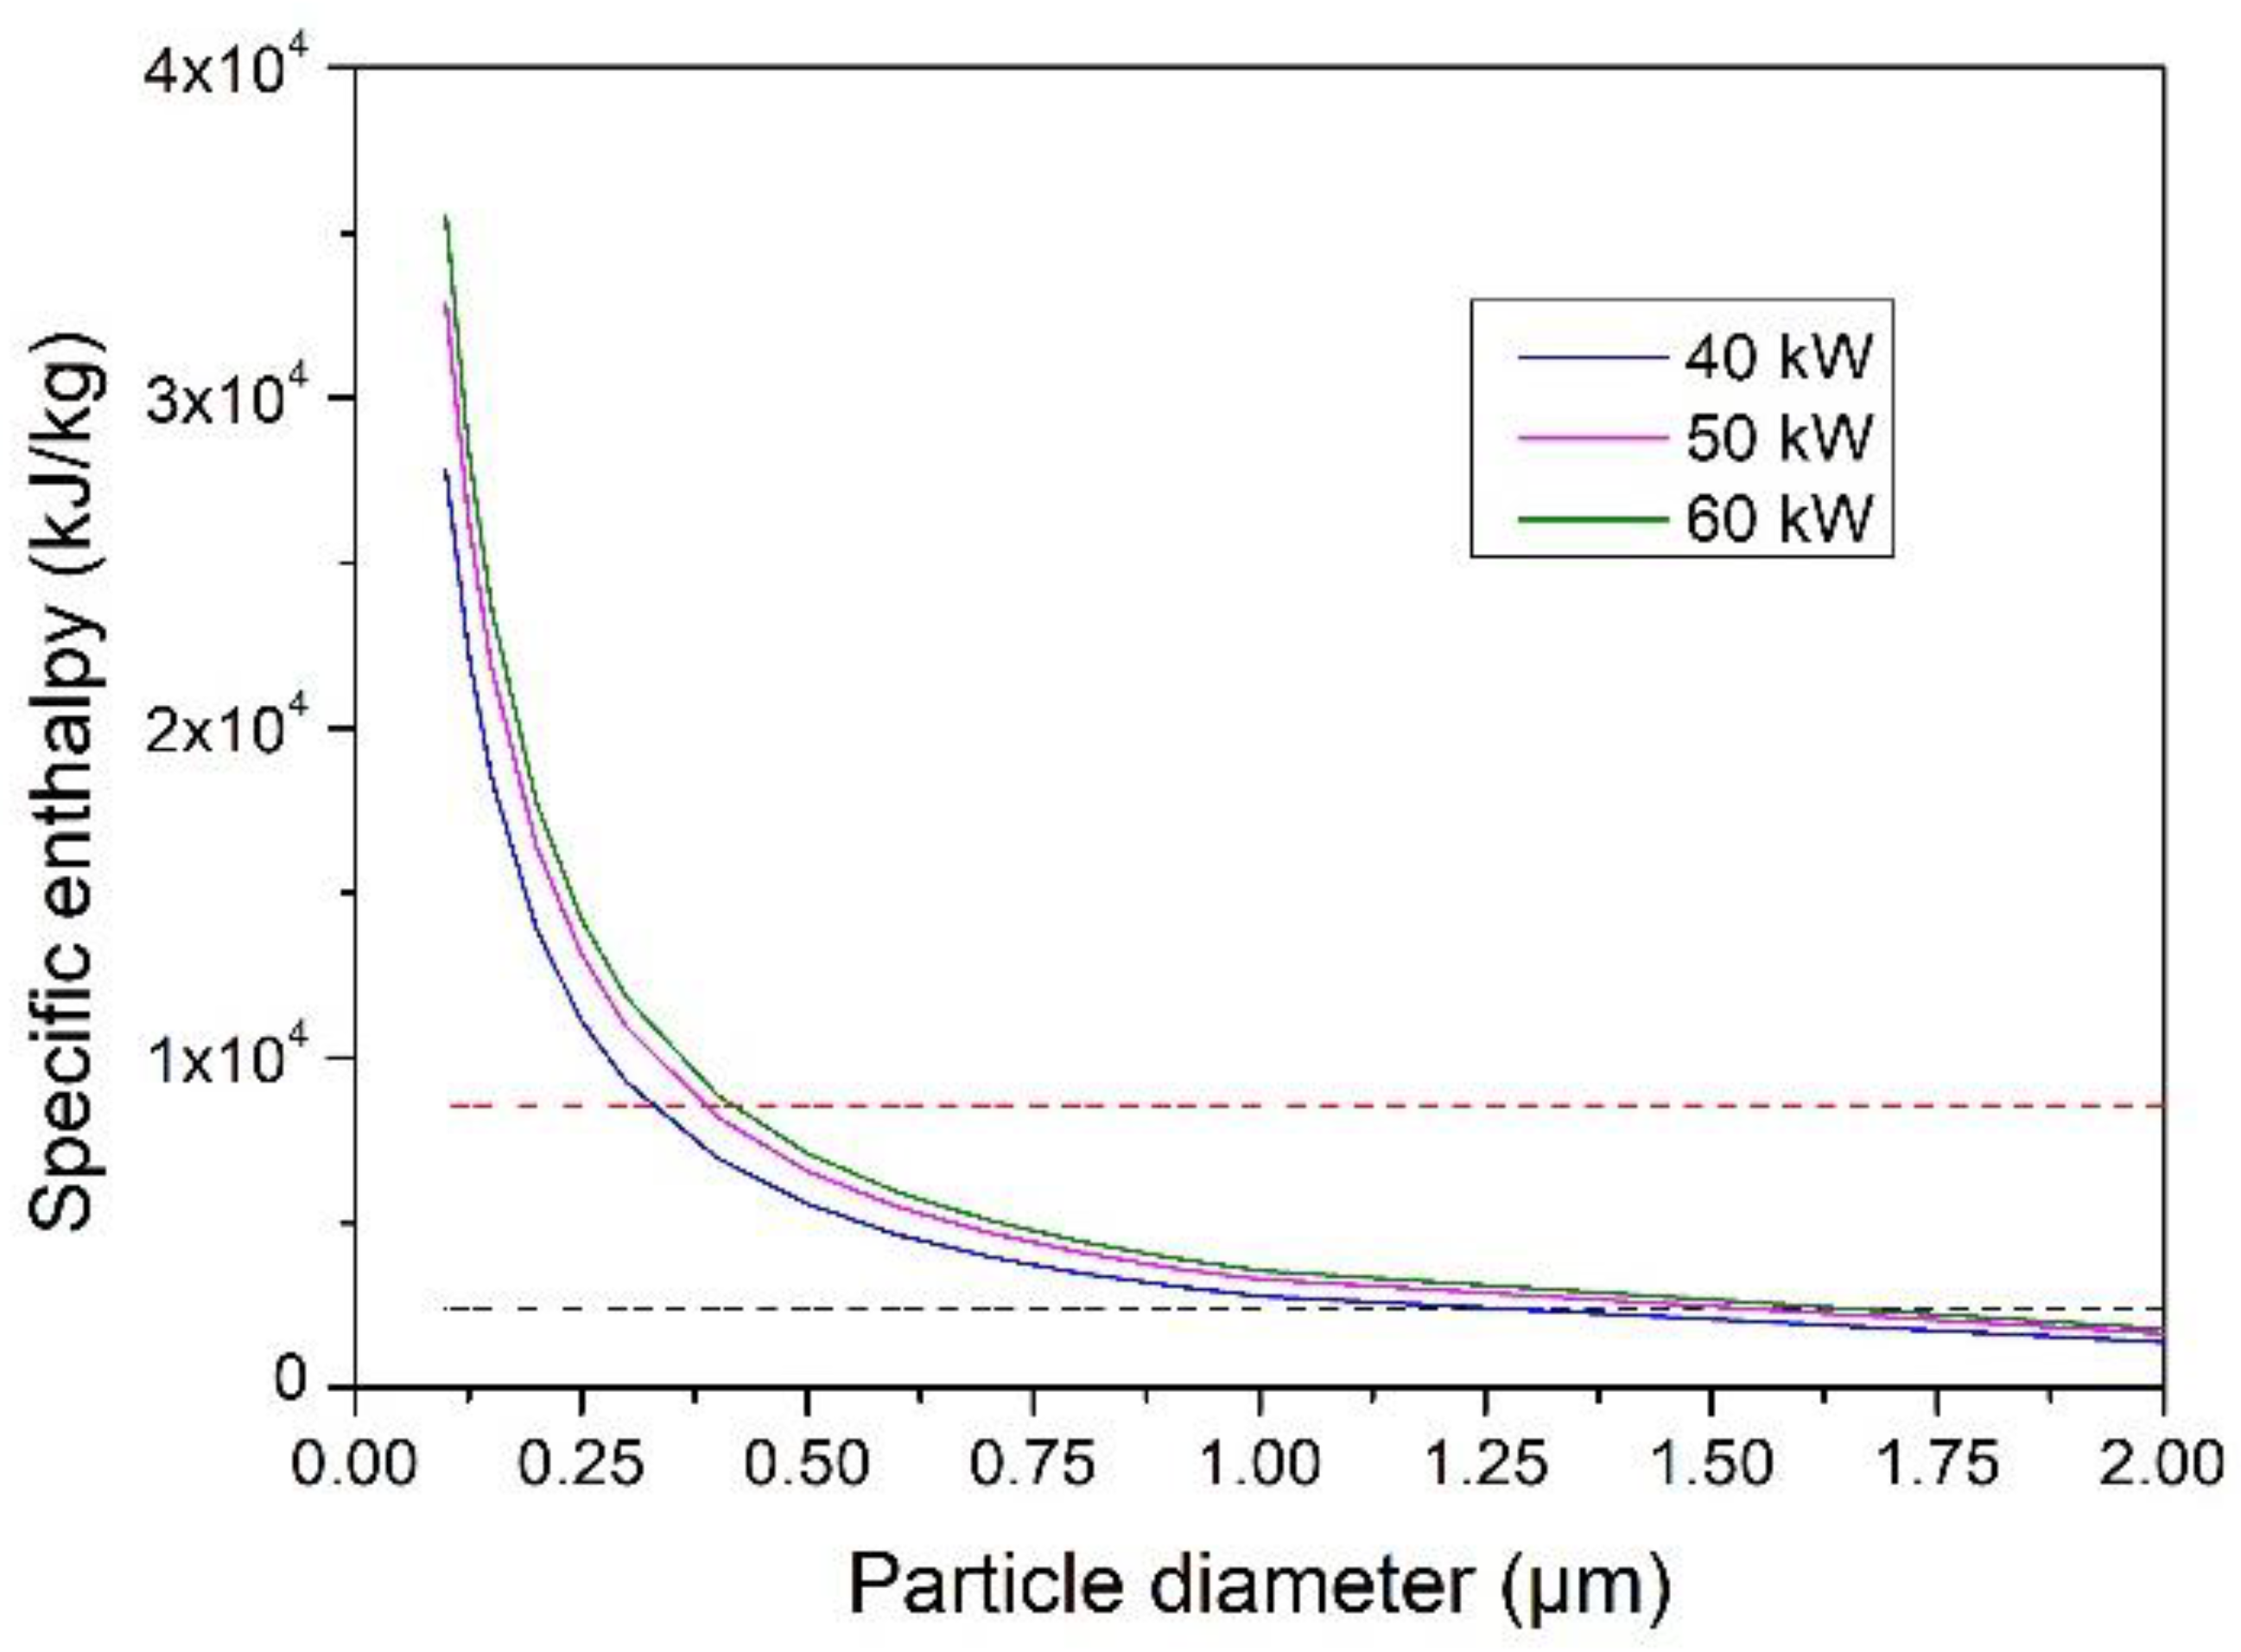
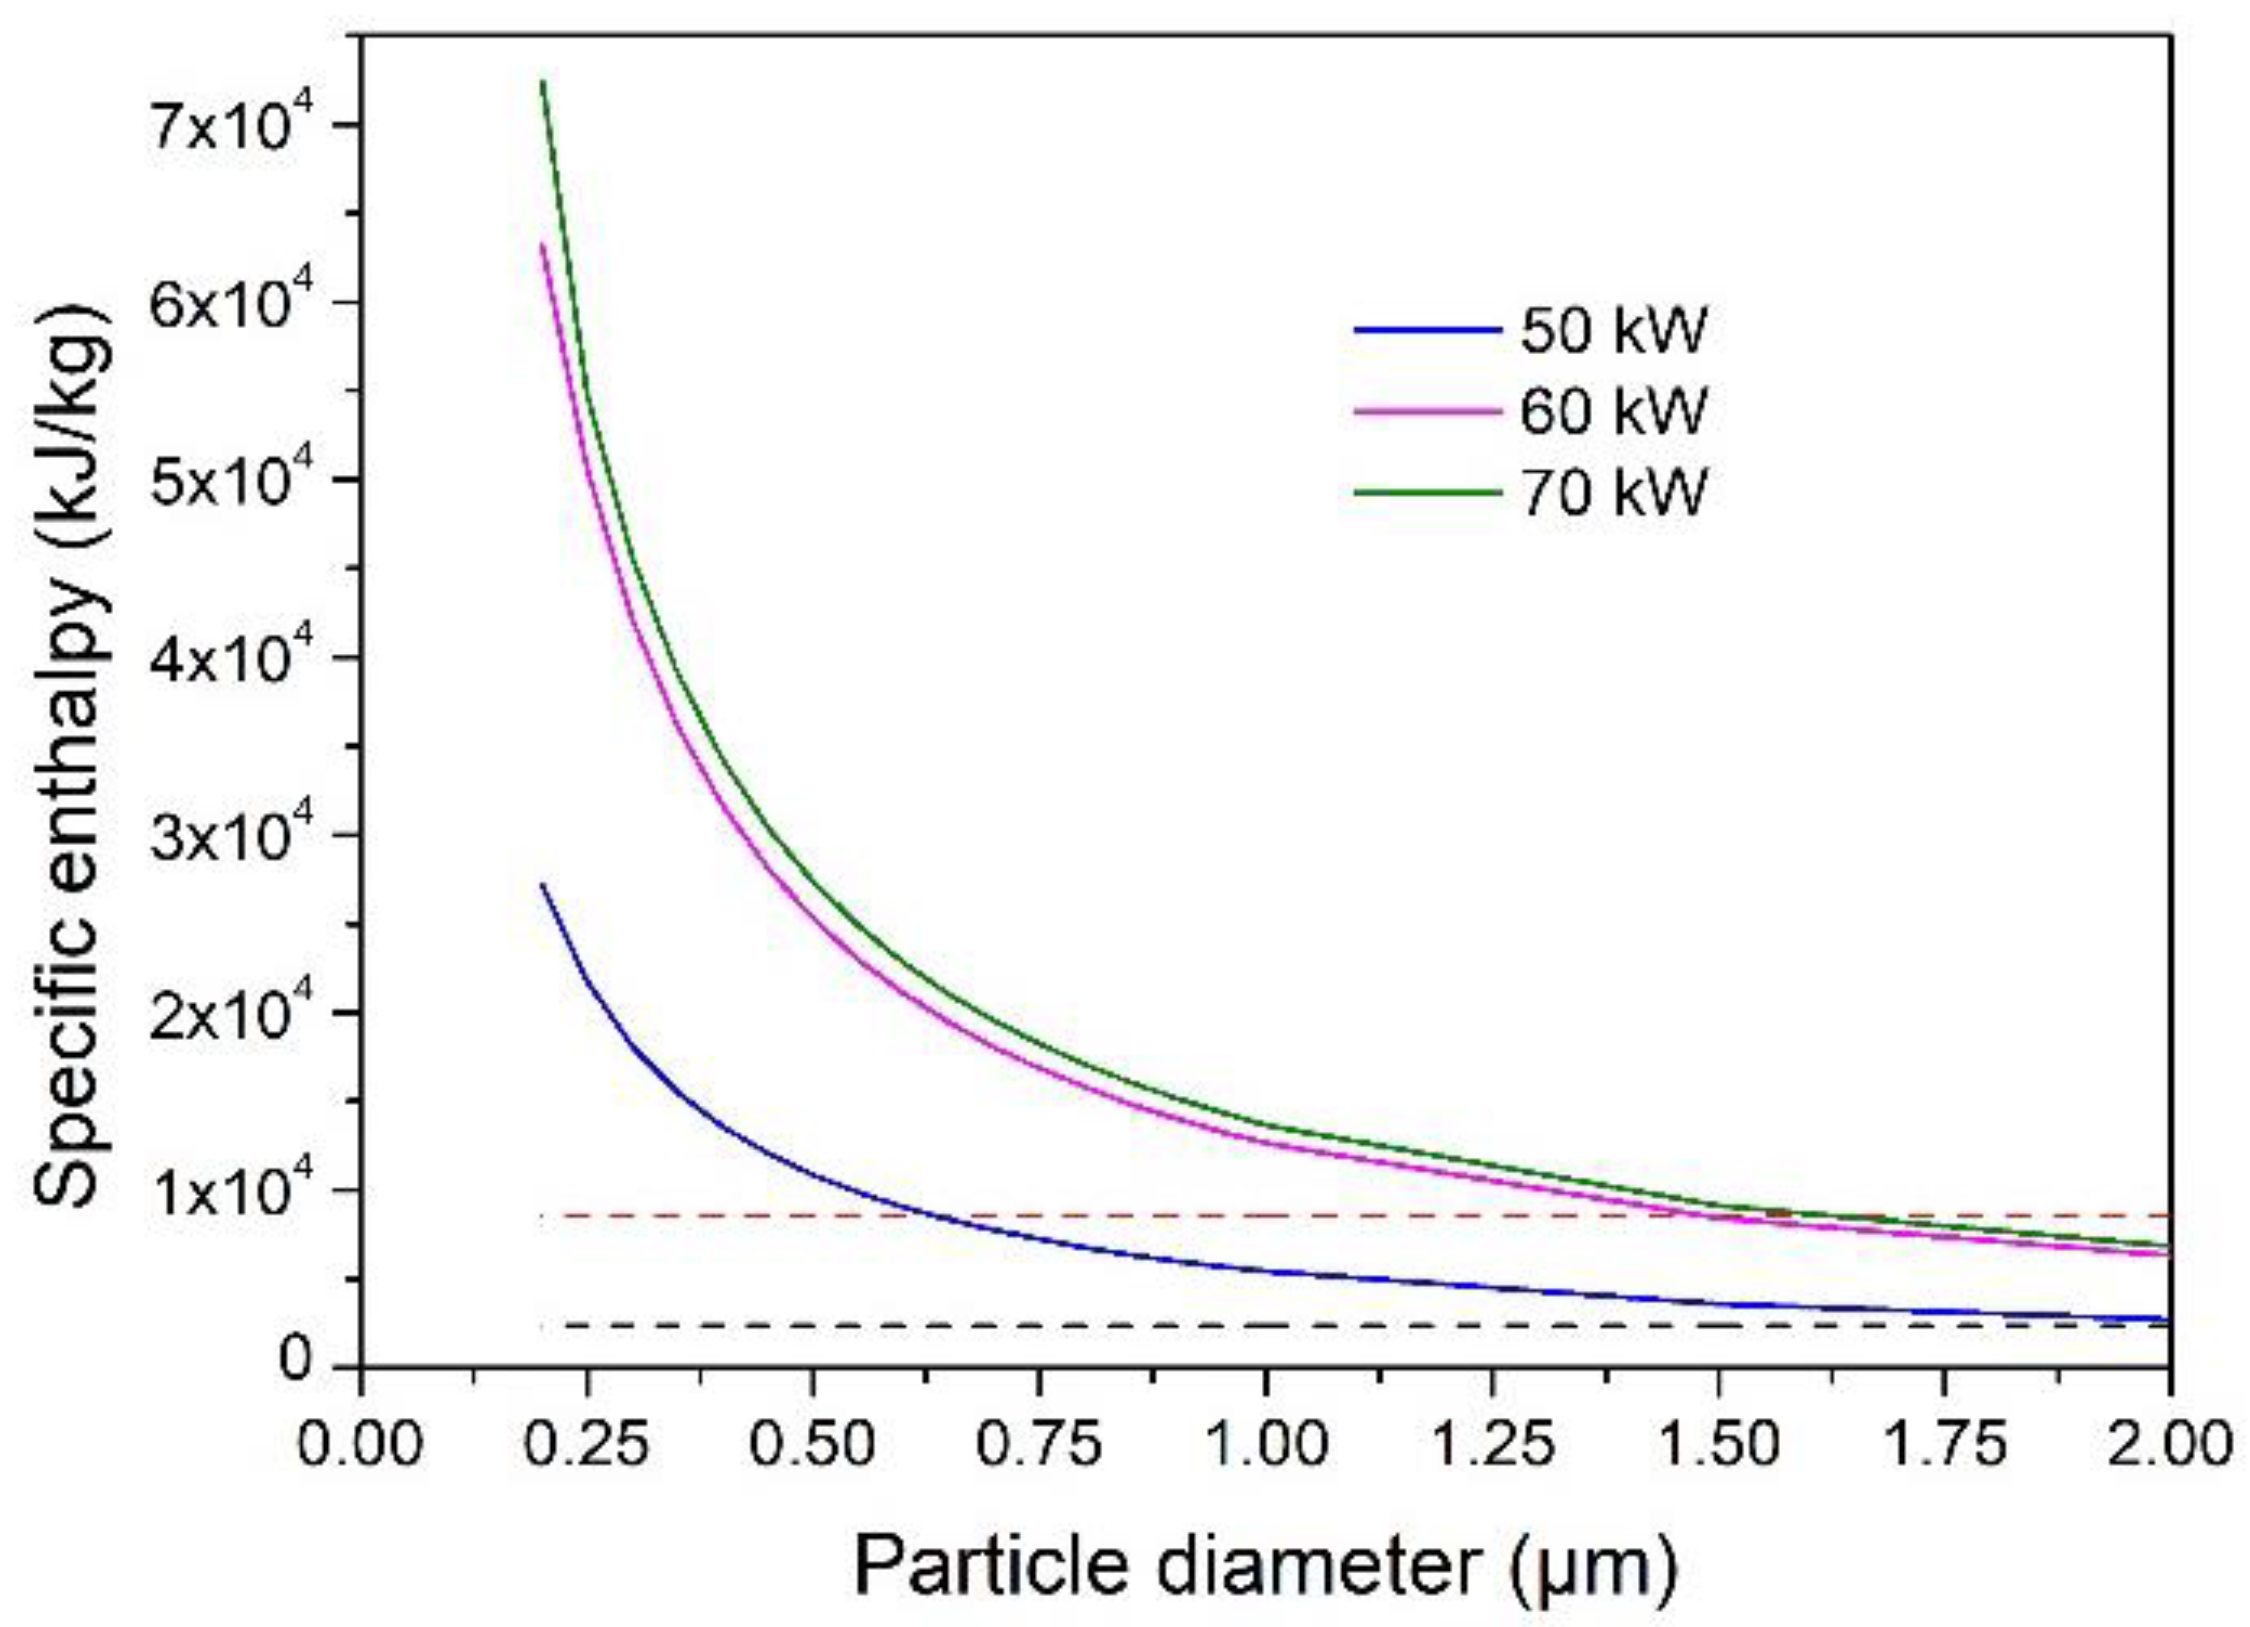
4.4. Evaporation Capacity of YSZ Particles Processed in an Ar–He Plasma Jet

The same calculations have been done for an Ar–He plasma generated by a higher power commercial plasma torch (O3CP torch from Oerlikon Metco) operated with net torch powers of 50, 60 and 70 kW. This torch has a much larger nozzle diameter than the plasma torch used with the argon-hydrogen mixture: 12.5 mm vs. 6 mm, which results in a lower velocity for the gas jet (Figure 5 and Figure 6b) and, thus, particles, bringing about an increase in the residence time of the particles in the deposition chamber (Table 2). The predicted particle velocities are 980, 1080 and 1250 m/s and dwelling times of 38.8, 35.1 and 30.4 µs inside the 19 mm long nozzle for a 1-µm YSZ particle injected into the torch operated at 50, 60 and 70 kW, respectively.
Figure 11 shows the predicted heat flux transferred to a 1-µm YSZ particle at the particle injection location, nozzle exit and substrate stand-off distance (1 m downstream of the nozzle exit) as a function of the torch net power. Compared with the heat flux to particles from the Ar–H2 plasma generated by the F4 plasma torch, the heat flux is higher under the same net power: e.g.; for a torch power of 60 kW, it is 5.4 × 10⁸ W/m2 against 2.8 × 10⁸ W/m2 for the Ar–H2 gas mixture at the injection point and 1.2 × 10⁸ W/m2 against 1.1 × 10⁸ W/m2 at the substrate location (450 mm downstream of the nozzle exit instead of 1 m for the Ar–He gas mixture). This can be attributed to the difference in the ionization of both gas mixtures (the molecules of hydrogen have to be dissociated first), higher degree of ionization of the argon-helium plasma and its higher temperature in the deposition chamber.
Figure 12 shows the effect of the plasma net power on the specific enthalpy stored by particles between the injection point and the nozzle exit for particle size varying from 0.25 to 2 µm while Figure 13 shows the same effect on the specific enthalpy stored by the particles between the nozzle exit and substrate location (1 m downstream of the nozzle exit). The specific enthalpy is significantly decreased with the increase of the particle size because of the increase in the particle mass. Moreover, with an increase in the plasma net power the enthalpy transferred to particles is increased. However, if this increase is appreciable, when the power is increased from 50 to 60 kW, it is less important when it is increased from 60 to 70 kW. This is in agreement with the plasma temperature and velocity variation with the torch power shown in Figure 5 and Figure 6.
The sizes of the particles that can be fully vaporized inside the torch nozzle are 0.63, 1.48 and 1.60 µm and in the deposition chamber 0.51, 1.35 and 1.52 µm, respectively, for a torch power of 50, 60 and 70 kW (Figure 14). Under the conditions of the study, the enthalpy gained by the particle in the torch nozzle is comparable with that gained in the chamber over a distance of 1 m. Finally, the sizes of the particles that can be fully vaporized in the whole deposition process are 0.72, 1.75 and 1.90 µm, respectively, at 50, 60 and 70 kW. This is consistent with experimental studies that show that under similar PS-PVD conditions, the size of the particles should be less than 2 µm [12,25,37].
The comparison between Figure 10 and Figure 14 shows that the size of the particles that can be fully vaporized with the Ar–He plasma is significantly larger than with the Ar–H2 plasma: e.g., 1.75 µm vs. 0.65 µm for a torch power of 60 kW. This is explained by the different characteristics of the hydrogen and helium plasma gas that yield a higher heat transfer to particles with helium, and the operating conditions. In particular, the substrate standoff distance is twice as long with the Ar–He gas mixture while the particle velocity is lower with this plasma gas and both conditions will bring about a much longer residence time of particles in the deposition chamber: e.g., 232 µs for the Ar–He gas mixture vs. 149 µs for the Ar–H2 gas mixture at 60 kW.
It should be noticed that this study does not take into account any fluctuation in the torch power linked to either the power supply, the movement or both, of the arc attachment on the anode wall that is inherent to conventional plasma torches (mono-cathode, mono-anode and no insert between the two electrodes at a floating potential to force the arc to only attached on the anode ring) [38]. The arc fluctuations generally affect the processing of the particles in the plasma jet. They are also generally larger when hydrogen is used as secondary plasma-forming gas

5. Conclusions

This study aimed to estimate the maximum size of yttria-stabilized zirconia particles that can be fully evaporated in a plasma spray-physical vapor deposition process (PS-PVD). It first used CFD simulations to calculate the plasma temperature and velocity fields in the torch and deposition chamber. It then used the approach proposed by Chen [19,21,22] for rarefied plasma flows to calculate the heat transfer to particles and their specific enthalpy gained in the plasma torch and deposition chamber. The particle maximum “evaporable” size was drawn from these calculations. The particles were processed with two commercial plasma torches operated with conditions recommended by the manufacturer and different torch powers.
The calculations showed that:
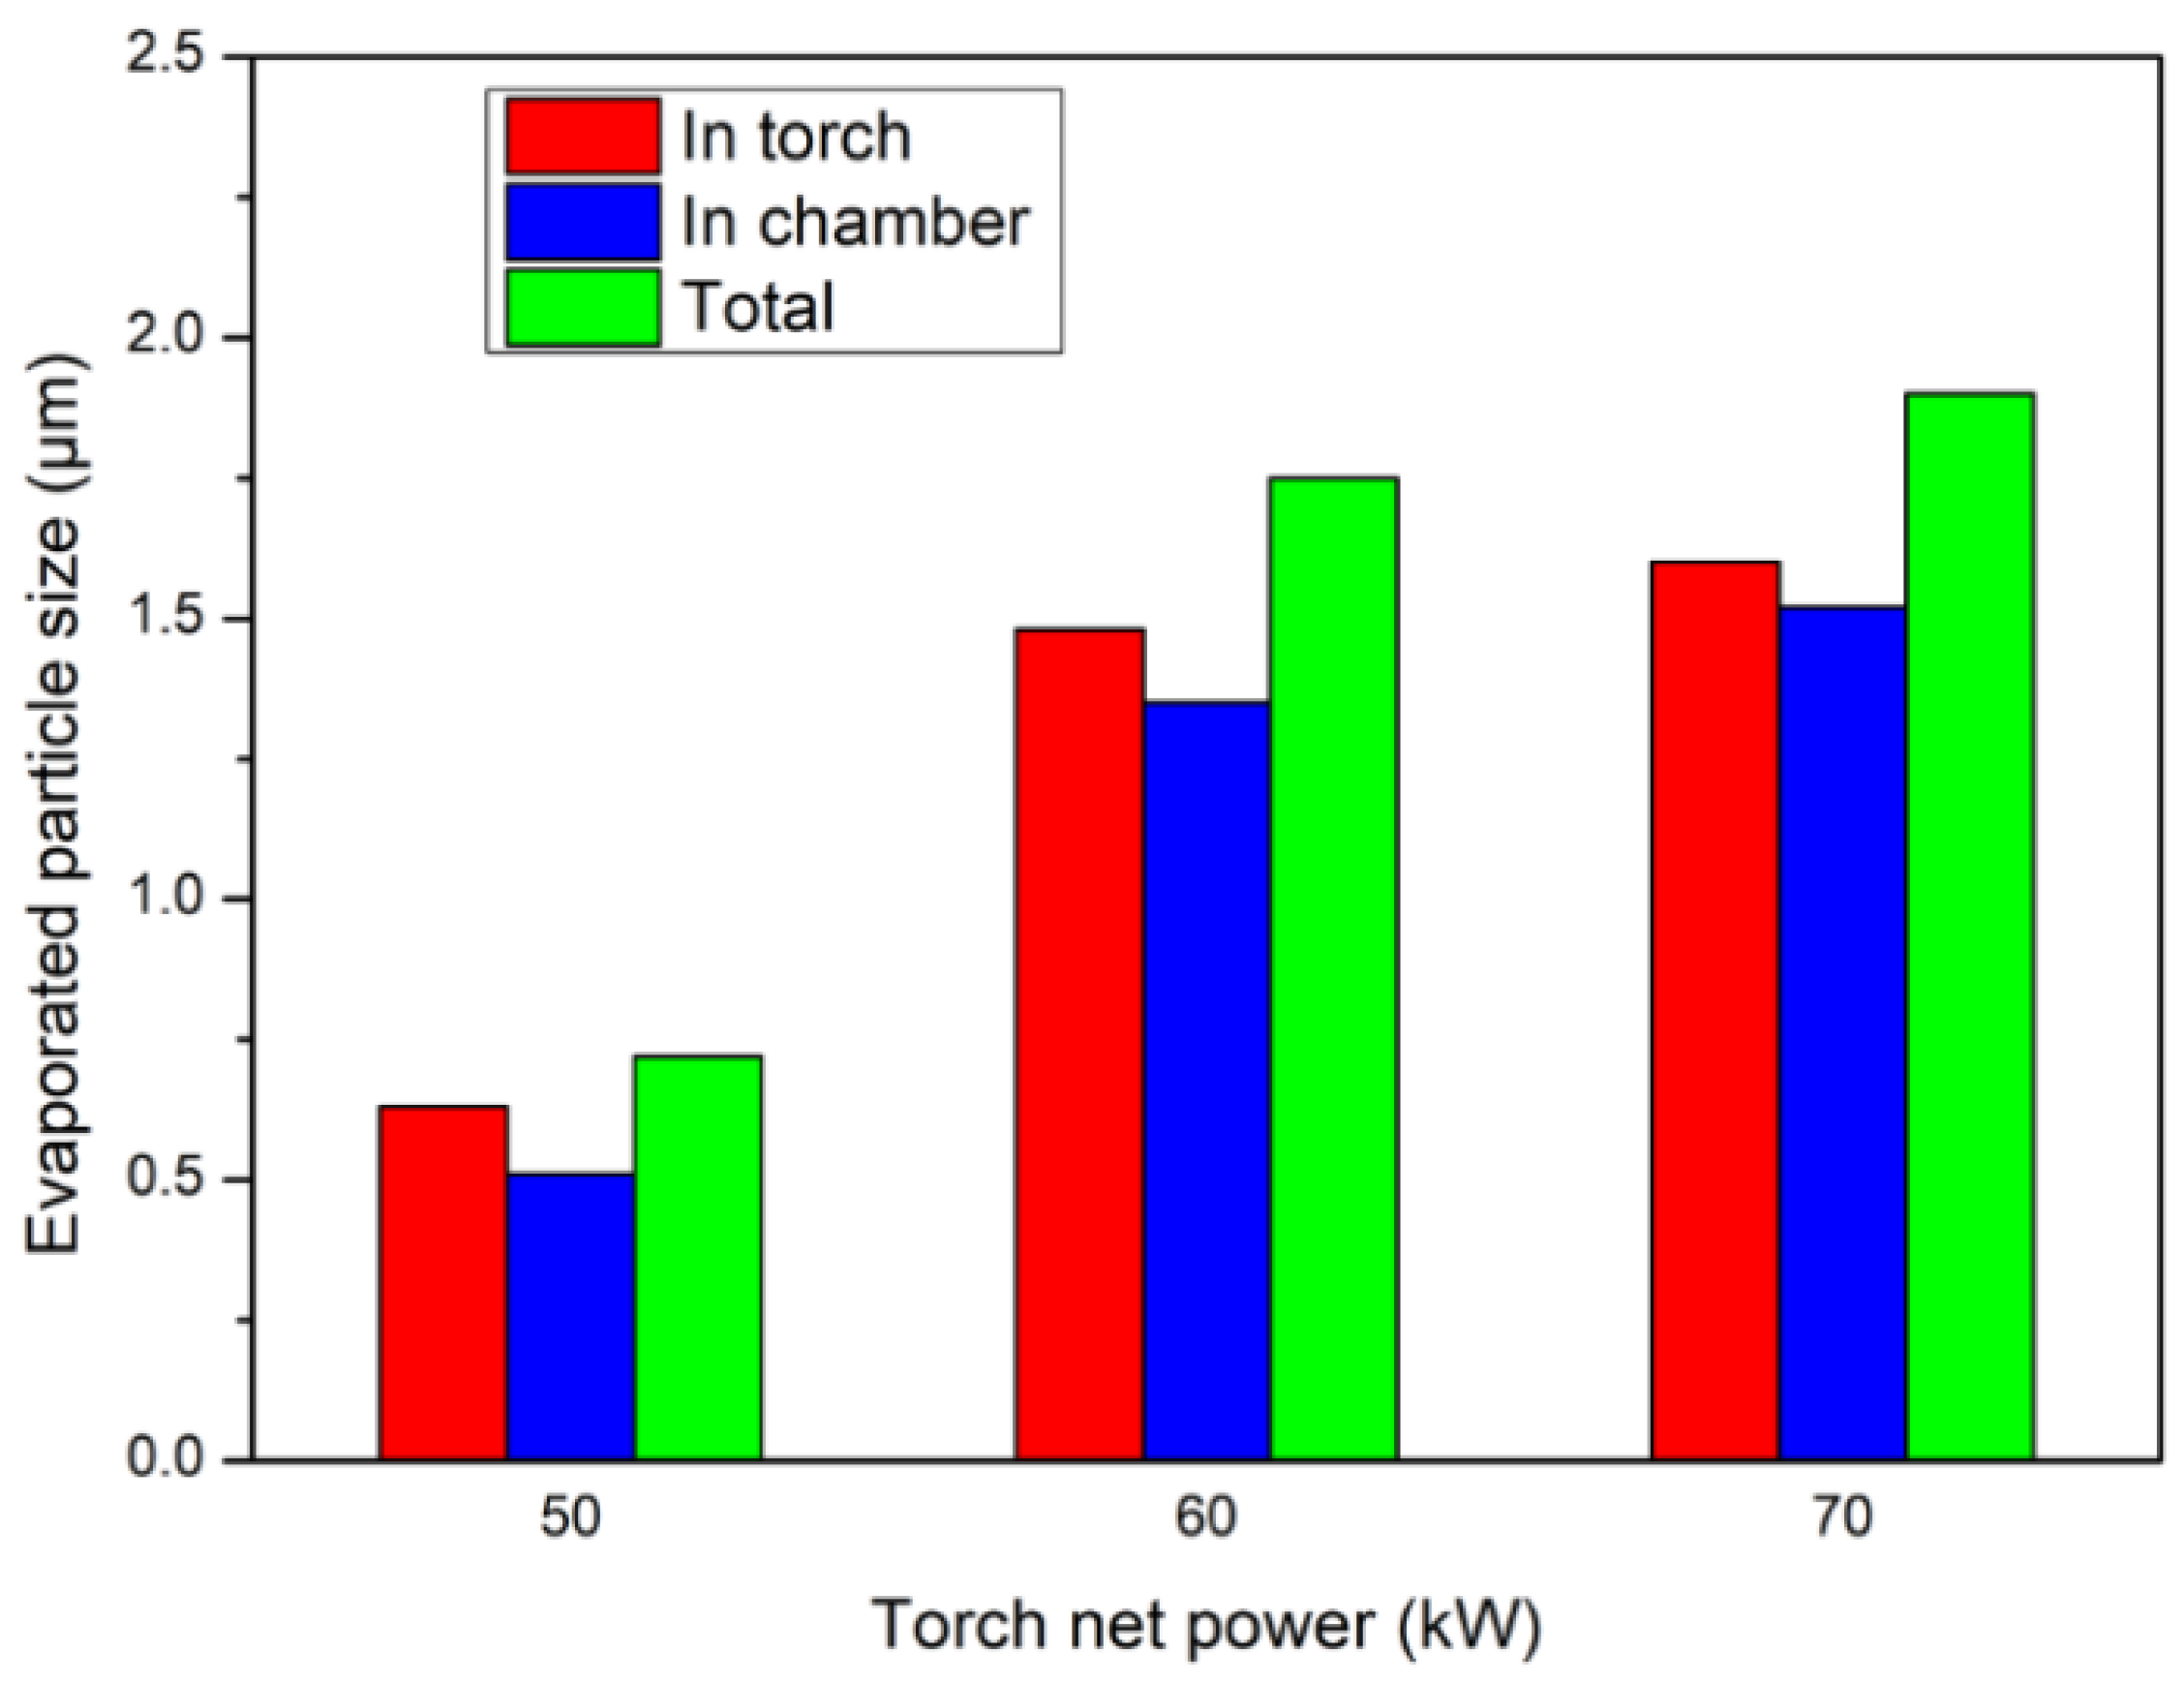
  • The size of the particles fully evaporated inside the torch and chamber deposition was comparable under the Ar–H2 and Ar–He plasma conditions of this study. The particle residence time in the deposition chamber was much longer than that inside the torch nozzle due to a longer flying distance. The longer dwelling time in the chamber was favorable to the heat transfer from plasma to particles in spite of the Knudsen effect at the pressure of 100 Pa that prevailed in the deposition chamber.
  • For a torch net power of 60 kW, the fully vaporized particles were significantly larger in the Ar–He plasma than that in the Ar–H2 plasma under the operating conditions of this study. This was explained by a twice-longer residence time of the particles in the deposition chamber and different characteristics of the plasma jets.
  • An increase in the torch net power brought about an increase in the size of the particles fully vaporized in the Ar–H2 plasma jet. The maximum size was, however, less than 1 µm when the torch power was less than 60 kW.
  • With Ar–He plasma jet, the size of the completely vaporized particles increased significantly when the torch power was increased from 50 to 60 kW, but only slightly when the torch power was increased up to 70 kW. The maximum evaporable was less than 2 µm.

Author Contributions

Conceptualization, T.Z. and A.V.; methodology, T.Z. and A.V.; software, T.Z. and G.M.; writing—original draft preparation, T.Z.; writing—review and editing, A.V., G.M. and C.-J.L.; supervision, C.-J.L.; funding acquisition, C.-J.L. and T.Z. All authors have read and agreed to the published version of the manuscript.

Funding

This research was financially supported by the National Basic Research Program (grant No. 2012CB625104), joint PhD program of China Scholarship Council (grant No. 201506280146) and National Science and Technology Major Project (grant No. 2019-VII-0007-0147).

Institutional Review Board Statement

Not applicable.

Informed Consent Statement

Not applicable.

Data Availability Statement

The data presented in this study are available on request.

Acknowledgments

The authors would like to thank the support of the China Scholarship Council and HPC Platform, Xi’an Jiaotong University.

Conflicts of Interest

The authors declare no conflict of interest.

References

  1. Smith, M.F.; Hall, A.C.; Fleetwood, J.D.; Meyer, P. Very low pressure plasma spray—A review of an emerging technology in the thermal spray community. Coatings 2011, 1, 117–132. [Google Scholar] [CrossRef] [Green Version]
  2. Gindrat, M.; Hohle, H.M.; von Niessen, K.; Guittienne, P.; Grange, D.; Hollenstein, C. Plasma spray-CVD: A New Thermal spray process to produce thin films from liquid or gaseous precursors. J. Therm. Spray Technol. 2011, 20, 882–887. [Google Scholar] [CrossRef]
  3. Salhi, Z.; Klein, D.; Gougeon, P.; Coddet, C. Development of coating by thermal plasma spraying under very low-pressure condition <1 mbar. Vacuum 2005, 77, 145–150. [Google Scholar]
  4. Gao, Y.; Yang, D.M.; Gao, J.Y. Characteristics of a plasma torch designed for very low pressure plasma spraying. J. Therm. Spray Technol. 2012, 21, 740–744. [Google Scholar] [CrossRef]
  5. von Niessen, K.; Gindrat, M.; Refke, A. Vapor phase deposition using plasma spray-PVD (TM). J. Therm. Spray Technol. 2010, 19, 502–509. [Google Scholar] [CrossRef]
  6. Vautherin, B.; Planche, M.P.; Bolot, R.; Quet, A.; Bianchi, L.; Montavon, G. Vapors and droplets mixture deposition of metallic coatings by very low pressure plasma spraying. J. Therm. Spray Technol. 2014, 23, 596–608. [Google Scholar] [CrossRef]
  7. Harder, B.J. Oxidation performance of Si–HfO2 environmental barrier coating bond coats deposited via plasma spray-physical vapor deposition. Surf. Coat. Technol. 2020, 384, 125311. [Google Scholar] [CrossRef]
  8. Xiao, J.; Guo, Q.; Wei, L.L.; He, W.T.; Guo, H.B. Microstructures and phases of ytterbium silicate coatings prepared by plasma spray-physical vapor deposition. Materials 2020, 13, 1721. [Google Scholar] [CrossRef] [PubMed] [Green Version]
  9. Goral, M.; Kotowski, S.; Nowotnik, A.; Pytel, M.; Drajewicz, M.; Sieniawski, J. PS-PVD deposition of thermal barrier coatings. Surf. Coat. Technol. 2013, 237, 51–55. [Google Scholar] [CrossRef]
  10. Schmitt, M.P.; Harder, B.J.; Wolfe, D.E. Process-structure-property relations for the erosion durability of plasma spray-physical vapor deposition (PS-PVD) thermal barrier coatings. Surf. Coat. Technol. 2016, 297, 11–18. [Google Scholar] [CrossRef] [Green Version]
  11. Adamovich, I.; Baalrud, S.D.; Bogaerts, A.; Bruggeman, P.J.; Cappelli, M.; Colombo, V.; Czarnetzki, U.; Ebert, U.; Eden, J.G.; Favia, P.; et al. The 2017 Plasma roadmap: Low temperature plasma science and technology. J. Phys. D Appl. Phys. 2017, 50, 323001. [Google Scholar] [CrossRef]
  12. Mauer, G. Plasma Characteristics and plasma-feedstock interaction under PS-PVD process conditions. Plasma Chem. Plasma P 2014, 34, 1171–1186. [Google Scholar] [CrossRef] [Green Version]
  13. Mauer, G.; Hospach, A.; Zotov, N.; Vassen, R. Process Conditions and Microstructures of Ceramic Coatings by Gas Phase Deposition Based on Plasma Spraying. J. Therm. Spray Technol. 2013, 22, 83–89. [Google Scholar] [CrossRef]
  14. Song, C.; Xie, S.-m.; Fan, X.-J.; He, P.-J.; Liu, M.; Zhou, K.-S.; Deng, C.-M.; Liao, H.-L. Very low-pressure plasma-sprayed dense yttria-stabilized zirconia coatings using an axial bi-cathode plasma torch. Surf. Coat. Technol. 2020, 402, 126281. [Google Scholar] [CrossRef]
  15. Mauer, G.; Vassen, R.; Stover, D. Thin and dense ceramic coatings by plasma spraying at very low pressure. J. Therm. Spray Technol. 2010, 19, 495–501. [Google Scholar] [CrossRef]
  16. Chen, Q.-Y.; Li, C.-X.; Zhao, J.-Z.; Yang, G.-J.; Li, C.-J. Microstructure of YSZ coatings deposited by PS-PVD using 45 kW shrouded plasma torch. Mater. Manuf. Process. 2015, 31, 1183–1191. [Google Scholar] [CrossRef]
  17. Chen, Q.-Y.; Peng, X.-Z.; Yang, G.-J.; Li, C.-X.; Li, C.-J. Characterization of plasma jet in plasma spray-physical vapor deposition of YSZ using a <80 kW shrouded torch based on optical emission spectroscopy. J. Therm. Spray Technol. 2015, 24, 1038–1045. [Google Scholar] [CrossRef]
  18. Mauer, G.; Jarligo, M.O.; Rezanka, S.; Hospach, A.; Vassen, R. Novel opportunities for thermal spray by PS-PVD. Surf. Coat. Technol. 2015, 268, 52–57. [Google Scholar] [CrossRef]
  19. Chen, X.; Chen, J.; Wang, Y.D. Heat-Transfer from a rarefied plasma-flow to a metallic particle with high surface-temperature. J. Phys. D Appl. Phys. 1994, 27, 1637–1645. [Google Scholar] [CrossRef]
  20. Chen, X.; Chen, X.M. Drag on a metallic or nonmetallic particle exposed to a rarefied plasma-flow. Plasma Chem. Plasma P 1989, 9, 387–408. [Google Scholar] [CrossRef]
  21. Chen, X.; Chyou, Y.P.; Lee, Y.C.; Pfender, E. Heat-transfer to a particle under plasma conditions with vapor contamination from the particle. Plasma Chem. Plasma Process. 1985, 5, 119–141. [Google Scholar] [CrossRef]
  22. Chen, X.; Pfender, E. Effect of pressure on heat-transfer to a particle exposed to a thermal plasma. J. Eng. Gas Turbines Power 1985, 107, 147–151. [Google Scholar] [CrossRef]
  23. Chen, X. The drag force on a spherical particle in a rarefied plasma flow with combined specular and diffuse reflection at the particle surface. J. Phys. D Appl. Phys. 1997, 30, 2561–2565. [Google Scholar] [CrossRef]
  24. Xi, C.; Ping, H. Heat-transfer from a rarefied plasma-flow to a metallic or nonmetallic particle. Plasma Chem. Plasma Process. 1986, 6, 313–333. [Google Scholar]
  25. Anwaar, A.; Wei, L.; Guo, H.; Zhang, B. Plasma–powder feedstock interaction during plasma spray–physical vapor deposition. J. Therm. Spray Technol. 2017, 26, 292–301. [Google Scholar] [CrossRef]
  26. Liu, M.-J.; Zhang, M.; Zhang, Q.; Yang, G.-J.; Li, C.-X.; Li, C.-J. Evaporation of droplets in plasma spray–physical vapor deposition based on energy compensation between self-cooling and plasma heat transfer. J. Therm. Spray Technol. 2017, 26, 1641–1650. [Google Scholar] [CrossRef]
  27. Ivchenko, D.; Zhang, T.; Mariaux, G.; Vardelle, A.; Goutier, S.; Itina, T.E. On the Validity of continuum computational fluid dynamics approach under very low-pressure plasma spray conditions. J. Therm. Spray Technol. 2018, 27, 3–13. [Google Scholar] [CrossRef]
  28. Zhang, T.; Mariaux, G.; Vardelle, A.; Li, C.-J. numerical simulation of plasma jet characteristics under very low-pressure plasma spray conditions. Coatings 2021, 11, 726. [Google Scholar] [CrossRef]
  29. Mauer, G. Numerical Study on Particle-Gas Interaction close to the substrates in thermal spray processes with high-kinetic and low-pressure conditions. J. Therm. Spray Technol. 2019, 28, 27–39. [Google Scholar] [CrossRef] [Green Version]
  30. Vautherin, B.; Planche, M.P.; Montavon, G.; Lapostolle, F.; Quet, A.; Bianchi, L. Study of metallic powder behavior in very low pressure plasma spraying (VLPPS)—Application to the manufacturing of titanium-aluminum coatings. Surf. Coat. Technol. 2015, 275, 341–348. [Google Scholar] [CrossRef]
  31. Ivchenko, D. Modeling and Design of a Physical Vapor Deposition Process Assisted by Thermal Plasma (PS-PVD). Ph.D. Thesis, Université de Limoges, Limoges, France, 2018. [Google Scholar]
  32. Mariaux, G.; Vardelle, A. 3-D time-dependent modelling of the plasma spray process. Part 1: Flow modelling. Int. J. Sci. 2005, 44, 357–366. [Google Scholar] [CrossRef]
  33. Ivchenko, D.; Mariaux, G.; Vardelle, A.; Goutier, S.; Itina, T.E.; Andre, P. Feasibility study of an adaptive-pressure plasma coating process-Part 1: Model description. J. Therm. Spray Technol. 2020, 29, 25–37. [Google Scholar] [CrossRef]
  34. Lu, T. Micro and Nanoscale Characterization of Three Dimensional Surfaces: Basics and Applications; Napoca Star Publishing House: Cluj-Napoca, Romania, 2015. [Google Scholar]
  35. Dykhuizen, R.C.; Smith, M.F. Gas dynamic principles of cold spray. J. Therm. Spray Technol. 1998, 7, 205–212. [Google Scholar] [CrossRef]
  36. Dolmaire, A.; Hartikainen, E.; Goutier, S.; Béchade, E.; Vardelle, M.; Geffroy, P.-M.; Joulia, A. Benefits of hydrogen in a segmented-anode plasma torch in suspension plasma spraying. J. Therm. Spray Technol. 2021, 30, 236–250. [Google Scholar] [CrossRef]
  37. Anwaar, A.; Wei, L.; Guo, Q.; Zhang, B.; Guo, H. Novel Prospects for plasma spray–physical vapor deposition of columnar thermal barrier coatings. J. Therm. Spray Technol. 2017, 26, 1810–1822. [Google Scholar] [CrossRef]
  38. Vardelle, A.; Moreau, C.; Themelis, N.J.; Chazelas, C. A Perspective on plasma spray technology. Plasma Chem. Plasma Process. 2015, 35, 491–509. [Google Scholar] [CrossRef]
Figure 1. 7.5 wt.% yttria partially stabilized zirconia powder (YSZ); powder M6700 (Oerlikon Metco, Zurich, Switzerland).
Coatings 11 01154 g001
Figure 2. CFD computational domain geometry. (a) F4 plasma torch and (b) O3CP plasma torch. All dimensions are in millimeters.
Coatings 11 01154 g002
Figure 3. Temperature and velocity fields of the plasma jet for different net electric powers: (a) 40 kW, (b) 50 kW and (c) 60 kW. 40 SLPM of argon, 8 SLPM of hydrogen, chamber pressure: 100 Pa.
Coatings 11 01154 g003
Figure 4. Variation of the temperature (a) and velocity (b) of the plasma jet along the jet axis for different net electric powers. 40 SLPM of argon, 8 SLPM of hydrogen, chamber pressure: 100 Pa. The green vertical dotted line indicates the location of the plasma torch nozzle exit.The purple vertical dotted line indicates the location of the substrate during actual coating deposition.
Coatings 11 01154 g004
Figure 5. Temperature and velocity fields of the plasma jet for different net electric powers: (a) 50 kW, (b) 60 kW, and (c) 70 kW. 60 SLPM of argon, 30 SLPM of helium, chamber pressure: 100 Pa.
Coatings 11 01154 g005
Figure 6. Variation of the temperature (a) and velocity (b) of the plasma jet along the jet axis for different net electric powers. 60 SLPM of argon, 30 SLPM of helium, chamber pressure: 100 Pa. The green vertical dotted line indicates the location of the plasma torch nozzle exit. The purple vertical dotted line indicates the location of the substrate during actual coating deposition.
Coatings 11 01154 g006
Figure 7. Surface heat flux transferred from plasma gas to particles at different positions along the torch axis for different net torch powers. 40 SLPM of argon, 8 SLPM of hydrogen, chamber pressure: 100 Pa.
Coatings 11 01154 g007
Figure 8. Effect of the torch net power on the specific enthalpy of particles stored over their travel inside the plasma torch (from injection point to nozzle exit); the horizontal red dotted line corresponds to the YSZ evaporation enthalpy (8561 kJ/kg) and black dotted lines to the YSZ melting enthalpy (2386 kJ/kg). 40 SLPM of argon, 8 SLPM of hydrogen, chamber pressure: 100 Pa.
Coatings 11 01154 g008
Figure 9. Effect of the torch net power on the specific enthalpy of particles stored over their travel in the free jet (from nozzle exit to substrate standoff distance); the horizontal red dotted line corresponds to the YSZ evaporation enthalpy (8561 kJ/kg) and black dotted lines to the YSZ melting enthalpy (2386 kJ/kg). 40 SLPM of argon, 8 SLPM of hydrogen, chamber pressure: 100 Pa.
Coatings 11 01154 g009
Figure 10. Effect of the torch net power on the size of the fully evaporated YSZ particles in the torch, free jet and in total. 40 SLPM of argon, 8 SLPM of hydrogen, chamber pressure: 100 Pa.
Coatings 11 01154 g010
Figure 11. Surface heat flux from plasma gas to particles at different positions along the torch axis for different net torch powers. 60 SLPM of argon, 30 SLPM of helium, chamber pressure: 100 Pa.
Coatings 11 01154 g011
Figure 12. Effect of the torch net power on the specific enthalpy of particles stored over their travel inside the plasma torch (from injection point to nozzle exit); the horizontal red dotted line corresponds to the YSZ evaporation enthalpy (8561 kJ/kg) and black dotted lines to the YSZ melting enthalpy (2386 kJ/kg). 60 SLPM of argon, 30 SLPM of hydrogen, chamber pressure: 100 Pa.
Coatings 11 01154 g012
Figure 13. Effect of the torch net power on the specific enthalpy of particles stored over their travel in the free jet (from nozzle exit to substrate standoff distance); the horizontal red dotted line corresponds to the YSZ evaporation enthalpy (8561 kJ/kg) and black dotted lines to the YSZ melting enthalpy (2386 kJ/kg). 60 SLPM of argon, 30 SLPM of helium, chamber pressure: 100 Pa.
Coatings 11 01154 g013
Figure 14. Effect of the torch net power on the size of the fully evaporated YSZ particles in the torch, free jet and in total. 60. SLPM of argon, 30 SLPM of helium, chamber pressure: 100 Pa.
Coatings 11 01154 g014
Table 1. Plasma torch model and operating parameters for the PS-PVD spray process used in this study. The torch net power is defined as the input electric power minus the heat losses to the electrode cooling water.
ParametersF4 O3CP
Net power, kW40–50–6050–60–70
Plasma gas, SLPM40 Ar/8 H260 Ar/30 He
Nozzle diameter, mm612.5
Chamber pressure, Pa100100
Spray distance, m~0.45~1
Mass flow rate, kg/s0.00120.00187
Specific enthalpy, MJ/kg33.3–41.7–5026.8–32.1–37.4
Table 2. Residence time of particles in the plasma torch and deposition chamber under different arc net powers.
Plasma Torch TypeNet Power (kW)Residence Time of Particles (µs)
In TorchIn Chamber
F44040160
5037155
6033149
O3CP5038256
6035232
7030214
Publisher’s Note: MDPI stays neutral with regard to jurisdictional claims in published maps and institutional affiliations.

