Review

Sintering Modeling of Thermal Barrier Coatings at Elevated Temperatures: A Review of Recent Advances

1
Department of Mechanical and Aerospace Engineering, Carleton University, Ottawa, ON K1S 5B6, Canada
2
Aerospace Research Centre, National Research Council Canada, Ottawa, ON K1A 0R6, Canada
3
NASA Glenn Research Center, Cleveland, OH 44135, USA
*
Author to whom correspondence should be addressed.
Coatings 2021, 11(10), 1214; https://doi.org/10.3390/coatings11101214
Submission received: 18 July 2021 / Revised: 19 September 2021 / Accepted: 28 September 2021 / Published: 3 October 2021
(This article belongs to the Special Issue Coatings for Extreme Environments)

Abstract

:
To achieve a higher efficiency in gas turbine engine by increasing the inlet-temperature of burning gas is one of the primary goals in aviation industry. The development of thermal barrier coating system (TBCs) continuously raises the inlet-temperature of gas turbine engine in the past decades. Due to the complexity of TBCs and harsh operation environments, the degradation and failure mechanisms of hot section components have not been fully understood, and consequently limits the application of TBCs. It was identified that high-temperature sintering of the topcoat in a typical TBC could be one of the major sources of its failure since the microstructures of the constituent coating layers evolve dynamically during the service period, resulting in significant changes of mechanical and thermal physical properties of the coating system. This paper intends to review recent advances of analytical and numerical modeling of sintering of topcoat in TBCs including the modeling methodology and applications of the models, particularly the implementation of finite element combined with specific materials constitutive functions. Critical remarks on the future development and applications of these models are also discussed in the end.

1. Introduction

To improve the combustion efficiency of gas turbine and/or aero-engine, the thermodynamic principle suggests that this can be achieved by increasing the operating temperature of the system. For the past decades, a considerable effort has been made to advance the design and development of superalloys and novel protective coatings aimed at significantly raising the thermal efficiency of turbine engines [1,2]. Thermal barrier coatings (TBCs) have been designed as the protective systems that were widely applied to turbine hot section components, such as blades, vanes, and combustor liners, providing thermal insulation and thus decreasing the hot section temperatures during service operation. With the help of the TBCs, the operating temperature capability of hot section components can increase by 100~150 °C or even more, which allows to reach as high as 1450 °C or higher surface temperature in service. In addition, TBC system can also extend the lifespan of hot section components by minimizing the creep deformation [2,3,4].
Currently, the prime-reliant TBCs have not been fully realized, (and the premature failure of hot section components could often cause catastrophe accidents during service operation—This is true only if TBCs are prime reliant. Currently, TBCs are not prime reliant, and therefore the designers take the TBC failure into consideration to avoid catastrophic component failure in case TBCs fails. The often-observed failure modes include compressive buckling and spallation of coatings from the attached substrate blades. To mitigate such failures, non-destructive testing (NDT) techniques are often used to monitor the microcrack evolution and/or lower the blade temperatures to reduce its creep deformation. Certainly, these measures will increase the cost and yet unable to fully exploit the performance of TBCs [2,5,6]. The causes of premature failures are normally variant, including but not limited to oxidation of bond coat, water vapor effect on bond coat and topcoat [7], solid particle erosion [8,9], the foreign matter deposition such as calcium-magnesium aluminosilicate (CMAS) and sintering of topcoat. Since the topcoats are made of porous ceramic materials, the sintering of topcoat is inevitable during the operation. As sintering proceeds, the porous ceramic topcoat will densify, degrading the thermal conductivity [10,11] and increasing the in-plane modulus. As a result, the in-plane stress will increase significantly to initiate vertical cracks and weaken the insulation performance of TBCs, leading to accelerated oxidation of bond coat. All these factors may induce degradation and spallation of coating system [12,13,14,15,16,17,18,19].
Literature indicates that sintering of topcoat at elevated temperatures is one of the main causes leading to topcoat spallation [20], although the mechanisms of sintering are not fully understood. In general, it was known that the driving force of sintering is the reduction of total interface energy of the coating systems; in other words, sintering reduces the air/solid interface by curing the pores, cracks, and coarsen the grains. The curing process of pores and/or defects due to sintering can be simulated numerically through application of variational principles. However, the dynamic changes of microstructures of coating system during service period make it a significant challenge to design an optimised geometry for the representative model. Also, the evolution of mechanical properties was not fully understood due to the complexity of microstructures [14,21,22,23,24]. To date, a number of sintering models were established to evaluate the sintering behaviors of topcoat during the life cycle of TBCs, which helps enhancing the prediction accuracy of finite element modeling. The focus of this review is on sintering modeling in both analytical and numerical manner including the implementations of finite element analysis (FEA).
The schedule of this review paper is as follows. In Section 2, a brief description of the TBC constituents and their functions were given. Section 3 introduced the physics and principles behind sintering of topcoat including analytical and numerical models. As examples, two representative sintering models were presented in detail in Section 4 and Section 5. In Section 6, EB-PVD TBC sintering model was described and discussed. Section 7 showed the image-based sintering modeling and its applications combined with FEA simulation and future trends of applications of sintering and cracking of TBCs.

2. Constituents of TBC System

To work under harsh environments with high performance, the topcoat in TBCs must be made to meet the following criteria: (1). lower thermal conductivity to maximally isolate the heat attack to the substrate, (2). Closely match the expansion of thermal coefficient (CTE) to the substrate CTE to reduce the residual stress upon cooling of the TBCs, (3). phase stability during service periods such as during thermal cycles and/or isothermal dwell period, (4). better resistance to sintering at elevated temperatures, and (5). lower the Young’s modulus to achieve better strain compliance. At present, TBCs are made of a multiple-layer system to meet these criteria comprising a ceramic topcoat (TC) and a bond coat (BC). The metallic BC is the first layer deposited onto the superalloy substrate, with thickness of about 60 µm, working as an intermediate layer to adhere the superalloy and TC. The 100–400 µm ceramic TC is then deposited to insulate the heat flux from hot gas. During the operation period, a relatively thin layer (1–10 µm) thermally-growth oxide (TGO) is generated via the oxidation of BC, that may damage the cohesive strength at the BC-TC interface [1,2,25].
Due to its low thermal conductivity, the ceramic topcoat plays a major role in reducing the heat attack and transfer in the TBC system. At present, most of the commercial TC is made of zirconia ZrO2 stabilized with 7 wt.%–8 wt.% yttrium oxide Y2O3, which is known as 7YSZ in the literature. The thermal conductivity (k) of the 7YSZ varies depending on the deposition methods and service temperature. For 7YSZ deposited by electron-beam physical vapor deposition (EB-PVD) method, the typical thermal conductivity of topcoat is around 1.5–1.9 W·m−1·K−1; while with thermal plasma spray (PS) approach, its k value is even lower around 0.8–1.1 W·m−1·K−1 [1,26,27]. Attempts were made in the last decade to further reduce the thermal conductivity of topcoat in two approaches: modify YSZ by co-doping rare-earth oxide, also known as lanthanide (Ln) oxide (e.g., Ln: Gd, Yb, Sc, etc.) and add larger lanthanides elements into zirconia to produce zirconate pyrochlore oxides (Ln2Zr2O7). The purpose of adding rare-earth oxides is to modify the oxide crystal structure to reduce the absorption coefficient. Reported from literatures, the k in Nd, Gd, or Sm and Yb co-doping YSZ TBC and Ln2Zr2O7 (Ln: La, Gd, Sm, Nd) pyrochlore oxide TBC is as low as 0.6–1.0 W·m−1·K−1 at high temperature [5,28].
Phase stability of topcoat oxides is another key factor in maximizing the lifetime of TBCs. The pure zirconia normally undergoes phase transitions from the tetragonal crystal structure (t-YSZ) to monoclinic (m-YSZ) and cubic (c-YSZ) crystal structure when the TBCs is cooled down, and the induced volume change (3–5%) during the phase transition will initiate cracks formation that could lead to the failure of coatings. With the addition of 7wt.%–8 wt.% Y2O3, the 7YSZ is deposited as a tetragonal-prime crystal structure (t′-YSZ) which is a metastable phase and remains as t′-YSZ during cooling down to the ambient. However, this t’ phase will become unstable when the working temperature is higher than 1200 °C, which limits the maximum operating temperature of 7YSZ TC [1,5,29]. The zirconate pyrochlore oxides (Ln2Zr2O7) aforementioned were found to have higher temperature stability between 1550 to 2200 °C and potential to become alternative materials as TC [15].
A close matching of coefficients of thermal expansion ( α ) among the TC, TGO, BC and the substrate is a key to improving the life cycle of TBCs. During the heating and cooling thermal cycles, the thermal expansion mismatch from the individual layers in TBCs will generate significant residual stresses [19]. Although the visco-plastic deformation of the topcoat at elevated temperatures can release the stresses to a certain level, the residual stresses still remain largely upon cooling down to the ambient. Compared to the CTE mismatch of intermetallic bond coat and 7YSZ topcoat with the Ni-base superalloys substrate, the TGO possesses significantly larger CTE mismatch with the substrate. As a result, as the TGO thickens, this mismatch-induced residual stresses could exceed the critical interfacial strength of individual layers, causing TBCs spallation and failure [1,17,18,19,30,31,32].
It is also necessary to point out that the mechanical and physical properties and also the compositions and morphologies of TBCs evolve during the service cycles. These changes can affect the sintering behaviour of the topcoat, and hence affect degradation behaviour of coatings. Consequently, it is imperative to better understand the evolution of these materials to mitigate premature TBC failure and thereby improve the life cycle of TBCs.

3. Numerical Modelling Principles and Methodology

3.1. Variational Principle

The TBCs are porous ceramics materials capable of reaching their maximum insulation performance. In a high-temperature harsh service environment, atoms in the porous ceramics are highly mobilized to diffuse along the lattice, grain boundaries, and pore surface to minimize the free energy of surface. Such diffusion process will inevitably change the mechanical properties of the ceramic topcoat, which is normally called the sintering and responsible for failure of TBCs. To predict the microstructure changes due to sintering, Cocks et al. [33] developed a sintering model based on the variational principle. Apart from sintering in TBC coatings, the model has been applied to other problems like powder compaction [34]. The diffusion process consumes free energy of the system, and the free energy has also to dissipate to the environment due to the energy conservation. In this process, a balance between the free energy reduction rate G ˙ and energy dissipation Ψ will be established: Π = G ˙ + Ψ . To keep the system stable, the function should be minimized with respect to evolution of microstructure, described via Equation (1):
δ Π = δ ( G ˙ + Ψ ) = 0
The mass diffusion process results in the geometry change in the location of sintering, therefore, items in Equation (1) can be represented by geometry parameters. Herein, we used the model built by Cipitria et al. [21] as an example. When the surface and grain boundary diffusion are taken into account, the expressions of G ˙ and Ψ are defined, respectively, as:
G = 1 V [ A S   γ S d A S + A g b   γ g b d A g b ]
where V is the volume of the corresponding domain, A is the area of the unit, γ is the specific energies, and their subscript S and g b stand for surface and grain boundary.
Ψ = 1 V [   A g b   1 2 M g b Ω δ g b ( j g b 2 ) d A g b + A S   1 2 M S Ω δ S ( j S 2 ) d A S + A g b   1 2 m m ( v m ) 2   d A g b   ]
where M is the atomic mobility, Ω is the atomic volume, j is the volumetric flux per unit length, δ is the thickness of the layer of diffusion, v m is the grain boundary migration mobility and m m is the intrinsic grain boundary mobility. The mobility M and m m are derived from the diffusivity of the materials. Equation (3) is the summation of three terms: the grain boundary diffusion, surface diffusion, and grain boundary migration.
As per the law of mass conservation and if no material addition or sink is assumed, the flux j equals to the migration velocity v :
j + v = q = 0
If grain boundary and surface flux can be represented by the velocities in the geometry dimensions in terms of the radius and height of the models, the principle Equation (1) is represented in variables of the geometry dimension evolution rate. For example, in Cipitria et al.’s model [21], Equation (1) expressed as:
Π ( h ˙ , z s ˙ , r s ˙ , N s ˙ , a ˙ , y c ˙ ) = G t ( h ˙ , z s ˙ , r s ˙ , N s ˙ , a ˙ , y c ˙ ) + Ψ ( h ˙ , z s ˙ , r s ˙ , N s ˙ , a ˙ , y c ˙ )  
where the variables stand for the rate of change of each geometry dimension. The geometry evolutions can be predicted with a set of ordinary differential equations. The details of the dimensional tags will refer to Figure 1, the schematic diagram of the model.
In this model, however, the macroscopic Young’s modulus is assumed to hold fixed during the sintering process, which is impractical in actual scenarios and make the life prediction inaccurate. As sintering proceeds, the topcoat will densify, and consequently, its stiffness will increase. The sintering model developed by Cocks and Flecks [35] used a knock-down factor x based on the size of the cracks in the topcoat to determine the effective Young’s modulus, bulk modulus and shear modulus in porous ceramics. Such approximated method was first introduced by Budiansky and O’Connel [36] and made the evolution of macroscopic modulus possible.

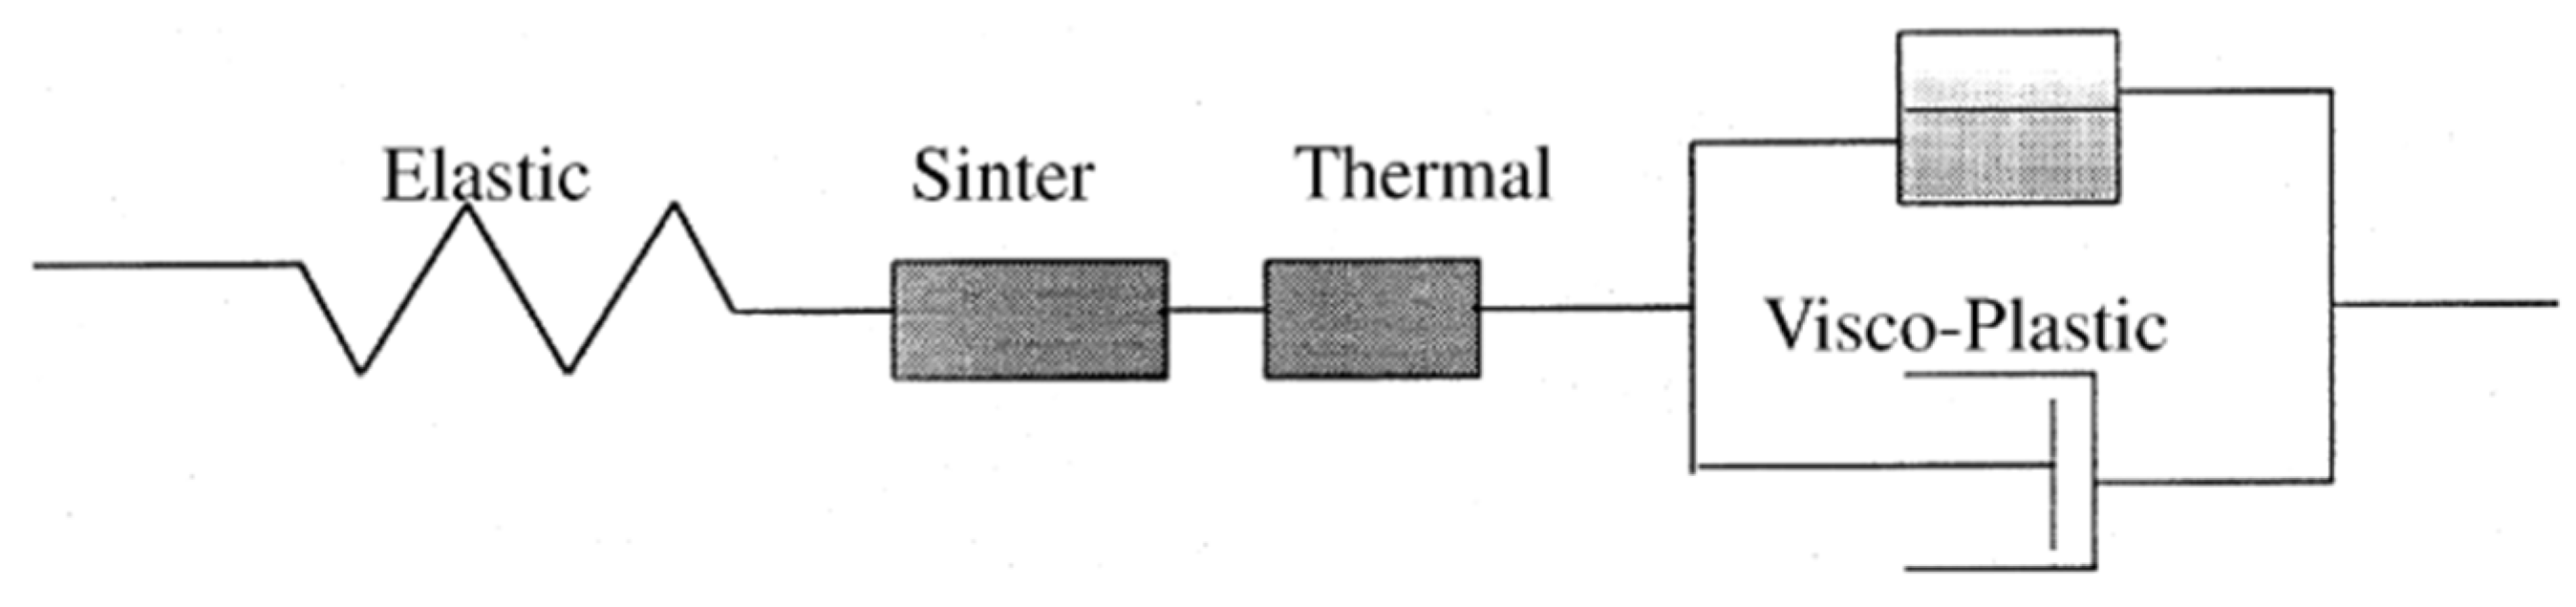
3.2. Constitutive Sintering Models

In the previous section, the variational principle applied to conducting sintering modeling is more focused on the elastic response of the ceramic topcoat. However, the ceramics topcoat is not merely elastic; instead, viscoplastic deformation and/or creep occurs at elevated temperatures. To reflect all of these factors in sintering modeling, Gasik and Zhang [37] built a constitutive model to determine the stress-strain relationship for a thermal elasto-viscoplastic material as shown in a schematic block diagram in Figure 2.
The equation describing the constitutive model is:
d ε = { d ε E } + { d ε V p } + { d ε s i n t } + { d ( α T ) }
and the incremental strain term is:
{ d σ } = [ D ] ( { d ε } [ η ] 1 { σ ¯ } d t { d ε s i n t } { d ( α T ) } )
where the superscripts E and Vp represent the elastic, sintering, visco-plastic components in Figure 2, and α T is the thermal expansion strain.
Furthermore, the constitutive models can be implemented into a FE analysis. In some FE analysis, the mechanical and thermal properties are static during the analysis process, which, in turn, makes the simulation results inaccurate in sintering modeling. With the help of constitutive models, the dynamic property inputs largely improve the prediction accuracy of FE modeling. Several FE analysis examples will be introduced in the following sections.

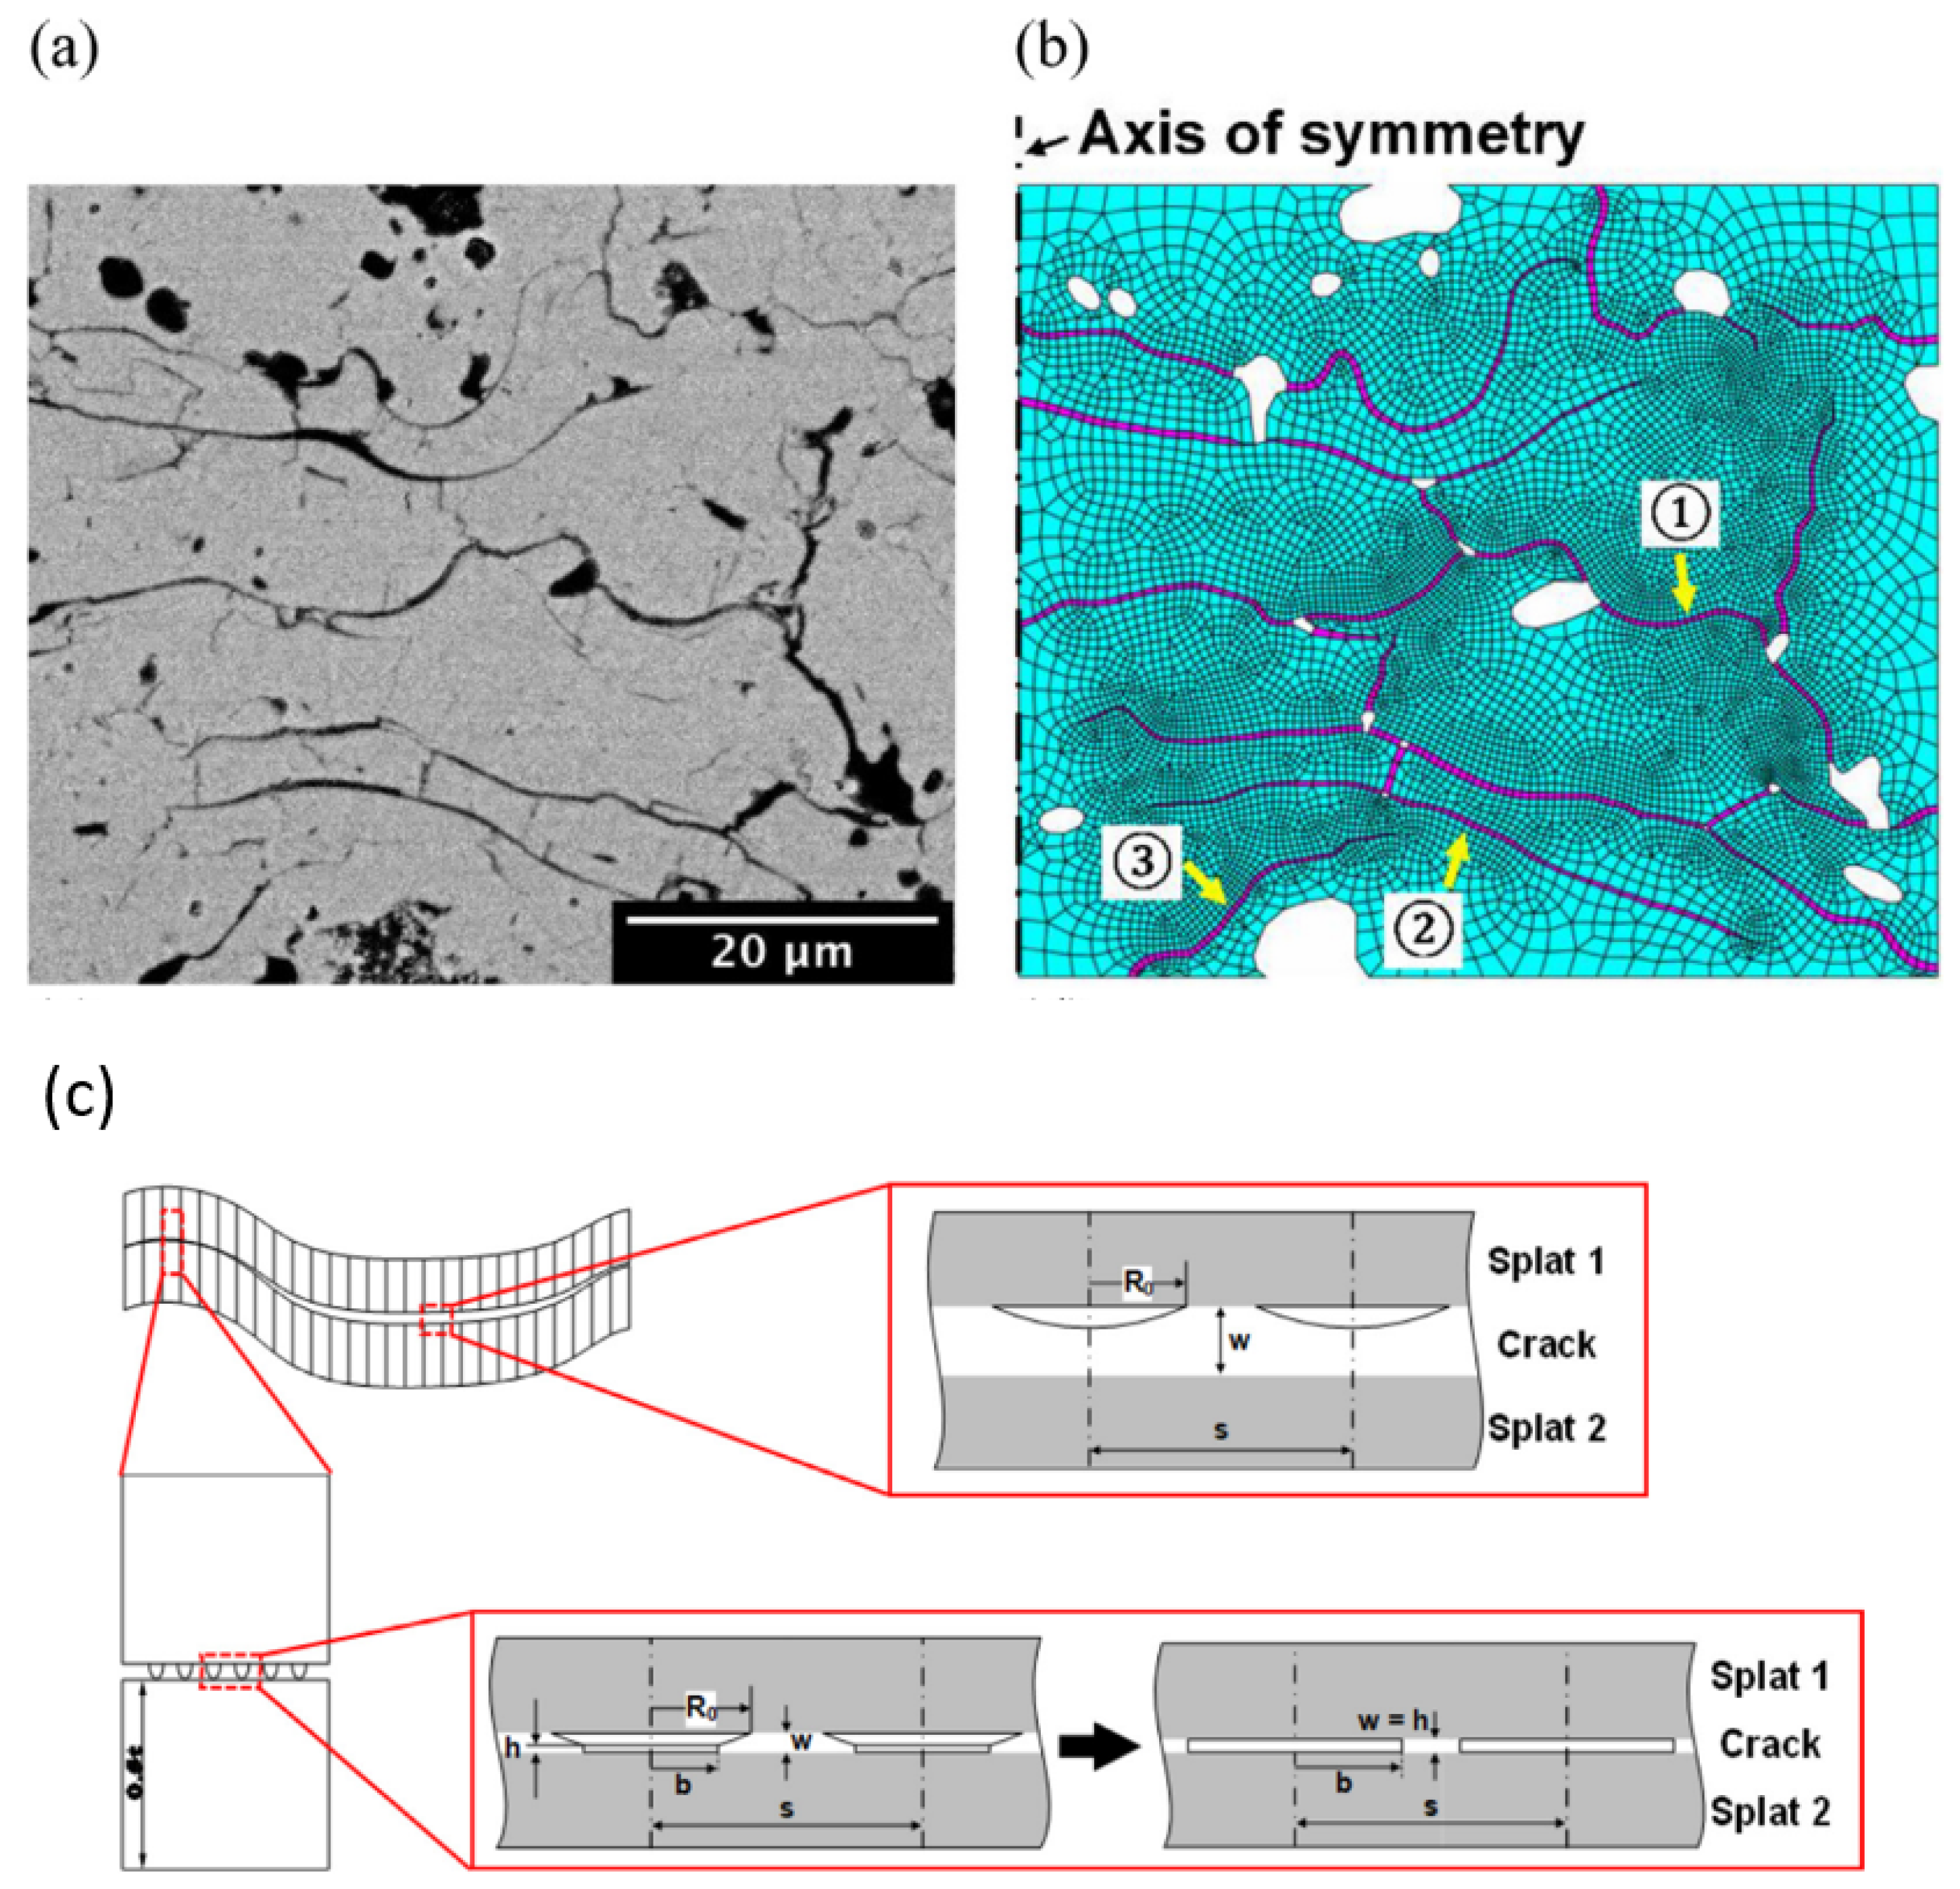
4. Three Dimension Periodic APS TBC Sintering Model

The development of this sintering model was established based on SEM observations of as-deposit coating. In the deposition process of the plasma-sprayed topcoat, the YSZ powders are melted in the feedstock, projected onto the bond coat in the form of melted or semi-melted powder, and finally form an adherent coating on the bond coat [38]. Cipitria et al. found that the as-deposited APS splats are disc-like shapes, and each of the splats is connected by a smaller round disc-like bridge. As splats pile up, they may not contact fully in order and several defects will nucleate and grow. Three main types of defects are observed: interlamellar pores, intra-splat microcracks, and greater size globular voids identified through SEM image observations. These types of defects are named as domains (1) to (3) in the model [21,39,40,41].

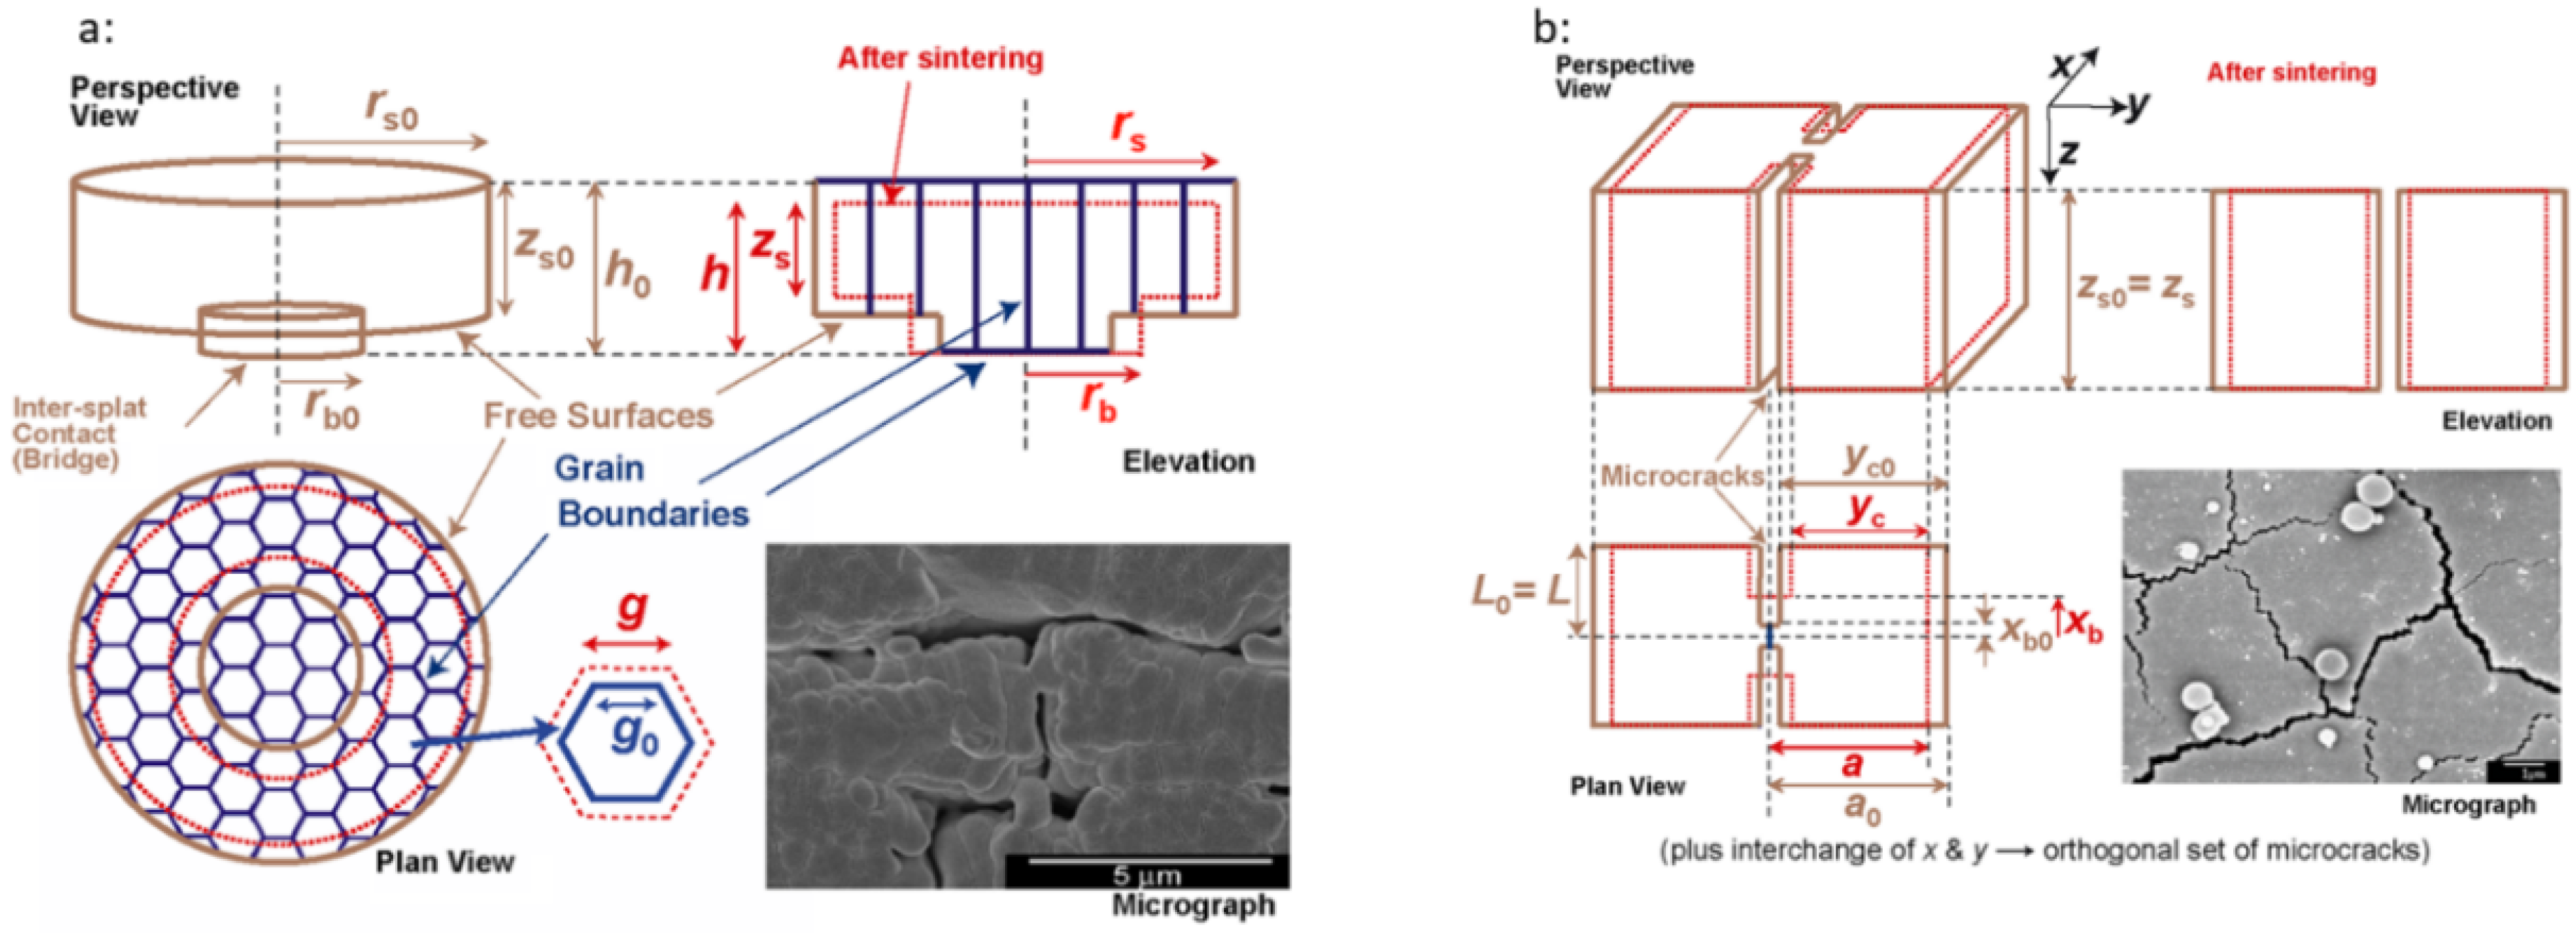
4.1. Geometry of the Sintering Model

As shown in Figure 1 in Section 3.1, the domain (1) represents the inter-splat pore, which has a geometry of cylindrical disk and a smaller cylindrical disk as the inter-splat connecting bridge. Since the coating is made of splats, the open pores are represented by the space around the connecting bridge. Within the splat, it is composed of through-thickness columnar grains in hexagonal prisms with a size length g. The number of grains in a splat is N s . The dimensions of the splat are defined in cylindrical coordinates (r, z). Detailed notations of the dimensions are illustrated in Figure 1a. Domain (2) represents the intra-microcracks, which have a rectangular volume element with two through-thickness microcracks. The domain (2) is defined in Cartesian coordinates (x, y, z), and the detail notations are available in Figure 1b. The globular voids are represented in domain (3), which are large-scale spherical voids described using the dimension, radius r v . The globular voids are assumed to be unchanged during sintering, but their existence contributes to the overall porosity and specific surface area that should be considered in the model prediction.
The model also features a comparison between the mono-size model and bimodal distribution. The bimodal results are the average of fine splat and coarse splat, which may give a higher precision if the uneven size of splats are considered.

4.2. Modelling Principle

The microstructure evolution described using the model developed by Cipitria et al. has been introduced in Section 3.1. As Figure 1 demonstrates, in domain (1), atoms within the grain will diffuse to the edges of the grains in r and z directions. Surface diffusions will occur at the surfaces of open pores (the notch around the connecting bridge). Similarly, for domain (2), the grain boundary diffusion will occur along the x-axis at the bridge of two microcracks, and surface diffusions will take place along the open surface at the notch in the x- and y-directions.

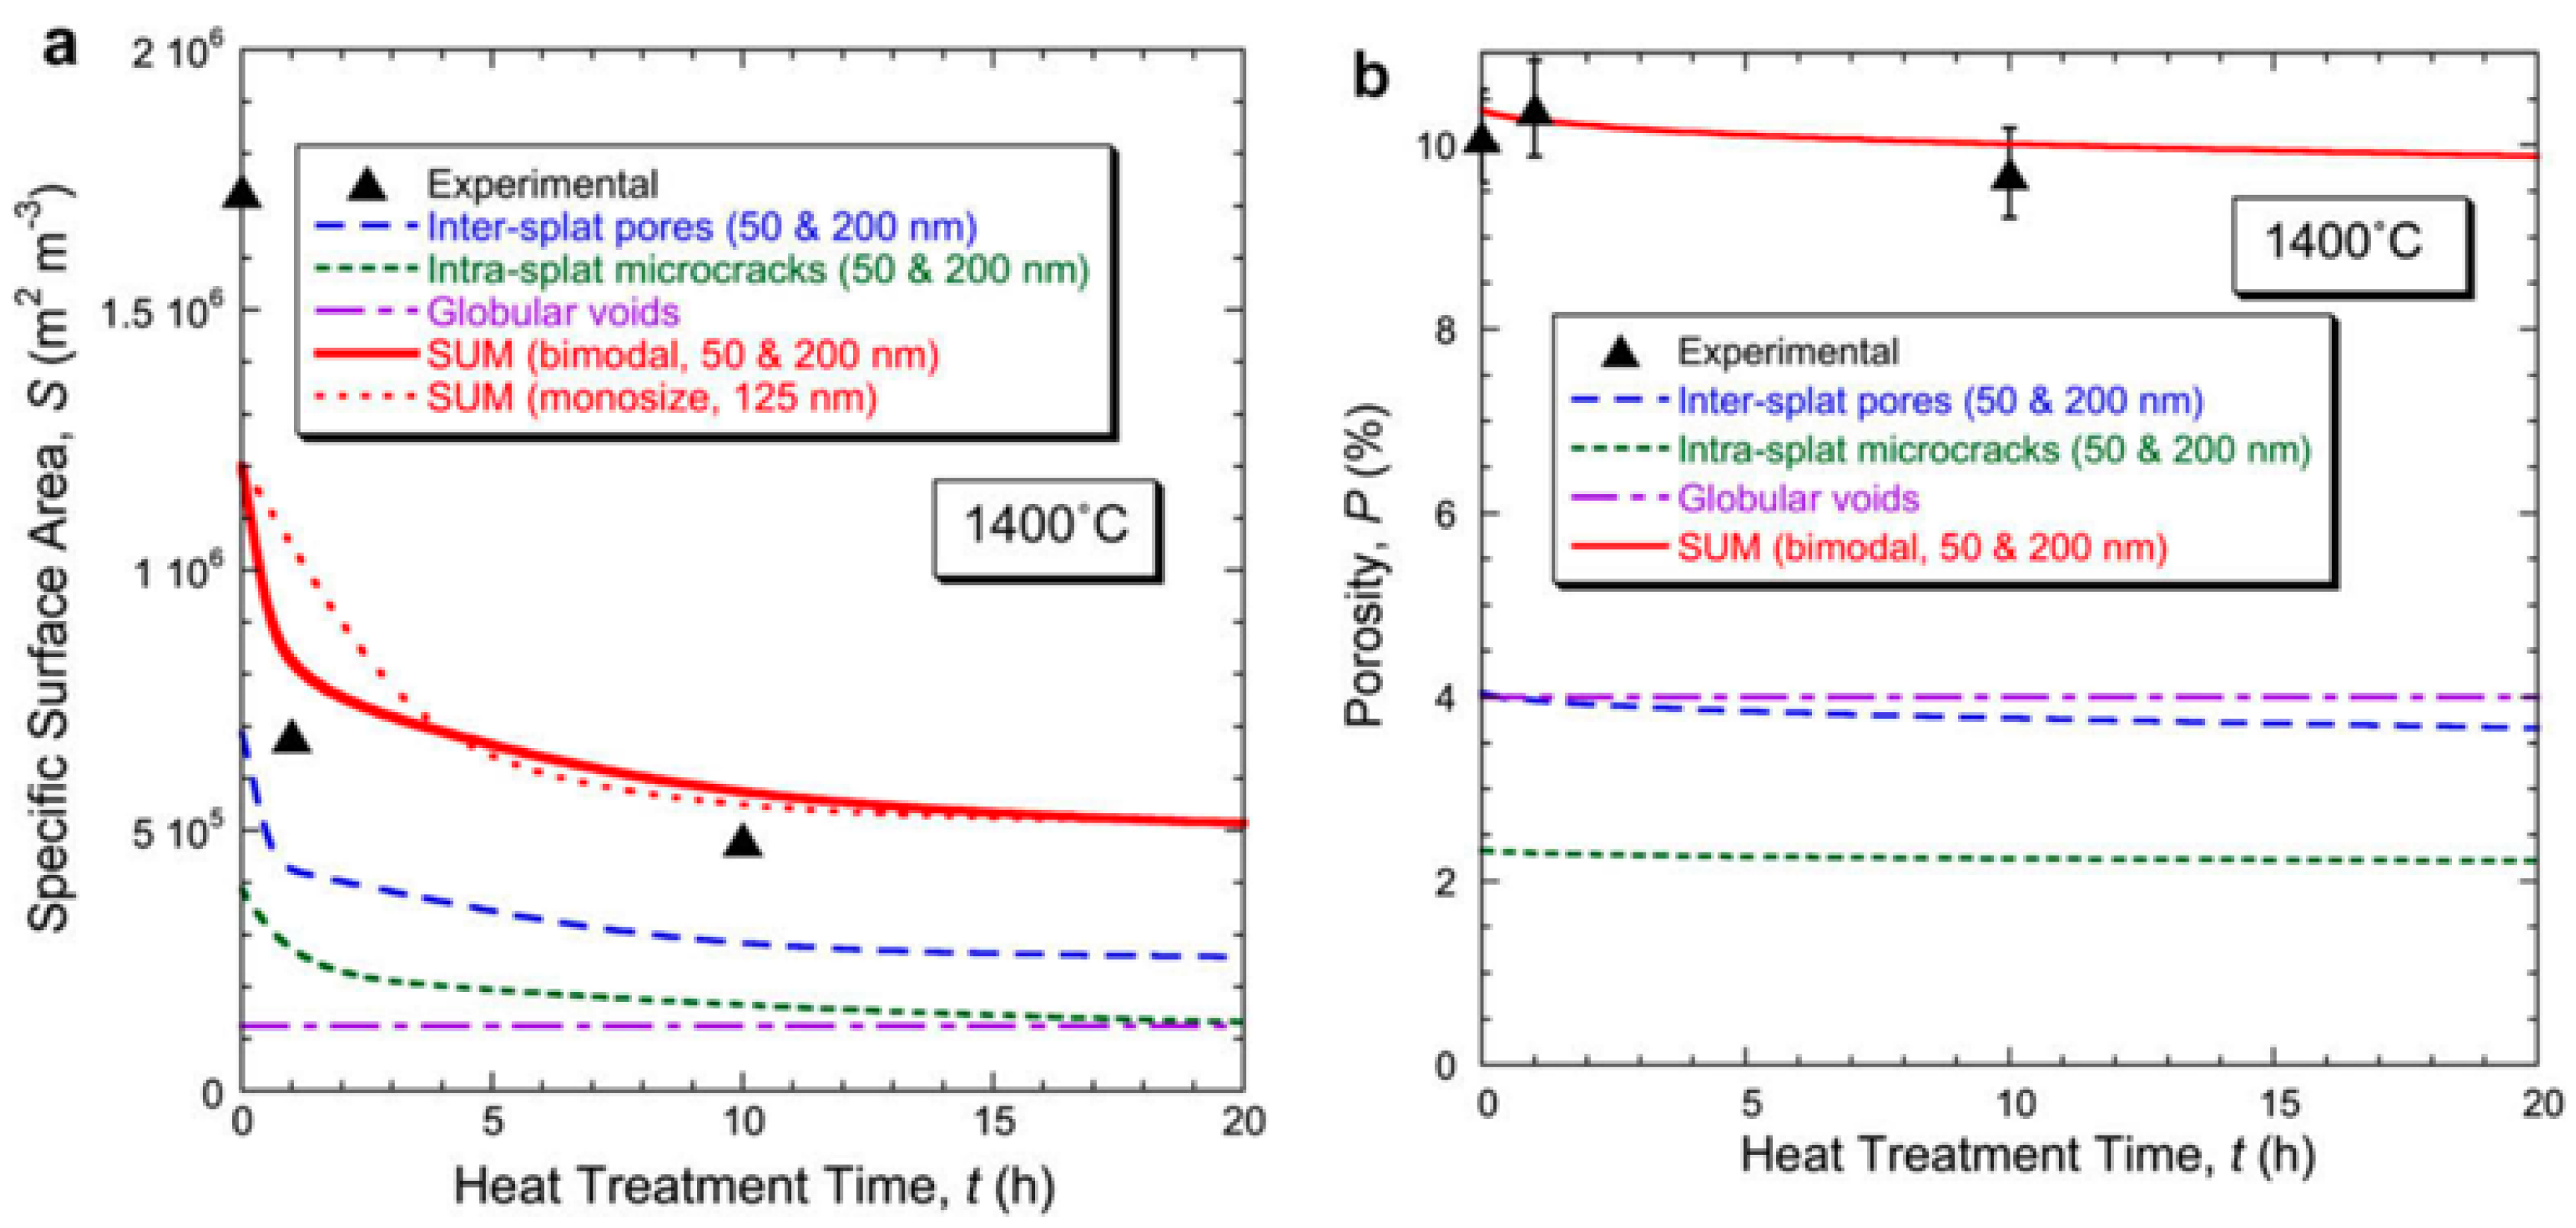
4.3. Model Prediction

The sintering model developed by Cipitria et al. [21,40] is capable of predicting the rate of coating shrinkage, surface area reduction, porosity reduction, and evolution in thermal conductivity in the free-standing scenario. During the sintering process, the coating will densify and induce shrinkage in both through-thickness and in-plane directions. For the rate of coating shrinkage, the through-thickness shrinkage is expressed by the height (h) reduction in domain (1), while the in-plane shrinkage is represented by the superimposition of shrinkage of r s in domain (1) and a in domain (2). The linear contraction during sintering in multi-axis and different temperature levels is shown in Figure 3a,b. The experimental results and trend show a good agreement with the numerical predictions. The minor difference may be caused by simplifications of the modeling or experimental observation errors.
The specific surface area of the whole model is the summation of surface area in domain (1), twice of domain (2), and domain (3). Figure 4a shows the comparison of bimodal, mono-size, and experimental results of specific surface area and their component domains. The composition of total porosity is similar to the specific surface area: summation of domain (1), twice of domain (2), and domain (3). Figure 4b illustrates the experimental result, total porosity prediction, and their composition. In addition, the thermal conductivity evolution was conducted and found it ascent more rapid in the bimodal case.
Furthermore, the sensitivity study to the initial pore geometry and diffusivity was also made to give suggestions for coating developer to choose the material with designated properties. For the sensitivity study to the initial pore geometry, it was found that a smaller size of YSZ splat or smaller open-pore (height of contact bridge) will have a much faster shrinkage rate than the reference size YSZ splat at the early stage of sintering, and vice versa. The behavior is reflected in terms of the through-thickness shrinkage, contact bridge area growth and inter-splat pore specific surface area. All these porosity parameters will contribute to the change in Young’s modulus, but it is not covered here. Concerning the sensitivity to diffusivity, the author found that the increase in grain boundary diffusivity will strongly promote the out-of-plane shrinkage during the sintering, while the rise in surface diffusivity will have a negative trend in shrinkage that matches the prediction. Both grain boundary and surface diffusion will slightly contribute to decreasing the surface area and increasing the contact bridge area. The sensitivity study shows that the increased surface diffusivity is more sensitive to the sintering responses.
In the constrained sintering model, more predictions were conducted. The responses of geometry are dissimilar to the free-standing scenario. In the free-standing model, the in-plane shrinkage is decreased during the sintering, and the corresponding geometry radius of splat r s in domain (1) and the width of domain (2) keep decreasing as demonstrated in Figure 1b. However, in the constrained model, due to the mismatch of thermal expansion with the substrate, the elastic strain will be generated to retard the in-plane shrinkage of sintering. To reach the minimum energy in the coating, the stress will be relaxed with respect to the reversal of grain boundary diffusion. Reflected in the dimensions of the geometry, the radius r s of domain (1) and microcrack separation a in domain (2) increase rapidly at the initial stage to relax the elastic stress. At the same time, the loss of substance at grain boundary decreases the height h in domain (1) dramatically at the initial period of sintering. The porosity also changes at the initial period of sintering due to the opening of microcrack a in domain (2), but the small change does not affect the bonding strength of the YSZ coating. The porosity rise rapidly at initial is due to the thermal mismatch leaded de-sintering. After the relaxation process, porosity decrease gradually as sintering proceeds. The prediction results match the experimental observations.

4.4. Summary of the Model

In this numerical model, it allows us to understand: (1) the geometry evolution during the sintering process in the free-standing case and the comparison with the constrained case; (2) how the change of splat and pore size affects the shrinkage and surface area reduction; (3) how diffusivity affects the shrinkage and surface area reduction; (4) progress of the in-plane stress relaxation in the constrained model. The model prediction has been validated in other literature [42].
In the in-plane stress relaxation, the author found that the stress reaches its peak value at the initial stage of the sintering and then swiftly relaxes to a low level, thus resulting in a likely occurrence of the debonding of coating layers during the stress relaxation. However, this numerical model is unlikely to predict the debonding behaviour on its own which is dependent on factors not covered in the model such as the interfacial cracks, local stress, and strain at the cracks. An implementation of this model in FE analysis about the local interface behaviour would be helpful to predict the lifetime of the coating.
In other aspects, the geometry of this model and pore orientations are too characteristic and simple to the actual scenarios, especially those described in terms of the splat size, pore size, and connection area, that may make the model impractical if the operation conditions are changed. Also, the pore opening is assumed evenly thick, which is inconsistent with SEM observations and made the rate of linear contraction at stage-I sintering differ to experimental results. In their model, the Young’s modulus is assumed fixed during the sintering process, which is impractical in actual life operation scenarios. As previously introduced, the stiffness of ceramics topcoat will increase as porosity reduces during sintering. The in-plane stress simulation may be inaccurate if the modulus changes with respect to sintering [4,16,43].

5. Brick Model of Sintering

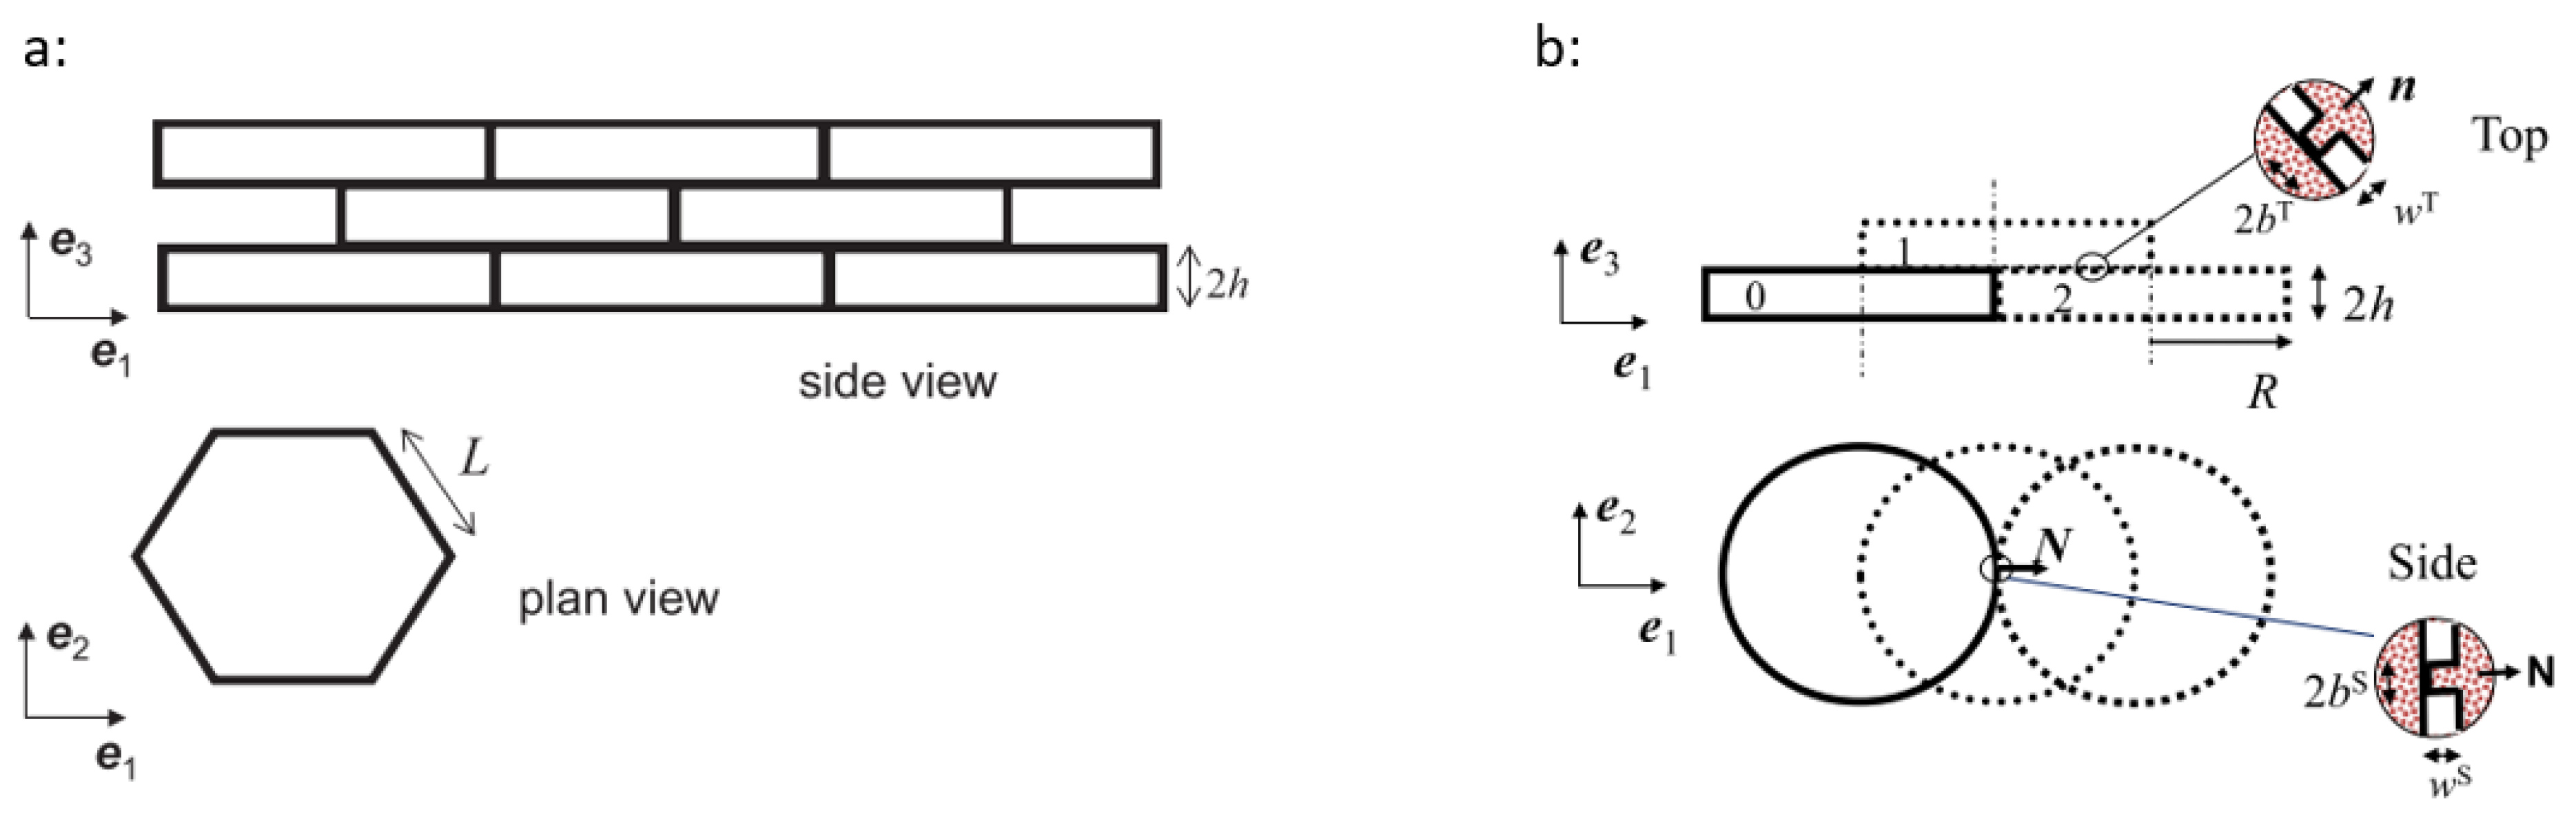
5.1. Geometry of the Model

The geometry model proposed by Cocks et al. [4] to simulate sintering differs from the one proposed by Cipitria et al. [21]. Based on the SEM observations by Eriksson et al. [44], the splats are in contact by discrete asperities. Cocks et al. [4] then generated a brick model as shown in Figure 5. The basic units of splats are hexagonal bricks, and pile up without gap. The connections at the top surfaces and side surfaces are asperities distributed evenly at each surface. To simplify the calculations, splats are idealized as circular columns and only connected at top and side surface. For the side asperities, orientations are orthogonal to the surface, while the top asperities are connected in random orientations to match the observations [4].

5.2. Modelling Principle

Initially the sintering occurs at the asperities, while the main body of the splat is dense. As sintering proceeds, the matter diffuses along the asperities, resulting in the increase of radius in asperities and the decrease in height, to heal the inter-splat crack, or equivalently, to reduce the interface energy. The approach then follows the principle in Section 3.2, i.e., to formulate a constitutive relation between stress and strains. Cocks et al. [4] expanded the process in terms of three contributions: sintering, elastic, and coble creep effects. The sintering response uses Equation (1) to determine the sintering force f S I N and viscosity λ with respect to the evolution of asperity dimensions b and w . The force-displacement rate relations further convert to stress-strain rate relation, which is in the form of constitutive relation. For the elastic deformation response, the author neutralizes stiffness of asperities in multiple scenarios and derives a stiffness k . Based on the traction-displacement correlation, the constitutive form of elastic response between stress and strain is acquired. To accumulate the effect of the Coble creep, a bulk compliance tensor C was added into elastic contribution and a Coble creep response between strain rate and stress was given. The full constitutive model in this approach is given as:
ε ˙ i j = ε ˙ i j E L + ε ˙ i j S I N + ε ˙ i j C
and expanded as:
ε ˙ i j = ( C i j k l B + K i j k l 1 ) σ ˙ k l + Λ i j k l 1 ( σ k l σ k l S I N ) + Π i j k l σ k l
Similar to any kind of response, the characteristic time τ should be pre-determined to set up the time scale. The authors determined the free-standing, constrained characteristic time scale for this model.

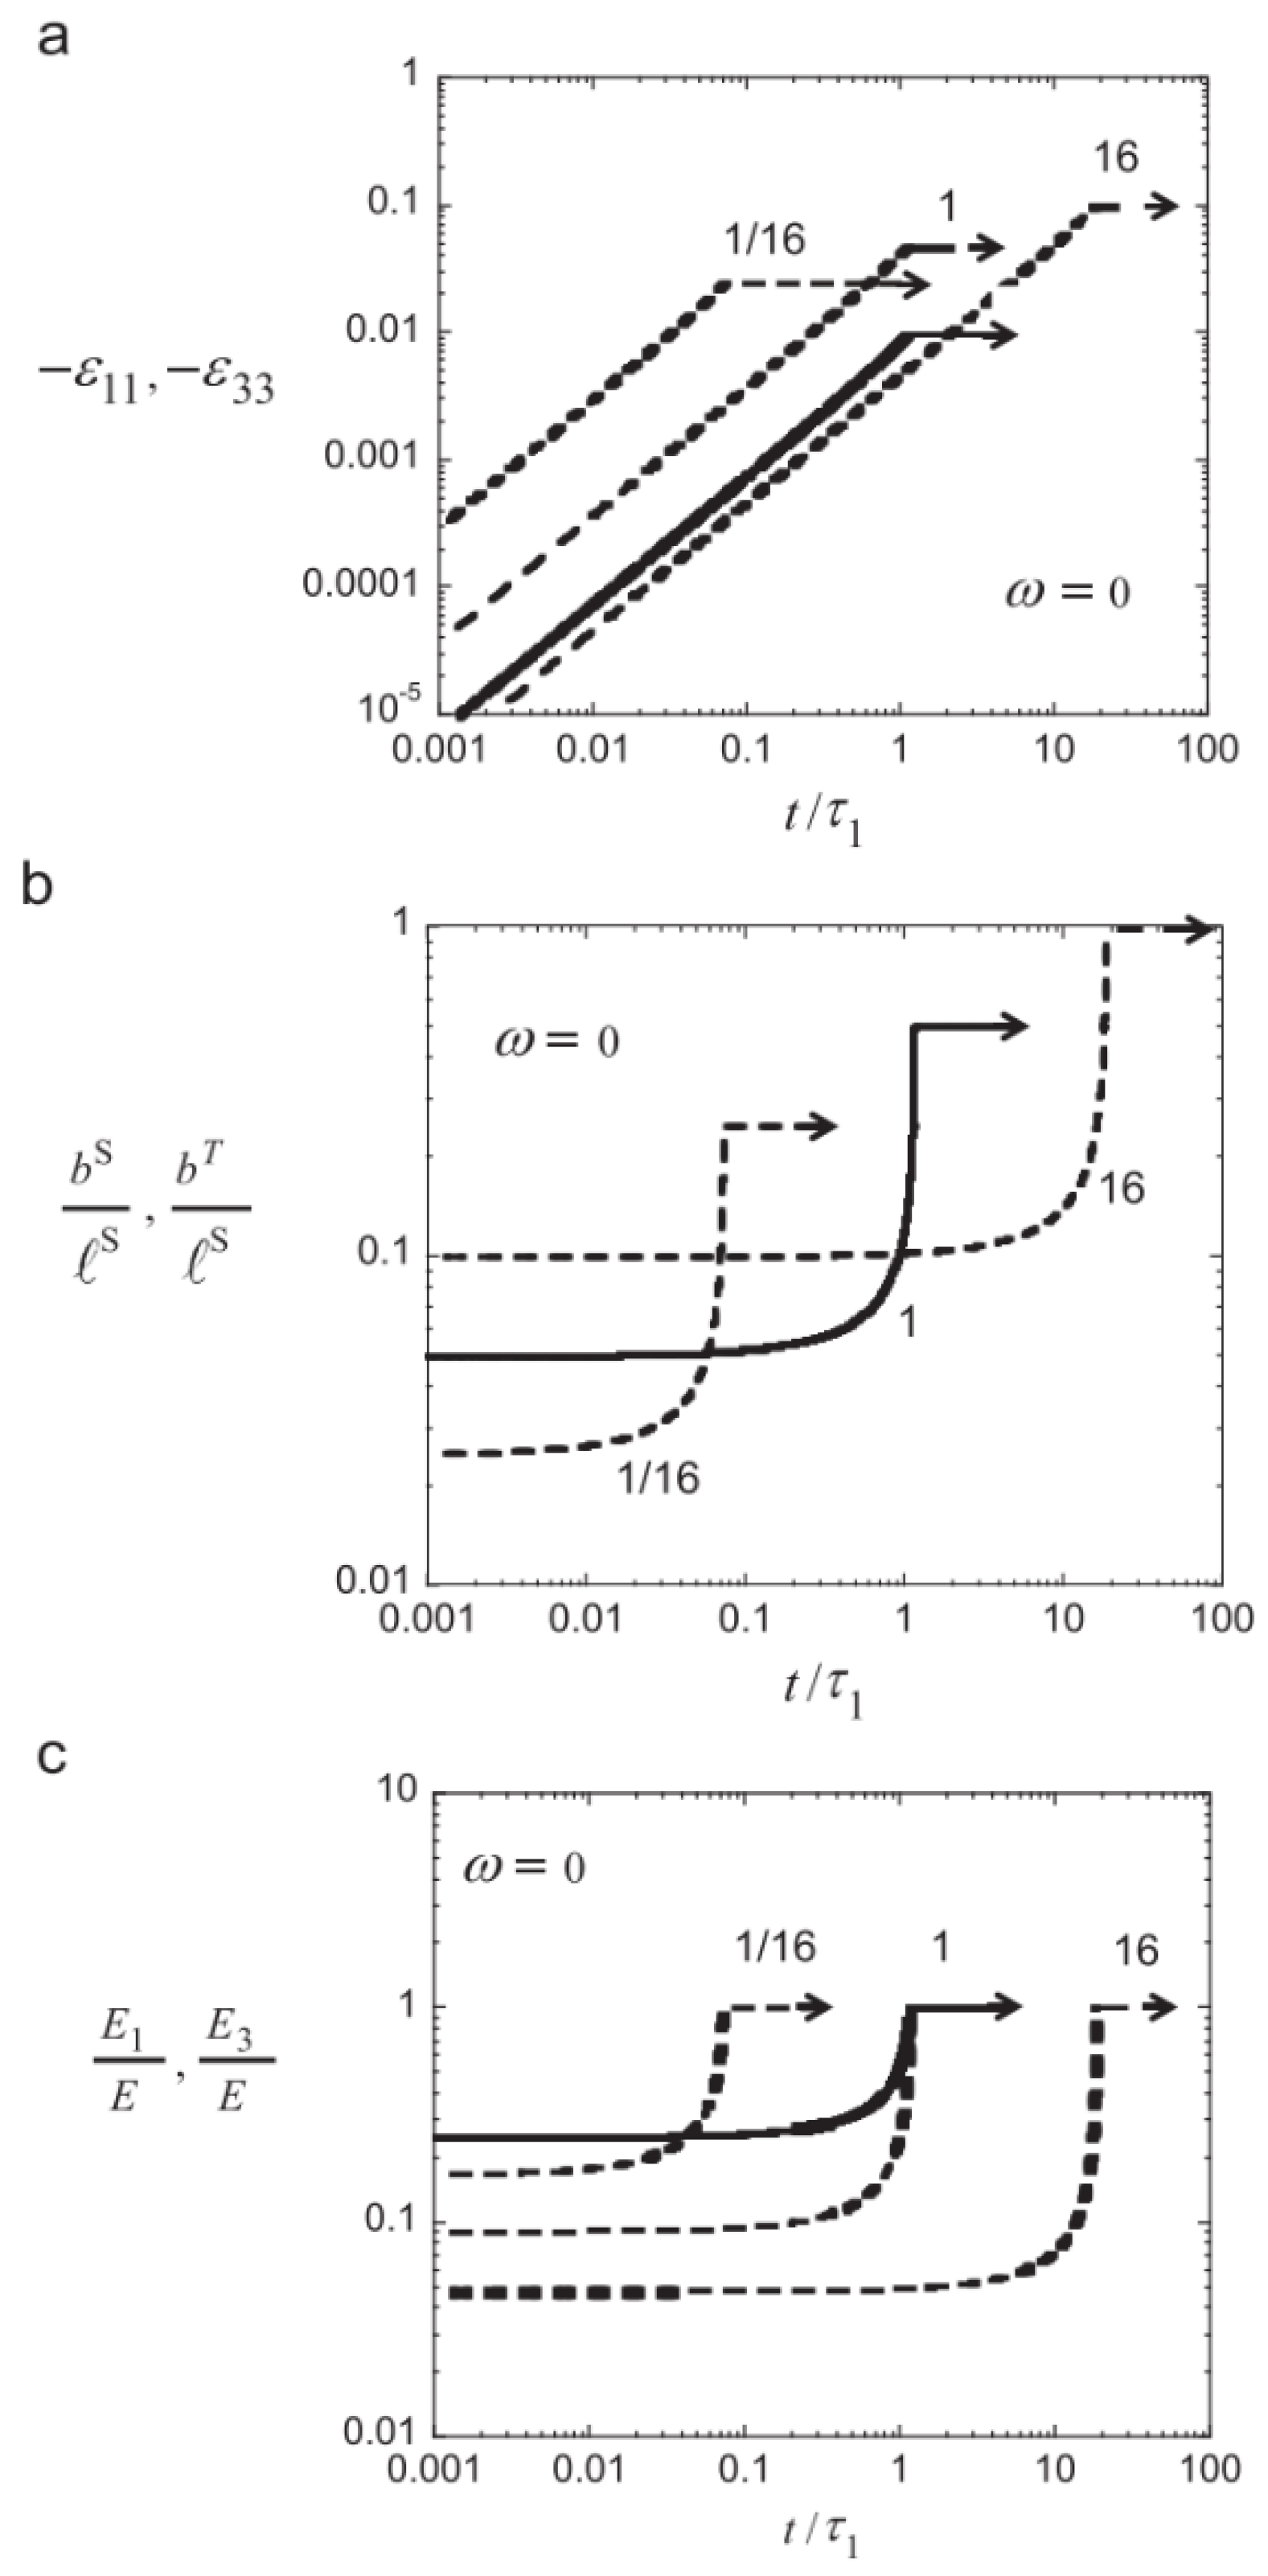
5.3. Model Predictions

In the free-standing scenario, the external load is zero and the effects of elastic deformation and Coble creep on sintering are neglected. The author simulated the evolution of in-plane, out-of-plane, asperity width, and elastic modulus when the asperity tilt angle ω = 0 . Results are shown in Figure 6. The first graph of Figure 6a shows the linear contraction both in the in-plane direction (solid-line—ε11) and the out-of-plane direction (dashed-lines—ε33). The log-log graph reads that the linear contraction is linear with respect to time and the out-of-plane linear contraction is more than one in the in-plane linear contraction. The numbers indicate the sensitivity with respect to the size. When the top/bottom asperity height, width, and spacing are doubled, the time constant becomes 16 times of τ1, and shows a slower contraction rate compared to the baseline condition, and vice versa. The second graph of Figure 6b shows that the width of the asperities is growing in exponential scale. Similarly, the numbers represent the effects of size change in top/bottom asperities. The last graph, Figure 6c, demonstrates the evolution of Young’s modulus in the in-plane and out-of-plane directions and how asperities size affects the rate of change. For studies of other orientation angles, see Ref. [4].
Figure 7 shows the asperity width evolution in one of the constrained cases. Under the same characteristic time for the top and side ( τ 2 / τ 1 = 1 ) and when the initial asperity width to spacing ratio equal to 0.5 (or τ 2 / τ 1 = 1 ) at both t op and side surface, the graph shows the asperity width on the side surface grows much slower than the asperities on the top/bottom surface, which is consistent with the author’s assumption. If the size and spacing of top/bottom asperities change, then the model shows a similar trend as in the free-standing case. The author also simulated the in-plane stress and Young’s modulus evolution in both the sintering dominant and Coble creep dominant cases, which is not discussed in the present paper.

5.4. Summary of the Model

Within this model, it allows us to evaluate: (1) the evolution of asperities dimensions; (2) the evolution of in-plane and out-of-plane contraction; (3) the evolution of Young’s modulus; (4) the sensitivity of asperities size to these parameters; and (5) the sensitivity of asperity inclinations.
This model used the same diffusional process theory as previous model to simulate the sintering behavior at a different form of geometry and gave the analysis of multi-size and orientation of asperities. Combining the effects of larger size defects like pores would better describe the macroscopic modulus evolution. But the results of this model have not been proved. Nevertheless, the model still meets the problem assuming the inter-splat pores are evenly thick, which is inconsistent with SEM observations. The end of the pores are usually wedge shape, which tends to cure quicker during sintering [22,45]. This condition is later improved in an image-based example in Section 7, with the detail geometry construction.

6. An EB-PVD TBC Sintering Model

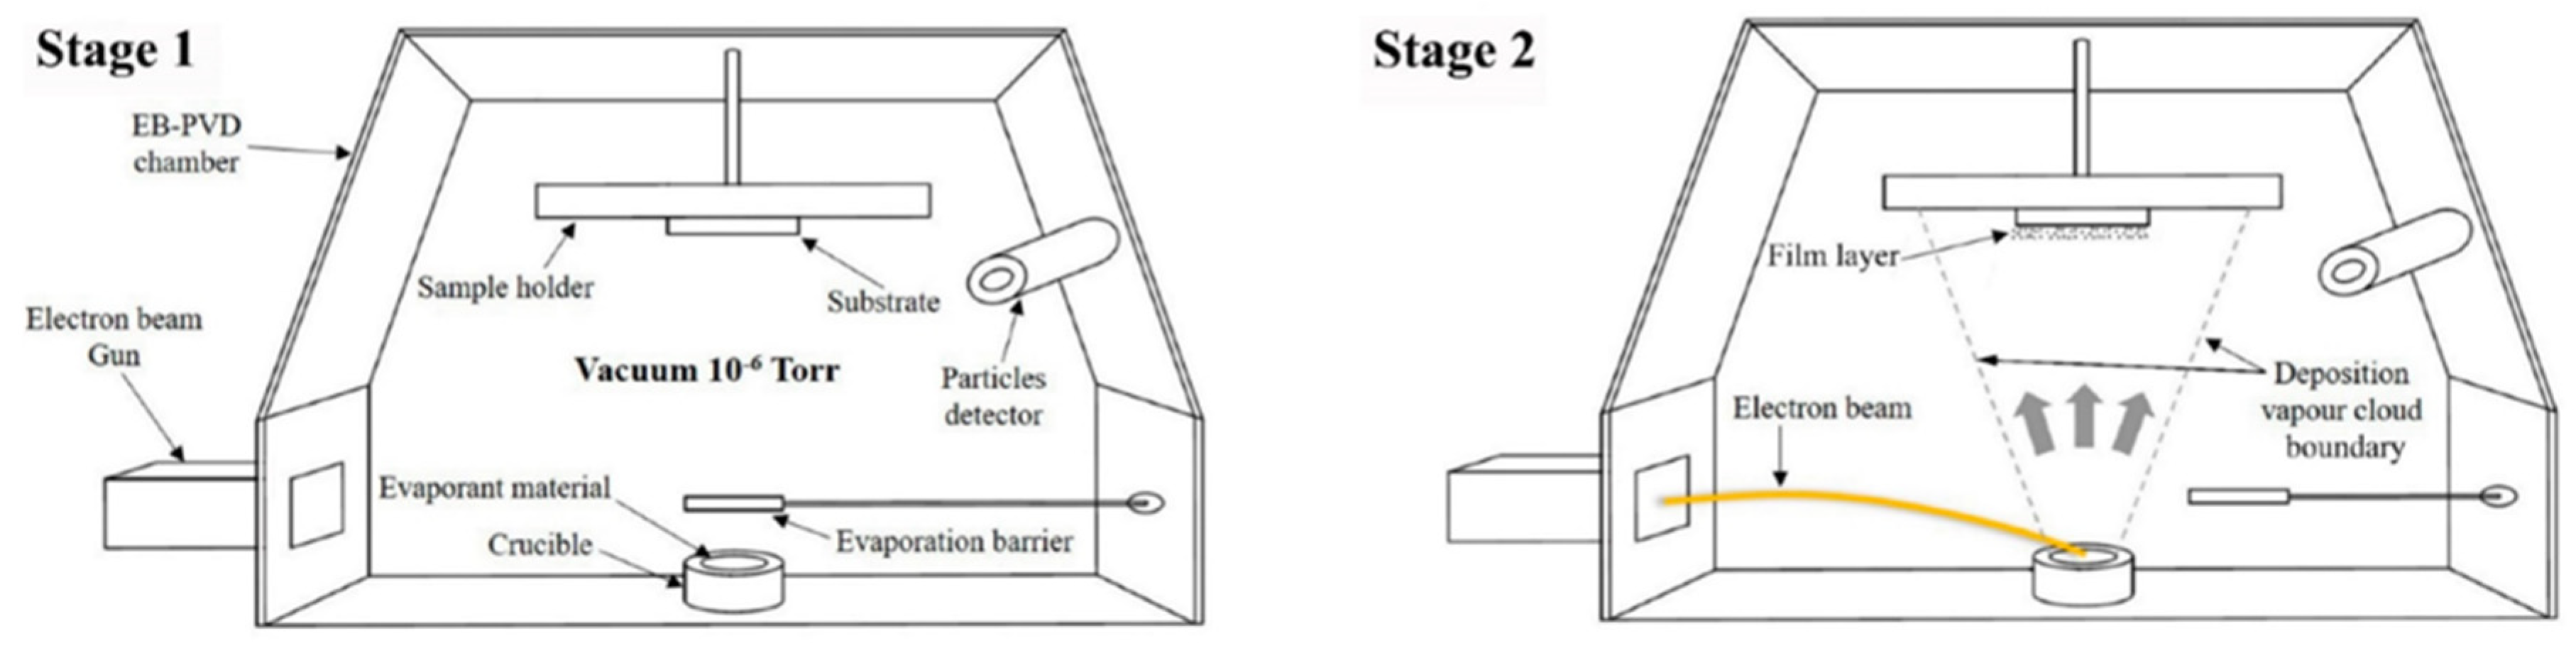
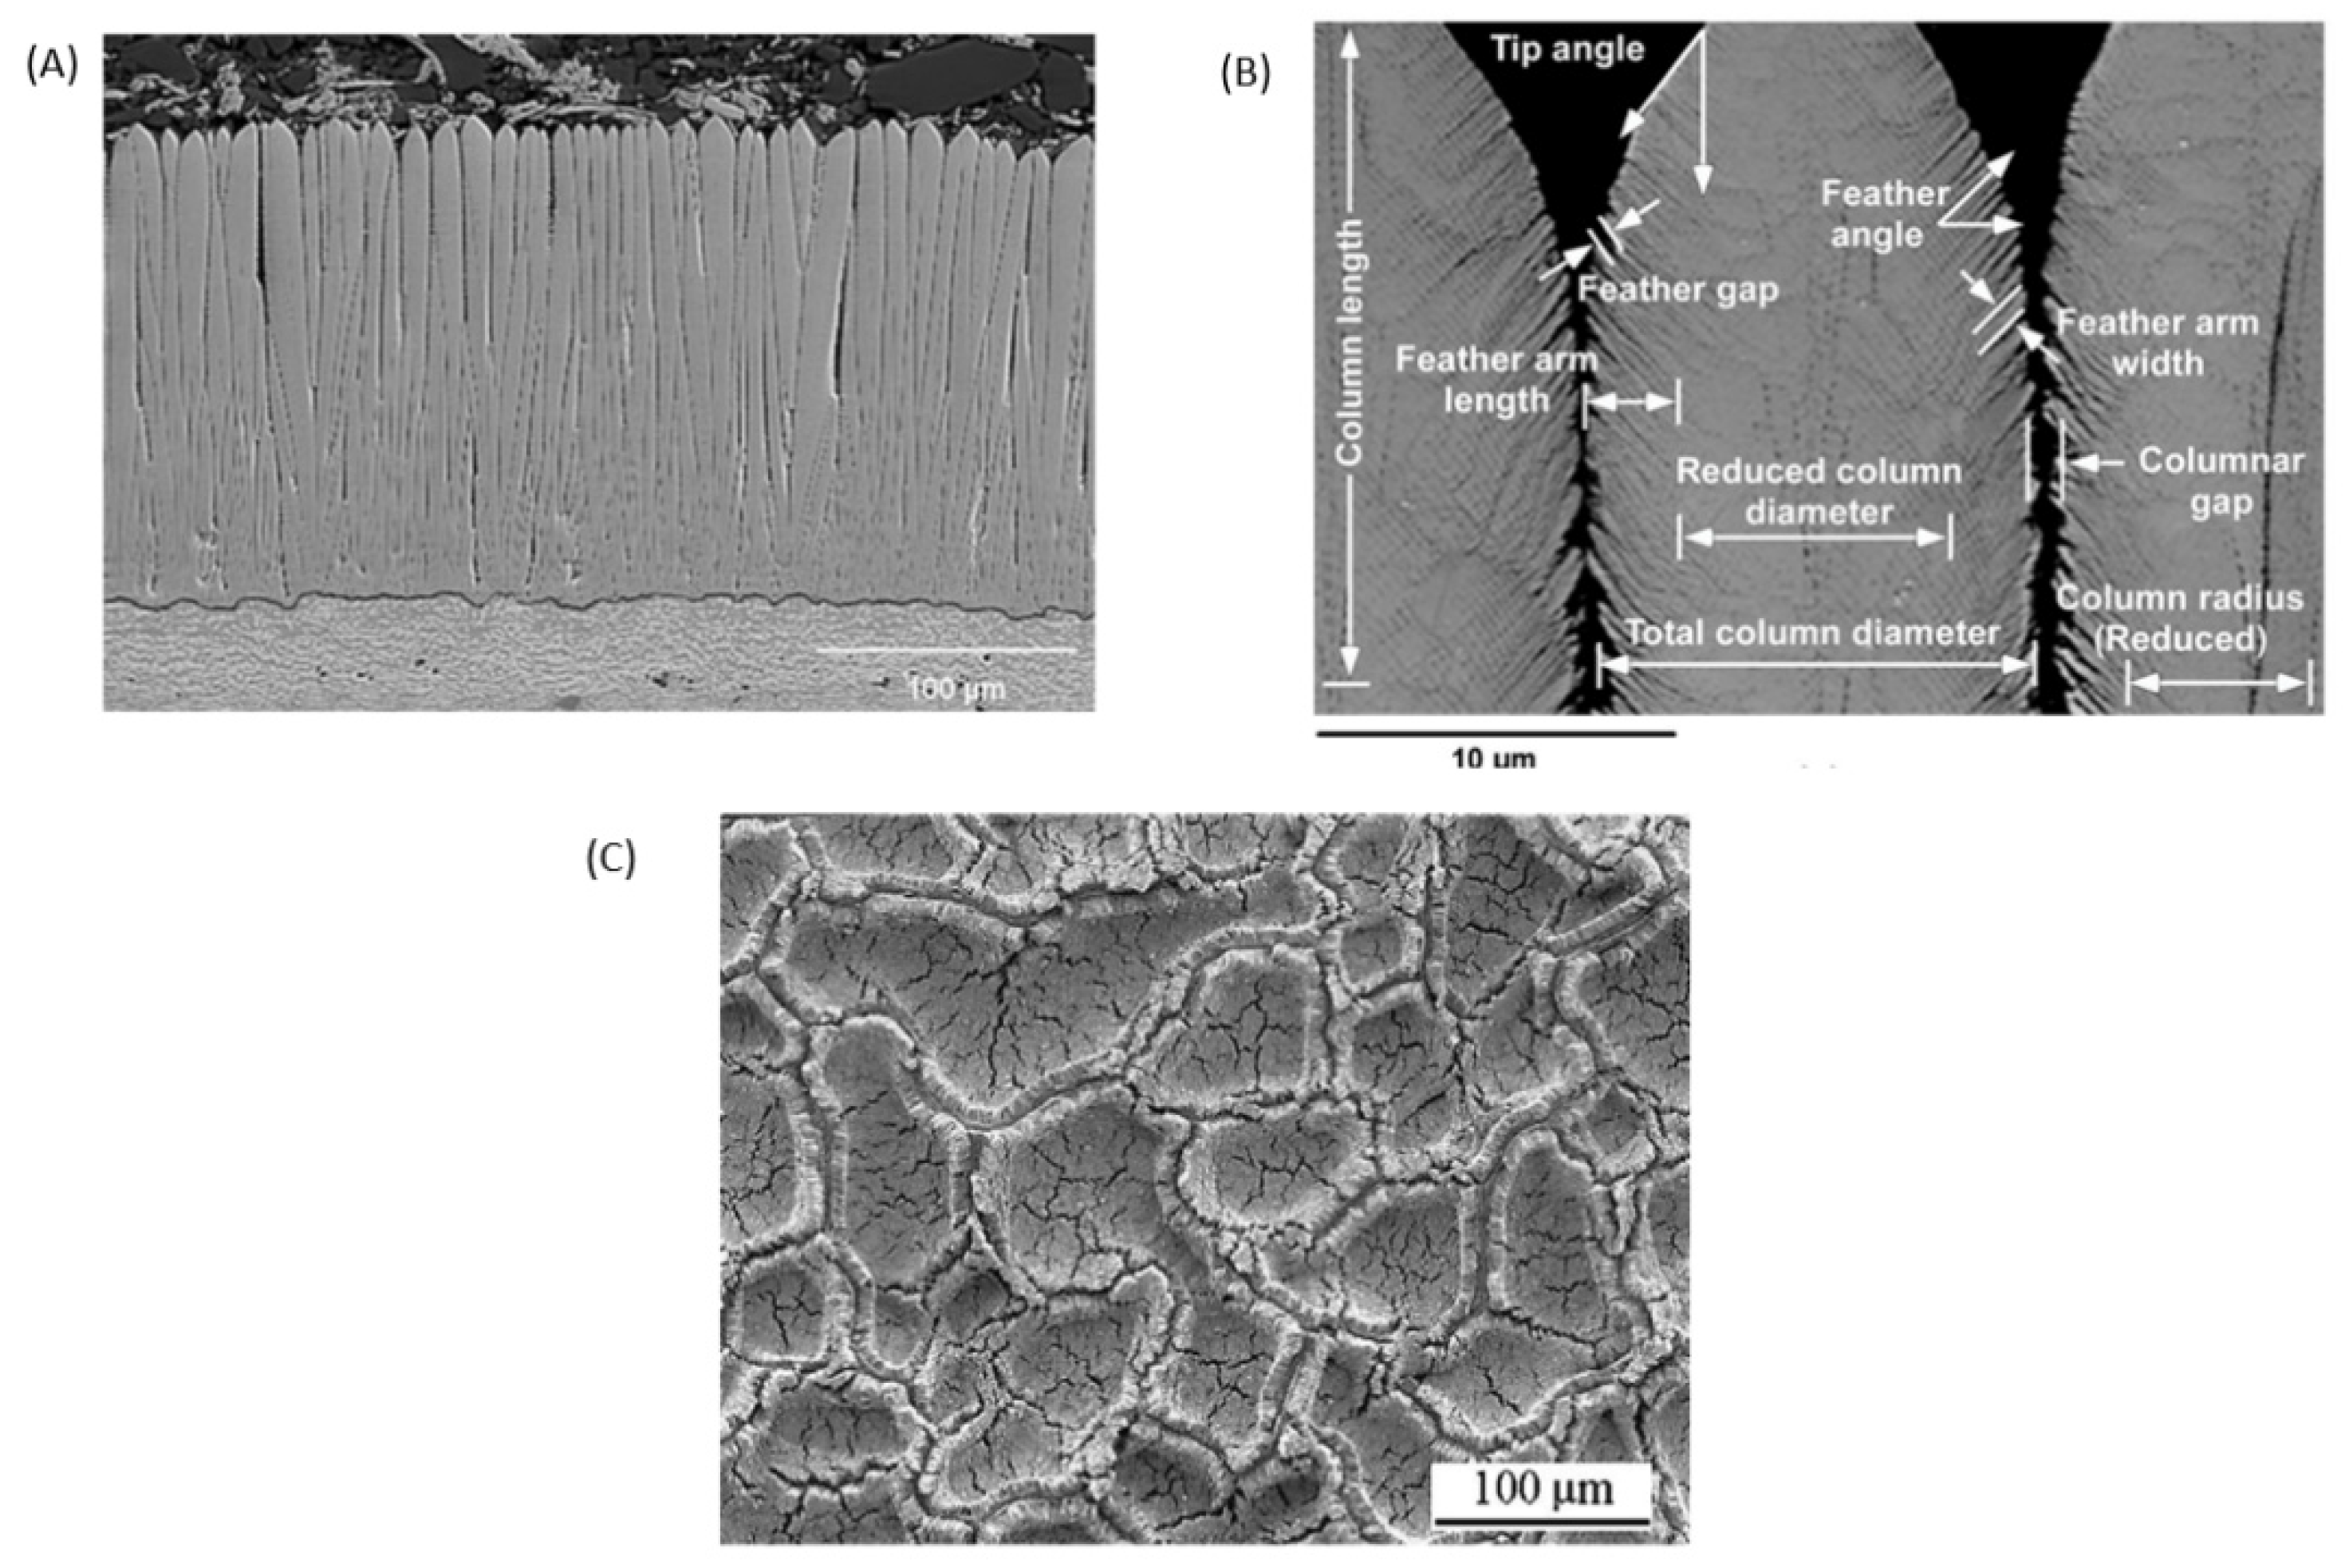
6.1. EB-PVD Process and Coating Microstructure

The microstructure of TBCs deposited by EB-PVD is notably different from those such as APS-TBCs due to its own deposition method. Figure 8 is a schematic show of a typical EB-PVD deposition facility. Within the vacuum environment, the electron beam will heat the target materials in the crucible and melt them to vapour. The vaporized YSZ will rise and be deposited onto the surface of the substrate. Upon cooling-down, the YSZ topcoat is formed [46]. Due to the vaporized YSZ being relatively small particles with even distribution, the microstructure of the coating comprises millions of columnar grains with a sharp tip at the top dispersed along the surface of the coating, as demonstrated in Figure 9A [47].
Based on EB-PVD TBC microstructures, Hutchinson’s sintering model [38] was developed in terms of the columnar grains represented by a series of repeated d × d square columns with height H, as demonstrated in Figure 9A. Magnifying the SEM image of the as-deposited YSZ columns, Figure 9B shows that the side edges of the initially deposited columns are made up of feather arms. These fine arms will soon round off and transform to undulating waves during the early stage of sintering due to the local sintering diffusion. Lughi et al. [50] and Schulz et al. [51] suggested that the surface undulation will grow and touch the undulations from other surfaces to form necks along the edge after several thermal cycle at 1100˚C. As service time increase, the undulating BC-TC interface will tilt the grain columns and the healing of narrower cracks will result in “mud-cracking” in TC. The sintering behavior of a single cluster is a valuable question that will be analyzed in the model. Considering the relatively short period for neck formation, the model will simulate the sintering after the necks are formed. For simplicity of calculations, the necks are combined and only grow from one surface while the other surface is totally flat. The geometry of the necks is demonstrated in Figure 10B, with wavelength λ, height w, contact width 2b, gap u, and inclination angle β [50,52].
With this model, Hutchinson et al. conducted simulations for two cases: (1) constrained and crack-free case; and (2) mud-cracking case. Mud-cracking is the main concern during the service as it accelerates the sintering. The behavior is mainly due to the undulations formed in the TC/TGO interface tilting the columns into clusters and the rise of in-plane tensile stress during sintering [50,52].

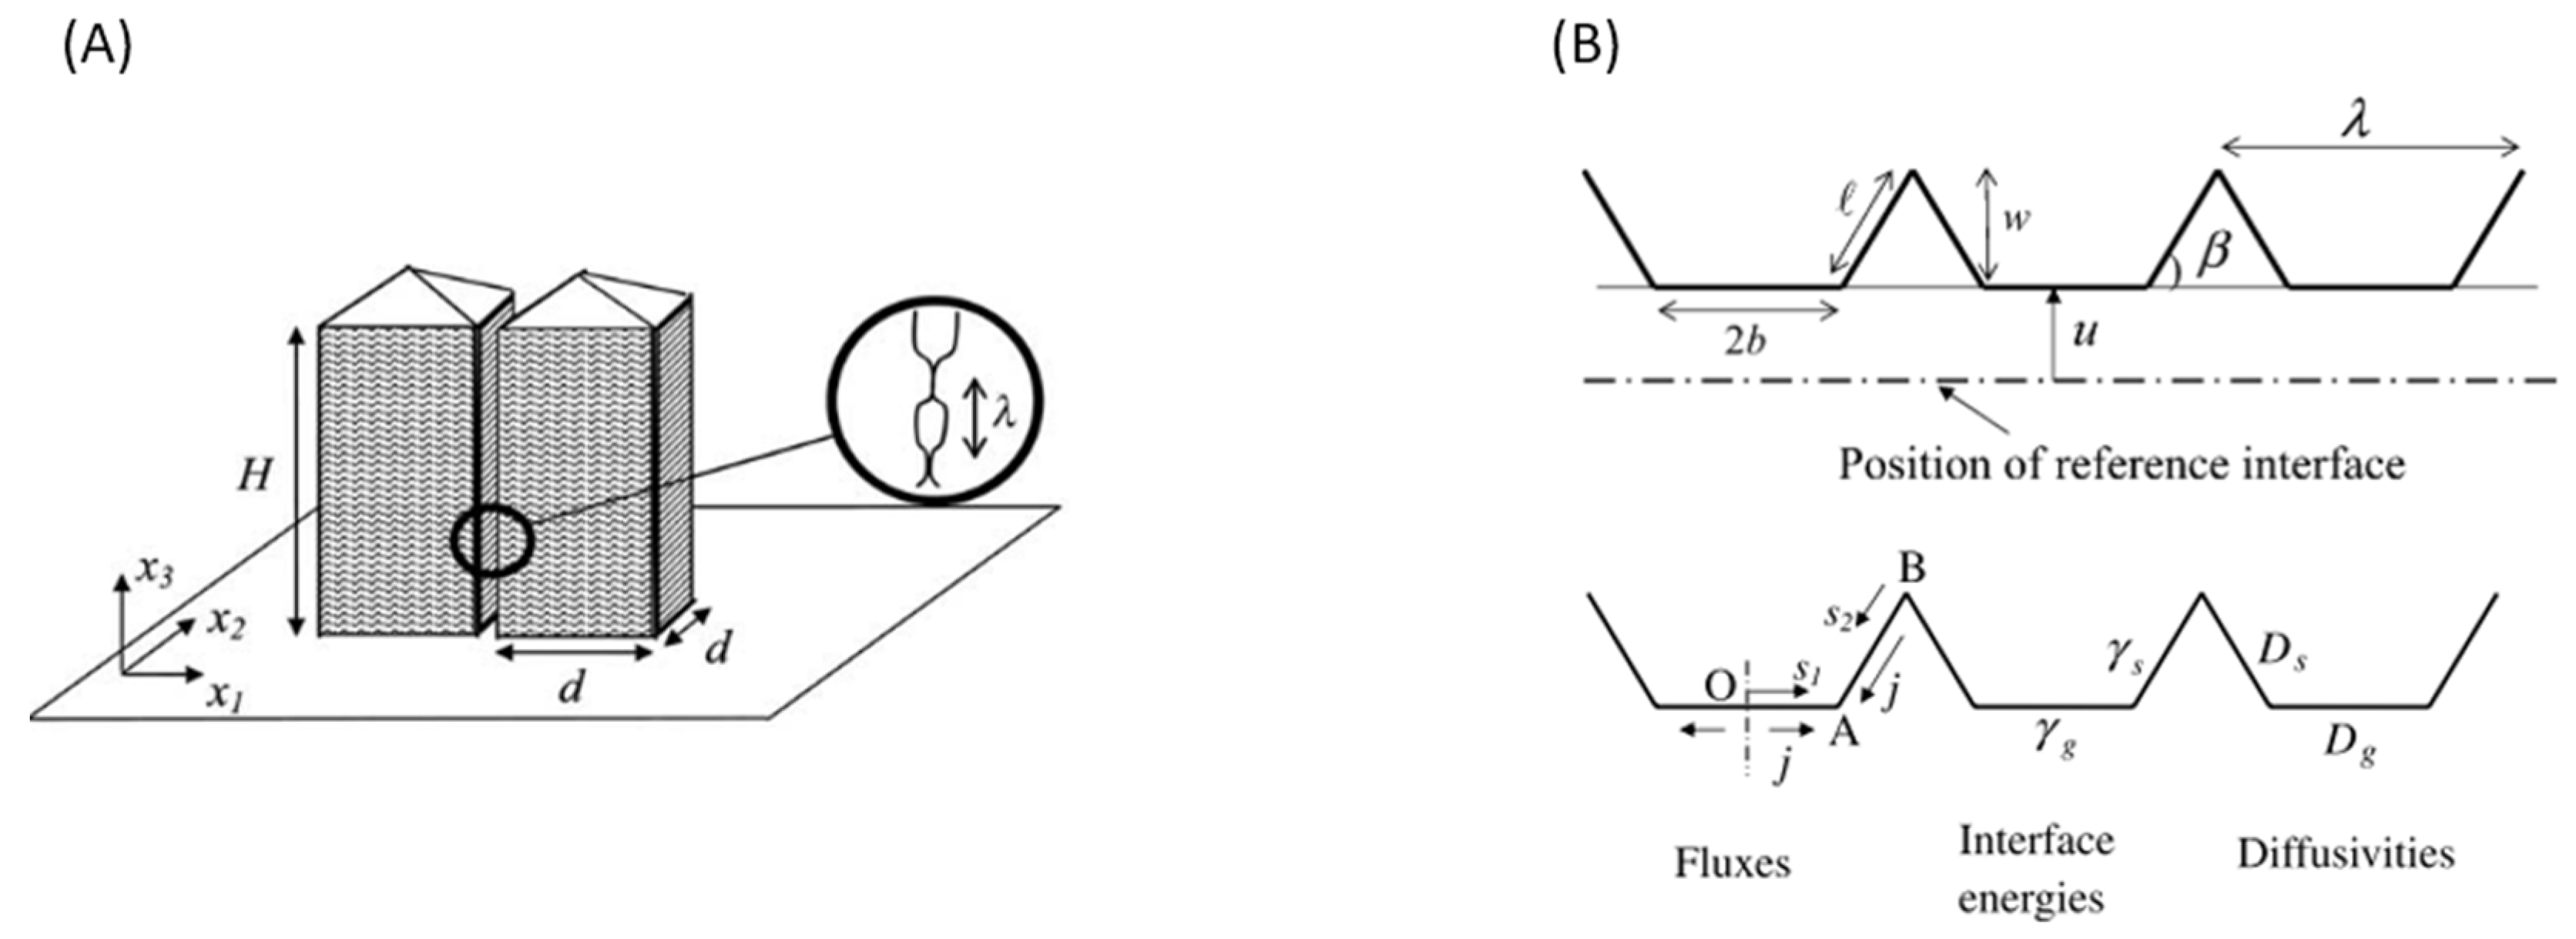
6.2. Modelling Principle

For the purpose of easy understanding, the EB-PVD column can be considered as a portrait of APS splats in the previous model, but with different aspect ratios. The asperities are mainly located at side edges instead of the top and bottom surfaces, so the variational principle in Section 3.1 can apply here. As sintering proceeds, matter consumes grain boundary and surface interface energies, diffuses along segments OA and AB in Figure 10B, and results in width increase in segment OA and amplitude reduction in segment AB. The variational principle uses Equation (1) to set up the balance between free energy rate G ˙ and energy dissipation Ψ , where the G ˙ is expressed in terms of the rate of change of neck amplitude w ˙ , inter-columnar gap u ˙ , and elastic strain density U, to determine the local geometry evolution. The corresponding global sintering strain ( ε S ) evolution is then determined through the average inter-columnar gap change over the column width [52].
For the mud-cracking case, YSZ columns are grouped by hexagons and idealized as circular columns with radius R and height H. The bottom of the cluster is bonded to rigid TGO, and all other faces are free. Thus, the constraint effect is mostly at the bottom while almost free at the top surface. The authors assumed the elastic strain energy disappears at a specific height ξ , and increases linearly from ξ to the substrate. The energy method was applied to determine the proper value of ξ that minimizes the elastic strain energy within the cluster and determines the elastic strain density U required in the variational principle statement [52].

6.3. Model Predictions

The solutions of the numerical models were normalized for convenience and the normalized values are labeled with bars. The neck dimensions are normalized by the wavelength λ and other values are normalized by their corresponding constants in the expressions. In the first case study with the constrained and crack free geometry, the results showed the evolution is sensitive to the magnitude of normalized modulus E ¯ . As E ¯ is sufficiently small, full sintering was observed within a finite time scale. On the other hand, when E ¯ is larger than a threshold value (~1000), sintering will cease due to the built-up of strain energy. The geometry evolution demonstrated the neck will not fully established and the pores will retain. Another sensitivity study finds that the increase in thermal strain mismatch ε T will increase the final neck width b ¯ . In general, the sintering is minimized by increasing the in-plane elastic modulus and decreasing the thermal strain mismatch [52].
In the mud-cracking case, the results are sensitive to the aspect ratio of the cluster since the elastic strain energy is related to the cluster radius and height. A dimensionless term of height-to-radius was added: H ¯ = H / R . The results showed when the inputs are E ¯ = 1000 and H ¯ = 1 , the mud-cracked TC can fully sinter between columns due to the reduction in constraint. One more sensitivity study about H ¯ showed that the smaller value of H ¯ will have a smaller neck size b ¯ when sintering is completed, and a greater in-plane modulus will also have a smaller final neck size b ¯ [52]. In other words, the coating has a better sintering resistant performance with smaller cluster height, or greater in-plane modulus.

6.4. Model Summary

In these two case studies, the model can simulate the sintering behavior with different variables. When the TC is crack-free, the increase of the in-plane elastic modulus and decrease of the thermal strain mismatch can reduce the rate of sintering. In the case of mud-cracking, loosened constraint and increased height-to-radius of the cluster will accelerate the sintering.
However, due to the limitation of the analytical model, the periodic structure cannot fully represent the practical case. In this model, the thermal gradient effects are neglected, which should be considered since the gradient is large in such coatings. The sintering will behave diffferently near the substrate. Moreover, as sintering proceeds, the TC will stiffen, and the modulus increases with time, which should be a time-dependent study instead of a static state. In some observations, the expansion of thermal coefficient will decrease slightly as sintering proceeds [53]. The variation of columns along the thickness is another factor that cannot be reflected in this model. Altun and Boke [54] observed the grain sizes are uneven along with the thickness. As thickness increases, the grains will coarsen, and the sintering behavior will diverge due to the microstructure change.
The geometry at the asperities is normally assumed to be a trapezoid or orthogon in several 2D sintering models, but a later study by Kumar remodified the contacts to be truncated hemisphere, which is an assumption closer to the SEM observations [55].

7. FEM Implementations and Future Developments

Even though numerical models can reliably simulate the microstructure evolution of sintering, the periodic geometry model does not represent the evolution of coatings in an actual level, i.e., complex shaped macroscopic cracks, thermal gradient, and substrate rumpling problems. Finite element methods (FEM) are a more versatile tool to simulate these cases. In the early 2000s, several FE analyses used temperature-dependent mechanical and thermal properties to study the TGO growth and rumpling-induced failure issues. But these simulations did not fulfill the sintering-induced property changes [12,31,56,57,58,59,60,61]. Later, Kyaw et al. [30] simulated the sintering process by incorporating a set of temperature and time-dependent elastic moduli. The nonlinearity of sintering, however, may make the interpolation method inaccurate. Lv et al. also used a set of time dependent sintering to study the interface cracking [62].
Thus, if the previously sintering model can be implemented into FE analysis, it is expected to improve the accuracy of the simulation. A commercial FEM software ABAQUS has a feature called user-defined material (UMAT) that can adopt the variational principles method in constitutive model to simulate geometry evolution and the corresponding mechanical and thermal properties evolutions during the FEA simulations. With proper input, the UMAT can update the sintering, thermal, and visco-plastic strain at each time step, and directly return it to the main program, or return the modulus changed at sintering [62]. This feature showed two potential applications: (1) Analysis on the sintering of more detailed microstructure; (2) provide material properties evolution to stress field analysis or failure analysis.
Lv et al. applied the constitutive model containing the sintering module to simulate Young’s modulus evolution of a model suspension plasma spray (SPS) TBC and used the UMAT to simulate Young’s modulus of realistic SPS coating with a large vertical cracks [63]. They also studied the microstructure and stress evolution of coatings with gradient porosity [64]. Kumar and Cocks applied the EB-PVD sintering model by Hutchinson et al. to simulate the vertical crack growing with different types of defects within the cluster of coating [55,65]. Zhang et al. used SEM images as a reference to build FE model and applied the UMAT to simulate the local sintering behavior with variable shape of cracks. Zhang’s model gave another level of details on the sintering process in complex crack structure, which will be expanded below [20,66].

7.1. The Image-Based FE Model

The previous numerical models provided a solution for microstructure evolution under the ideal operation conditions. However, in these models, the shape of defects and cracks within the coatings are irregular, therefore, further studies in realistic cases are expected to validate or amend the assumptions in the numerical models. The latest image-based model proposed by Zhang et al. [52] showed the evolution of microstructure and modulus of APS-TBC, and then used in the implementation of the sintering model by Cocks et al. [4].

7.2. Geometry of the Model and Sintering Principle

To simulate a realistic sintering of TBCs, Zhang et al. extracted cross-sectional micrographs of an as-deposited APS-TBC and generated mesh via a homemade MATLAB code. Figure 11 presents a comparison between the cross-section micrograph and FE mesh. The pattern of the mesh generated is consistent with the micrograph. In Figure 11b, the blue elements are bulk YSZ and the purple elements represent the inter-splat cracks. Corresponding to Section 4.1, the brick shape splats are bridged by asperities and purple elements are defined as user element routine (UEL) in the commercial finite element software ABAQUS to adopt the feature of asperities bridge along the inter-splat crack. The initial height of asperities is pre-defined, but the opening of the crack is not uniform along the crack path. To describe the bridging of asperities precisely, the asperities at the middle segment with greater opening are free and not bridged to the next splat when the opening is greater than the initial height of asperities. When the opening is less than the initial height, asperities will connect to the next step and activate the sintering feature. Figure 11c demonstrates the geometry at the inter-splat crack in details.
Other than the sintering response, the constitutive model also includes elastic and creep response at the asperities. Apart from the sample in Figure 11, the authors selected two more samples to conduct a sensitivity study concerning the crack size. All these samples feature horizontal cracks, vertical cracks, and globular voids [20].

7.3. Model Predictions

In this image-based FE approach, the model allows us to not only simulate modulus evolution and crack evolution, but also track the relief of stress concentration. The measurement of the in-plane modulus is conducted by applying horizontal stress on the vertical boundary and then measure the in-plane strain. The results for three samples are identical to the experimental results, where the macroscopic elastic modulus evolved from 20 to 65 GPa after 100 h of sintering. The microstructure differences were found to affect the modulus evolution. For example, in Sample 2 with more finer cracks, the modulus increases much faster at the early hours of sintering due to a faster healing of fine cracks.
More studies were focused on crack evolution in this image-based FE model. In general case with free standing, the authors identified that sintering readily starts from the crack tips, while asperities at the middle of the crack will contact the other splats and trigger the sintering. When two horizontal cracks are close and in parallel position, the narrower crack will sinter first, while the wider one may de-sinter and expand to accommodate the paralleled narrower crack. The large vertical cracks stay open at all times, and some finer vertical cracks will heal after sintering. Observing the local in-plane stress evolution, the cracks healed can carry the loads which is concentrated at crack tips. With an additional substance of the TBC that can carry loads, the in-plane strain is limited and the apparent modulus will increase as observed.
Sensitivity studies of microstructure evolution were conducted to better learn the sintering process. With a smaller asperity spacing, the initial modulus is higher and the sintering rate slope is steeper. However, the in-plane modulus plateau at the end of sintering is lower. In actual APS-TBC, the asperities spacing need to be determined by experiments and therefore the sensitivity of asperities spacing is only available via predictions. Splat thickness is another significant factor affecting sintering since the Coble creep tensor is defined using the YSZ splat thickness. A thinner YSZ splat will have a smaller aspect ratio of columnar grain ( χ = d / 2 h ) and have a smaller viscosity. The characteristic time of Coble creep to accommodate the sintering response then increases with larger splat thickness [4]. The in-plane modulus curve of FE model for different grain height validated the assumptions in Cocks et al.’ model [4]. The author also discussed the effect of grain growth on modulus evolution. The model showed the growth of grain may slow down the sintering rate during stage 2 sintering (healing larger cracks), but in practical applications, the grain growth has limited effect on sintering response [20].
The sensitivity studies above are conducted in the free-standing TBC, while in real world, the coating is constrained by the substrate. The authors then moved on to make a comparison between constrained and free-standing sintering in the FE model. The constrained sintering was simulated by fixing the vertical boundary in a horizontal direction. The comparison of in-plane modulus evolution is shown in Figure 12c, which shows the constrained sintering case had a much slower sintering rate in stage 2 sintering. The time ratio for constrained versus free sintering to reach the required in-plane modulus is between 1.5 to 2.0, which matches the analytical model built by Fleck et al. [67]. Observing the microstructure in stage 3 sintering in Figure 12a,b, it is apparent that the horizontal constraint strongly prevents the healing of vertical cracks (highlighted by red circles) and the residual of the vertical cracks reduces the in-plane modulus stage 3 sintering.
The existence of the vertical cracks benefits by extending the life of the coatings, but the position, length scale, and interaction with horizontal cracks may turn from profit to deficit. An example is given when cracks extend to the bond coat/top coat interface, which may cause spallation. Zhang et al. [66] lately extend their study on constrained sintering effects on vertical cracks. The image-based FE model was deployed again for simulating vertical cracks at different stages and different splat thicknesses. The mesh is derived from a cross-sectional SEM image of TBC near the surface. Some parallel vertical cracks are observed and built as microcrack bridged with asperities. To learn the effect of sintering on the propagation of early stage vertical cracks, three-case studies were conducted. In the first case, the imperfection has an initial asperity contact radius of b = 0.77 µm and the precursor crack has a bit larger radius of b = 0.87 µm, which means it is a narrower microcrack. In the splat thickness h = 2 µm condition, both imperfection and precursor have an increasing bridge contact radius, which means the microcracks are healed and show a good creep compliance. When the splat is thickened to h = 10 µm, the asperities contact radius are reduced and the de-sintered and the imperfection open as a crack. As the imperfection opens, the relaxation of constraint accelerates the sintering of the precursor. The comparison was made in the dot-dash line case with no imperfection. Once the crack is accrued, the stress will be accumulated near the crack tip. The second case replaced the imperfection with a precursor zone at the crack tip. The open-up area is free of asperity contact, and the crack tip precursor zone had a gradual increase in the initial asperity contact radius. The results demonstrates when h = 2 µm, and the crack tip and precursor are both healed by sintering. When h = 10 µm, the precursor region in the crack tip will de-sinter and open up as a crack and the narrower precursor crack still sinter at a similar rate of the thinner splat case. The third case added an intersection with horizontal crack between the open-up area and precursor zone, which is a common case as it propagates, and the results shows that it has a similar response in the intersection-free case. Detail of the mesh construction can be found at Figure 4 in [66].
These sintering behaviors tell: (1) the growth of existing vertical cracks accelerates the sintering of microcracks; (2) when the splat viscosity is small, the creep compliant is better and all vertical cracks tend to close; (3) when the splat viscosity is high, microcracks dominate the sintering and the corresponding traction will open the larger cracks to compensate the close-up of microcracks.

7.4. Summary of the Model

The image-based FE model notably simulates various practical cases to examine the modulus evolution on randomly selected TBC cross-sectional microstructures and the microstructure evolution, which showed good convergence with experimental data and validated the proposed numerical models. Sensitivity studies at different length scales and constraints observed larger viscosity, thickness, asperity contact spacing, grain growth speed, and constraints can limit the rate of sintering or improve the sintering resistance, which lengthen the coating life.
Studies demonstrated the effect of sintering on the evolution of topcoat microstructures when the adjacent cracks exist in the coatings. In general, the finer cracks sinter faster, in compensation for opening the nearby parallel cracks. The coarser cracks will sinter late after the finer cracks are fully sintered. The sintering at vertical cracks follows the similar rule, but the large-scale vertical cracks are more difficult to heal due to the constraint from substrate superalloy and the traction from sintering of vertical microcracks. Nevertheless, the image-based FE model can only simulate 2D microstructure and the cracks propagating in 3D geometry can not be assessed. In future, technologies like Xe Plasma-FIB [68], can gather 3D microstructure information, with which this 3D image-based FE model can be established and used to make more realistic and detailed sintering simulations and thus could provide an accurate life prediction for the coating development.
These models basically represent the latest applications of the sintering model in FEM implementations and primally demonstrated the validity of the designed workflow. As for now, many attempts have been made to focus on conventional YSZ materials; however, the effect of sintering on other TBC materials may evolve differently, which warrants continued efforts on simulations and verification by experiments in the future. Environment barrier coating systems (EBCs) is another type of protective coatings designed for gas turbines to protect the turbine components from the environment attack. The sintering models of EBCs have been less developed according to the literature [69]. To better understand the failure mechanisms, the sintering models should be incorporated into degradation such as oxidation, thermal shock, etc. in FE analysis to simulate the failures with higher fidelity.

8. Conclusions

For decades, thermal barrier coating systems (TBCs) have been designed and fabricated to protect superalloy turbine components from severe heat attack in gas turbine engines. The increased in-let temperature due to TBCs also significantly raises engine thermal efficiency. Although much effort has been made to identify the failure mechanisms of TBCs, there is still a certain knowledge gap on specific degradation and failure mechanisms, particularly the interplay between these mechanisms such as the topcoat sintering of TBCs and its combination with crack nucleation, propagation and final failure in this multi-layer system. This paper reviewed a number of selected sintering models including physics-and mechanics-based analytical and numerical modeling and their integration with FEM model.
The fundamental formulae of high-temperature sintering involve significant mass diffusion along the grain and surface, while the variational principles implemented the energy minimization to the TBCs system to evolve the microstructure dimensions. Furthermore, to better couple the sintering behavior with elastic, thermal, and visco-plastic on topcoat, the constitutive models of materials are incorporated into the formulae. Both principles and numerical methods are presented in detail. Particularly, three numerical sintering models were addressed and summarized in the paper. Nevertheless, the microscopic level of understanding cannot fully describe the mechanical properties change. The macroscopic pores, vertical cracks dramatically reduce the Young’s modulus, but it can be not reflected in the sintering model due to the scale difference. The latest image-based FEM model that can couple the sintering at microscopic level pores with greater scale pores and cracks, and the matching of macroscopic elastic modulus in FEM model and in experiment validated the effectiveness of the FEM model.
At current time, many TC-BC interface failure analysis and life prediction literatures using FEM were found using fixed value or experimental data curves as the input of mechanical properties, made the simulation inaccurate, or costly in experiment. A reliable sintering model and its coupling with FEM model is necessary to reduce the level of cost and improve the precision of simulation. It certainly does help for researchers to make research of failure analysis of versatile of material, spraying method, interface morphology, and microstructure morphology etc. EBC system is currently being developed, with a higher level of environmental particle protection and heat shield, can also develop the corresponding sintering model based on the research on TBC system. For the image-based approach, which is only studied in 2D yet, can be extended to 3D level by scanning the microstructure, to study the crack growth in the out-of-plane direction, to further validate the experimental results. With all these future scopes of work, the gaining of understanding of sintering behavior, will improve the reliability of coating, and better release the potential of the coating.

Funding

This research is financially supported by the DTS-SCS program of National Research Council Canada via A1-06131 project. J.Y. and X.W. would also like acknowledge financial support from the Natural Sciences and Engineering Research Council (NSERC) of Canada (RGPIN-2020-06550).

Institutional Review Board Statement

Not applicable.

Informed Consent Statement

Not applicable.

Acknowledgments

This research is financially supported by the DTS-SCS program of National Research Council Canada via A1-06131 project. J.Y. and X.W. would also like acknowledge financial support from the Natural Sciences and Engineering Research Council (NSERC) of Canada (RGPIN-2020-06550).

Conflicts of Interest

The authors declare no conflict of interest.

References

  1. Clarke, D.R.; Levi, C.G. Materials design for the next generation thermal barrier coatings. Annu. Rev. Mater. Res. 2003, 33, 383–417. [Google Scholar] [CrossRef]
  2. Gleeson, B. Thermal barrier coatings for aeroengine applications. J. Propuls. Power 2006, 22, 375–383. [Google Scholar] [CrossRef]
  3. Sahith, M.S.; Giridhara, G.; Kumar, R.S. Development and analysis of thermal barrier coatings on gas turbine blades—A Review. Mater. Today Proc. 2018, 5, 2746–2751. [Google Scholar] [CrossRef]
  4. Cocks, A.; Fleck, N.; Lampenscherf, S. A brick model for asperity sintering and creep of APS TBCs. J. Mech. Phys. Solids 2014, 63, 412–431. [Google Scholar] [CrossRef]
  5. Levi, C.G. Emerging materials and processes for thermal barrier systems. Curr. Opin. Solid State Mater. Sci. 2004, 8, 77–91. [Google Scholar] [CrossRef]
  6. Qi, H.; Yang, X. Life prediction of thermal barrier coatings. In Thermal Barrier Coatings; Elsevier: Amsterdam, The Netherlands, 2011; pp. 294–316. [Google Scholar]
  7. Chen, K.; Seo, D.; Canteenwalla, P. The effect of high-temperature water vapour on degradation and failure of hot section components of gas turbine engines. Coatings 2021, 11, 1061. [Google Scholar] [CrossRef]
  8. Essa, S.K.; Chen, K.; Liu, R.; Wu, X.; Yao, M.X. Failure mechanisms of APS-YSZ-CoNiCrAlY thermal barrier coating under isothermal oxidation and solid particle erosion. J. Therm. Spray Technol. 2021, 30, 424–441. [Google Scholar] [CrossRef]
  9. Liu, Y.; Ravichandran, R.; Chen, K.; Patnaik, P. Application of machine learning to solid particle erosion of APS-TBC and EB-PVD TBC at elevated temperatures. Coatings 2021, 11, 845. [Google Scholar] [CrossRef]
  10. Ghai, R.S.; Chen, K.; Baddour, N. Modelling thermal conductivity of porous thermal barrier coatings. Coatings 2019, 9, 101. [Google Scholar] [CrossRef] [Green Version]
  11. Moteb, A.; Chen, K. Modelling and evaluating thermal conductivity of porous thermal barrier coatings at elevated temperatures. Ceram. Int. 2020, 46, 21939–21957. [Google Scholar] [CrossRef]
  12. Martena, M.; Botto, D.; Fino, P.; Sabbadini, S.; Gola, M.; Badini, C. Modelling of TBC system failure: Stress distribution as a function of TGO thickness and thermal expansion mismatch. Eng. Fail. Anal. 2006, 13, 409–426. [Google Scholar] [CrossRef]
  13. Padture, N.P.; Gell, M.; Jordan, E.H. Thermal Barrier coatings for gas-turbine engine applications. Science 2002, 296, 280–284. [Google Scholar] [CrossRef] [PubMed]
  14. Cheng, B.; Zhang, Y.-M.; Yang, N.; Zhang, M.; Chen, L.; Yang, G.-J.; Li, C.-X.; Li, C.-J. Sintering-induced delamination of thermal barrier coatings by gradient thermal cyclic test. J. Am. Ceram. Soc. 2017, 100, 1820–1830. [Google Scholar] [CrossRef]
  15. Bakan, E.; Vassen, R. Ceramic top coats of plasma-sprayed thermal barrier coatings: Materials, processes, and properties. J. Therm. Spray Technol. 2017, 26, 992–1010. [Google Scholar] [CrossRef]
  16. Li, G.; Xie, H.; Yang, G.; Liu, G.; Li, C.; Li, C.-J. A comprehensive sintering mechanism for TBCs-Part I: An overall evolution with two-stage kinetics. J. Am. Ceram. Soc. 2017, 100, 2176–2189. [Google Scholar] [CrossRef]
  17. Zhang, B.; Chen, K.; Baddour, N.; Patnaik, P.C. Life prediction of atmospheric plasma-sprayed thermal barrier coatings using temperature-dependent model parameters. J. Therm. Spray Technol. 2017, 26, 902–912. [Google Scholar] [CrossRef]
  18. Zhang, B.; Chen, K.; Baddour, N.; Patnaik, P. Failure and life evaluation of EB-PVD thermal barrier coatings using temperature-process-dependent model parameters. Corros. Sci. 2019, 156, 1–9. [Google Scholar] [CrossRef]
  19. Zhang, B.; Chen, K.; Baddour, N. Stress models for electron beam-physical vapor deposition thermal barrier coatings using temperature-process-dependent model parameters. J. Eur. Ceram. Soc. 2021, 41, 5658–5674. [Google Scholar] [CrossRef]
  20. Zhang, X.; Cocks, A.C.; Okajima, Y.; Takeno, K.; Torigoe, T. An image-based model for the sintering of air plasma sprayed thermal barrier coatings. Acta Mater. 2021, 206, 116649. [Google Scholar] [CrossRef]
  21. Cipitria, A.; Golosnoy, I.; Clyne, T. A sintering model for plasma-sprayed zirconia TBCs. Part I: Free-standing coatings. Acta Mater. 2009, 57, 980–992. [Google Scholar] [CrossRef]
  22. Lv, B.; Fan, X.; Xie, H.; Wang, T. Effect of neck formation on the sintering of air-plasma-sprayed thermal barrier coating system. J. Eur. Ceram. Soc. 2017, 37, 811–821. [Google Scholar] [CrossRef]
  23. Zhu, D.; Miller, R.A. Sintering and creep behavior of plasma-sprayed zirconia- and hafnia-based thermal barrier coatings. Surf. Coatings Technol. 1998, 108–109, 114–120. [Google Scholar] [CrossRef] [Green Version]
  24. Kang, S.-J. Basis of Sintering Science. In Sintering: Densification, Grain Growth and Microstructure; Elsevier Butterworth-Heinemann: Oxford, UK, 2011; pp. 1–27. [Google Scholar]
  25. Sadowski, T.; Golewski, P. Loadings in Thermal Barrier Coatings of Jet Engine Turbine Blades; Springer Science and Business Media LLC: Singapore; Springer Singapore Pte. Limited: Singapore, 2016; Volume 39. [Google Scholar]
  26. Nicholls, J. Advances in coating design for high-performance gas turbines. MRS Bull. 2003, 28, 659–670. [Google Scholar] [CrossRef]
  27. Xu, H.; Wu, J. New materials, technologies and processes in thermal barrier coatings. In Thermal Barrier Coatings; Elsevier: Amsterdam, The Netherlands, 2011; pp. 317–328. [Google Scholar]
  28. Fergus, J.W. Zirconia and pyrochlore oxides for thermal barrier coatings in gas turbine engines. Met. Mater. Trans. E 2014, 1, 118–131. [Google Scholar] [CrossRef] [Green Version]
  29. Vaßen, R.; Jarligo, M.O.; Steinke, T.; Mack, D.E.; Stöver, D. Overview on advanced thermal barrier coatings. Surf. Coat. Technol. 2010, 205, 938–942. [Google Scholar] [CrossRef]
  30. Kyaw, S.; Jones, A.; Hyde, T. Predicting failure within TBC system: Finite element simulation of stress within TBC system as affected by sintering of APS TBC, geometry of substrate and creep of TGO. Eng. Fail. Anal. 2013, 27, 150–164. [Google Scholar] [CrossRef]
  31. Rösler, J.; Baker, M.; Volgmann, M. Stress state and failure mechanisms of thermal barrier coatings: Role of creep in thermally grown oxide. Acta Mater. 2001, 49, 3659–3670. [Google Scholar] [CrossRef]
  32. Vaßen, R.; Kerkhoff, G.; Stöver, D. Development of a micromechanical life prediction model for plasma sprayed thermal barrier coatings. Mater. Sci. Eng. A 2001, 303, 100–109. [Google Scholar] [CrossRef]
  33. Cocks, A.C.; Gill, S.P.; Pan, J. Modeling microstructure evolution in engineering materials. Adv. Appl. Mech. 1998, 36, 81–162. [Google Scholar] [CrossRef]
  34. Ch’Ng, H.; Pan, J. Sintering of particles of different sizes. Acta Mater. 2007, 55, 813–824. [Google Scholar] [CrossRef]
  35. Cocks, A.; Fleck, N. Constrained sintering of an air-plasma-sprayed thermal barrier coating. Acta Mater. 2010, 58, 4233–4244. [Google Scholar] [CrossRef]
  36. Budiansky, B.; O’Connell, R.J. Elastic moduli of a cracked solid. Int. J. Solids Struct. 1976, 12, 81–97. [Google Scholar] [CrossRef]
  37. Gasik, M.; Zhang, B. A constitutive model and FE simulation for the sintering process of powder compacts. Comput. Mater. Sci. 2000, 18, 93–101. [Google Scholar] [CrossRef]
  38. Xu, J.; Khor, K. Plasma spraying for thermal barrier coatings: Processes and applications. Therm. Barrier Coat. 2011, 99–114. [Google Scholar] [CrossRef]
  39. Cipitria, A.; Golosnoy, I.; Clyne, T. Sintering kinetics of plasma-sprayed zirconia TBCs. J. Therm. Spray Technol. 2007, 16, 809–815. [Google Scholar] [CrossRef] [Green Version]
  40. Cipitria, A.; Golosnoy, I.; Clyne, T. A sintering model for plasma-sprayed zirconia thermal barrier coatings. Part II: Coatings bonded to a rigid substrate. Acta Mater. 2009, 57, 993–1003. [Google Scholar] [CrossRef] [Green Version]
  41. Fauchais, P.; Vardelle, M.; Vardelle, A. Reliability of plasma-sprayed coatings: Monitoring the plasma spray process and improving the quality of coatings. J. Phys. D Appl. Phys. 2013, 46, 224016. [Google Scholar] [CrossRef]
  42. Takagi, K.; Kudo, D.; Kawasaki, A.; Harada, Y. Microstructural dependency of thermal expansion and sintering shrinkage in plasma-sprayed zirconia coatings. Surf. Coat. Technol. 2011, 205, 4411–4417. [Google Scholar] [CrossRef]
  43. Li, G.; Yang, G. Understanding of degradation-resistant behavior of nanostructured thermal barrier coatings with bimodal structure. J. Mater. Sci. Technol. 2019, 35, 231–238. [Google Scholar] [CrossRef]
  44. Eriksson, R.; Brodin, H.; Johansson, S.; Östergren, L.; Li, X.-H. Fractographic and microstructural study of isothermally and cyclically heat treated thermal barrier coatings. Surf. Coat. Technol. 2014, 243, 82–90. [Google Scholar] [CrossRef]
  45. Li, G.; Xie, H.; Yang, G.; Liu, G.; Li, C.; Li, C.-J. A comprehensive sintering mechanism for TBCs-Part II: Multiscale multipoint interconnection-enhanced initial kinetics. J. Am. Ceram. Soc. 2017, 100, 4240–4251. [Google Scholar] [CrossRef]
  46. Vasile, B.S.; Birca, A.C.; Surdu, V.A.; Neacsu, I.-A.; Nicoară, A.I. Ceramic composite materials obtained by electron-beam physical vapor deposition used as thermal barriers in the aerospace industry. Nanomaterials 2020, 10, 370. [Google Scholar] [CrossRef] [Green Version]
  47. Kabir, M.R.; Sirigiri, A.K.; Naraparaju, R.; Schulz, U. Flow kinetics of molten silicates through thermal barrier coating: A numerical study. Coatings 2019, 9, 332. [Google Scholar] [CrossRef] [Green Version]
  48. Ali, N.; Teixeira, J.A.; Addali, A.; Saeed, M.; Al-Zubi, F.; Sedaghat, A.; Bahzad, H. Deposition of stainless steel thin films: An electron beam physical vapour deposition approach. Materials 2019, 12, 571. [Google Scholar] [CrossRef] [PubMed] [Green Version]
  49. Von Niessen, K.; Gindrat, M. Plasma spray-PVD: A new thermal spray process to deposit out of the vapor phase. J. Therm. Spray Technol. 2011, 20, 736–743. [Google Scholar] [CrossRef] [Green Version]
  50. Lughi, V.; Tolpygo, V.K.; Clarke, D.R. Microstructural aspects of the sintering of thermal barrier coatings. Mater. Sci. Eng. A 2004, 368, 212–221. [Google Scholar] [CrossRef]
  51. Schulz, U.; Saruhan, B.; Fritscher, K.; Leyens, C. Review on advanced EB-PVD ceramic topcoats for TBC applications. Int. J. Appl. Ceram. Technol. 2005, 1, 302–315. [Google Scholar] [CrossRef]
  52. Hutchinson, R.; Fleck, N.; Cocks, A. A sintering model for thermal barrier coatings. Acta Mater. 2006, 54, 1297–1306. [Google Scholar] [CrossRef]
  53. Yang, J.; Wang, L.; Tan, X.; Zhi, Q.; Yang, R.; Zhang, G.; Liu, Z.; Ge, X.; Liang, E. Effect of sintering temperature on the thermal expansion behavior of ZrMgMo3O12p/2024Al composite. Ceram. Int. 2018, 44, 10744–10752. [Google Scholar] [CrossRef]
  54. Altun, Ö.; Böke, Y.E. Effect of the microstructure of EB-PVD thermal barrier coatings on the thermal conductivity and the methods to reduce the thermal conductivity. Arch. Mater. Sci. Eng. 2009, 40, 47–52. [Google Scholar]
  55. Kumar, S.; Cocks, A.C.F. Computational modelling of constrained sintering in EB-PVD thermal barrier coatings. Model. Simul. Mater. Sci. Eng. 2013, 21, 65008. [Google Scholar] [CrossRef]
  56. Freborg, A.; Ferguson, B.; Brindley, W.; Petrus, G. Modeling oxidation induced stresses in thermal barrier coatings. Mater. Sci. Eng. A 1998, 245, 182–190. [Google Scholar] [CrossRef]
  57. Xie, W.; Jordan, E.; Gell, M. Stress and cracking behavior of plasma sprayed thermal barrier coatings using an advanced constitutive model. Mater. Sci. Eng. A 2006, 419, 50–58. [Google Scholar] [CrossRef]
  58. Białas, M. Finite element analysis of stress distribution in thermal barrier coatings. Surf. Coatings Technol. 2008, 202, 6002–6010. [Google Scholar] [CrossRef]
  59. Cheng, J.; Jordan, E.; Barber, B.; Gell, M. Thermal/residual stress in an electron beam physical vapor deposited thermal barrier coating system. Acta Mater. 1998, 46, 5839–5850. [Google Scholar] [CrossRef]
  60. Ranjbar-Far, M.; Absi, J.; Mariaux, G.; Dubois, F. Simulation of the effect of material properties and interface roughness on the stress distribution in thermal barrier coatings using finite element method. Mater. Des. 2010, 31, 772–781. [Google Scholar] [CrossRef]
  61. Abdelgawad, A.; Al-Athel, K. Effect of TGO thickness, pores, and creep on the developed residual stresses in thermal barrier coatings under cyclic loading using SEM image-based finite element model. Ceram. Int. 2021, 47, 20064–20076. [Google Scholar] [CrossRef]
  62. Lv, B.; Xie, H.; Xu, R.; Fan, X.; Zhang, W.; Wang, T. Effects of sintering and mixed oxide growth on the interface cracking of air-plasma-sprayed thermal barrier coating system at high temperature. Appl. Surf. Sci. 2016, 360, 461–469. [Google Scholar] [CrossRef]
  63. Lv, B.; Mücke, R.; Zhou, D.; Fan, X.; Wang, T.J.; Guillon, O.; Vaßen, R. A constitutive model for the sintering of suspension plasma-sprayed thermal barrier coating with vertical cracks. J. Am. Ceram. Soc. 2019, 102, 6202–6212. [Google Scholar] [CrossRef]
  64. Lv, B.; Fan, X.; Li, D.; Wang, T. Towards enhanced sintering resistance: Air-plasma-sprayed thermal barrier coating system with porosity gradient. J. Eur. Ceram. Soc. 2018, 38, 1946–1956. [Google Scholar] [CrossRef]
  65. Kumar, S.; Cocks, A. Sintering and mud cracking in EB-PVD thermal barrier coatings. J. Mech. Phys. Solids 2012, 60, 723–749. [Google Scholar] [CrossRef]
  66. Zhang, X.; Cocks, A.C.; Okajima, Y.; Takeno, K.; Torigoe, T. Constrained sintering and cracking of air plasma sprayed thermal barrier coatings: Experimental observation and modeling. J. Am. Ceram. Soc. 2021, 104, 4759–4772. [Google Scholar] [CrossRef]
  67. Fleck, N.; Cocks, A. A multi-scale constitutive model for the sintering of an air-plasma-sprayed thermal barrier coating, and its response under hot isostatic pressing. J. Mech. Phys. Solids 2009, 57, 689–705. [Google Scholar] [CrossRef]
  68. Burnett, T.L.; Kelley, R.; Winiarski, B.; Contreras, L.; Daly, M.; Gholinia, A.; Burke, M.G.; Withers, P. Large volume serial section tomography by Xe Plasma FIB dual beam microscopy. Ultramicroscopy 2016, 161, 119–129. [Google Scholar] [CrossRef] [PubMed]
  69. Lv, B.; Jin, X.; Cao, J.; Xu, B.; Wang, Y.; Fang, D. Advances in numerical modeling of environmental barrier coating systems for gas turbines. J. Eur. Ceram. Soc. 2020, 40, 3363–3379. [Google Scholar] [CrossRef]
Figure 1. (a) Schematic diagram of Domain (1): inter-splat pores, demonstrated in perspective, elevation, and plan view.; (b) Schematic diagram of Domain (2): intra-splat microcracks, demonstrated in perspective, elevation, and plan view. The dotted line is the shape of the model when it is fully sintered [21] (Adopted with permission from [21] copyright Elsevier 2009).
Coatings 11 01214 g001
Figure 2. The thermal elasto-viscoplastic constitutive model for sintering process [37] (Adopted with permission from [37] copyright Elsevier 2000).
Coatings 11 01214 g002
Figure 3. (a) A comparison of through-thickness and in-plane linear contraction of the coating at 1400 °C and their experimental data; (b) The comparison of through-thickness linear contraction at 1200 and 1400 °C sintering environment and the experimental data [21] (Adopted with permission from [21] copyright Elsevier 2009).
Coatings 11 01214 g003
Figure 4. Comparisons between experimental and simulation result of (a) specific surface area and (b) porosity at 1400 °C [21] (Adopted with permission from [21] copyright Elsevier 2009).
Coatings 11 01214 g004
Figure 5. (a) The arrangement of hexagonal splats; (b) Ideal arrangement of neighboring splats. (splats are simplified as columnar shape) with inclined asperities at top surface [4] (Adopted with permission from [4] copyright Elsevier 2014).
Coatings 11 01214 g005
Figure 6. Free-standing APS sintering simulation results for (a) in-plane and out-of-plane strain (b) asperity width (c) Young’s modulus [4] (Adopted with permission from [4] copyright Elsevier 2014).
Coatings 11 01214 g006
Figure 7. Asperity width growth in the constrained case for side asperities (solid line) and top asperities (dashed lines), and the number 16 represents the double of b s l s and 1/16 represents the half of b s l s [4] (Adopted with permission from [4] copyright Elsevier 2014).
Coatings 11 01214 g007
Figure 8. Schematic of EB-PVD deposition process; (Stage 1): Device illustrations; (Stage 2): Deposition process [48].
Coatings 11 01214 g008
Figure 9. (A) The cross-sectional microstructure of as-deposited EB-PVD top coat [49]; (B) the columnar geometry near the surface of top coat [47] (Adopted with permission from [47] copyright ASM International 2011); (C) mud-crack formation after 100 1 h thermal cycle at 1150 °C [50] (Adopted with permission from [50] copyright Elsevier 2004).
Coatings 11 01214 g009
Figure 10. (A) The geometry of the representative columns; (B) the dimensions of the necks at the side edges and the definitions of fluxes, interface energies, and diffusivities at the necks [52] (Adopted with permission from [52] copyright Elsevier 2006).
Coatings 11 01214 g010
Figure 11. (a) A cross-sectional micrograph of as-deposited APS TBC; (b) a FE mesh generated based on micrograph at (a). The number 1–3 represent three types of offset strategies: type ① has uniform offset that suitable for cracks connecting pores; type ② offset are grow from 0 at crack tip then linearly grow to twice of mean measured offset, which applied on cracks fully contained in the micrograph; type ③ offset are applied to the cracks that only have one edge in the micrograph, similar strategy to type ②; (c) The initial state of asperities at different segment of the crack [20] (Adopted with permission from [20] copyright Elsevier 2021).
Coatings 11 01214 g011
Figure 12. The microstructure after 1200 h of (a) free sintering and (b) constrained sintering; (c) The comparison of in-plane modulus evolution for free sintering and constrained case [20] (Adopted with permission from [20] copyright Elsevier 2021).
Coatings 11 01214 g012
Publisher’s Note: MDPI stays neutral with regard to jurisdictional claims in published maps and institutional affiliations.

