Article

Performance Assessment of Differently Dried Coating Systems for Potential Application in the Power Transformer Industry

1
Faculty of Mechanical Engineering and Naval Architecture, University of Zagreb, 10002 Zagreb, Croatia
2
Končar Steel Structures Inc., 10000 Zagreb, Croatia
*
Author to whom correspondence should be addressed.
Coatings 2022, 12(3), 331; https://doi.org/10.3390/coatings12030331
Submission received: 3 February 2022 / Revised: 25 February 2022 / Accepted: 28 February 2022 / Published: 2 March 2022

Abstract

:
Many companies in the power transformer industry are striving to speed up the drying process of coatings, which is why alternative drying methods are constantly being explored while maintaining the same coating protection properties. The infrared (IR) drying of protective coatings is a potential solution for their higher productivity, but has not yet been extensively investigated. In this paper, two solvent-borne coating systems, with and without zinc in the primer, from two different manufacturers, dried by infrared radiation and under atmospheric conditions, were studied. The coating systems consisted of epoxy primer, epoxy intermediate coat, and polyurethane topcoat. Anti-corrosion performance of the coatings was characterized using a salt spray chamber, pull-off adhesion testing, electrochemical impedance spectroscopy (EIS) investigation, and open circuit potential (OCP) measurement. All samples were analyzed using stereo microscope. A scanning electron microscope (SEM) with energy-dispersive X-ray spectroscopy (EDX) for detailed study and chemical composition determination was used. The results showed that infrared technology notably reduced coating drying times while maintaining or improving anticorrosion performance properties compared to the coatings dried under atmospheric conditions.

1. Introduction

Due to its extensive applications in various industries such as automotive, household appliances, business machinery, and heavy construction (marine, chemical), steel has become an important part of our life [1]. General recommendations for mild steel are that it should be used in an atmospheric rather than acid environment. To slow down the corrosion rate of mild steel in different environments, preventive measures must be used [2]. In this regard, the most common and useful methods for metal corrosion protection are cathodic protection [3,4] and application of organic coatings [5,6], corrosion inhibitors [7], and conversion coatings [8].
Organic coatings stand out as the most applied method whose protective efficiency consists of high resistance to ionic movement by creating a barrier between the substrate and the environment. To achieve satisfactory protection via a barrier mechanism, the recommended coating thickness must be applied. Good adhesion to the metal substrate and between different layers is also crucial for good performance and durability [9,10]. With increasing concerns over the environment, green and innovative coatings have been gaining more attention over the last 15–20 years. Solvent-based coatings emit toxic volatile organic compounds (VOC), which has led the industry into developing new solutions and technologies such as water-borne, high solids, and UV/IR-curable coatings. Biodegradable coatings and the addition of non-toxic compounds are also the means to have a positive impact on the environment [11,12].
A Zn-rich coating has protective mechanisms which can efficiently prevent a mild steel substrate from corrosion. Zinc provides great cathodic protection and, with the formation of nonconductive corrosion products of zinc, provides dominating barrier protection [13,14]. The corrosion performance of epoxy coatings can be evaluated with various methods. Zhao et al. [14] studied the degradation of zinc-rich epoxy coating in 3.5% NaCl solution using electrochemical impedance spectroscopy (EIS) and open circuit potential measurements (OCP), scanning electron microscope (SEM), Fourier transform infrared spectroscopy (FTIR), and X-ray diffraction (XRD). Wang et al. [15] investigated the corrosive electrochemical behaviors of zinc-rich and graphite-filled epoxy coatings in 3.5% NaCl solution also using EIS and OCP, followed by the accelerated corrosion tests in a salt spray chamber. Both papers [14,15] showed that epoxy coatings containing zinc particles have good cathodic protection and barrier properties for the steel substrate.
Application of infrared (IR) drying technology achieves an accelerated and less-harmful drying process of coatings. Compared to a convection oven, it consumes less energy and is a more efficient and faster method. Since it has high throughput and mild conditions, there is no thermal damage caused to the workpiece. IR drying works on the principle of heat transfer by IR rays straight to the surface of the coating. In this way, the heat from the IR radiation dries by absorption through a layer of wet paint and reflection from the metal, whereby the coating dries in two directions—from the outside inwards and from the inside outwards. Consequently, an extremely fast transfer of residual solvents and a fast chemical reaction corresponding to the last stage of polymerization are achieved. Thus, coatings dried in this way achieve a degree of crosslinking that allows the painted object to be immediately put into operation, i.e., exploitation [16,17]. However, the influence of the catalytic infrared radiation (CIR) on the coating curing process and comparison with other drying methods have not been extensively investigated.
In this paper, the catalytic IR heating technology was used for drying two different three-layer solvent-borne coating systems (epoxy primer, epoxy intermediate coat, polyurethane topcoat), with and without Zn (R) primer, from two different paint manufacturers. The aim of this paper was to compare the performance of differently dried coating systems for corrosion prevention in the power transformer industry. Protective properties were evaluated in a chloride environment using a salt spray chamber, followed by Pull-off adhesion testing. Coating resistance was obtained by electrochemical impedance spectroscopy (EIS), while electrochemical potential state was determined by open circuit potential (OCP) measurement. Electrochemical measurements were performed in 3% NaCl solution at different exposure periods. Microstructural analysis and surface morphology was performed on the cross-section of the coated samples using stereo microscope, after which, for detailed examination and chemical composition, a scanning electron microscope (SEM) with energy-dispersive X-ray spectroscopy (EDX) was conducted. All IR samples were compared to samples dried under atmospheric conditions.

2. Materials and Methods

Coating systems consisting of two-component (2K) epoxy primers with and without zinc, epoxy intermediate coat, and a final polyurethane topcoat were tested. Half of the samples were dried under atmospheric conditions and the other half by infrared radiation. Sample surface preparation was performed with a steel grit blasting abrasive to the required cleanliness Sa 2.5, according to ISO 8501-1 [18] and a medium degree of roughness (M), according to ISO 8503-1 [19]. The samples were mild steel plates with the dimension 150 × 120 × 8 mm. Table 1 and Table 2 show the applied coating systems regarding the gloss, solids by volume, recommended thicknesses, and overcoating times for each coating. The coatings were applied with spiral applicators with thicknesses recommended in the manufacturer’s technical specifications. Table 3 shows applied coating systems on steel samples with respect to the drying method, manufacturer, and primer type.
A catalytic infrared radiation (CIR) gas emitter with wavelengths between 2 and 10 μm was used. Gas catalytic IR drying is a flameless catalytic process in which gas is converted into IR energy [16]. The emitter has dimensions of 60 × 60 cm and a power of 6 kW. The completion of IR drying is carried out by the contact method with a light stroke of a pencil. When the pencil no longer leaves a trace, the drying process is complete, and the coating is sufficiently crosslinked. A fully crosslinked coating is a coating that has achieved its final hardness, fully adheres to the surface, has maximum strength, and is ready for exploitation [20].
An Elcometer 456 instrument (Elcometer Limited, Manchester, UK) with its non-destructive magnetic induction method was used to measure dry film thickness (DFT), according to ISO 2808 [21]. Measurements were performed on ten different locations per sample with accuracy ± 2.5 µm. The coating adhesion was determined using Elcometer 108 Hydraulic Adhesion Tester (Elcometer Limited, Manchester, UK) with accuracy ± 0.4 MPa, according to ISO 4624 [22]. Three pull-off tests were done after the neutral salt spray test and the average value was noted in the table.
For corrosion performance prediction, an accelerated laboratory test in salt spray chamber was performed [1,13,23]. According to ISO 9227 [24], the temperature in the salt chamber was 35 ± 2 °C, the compressed air pressure was 0.7–1.4 bar, and the concentration of NaCl solution was 5%. The test was performed in an Ascott S450 salt chamber, model S450 (Ascott Analytical Equipment Limited, Staffordshire, UK). Samples were exposed for 720 h and periodically examined to evaluate the degradation of coatings according to ISO 4628 [25]. Three samples of each coating system were tested in the salt chamber.
Open circuit potential (OCP) measurement was used to assess the corrosion/stability tendency in the NaCl solution [14]. The open circuit potential of the coated samples was measured against the saturated calomel electrode (SCE) as the reference electrode [14] in 3% NaCl solution, at room temperature 23 ± 2 °C. The duration of OCP measurement was 16 ± 1 min in order to achieve steady state conditions.
The protective properties of the coating systems with and without zinc in the primer were evaluated by electrochemical impedance spectroscopy [5,13], with a VersaSTAT 3 Potentiostat/Galvanostat (AMETEK Scientific 131 Instruments, Princeton applied research, Berwyn, PA, USA). The measurements were carried out after 24, 250, and 500 h of immersion in 3% NaCl solution at room temperature (23 ± 2) °C. The impedance spectra were performed at open circuit potential with a 100 mV RMS sinusoidal amplitude, using 10 points. The frequency range was from 105 Hz to 10−1 Hz. A three-electrode cell including a coated steel sample as the working electrode, a saturated calomel electrode (SCE) as the reference electrode and two graphite sticks as the auxiliary electrodes were used in the experiments [10]. Auxiliary electrodes are usually made of inert materials such as graphite or platinum [26]. The surface of the working electrode was 19.6 cm2, while the surface of the counter electrodes was 25.5 cm2. Data was interpreted with the AMETEK ZSimpWin software. Each measurement was implemented in two replications for checking the repeatability of the data.
The surface morphology and microstructure of the differently dried epoxy coating systems with or without zinc in the primer were observed by an Olympus GX51 (Olympus Corporation, Tokyo, Japan) inverted metallurgical microscope and FEI Quanta 250 FE Scanning Electron Microscope equipped with an Oxford PENTAFET detector (Oxford Instruments, Belfast, UK). The energy used for the analysis was 20 keV. The surface morphology observations with Olympus GX51 were carried out on three different cross-sections and the representative micrograph was utilized.
A flowchart of the previously described methods and procedures is given in Figure 1.

3. Results and Discussion

3.1. IR Drying

As explained in the introduction, with IR gas catalytic technology, a two-way drying is achieved, and coatings are fully cured in the minimum amount of time. After cooling to room temperature, there is practically no intercoating interval before the next application, meaning that a three-layer coating system can be applied within one working day. Figure 2 shows total drying times of IR-dried coating systems, which are significantly lower than total minimum overcoating intervals at 20 °C from Table 1 and Table 2. Although, according to the manufacturer’s technical specifications, the coatings are fully cured and ready for exploitation after 7 days at 20 °C. Infrared drying not only has a positive impact on the environment through less gas consumption and burning VOCs but it also speeds up the production process with no drop in quality.

3.2. Coating Thickness Measurement

Greater variations in thickness were not determined for each of the coated samples. According to ISO 12944-5 [27], the required DFT for coating systems with zinc in the primer is 200 µm and without zinc is 240 µm. The sample thicknesses exceeded the required values and within one system were approximately the same.

3.3. Salt Spray Test Result

After 30 days (720 h) of accelerated corrosion test in the salt spray chamber (ISO 9227), coated samples did not show any signs of rusting, cracking, flaking, and blistering, according to ISO 4628 [25]. Corrosion appeared only on the edges of the sample but that was not taken into consideration. Coated samples showed excellent adhesion even after corrosion test in salt spray chamber with values over 8.5 MPa, according to ISO 4624 [22]. Pull-off values for coating systems 1 and 4 were higher on IR dried samples, unlike on systems 2 and 3 where atmospherically dried ones showed better adhesion properties. Prior to the corrosion test, all samples had shown even better adhesion (no flaking). The IR drying method did not have any negative influence on the coating adhesion in a marine environment. The results of coating dry-film thickness and corrosion testing after 720 h in the salt spray chamber, as well as the following adhesion tests, are shown in Table 4. Since all samples tested in the salt spray chamber displayed similar corrosion properties, representative samples were chosen and showed in the table.

3.4. OCP and EIS Study

The results for open circuit potential after stabilization in 3% NaCl solution are shown in Table 5. Most coating systems exhibit stable corrosion potential over time, which indicates very good protective properties. Sample 3.2. showed instability over time when exposed to the saline solution but after 500 h, the value was similar to the other samples.
EIS plots of the coated samples were fitted with different equivalent circuit models (Figure 3) depending on the immersion period. Rs represents the electrolyte resistance, Rc is the coating resistance, Cc coating capacitance, and Qc is the constant phase element, which describes coatings nonideal capacitance behavior. Cdl and Rct are the double-layer capacitance and charge transfer resistance at the steel–electrolyte interface, respectively [14]. Model A was used when the coatings exhibited very good barrier properties, at the early stage of exposure, after 24 h. After 250 and 500 h in 3% NaCl, Model B was used because it was likely that aggressive media like water and oxygen penetrated into the coating. CPE is a constant phase element, which depends on the empirical constant n. The constant n is in the range from 0 to 1. If n = 0, the CPE acts as a resistor, and if n = 1, the CPE acts as a capacitor [10].
A CNLS (complex non-linear least squares) simulation was performed in order to analyze equivalent circuits and compare experimented and simulated data. Table 6 and Table 7 contain fitted values of equivalent circuit elements (Rs, Rc, Rct, Qc, and Cdl) and the corresponding χ2 modeling errors after 24 and 500 h of immersion in 3% NaCl. Replicated values were in the same range so only the first measurement is shown. The quality of fitting to equivalent circuit was evaluated by the chi-square value (χ2), that is, the sum of the square of the differences between theoretical and experimental points [28]. The lower the chi-square value is, the better fitting results are achieved. Comparison between the experimental data and CNLS simulations in Nyquist representation are shown in Figure 4. Initially, coatings acted as a pure capacitor with very high resistance and very low capacitance. Gradually, water penetrated through the coating causing it to increase its capacitance (Cc/Qc) and drop its resistance (Rc). It was observed that the charge transfer resistance (Rct) predominated over the coating resistance (Rc) in the corrosion mechanism, that is Rct was higher than Rc. These parameters are associated with the dissolution of the metal substrate and the corrosion product formation and the resistance through the porous coating layer [29]. When the electrolyte penetrates into the coating pores, it affects its electrochemical behavior [30]. Double layer capacitance (Cdl) was still very low after 20 days of immersion, indicating that serious delamination under the coating had not happened yet.
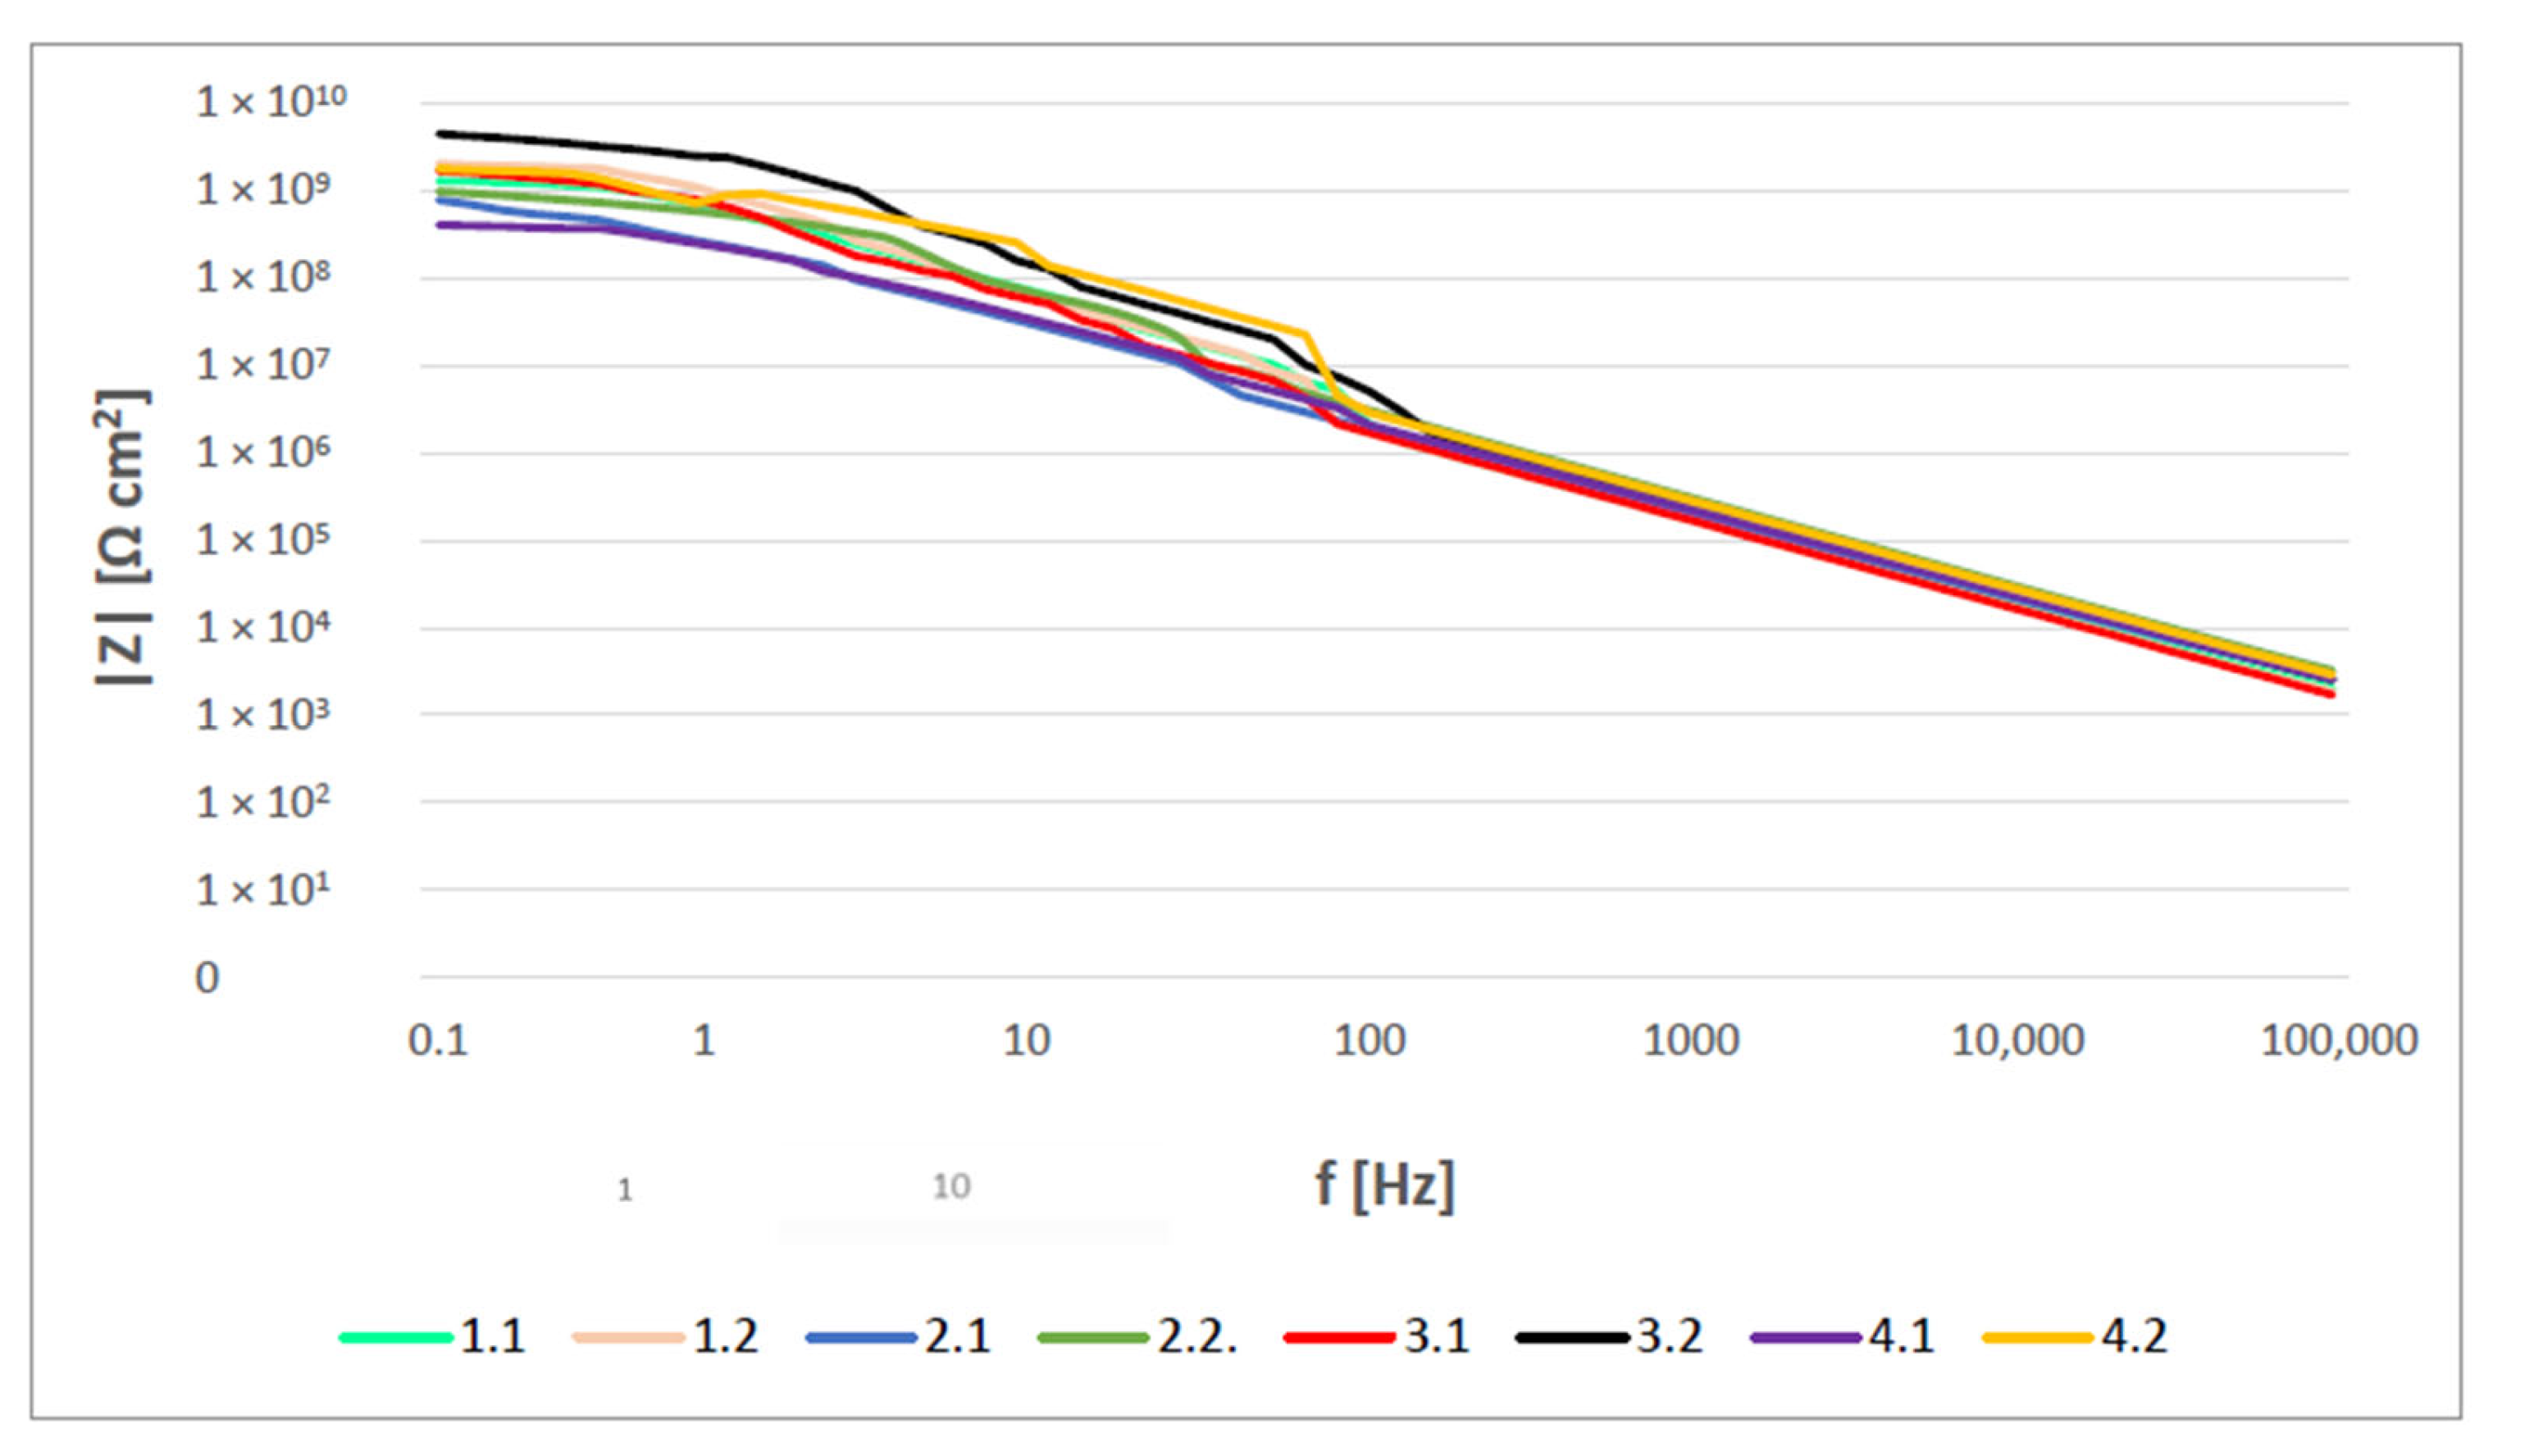
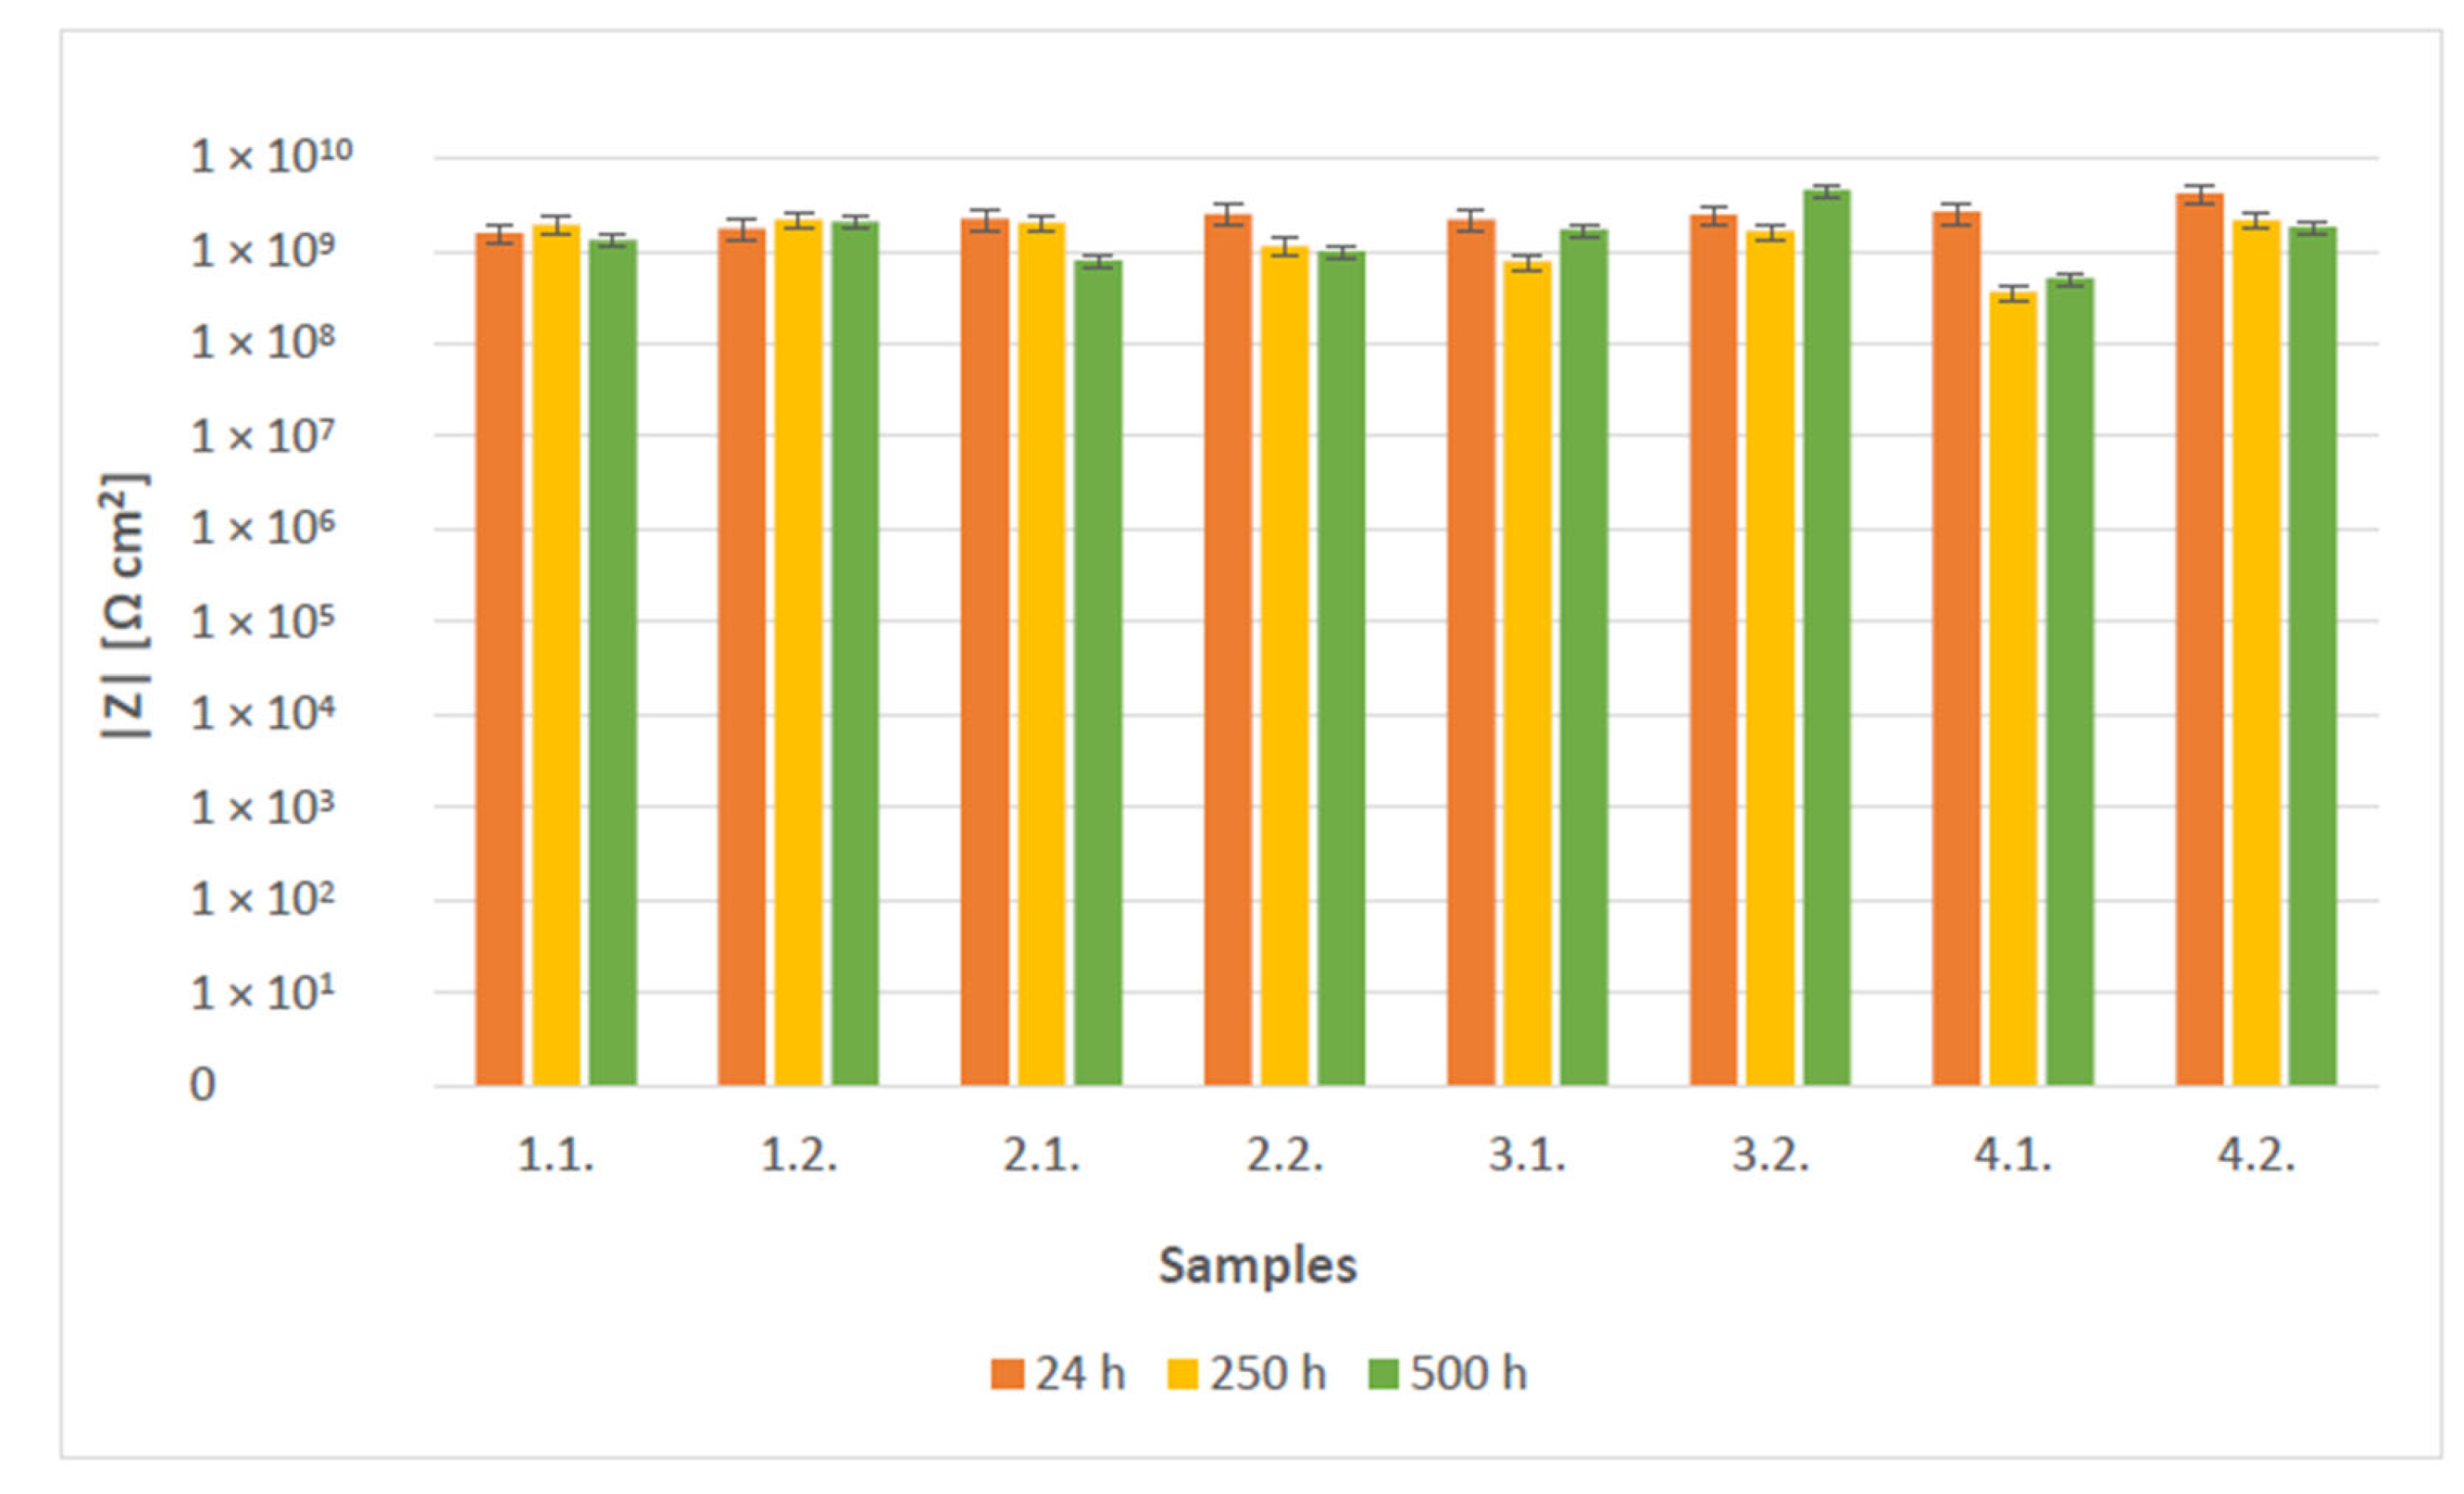
Bode diagrams of examined samples show that coating resistance of all coating systems at the beginning of the exposure (Figure 5) had excellent average values (>109 Ωcm2) for protective coatings [31]. After 250 (Figure 6) and 500 h (Figure 7) in 3% NaCl, average values decreased for most tested coatings, but still displayed very good protective properties (>108 Ωcm2). The coating system with zinc in the epoxy primer (3.1. and 3.2.) even showed an increase in coating resistance after 500 h of exposure, which may be due to the self-healing properties of zinc. Since duplicate experiments were carried out for each sample, Figure 8 represents the average coating resistances of samples at 0.1 Hz for different immersion times.

3.5. Metallurgical Analysis

Figure 9 shows all samples analyzed by Olympus GX51 (Olympus Corporation, Tokyo, Japan) inverted metallurgical microscope with 100× magnification. On each cross-section, the layer thickness was measured. It is evident that the applied coatings have uniform thickness and appear adequately cured with no defects. There are no signs of crack and pores, and the coating thickness corresponds with the ones measured with the magnetic method.

3.6. Morphology and EDX Spectra

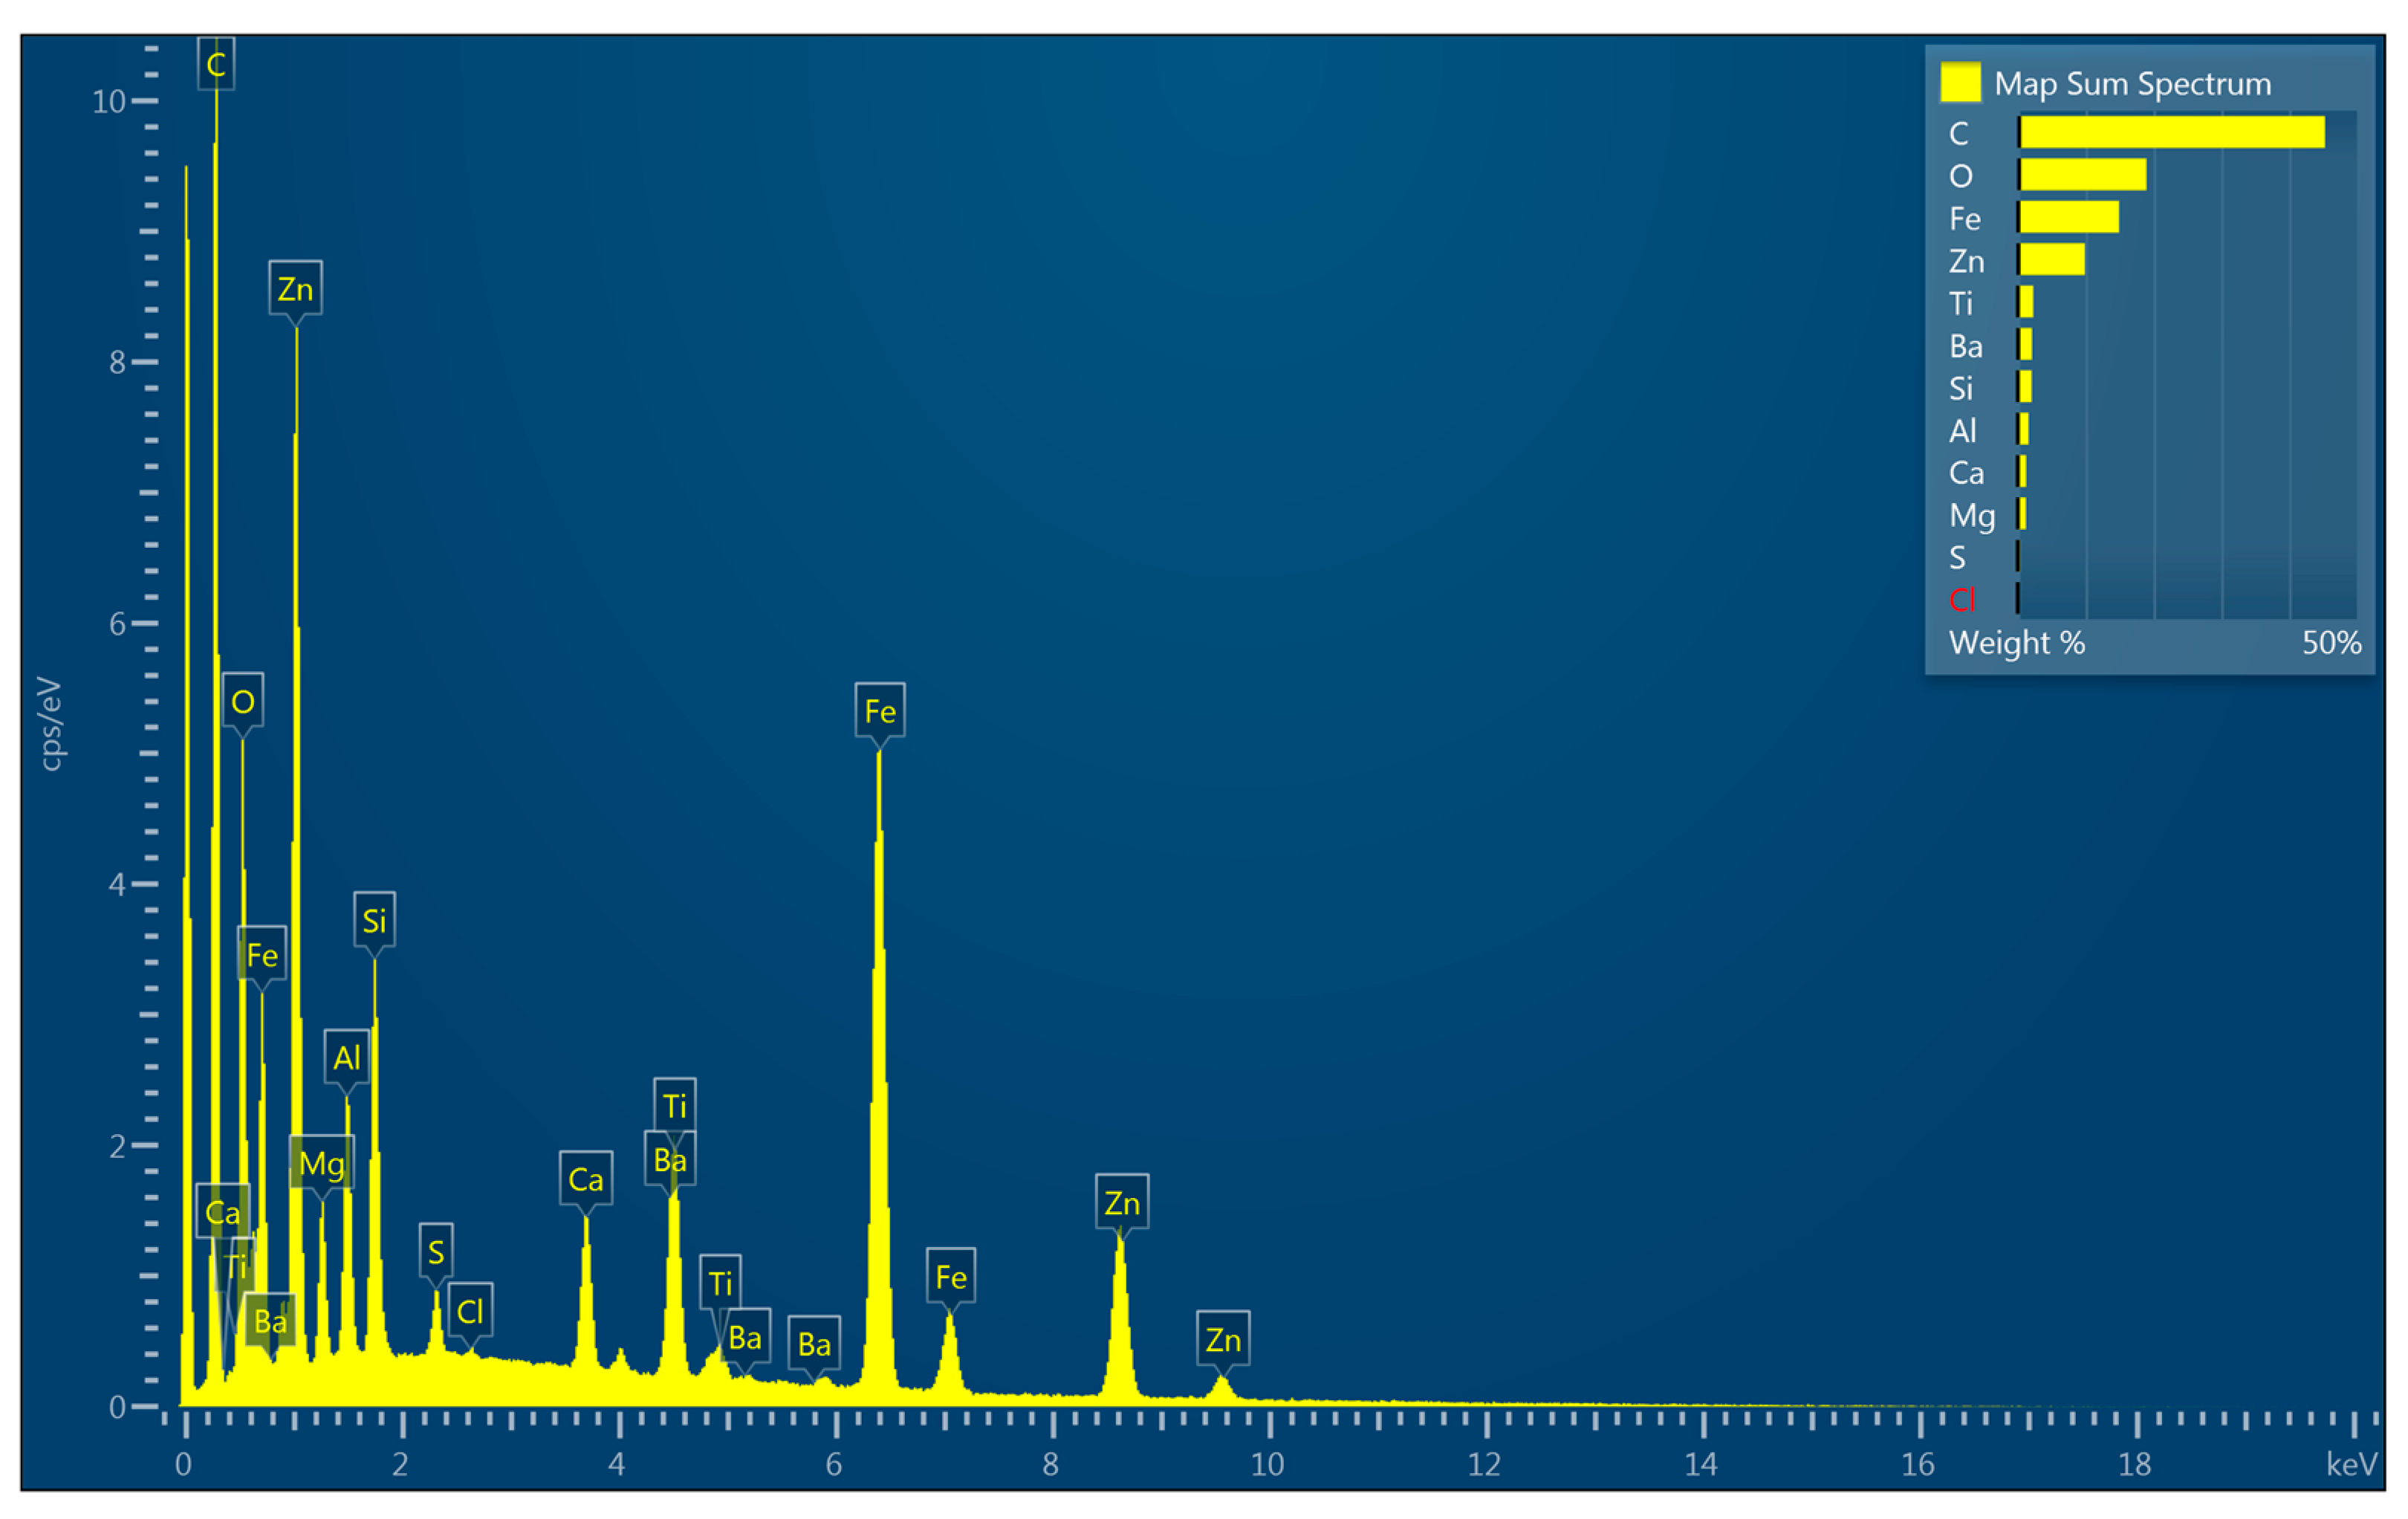
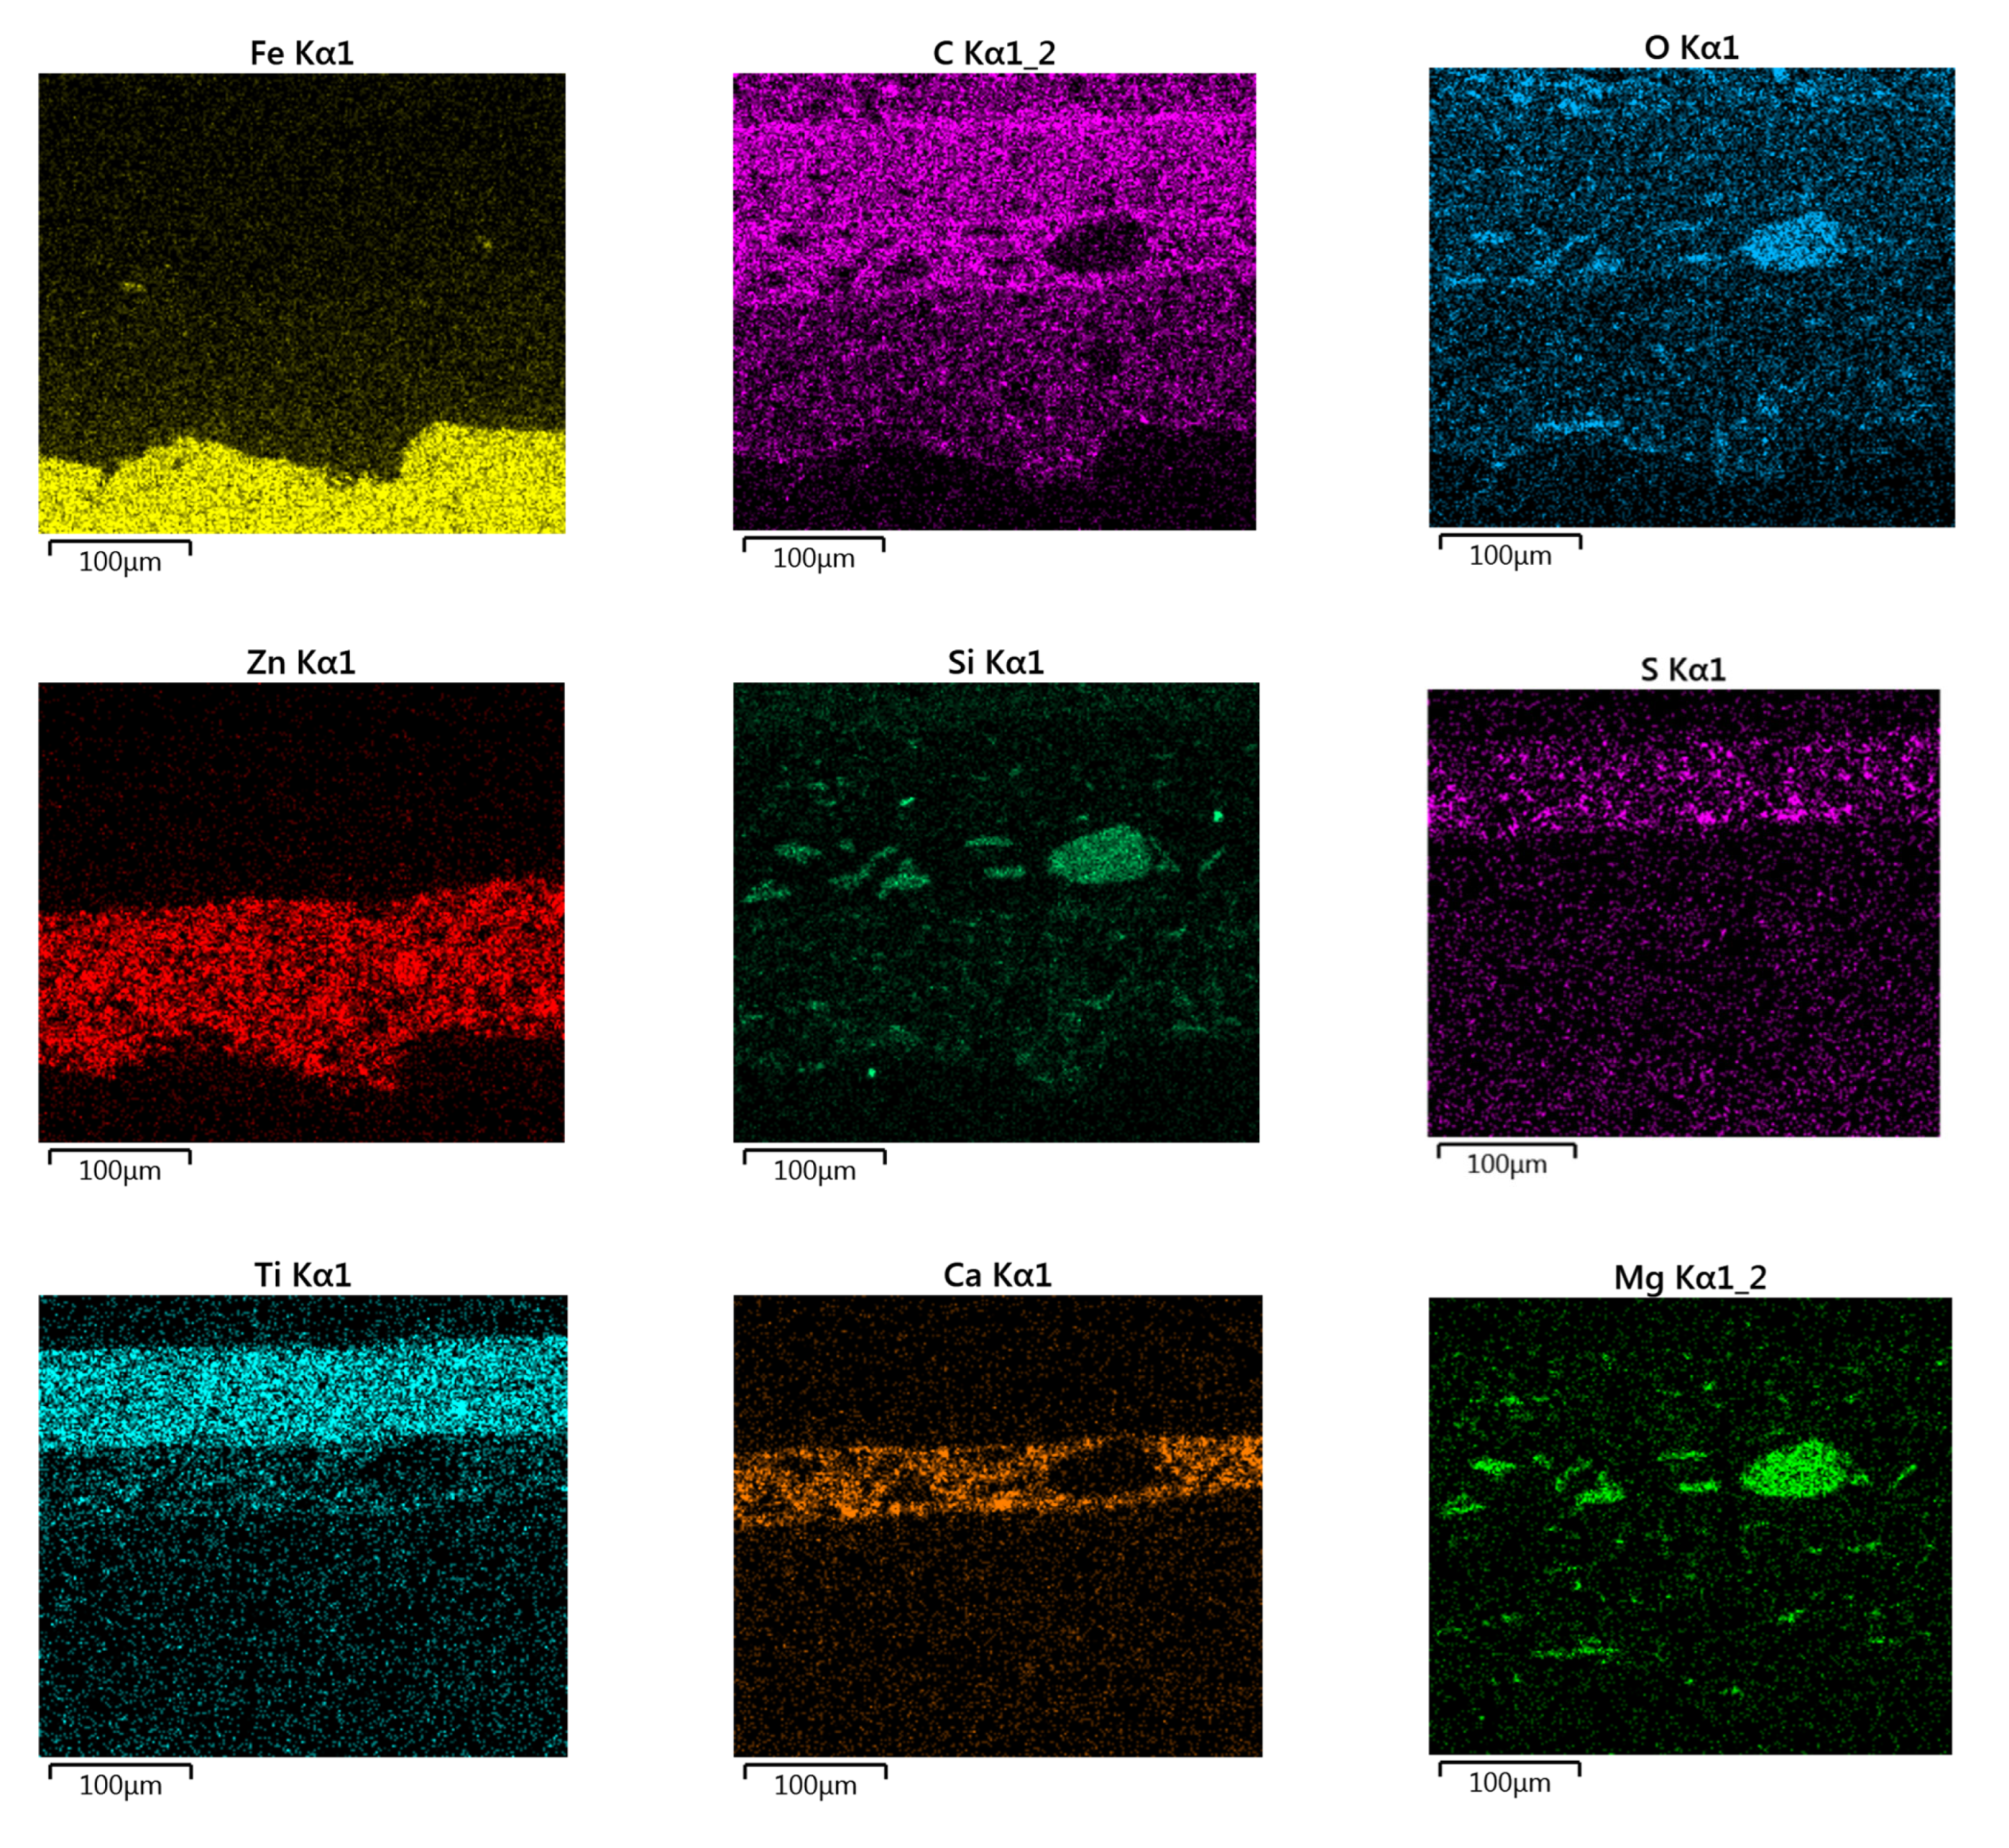
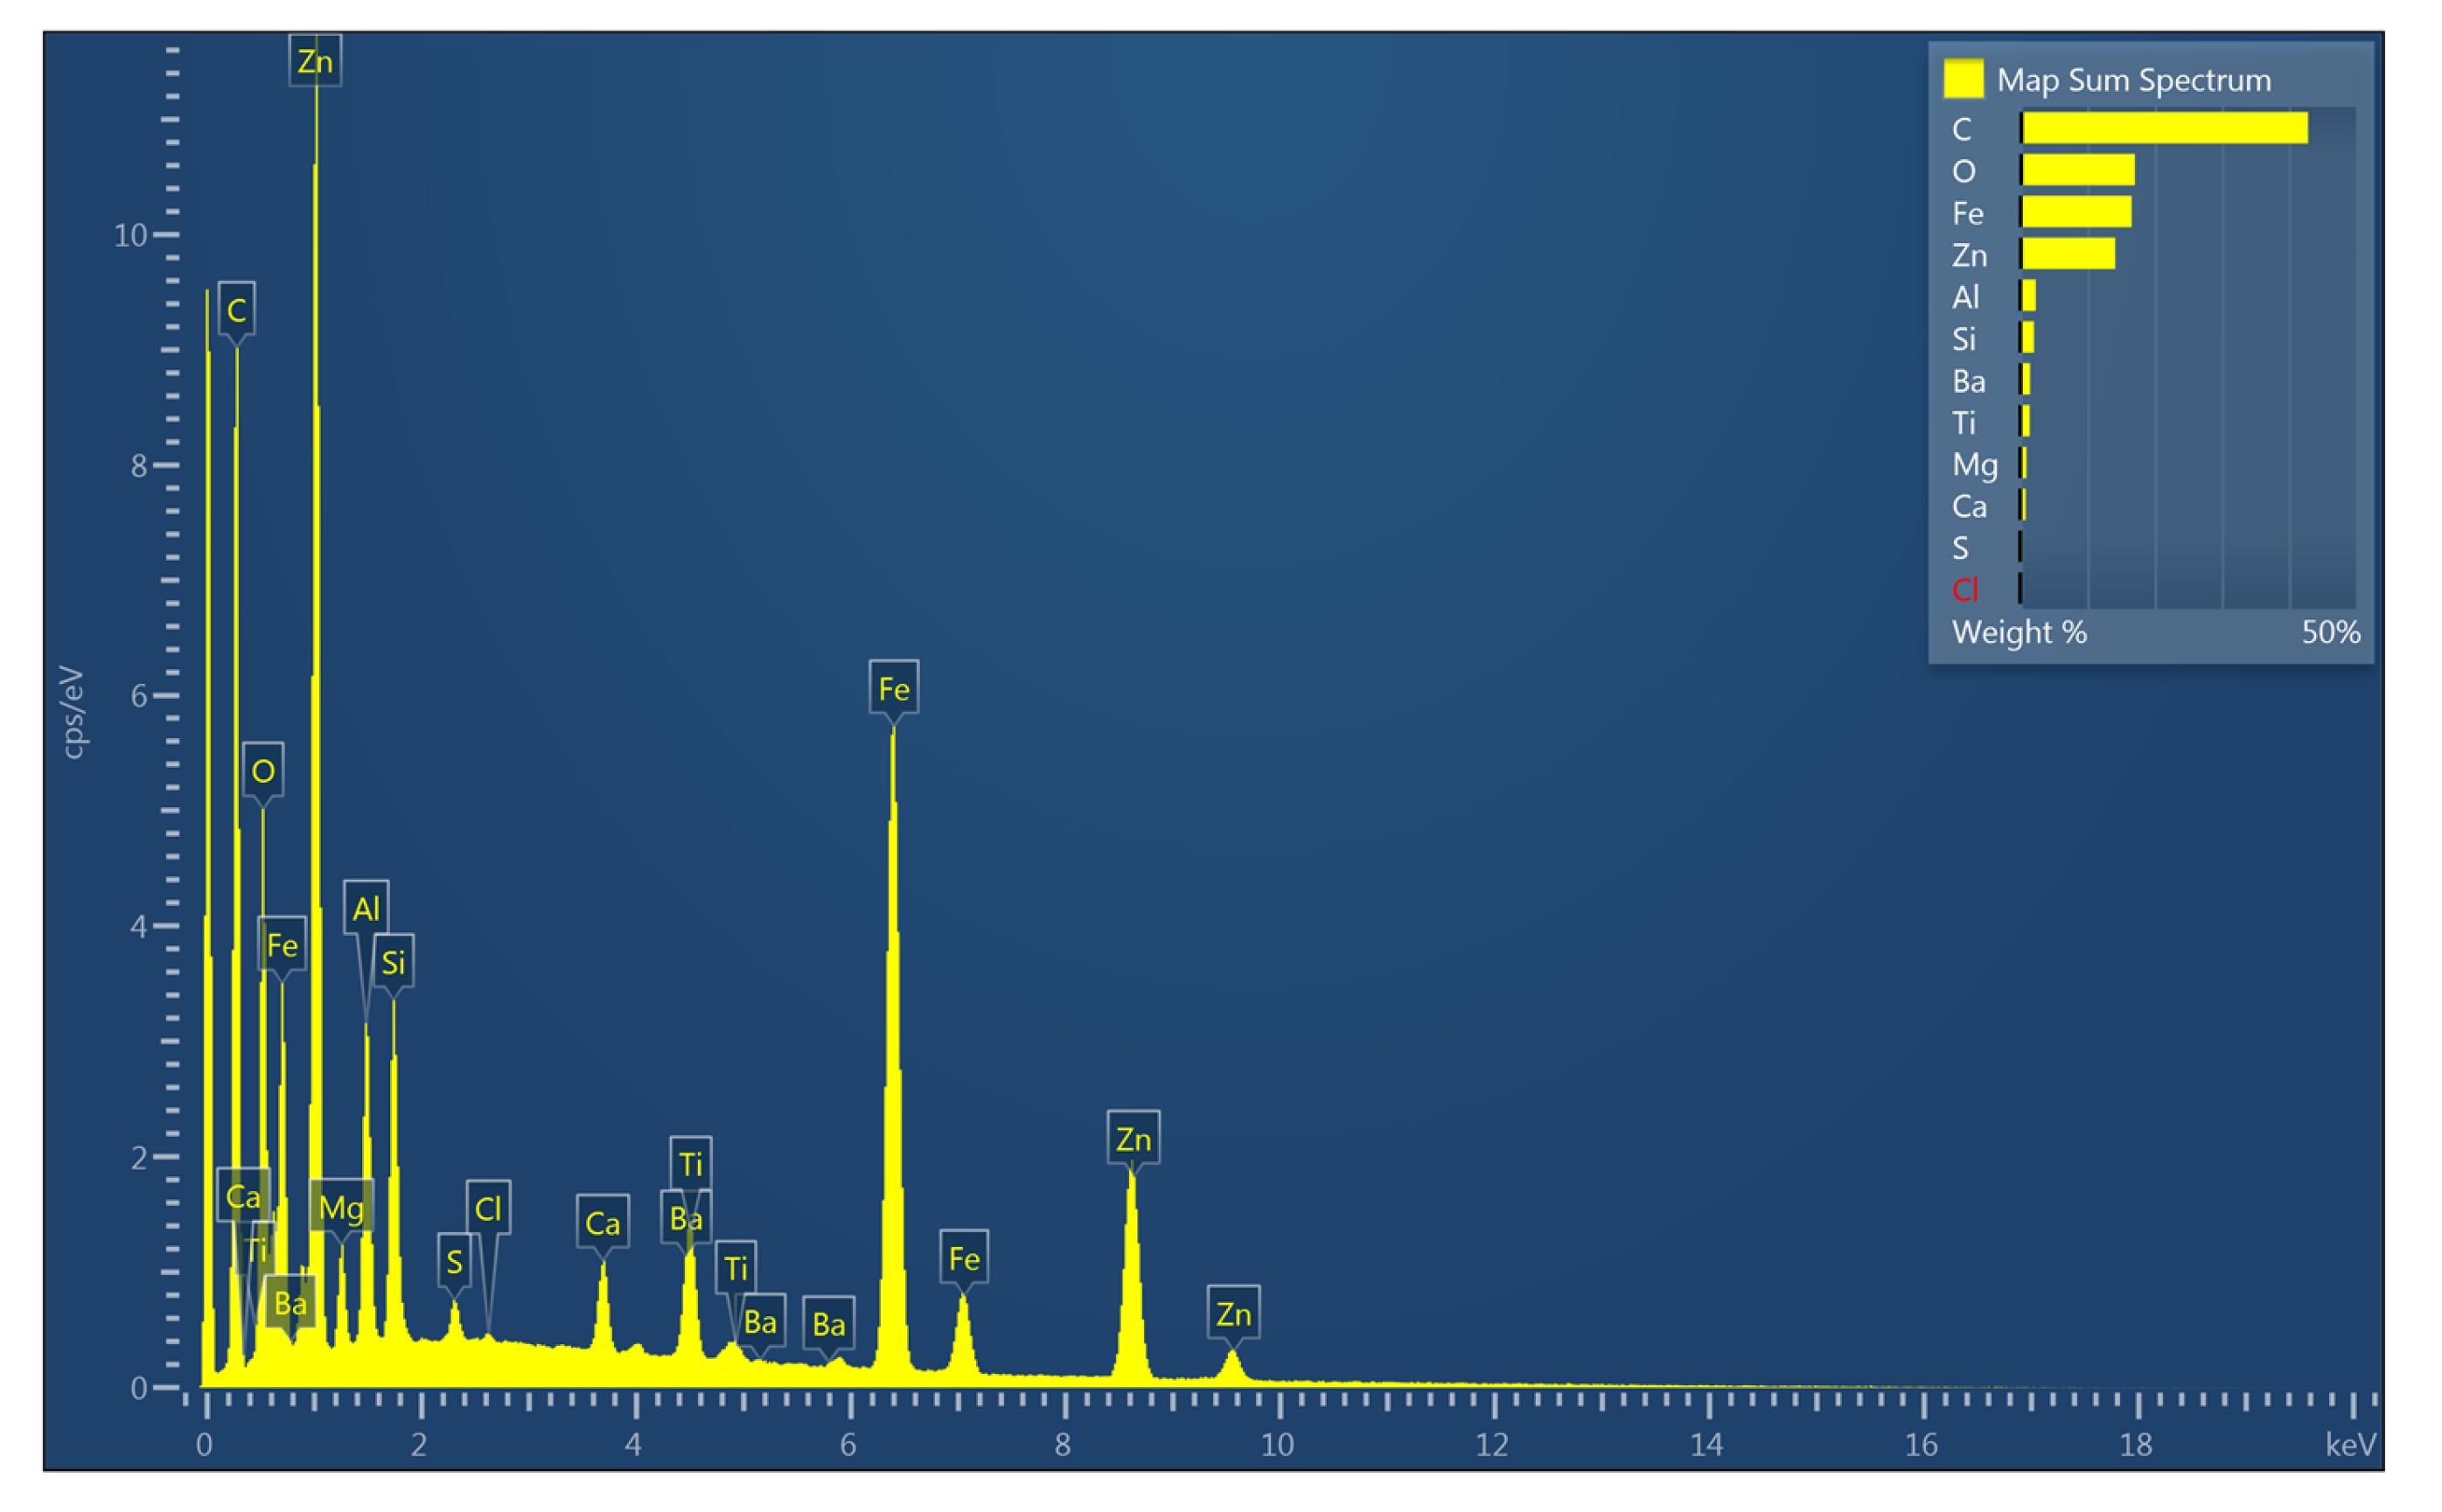
Samples 1.1. and 1.2. were chosen for scanning electron microscope (SEM) with energy-dispersive X-ray spectroscopy to examine the surface morphology, pigment distribution, and chemical composition. The SEM micrograph for Sample 1.1. in Figure 10a shows that Zn-rich primer firmly adheres to the steel substrate and that there is also good adhesion between layers. The elemental mapping by EDX spectroscopy in Figure 10b shows the presence of various elements depending on the coating layer. Further analysis provided in Figure 11 shows that Zn is evenly distributed in the primer, C and O can be found in all layers, and Ti as a pigment is dominant in the topcoat where it gives PUR its specific properties. Mapping of epoxy intermediate shows Ca distribution across all layers, except in Mg-Si-O inclusions.
Sample 1.2. showed similar distribution to Sample 1.1. when mapped by EDX spectroscopy, with elements present in layers as in Sample 1.1. Coating adhesion to the steel substrate is strong with no visible defects. Figure 12 shows SEM micrograph and EDX mapping obtained from Sample 1.2, while Figure 13 displays distribution for each element in the sample done with EDX spectroscopy.

4. Conclusions

Since there is a small number of studies on catalytic IR curing technology, this research will provide a foundation for future studies. The following conclusions can be drawn from the experimental results:
  • Catalytic IR curing technology drastically reduces the intercoating interval between layers and speeds up the anti-corrosive protection process.
  • Coatings displayed good adhesion to the steel substrate even after accelerated corrosion test, regardless of the drying method.
  • Morphology analysis showed both drying methods provide the coatings uniform thicknesses and evenly distributed elements within layers with no defects.
  • The EIS results show that coatings acted as a pure capacitor at the early stages of immersion with very high resistances. Coating capacitance and pore resistance dropped after 10 days of immersion with the formation of a new liquid–metal interface under the coating. Double-layer capacitance was still significantly low for all samples in the observed time, indicating no significant delamination. Bode diagrams showed all coatings had very good resistance even after 500 h of immersion in 3% NaCl, with values exceeding 108 Ωcm2.
Generally, all coatings showed good protective properties and the results of the performed tests did not show a significant difference between differently dried coating systems, IR, or in atmospheric conditions. Catalytic infrared heating/curing technology has so far proven to be a reliable and fast method of drying with no negative effect on coating protection quality.

Author Contributions

L.J. and I.C. performed the experiments, analyzed the data and wrote the paper. I.S. designed the experiments and revised and edited the paper. V.Š. analyzed surface morphology using SEM and EDX spectroscopy. H.F. provided resources and drying experimental setup. All authors have read and agreed to the published version of the manuscript.

Funding

This study is part of the project “Smart plant for drying liquid coatings”, which is co-funded by the Operational Programme Competitiveness and Cohesion from the European Regional Development Fund under reference number KK.01.2.1.02.0030. The content of the published materials is the sole responsibility of the Faculty of Mechanical Engineering and Naval Architecture.

Institutional Review Board Statement

Not applicable.

Informed Consent Statement

Not applicable.

Data Availability Statement

Not applicable.

Conflicts of Interest

The authors declare no conflict of interest.

References

  1. Behzadnasab, M.; Mirabedini, S.M.; Kabiri, K.; Jamali, S. Corrosion performance of epoxy coatings containing silane treated ZrO2 nanoparticles on mild steel in 3.5% NaCl solution. Corros. Sci. 2011, 53, 89–98. [Google Scholar] [CrossRef]
  2. Odio, B.O.; Chinwuko, E.C.; Chukwuneke, J.L.; Sinebe, J.E. Investigation of the Effect Of Corrosion On Mild Steel In Five Different Environments. Int. J. Sci. Technol. Res. 2014, 3, 306–310. [Google Scholar]
  3. López Miguel, A.; Pérez Quiroz, J.T.; Ortega-Borges, R.; Martínez Madrid, M.; Rendón Belmonte, M.; Salgado López, J.M.; Trejo, G.; Meas-Vong, Y. Comparative Study between NiCoB and IrO2-Ta2O5/Ti Anodes for Application in Impressed Current Cathodic Protection (ICCP). Coatings 2020, 10, 199. [Google Scholar] [CrossRef] [Green Version]
  4. Fan, L.; Reis, S.T.; Chen, G.; Koenigstein, M.L. Corrosion Resistance of Pipeline Steel with Damaged Enamel Coating and Cathodic Protection. Coatings 2018, 8, 185. [Google Scholar] [CrossRef] [Green Version]
  5. Alibakhshi, E.; Akbarian, M.; Ramezanzadeh, M.; Ramezanzadeh, B.; Mahdavian, M. Evaluation of the corrosion protection performance of mild steel coated with hybrid sol-gel silane coating in 3.5 wt.% NaCl solution. Prog. Org. Coat. 2018, 123, 190–200. [Google Scholar] [CrossRef]
  6. Yang, Z.; Wang, L.; Sun, W.; Li, S.; Zhu, T.; Liu, W.; Liu, G. Superhydrophobic epoxy coating modified by fluorographene used for anti-corrosion and self-cleaning. Appl. Surf. Sci. 2017, 401, 146–155. [Google Scholar] [CrossRef]
  7. Taghavikish, M.; Dutta, N.K.; Roy Choudhury, N. Emerging Corrosion Inhibitors for Interfacial Coating. Coatings 2017, 7, 217. [Google Scholar] [CrossRef] [Green Version]
  8. Milošev, I.; Frankel, G.S. Review—Conversion Coatings Based on Zirconium and/or Titanium. J. Electrochem. Soc. 2018, 165, C127–C144. [Google Scholar] [CrossRef]
  9. Lyon, S.B.; Bingham, R.; Mills, D.J. Advances in corrosion protection by organic coatings: What we know and what we would like to know. Prog. Org. Coat. 2017, 102, 2–7. [Google Scholar] [CrossRef] [Green Version]
  10. Stojanović, I.; Šimunović, V.; Alar, V.; Kapor, F. Experimental Evaluation of Polyester and Epoxy–Polyester Powder Coatings in Aggressive Media. Coatings 2018, 8, 98. [Google Scholar] [CrossRef] [Green Version]
  11. Olajire, A.A. Recent advances on organic coating system technologies for corrosion protection of offshore metallic structures. J. Mol. Liq. 2018, 269, 572–606. [Google Scholar] [CrossRef]
  12. Faccini, M.; Bautista, L.; Soldi, L.; Escobar, A.M.; Altavilla, M.; Calvet, M.; Domènech, A.; Domínguez, E. Environmentally Friendly Anticorrosive Polymeric Coatings. Appl. Sci. 2021, 11, 3446. [Google Scholar] [CrossRef]
  13. Wang, S.; Yang, J.; Cao, J.; Gao, L.; Yan, C. A Mechanistic Study of Corrosion of Graphene and Low zinc- rich Epoxy Coatings on Carbon Steel in Salt Environment. Int. J. Electrochem. Sci. 2019, 14, 9671–9681. [Google Scholar] [CrossRef]
  14. Xing, C.; Wang, W.; Qu, S.; Tang, Y.; Zhao, X.; Zuo, Y. Degradation of zinc-rich epoxy coating in 3.5% NaCl solution and evolution of its EIS parameters. J. Coat. Technol. Res. 2021, 18, 843–860. [Google Scholar] [CrossRef]
  15. Liu, J.; Wang, F.; Park, K.C. Study on corrosive electrochemical behaviors of zinc-rich and graphite-filled epoxy coatings in 3.5 wt% NaCl solution. Mater. Corros. 2011, 62, 1008–1014. [Google Scholar] [CrossRef]
  16. Schmitz, C.; Strehmel, B. NIR LEDs and NIR lasers as feasible alternatives to replace oven processes for treatment of thermal-responsive coatings. J. Coat. Technol. Res. 2019, 16, 1527–1541. [Google Scholar] [CrossRef]
  17. Putranto, A.; Chen, X.D.; Webley, P.A. Infrared and convective drying of thin layer of polyvinyl alcohol (PVA)/glycerol/water mixture—The reaction engineering approach (REA). Chem. Eng. Process. 2010, 49, 348–357. [Google Scholar] [CrossRef]
  18. ISO 8501-1; Preparation of Steel Substrates before Application of Paints and Related Products—Visual Assessment of Surface Cleanliness—Part 1: Rust Grades and Preparation Grades of Uncoated Steel Substrates and of Steel Substrates after Overall Removal of Previous Coatings. International Organization for Standardization: Geneva, Switzerland, 2007.
  19. ISO 8503-1; Preparation of Steel Substrates before Application of Paints and Related Products—Surface Roughness Characteristics of Blast-Cleaned Steel Substrates—Part 1: Specifications and Definitions for ISO Surface Profile Comparators for the Assessment of Abrasive Blast-Cleaned Surfaces. International Organization for Standardization: Geneva, Switzerland, 2012.
  20. Inone, P.C.; Garcia, C.M.; Rúvolo-Filho, A. Evaluating barrier properties of organic coatings by water permeation and electrochemical methods. J. Coat. Technol. 2003, 75, 29–36. [Google Scholar] [CrossRef]
  21. ISO 2808; Paints and Varnishes—Determination of Film Thickness. International Organization for Standardization: Geneva, Switzerland, 2019.
  22. ISO 4624; Paints and Varnishes—Pull-Off Test for Adhesion. International Organization for Standardization: Geneva, Switzerland, 2016.
  23. Šoić, I.; Martinez, S.; Dubravić, M. Gel-Electrolyte EIS setup used for probing of IR Dried/Cured industrial coatings. Prog. Org. Coat. 2019, 137, 105331. [Google Scholar] [CrossRef]
  24. ISO 9227; Corrosion Tests in Artificial Atmospheres—Salt Spray Tests. International Organization for Standardization: Geneva, Switzerland, 2017.
  25. ISO 4628; Paints and Varnishes—Evaluation of Degradation of Coatings—Designation of Quantity and Size of Defects, and Intensity of Uniform Changes in Appearance. International Organization for Standardization: Geneva, Switzerland, 2016.
  26. Cottis, R.A. 2.30—Electrochemical methods. Shreir’s Corros. 2010, 2, 1341–1373. [Google Scholar]
  27. ISO 12944-5; Paints and Varnishes—Corrosion Protection of Steel Structures by Protective Paint Systems—Part 5: Protective Paint Systems. International Organization for Standardization: Geneva, Switzerland, 2019.
  28. Chaudhari, S.; Sainkar, S.R.; Patil, P.P. Poly(o-ethylaniline) coatings for stainless steel protection. Prog. Org. Coat. 2007, 58, 54–63. [Google Scholar] [CrossRef]
  29. Vida, T.A.; Freitas, E.S.; Cheung, N.; Garcia, A.; Osorió, W.R. Electrochemical Corrosion Behavior of as-cast Zn-rich Zn-Mg Alloys in a 0.06M NaCl Solution. Int. J. Electrochem. Sci. 2017, 12, 5264–5283. [Google Scholar] [CrossRef]
  30. Meyer, Y.A.; Bonatti, R.S.; Bortolozo, A.D.; Osorió, W.R. Electrochemical behavior and compressive strength of Al-Cu/xCu composites in NaCl solution. J. Solid State Electrochem. 2021, 25, 1303–1317. [Google Scholar] [CrossRef]
  31. Snoke, J. Qualification of Protective Coatings using EIS. In Proceedings of the Proceedings Eurocorr 2008, Edinburgh, UK, 7–11 September 2008. [Google Scholar]
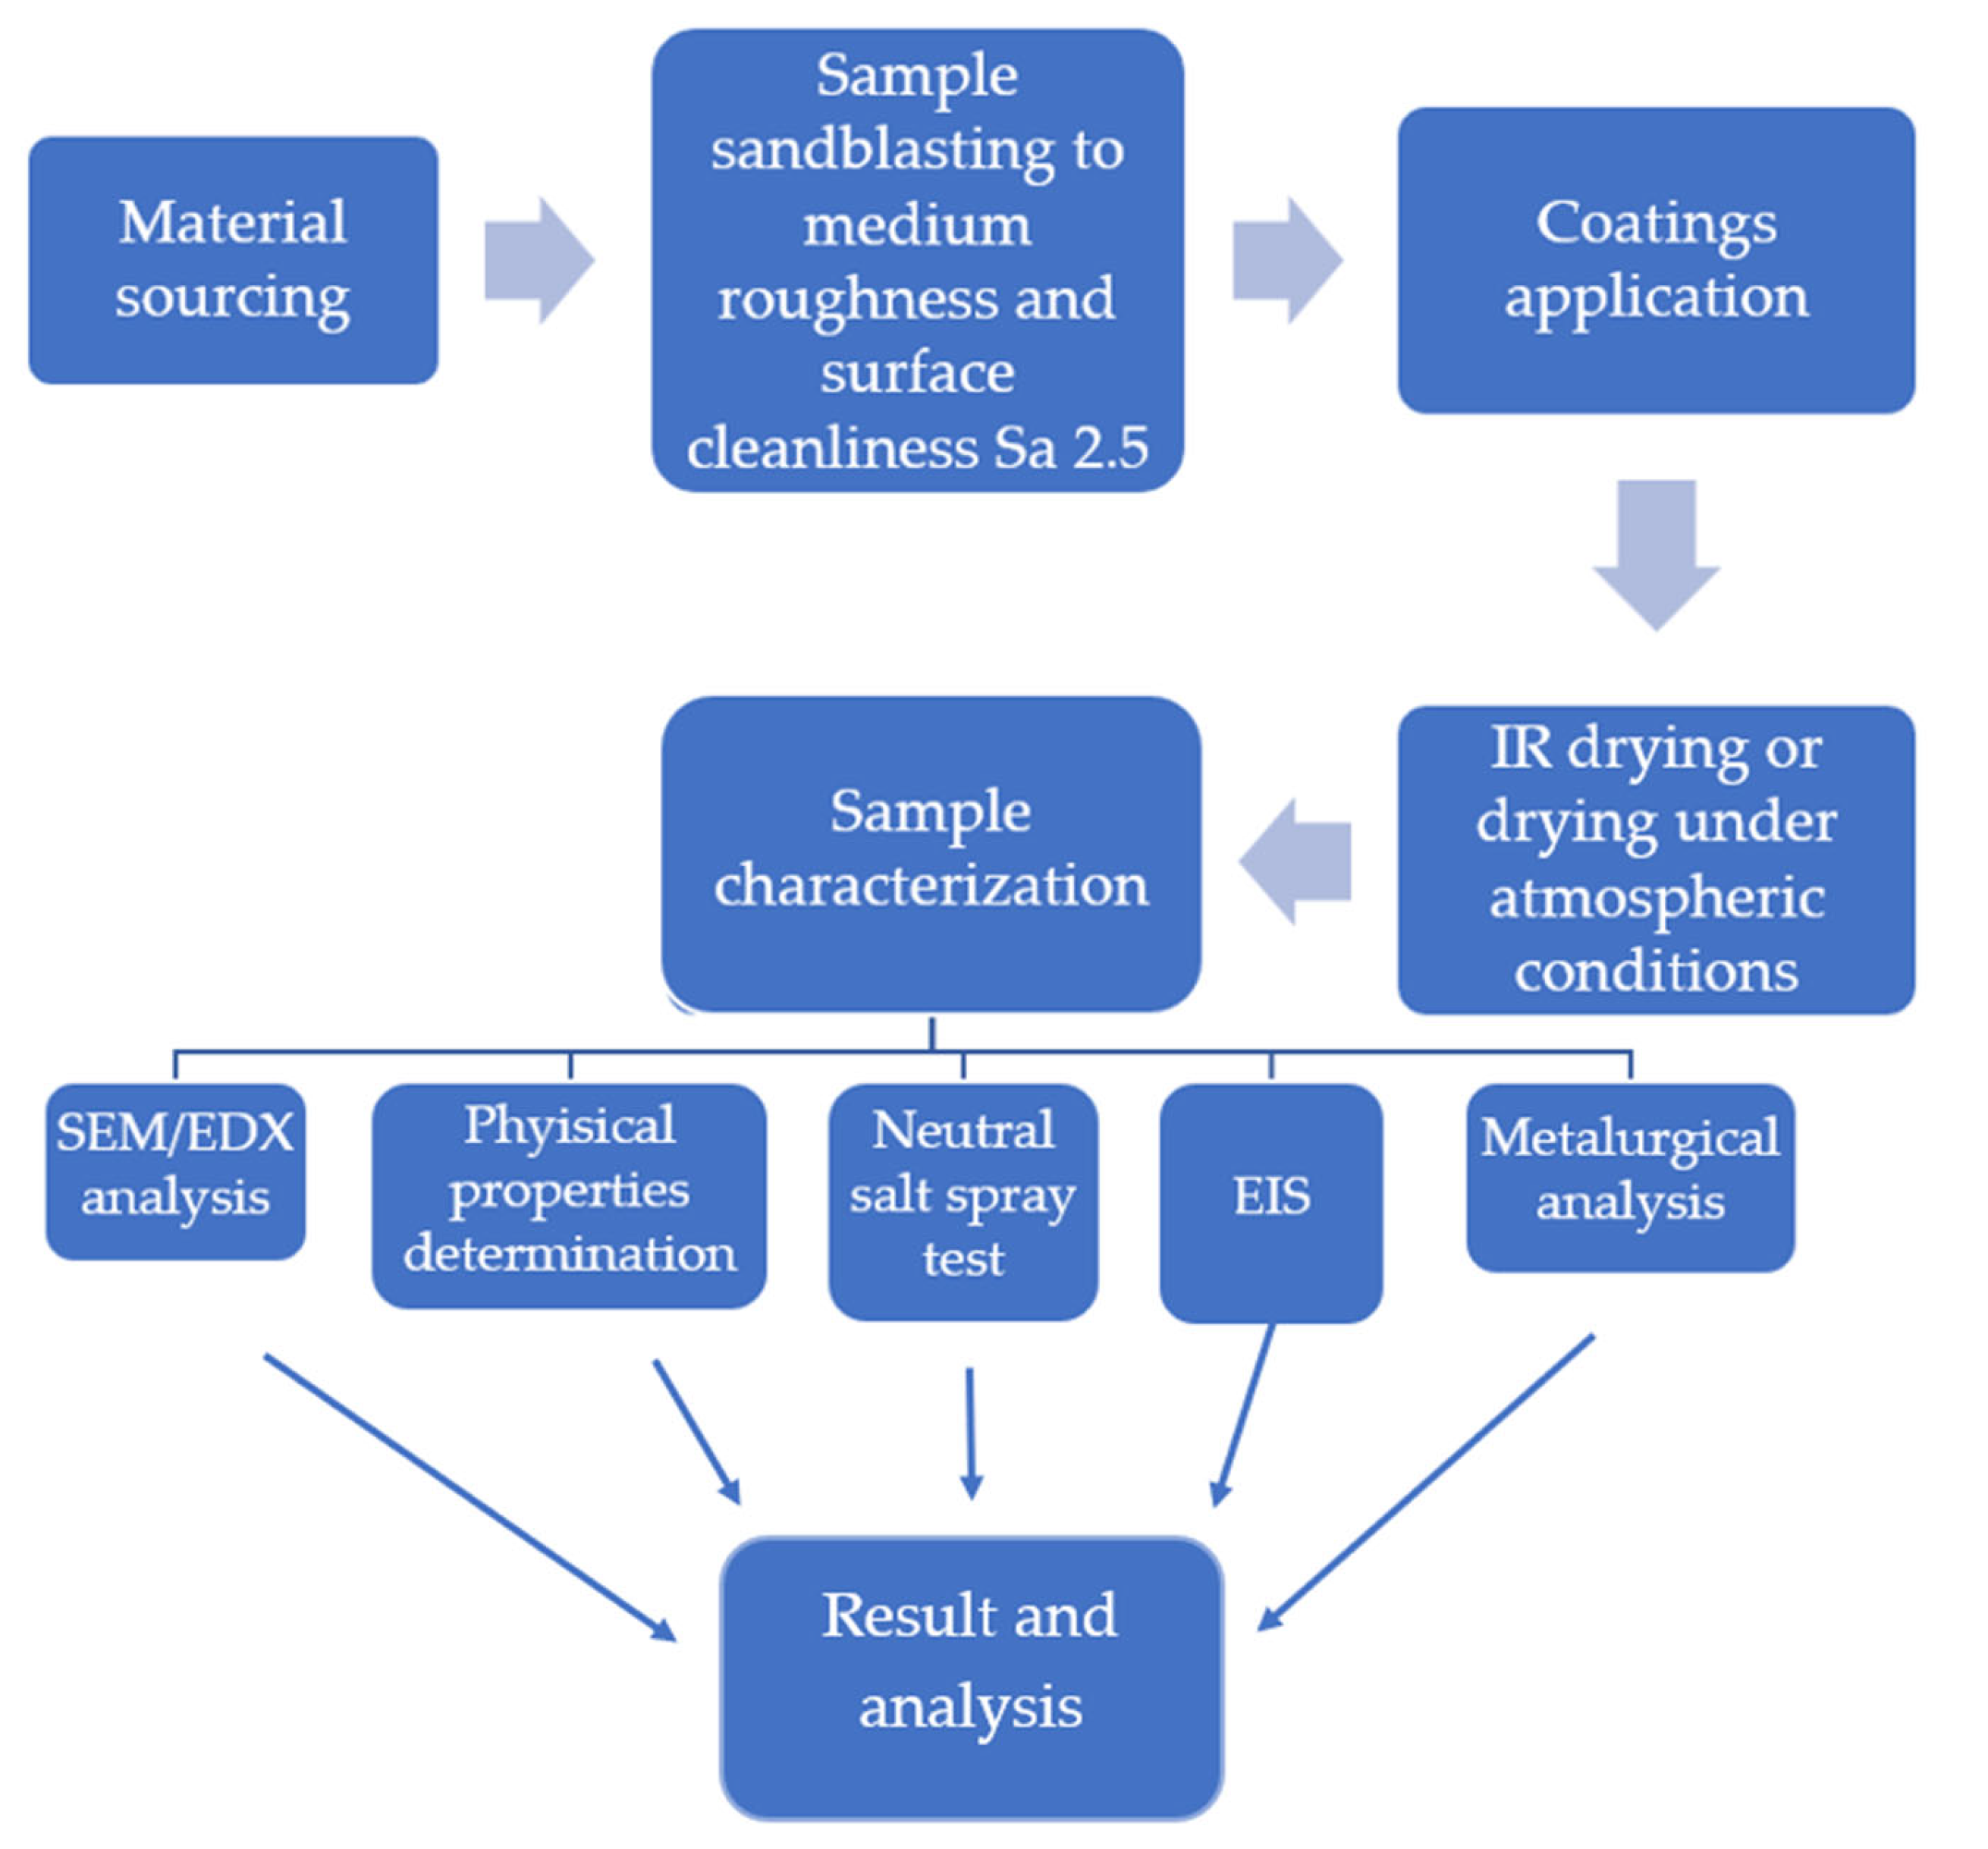
Figure 1. Flow chart of the procedures and methods used in this paper.
Coatings 12 00331 g001
Figure 2. Total drying times of IR-dried coating systems.
Coatings 12 00331 g002
Figure 3. Equivalent electrical circuits for the coatings at different immersion times [14].
Coatings 12 00331 g003
Figure 4. Nyquist plots of each sample with CNLS simulated and experimental results after 500 h immersion time in 3% NaCl solution.
Coatings 12 00331 g004
Figure 5. Bode plot with average values after 24 h in 3% NaCl solution.
Coatings 12 00331 g005
Figure 6. Bode plot with average values after 250 h in 3% NaCl solution.
Coatings 12 00331 g006
Figure 7. Bode plot with average values after 500 h in 3% NaCl solution.
Coatings 12 00331 g007
Figure 8. Average coating resistances of samples at 0.1 Hz for different immersion times.
Coatings 12 00331 g008
Figure 9. Analyzed samples by Olympus GX51 (Olympus Corporation, Tokyo, Japan) inverted metallurgical microscope, 100× magnification.
Coatings 12 00331 g009
Figure 10. The SEM micrograph and EDX mapping obtained from Sample 1.1.: (a) no visible cracks and pores, good coating adhesion to the substrate, (b) Zn dominant and evenly distributed in the primer, intermediate layer display Ca with Mg-Si-O inclusions, Ti pigment dominant in the topcoat.
Coatings 12 00331 g010
Figure 11. Elemental mapping by EDX spectroscopy for Sample 1.1. with distribution for each element.
Coatings 12 00331 g011aCoatings 12 00331 g011b
Figure 12. The SEM micrograph and EDX mapping obtained from Sample 1.2: (a) no visible defects, coating adhere good to the substrate, (b) Zn is evenly distributed in the primer, intermediate layer demonstrates Ca distribution with Mg-Si-O inclusions, Ti pigment dominant in the topcoat.
Coatings 12 00331 g012
Figure 13. Distribution for each element within Sample 1.2. done by EDX spectroscopy.
Coatings 12 00331 g013aCoatings 12 00331 g013b
Table 1. Manufacturer A (CHING).
CoatingGlossSolids by Volume
[Vol. %]
Recommended Thickness
[µm]
Minimum Overcoating Interval at 20 °C
Primer: Zn (R)Mat51 ± 370–806–8 h
Primer: EpoxyMat5960–1006–8 h
Intermediate: EpoxyMat73 ± 380–1402 h
Topcoat: PolyurethaneMat64 ± 380–1005 h
Table 2. Manufacturer B (Hempel).
CoatingGlossSolids by Volume
[Vol. %]
Recommended Thickness
[µm]
Minimum Overcoating Interval at 20 °C
Primer: Zn (R)Mat65 ± 240–10045 min
Primer/Intermediate: EpoxyMat85 ± 2100–2503 h
Topcoat: PolyurethaneGlossy67 ± 250–1256 h
Table 3. Steel samples with respect to the drying method, manufacturer, and primer type.
ManufacturerSampleApplicated Coating Systems
(Primer–Intermediate–Topcoat)
Drying Method
A1.1Zn(R) EP-EP-PURAtm.
1.2Zn(R) EP-EP-PURIR
2.1EP-EP-PURAtm.
2.2EP-EP-PURIR
B3.1Zn(R) EP-EP-PURAtm.
3.2Zn(R) EP-EP-PURIR
4.1EP-EP–PURAtm.
4.2EP-EP-PURIR
Table 4. Evaluation of coating protection properties after 720 h in the salt spray chamber.
SamplesDFTmeanσDFTRustingCrackingFlakingBlisteringPull off [MPa]
[µm]ISO 4628-3ISO 4628-4ISO 4628-5ISO 4628-2
1.1256 (±2.5)24.8Ri 00(S0)0(S0)0(S0)8.7 (±0.4)
1.2249 (±2.5)21.3Ri 00(S0)0(S0)0(S0)10.4 (±0.4)
2.1305 (±2.5)11.3Ri 00(S0)0(S0)0(S0)11.4 (±0.4)
2.2286 (±2.5)22.2Ri 00(S0)0(S0)0(S0)9.6 (±0.4)
3.1207 (±2.5)11.8Ri 00(S0)0(S0)0(S0)11.8 (±0.4)
3.2210 (±2.5)11.4Ri 00(S0)0(S0)0(S0)10.7 (±0.4)
4.1248 (±2.5)5.64Ri 00(S0)0(S0)0(S0)9.7 (±0.4)
4.2251 (±2.5)9.11Ri 00(S0)0(S0)0(S0)11.3 (±0.4)
Table 5. The results of the open circuit potential after stabilization in 3% NaCl solution.
SampleDFTmean
[µm]
σDFTEcorr vs. SCE (V)
24 h250 h500 h
1.1248 (±2.5)21.2−0.405−0.408−0.411
1.2244 (±2.5)12.9−0.252−0.250−0.243
2.1272 (±2.5)15.3−0.217−0.149 −0.110
2.2281 (±2.5)24.1−0.115−0.160−0.139
3.1189 (±2.5)2.67−0.230−0.296−0.548
3.2188 (±2.5)5.38+0.889+0.584−0.432
4.1226 (±2.5)4.52−0.235−0.164−0.181
4.2228 (±2.5)7.6−0.352−0.151−0.053
Table 6. Fitted values of equivalent circuit elements (Rs, Rc, Cc) and the corresponding chi-square value (χ2) after 24 h of immersion in 3% NaCl.
SampleRS,
(102 Ωcm2)
ncCC,
(10−10 Fcm2)
RC,
(109 Ωcm2)
χ2
1.1.7.631-9.3091.6225.67 × 10−2
1.2.6.527-9.1071.9475.01 × 10−2
2.1.7.377-6.1131.9054.64 × 10−2
2.2.9.532-5.7782.7066.74 × 10−2
3.1.5.762-7.6892.2597.99 × 10−2
3.2.5.468-6.5972.5134.52 × 10−2
4.1.7.044-7.2142.6079.97 × 10−2
4.2.1.254-8.0963.8627.17 × 10−2
Table 7. Fitted values of equivalent circuit elements (Rs, Rc, Rct, Cc/Qc, and Cdl) and the corresponding chi-square value (χ2) after 500 h of immersion in 3% NaCl.
SampleRS,
(102 Ωcm2)
ncCC/CPEC,
(10−10 Fcm2)
RC,
(105 Ωcm2)
ndlCdl,
(10−10 Fcm2)
Rct,
(109 Ωcm2)
χ2
1.1.4.494-7.3900.504-3.0121.6786.764 × 10−2
1.2.4.186-8.5900.499-3.1311.3774.693 × 10−2
2.1.7.9890.960.1084452-0.1090.8895.169 × 10−2
2.2.8.754-5.4369598-5.4970.906 1.374 × 10⁻²
3.1.0.475-6.7502446-0.1141.1307.98 × 10−2
3.2.3.324-5.9121.535-1.1202.7235.38 × 10−2
4.1.4.9840.96556.1443.105-2.4690.4135.26 × 10−2
4.2.4.807-5.5456423-9.4481.2446.04 × 10−2
Publisher’s Note: MDPI stays neutral with regard to jurisdictional claims in published maps and institutional affiliations.