Abstract
The interlayer bonding strength is an essential property of geogrid-reinforced asphalt. To study the interlayer bonding characteristics of geogrid-reinforced asphalt, direct shear and oblique shear tests were carried out in the laboratory. The direct interlaminar shear strength of geogrid-reinforced asphalt was lower than that of unreinforced asphalt. The oblique shear strength of the carbon–carbon geogrid-reinforced sample was the highest, the unreinforced sample was second, and the carbon–glass geogrid-reinforced sample was the lowest. The stiffness of the geogrid affects the oblique shear strength. The interlayer direct shear strengths of AC-20C asphalt samples were higher than AC-13C asphalt samples. The oblique shear strengths of AC-20C asphalt samples were almost the same as the AC-13C asphalt samples. Normal stress made the double-layered sample tend to behave as a homogeneous granular material. The direct shear strength vs. shear displacement curves showed an area of oscillation, but the oblique shear curves were smooth throughout the process.
1. Introduction
Using a geogrid in asphalt pavement effectively reduces reflection cracks and extends the service life of the pavement [1,2,3]. However, the presence of the geogrid introduces a fragile surface at the points of contact between asphalt layers and the geogrid, which can cause problems such as slips and detachments [4]. It is crucial to study the interlayer shear properties of the geogrid-reinforced asphalt. Interface shear bond tests have been considered a good and effective method to test the interlayer bond characteristics of geogrid-reinforced asphalt [5,6]. In recent years, many scholars have studied the interlayer bond characteristics of reinforced asphalt layers through shear tests.
N.S. Correia et al. [7] evaluated the effect of the binder rate and geogrid characteristics on the bond strength of reinforced asphalt interfaces. Results showed that a stiffer geogrid provided lower interface shear strength and interface shear stiffness. Sagnol et al. [8] pointed out that the shear strength of reinforced specimens was reduced by 40% compared with unreinforced specimens. They also suggested that using a non-woven layer between the geogrid strands is not conducive to interlocking. Pasetto et al. [9] conducted pure shear tests on asphalt reinforced with three innovative composite materials. Results showed that the unreinforced interface exhibited brittle failure with a very high interlayer shear strength. In contrast, the presence of the composite reinforcement led to a sensible reduction of interface shear resistance without physical failure. Sudarsanan et al. [10] studied the effect of temperature on the bond strength of reinforced asphalt and found an increase in strength of 10–15% with a change in temperature from −10 to 10 °C, followed by an 80% reduction in strength up to 30 °C. Walubita et al. [11] evaluated the impact of polyester (FA) and fiberglass (FG) geogrids on the HMA-overlays interlayer bond strength. Their research found HMA samples reinforced with polyester-based geogrids performed better than fiberglass-based, geogrid-reinforced HMA samples. Francesco et al. [12] evaluated interlayer bonding by means of shear tests, pointing out that the presence of a geogrid leads to a peak resistance reduction, whereas the residual (post-peak) interlayer friction is not influenced by reinforcement.
A study of the literature finds that shear tests are mainly plane-direct shear tests. The plane-direct shear test reflects the shear mode of the road surface when a vehicle is driving at a constant peed. However, the vehicle will accelerate or decelerate, including emergency braking on steep slopes. In either situation, oblique shear occurs between asphalt pavement layers. It is pointed out that, when the vehicle is in the most unfavorable state of emergency braking on a downhill section, the ratio of interlayer normal stress to interlayer shear stress is close to 1:1 [13]. At present, there is no general standardized test method to characterize and quantify the interlaminar, oblique shear characteristics of reinforced pavement. Reports of research on interlaminar, oblique shear are few.
In this paper, the oblique shear properties of geogrid-reinforced asphalt layers were studied through an oblique shear test device built in-house to obtain a more comprehensive understanding of geogrid-reinforced asphalt. At the same time, pure direct shear tests were carried out. The difference between direct shear properties and oblique shear properties is considered and analyzed. Also, the internal friction angles of different asphalt samples are calculated. This paper can provide a reference for the application and design of geogrid-reinforced asphalt pavement.
2. Experimental Program
2.1. Geosynthetic Reinforcements
Two types of geogrids for asphalt reinforcement were used in this study. One type of geogrid (CC) had transverse and longitudinal ribs composed of 12K carbon fiber wires; the other geogrid (CG) had transverse ribs made of 12K carbon fiber and longitudinal ribs made of 1100 Tex glass fiber. One manufacturer provided both types of geogrids coated with bitumen. Table 1 shows the physical and mechanical properties of the geogrids used in this study.

Table 1.
Characteristics of CC and CG geogrids.
2.2. Asphalt Mix Design
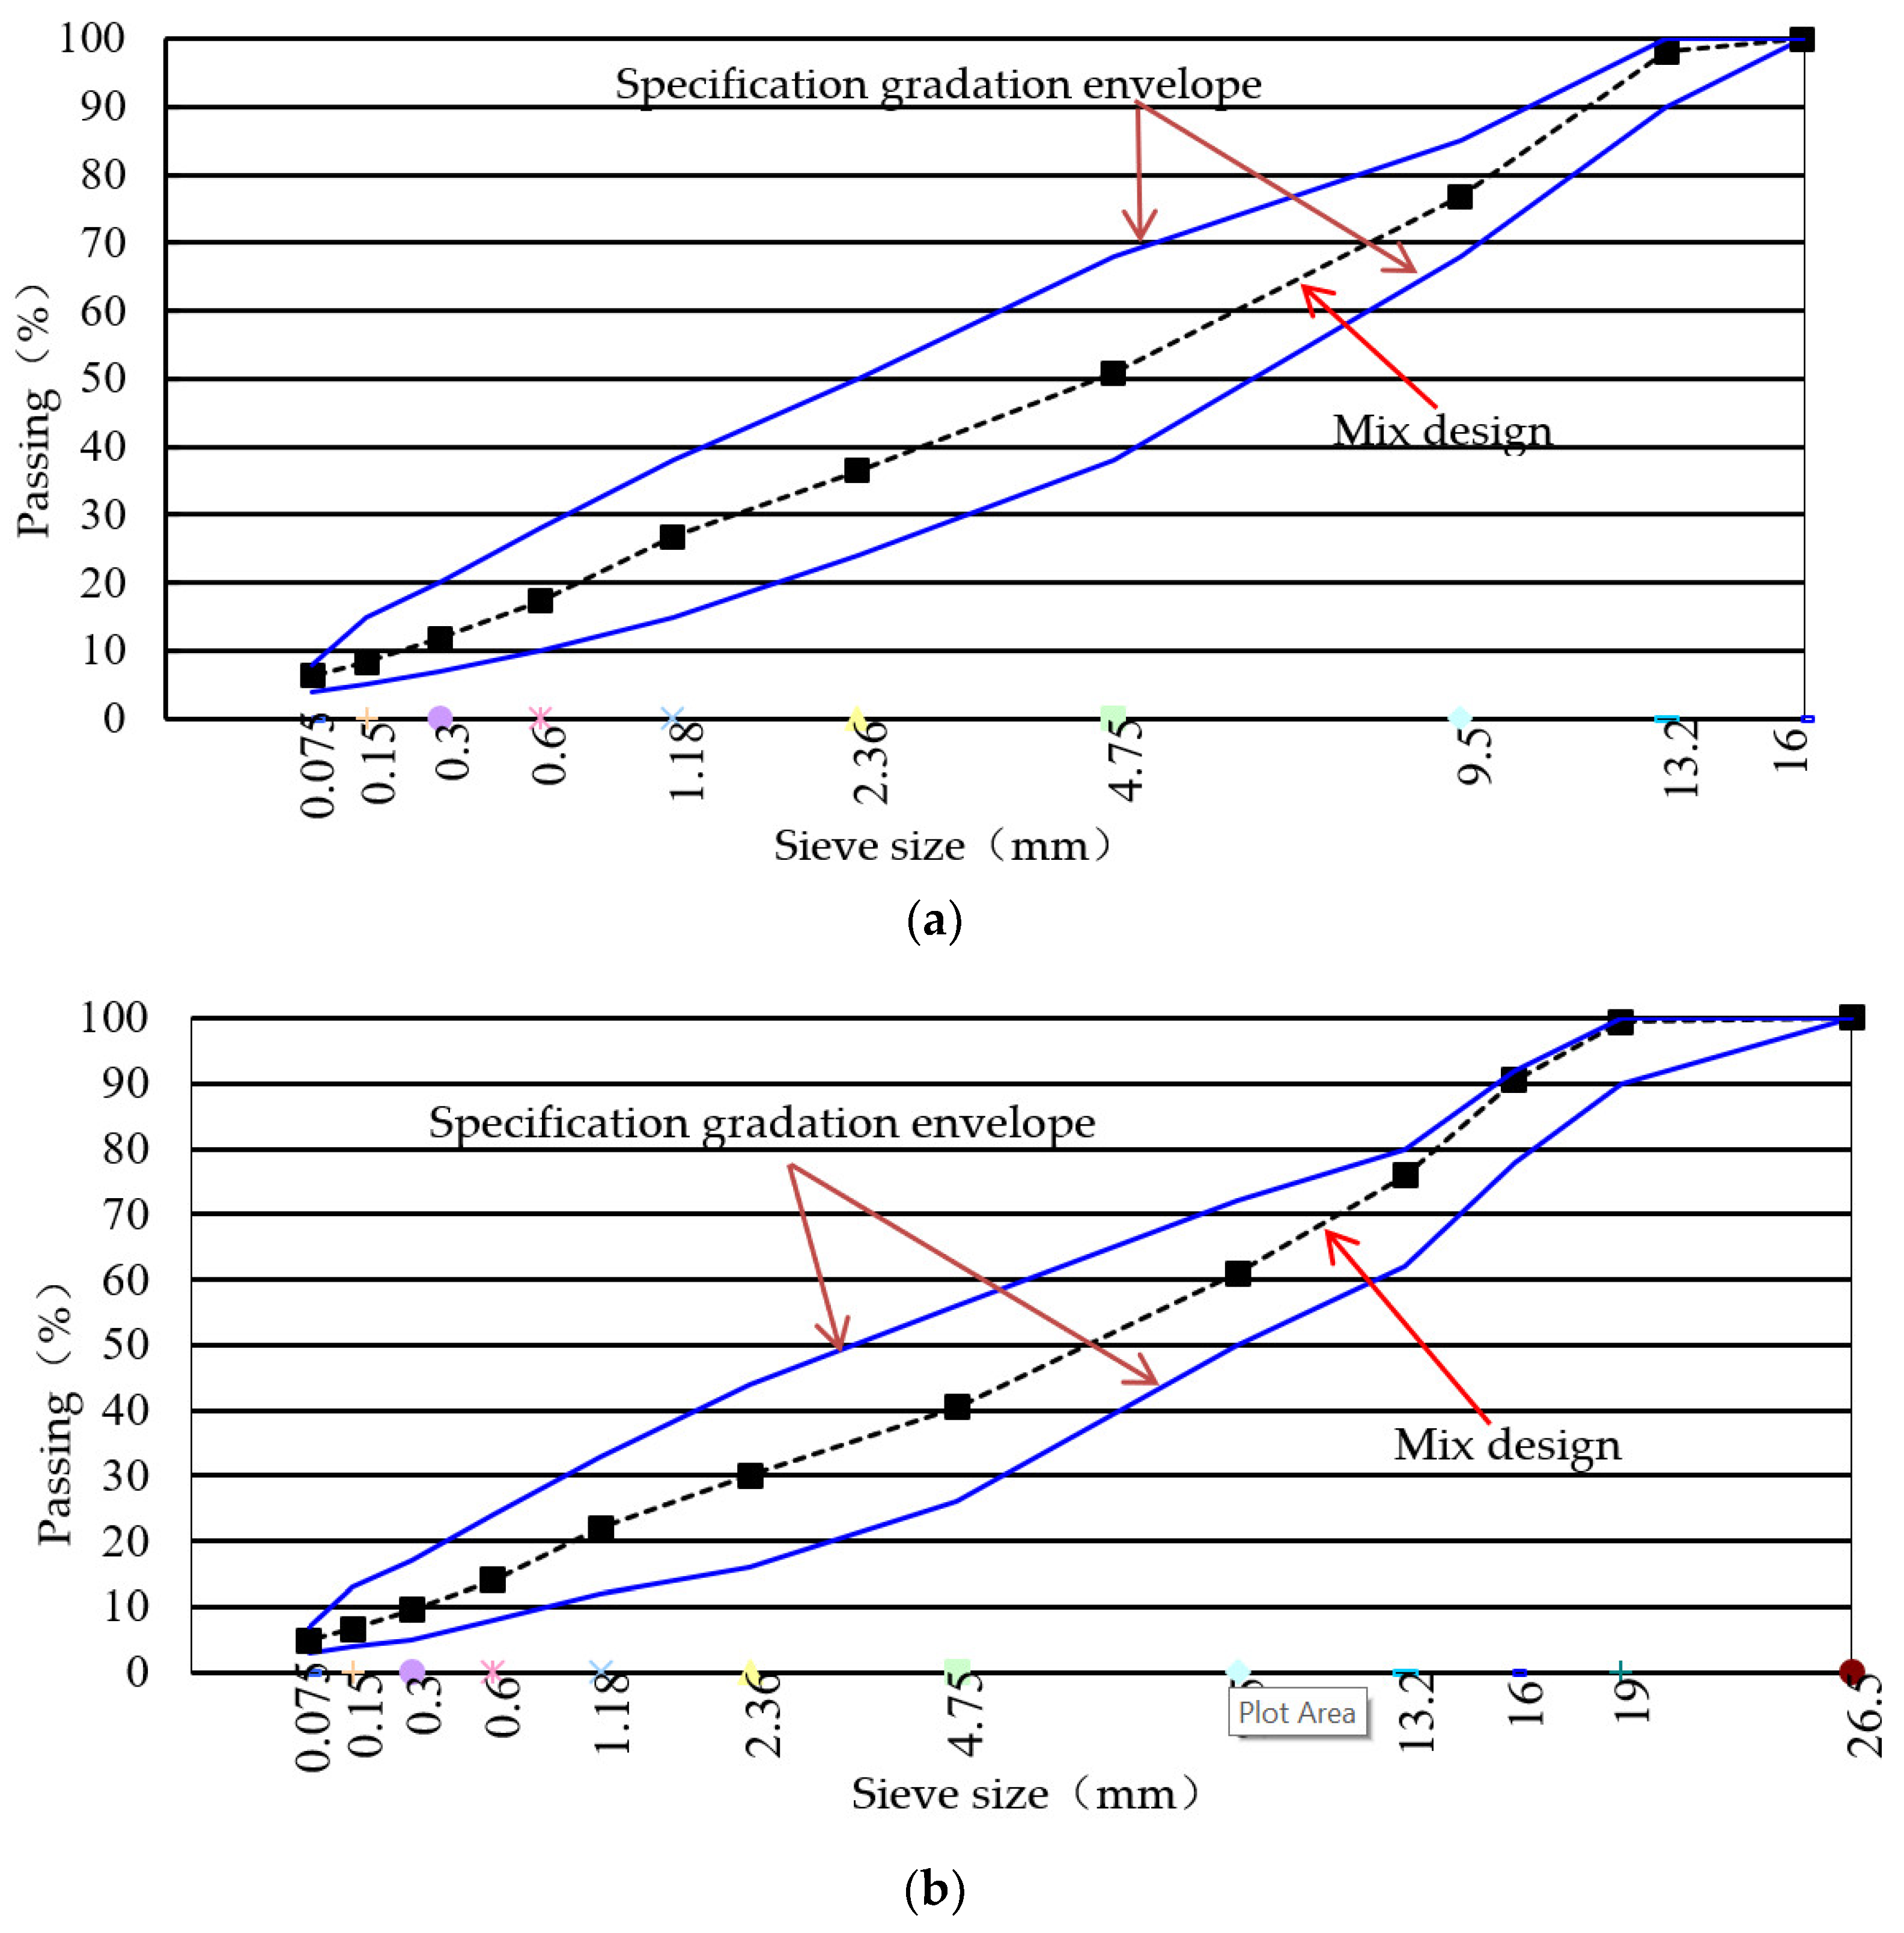
In this study, two types of double-layered hot mix asphalt slab specimens were made in the laboratory. For the first type, the lower and upper layers were both an AC-20C asphalt mixture composed of crushed limestone aggregates (19 mm nominal maximum size) and 4.3% bitumen content by weight. In the second type, the upper layer was an AC-13C asphalt mixture composed of crushed basaltic aggregates (13.2 mm nominal maximum size) and 4.8% bitumen content by weight, and the lower layer was the same as in the first type of asphalt. It is noted that the asphalt mix design was based on current Chinese guidelines (JTGF40-2004). The mix design sieve curve is presented in Figure 1, and bitumen properties are shown in Table 2.
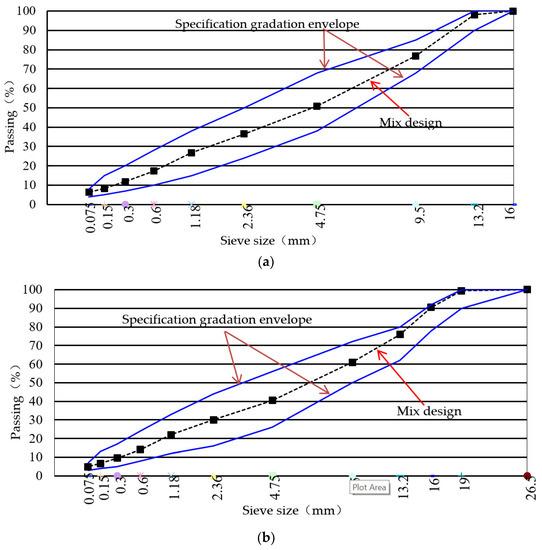
Figure 1.
Curve and specification gradation envelope: (a) AC-13C mix design curve; (b) AC-20C mix design curve.
Table 2.
Properties of bitumen.
2.3. Sample Production
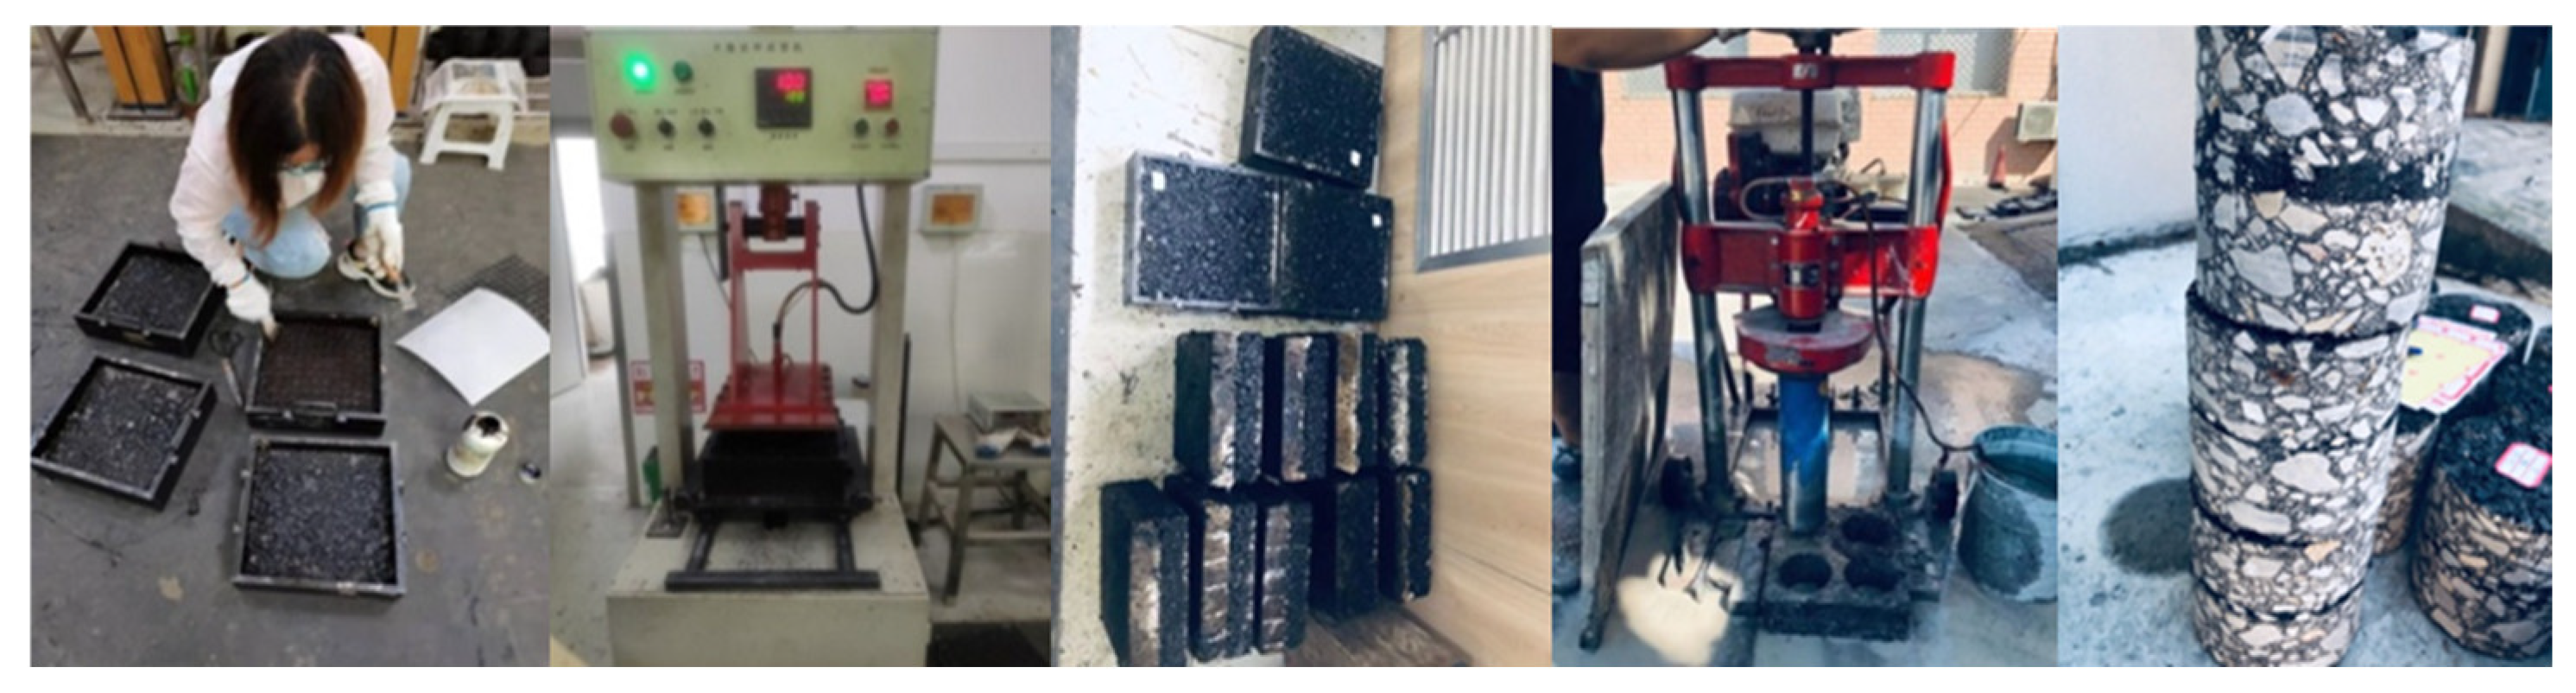
Preparation of the hot-mix asphalt used an automatic mixture device. The homogenous asphalt mixture was placed in a mold (300 mm × 300 mm × 50 mm). Then, compaction was carried out so as to form the bottom slab. When the bottom asphalt slab cooled to approx. 25 °C, a tack coat was applied on the surface using a bristle brush before the installation of the geogrid. After the tack coat break, a second layer of hot-mix asphalt was placed and compacted over the geogrid. During the whole preparation process, the mixing temperature of aggregate was not lower than 170 °C, and the tack coat was be painted at 0.5 L/m2. Four core samples were extracted from the double-layered asphalt slab. Every core sample was 100 mm in diameter and 100 mm thick, with both lower and upper layers being 50 mm thick. The preparation of the test specimen is presented in Figure 2. Tack coat properties are presented in Table 3.

Figure 2.
The preparation of test specimens.
Table 3.
Tack coat properties.
2.4. Interface Shear Tests
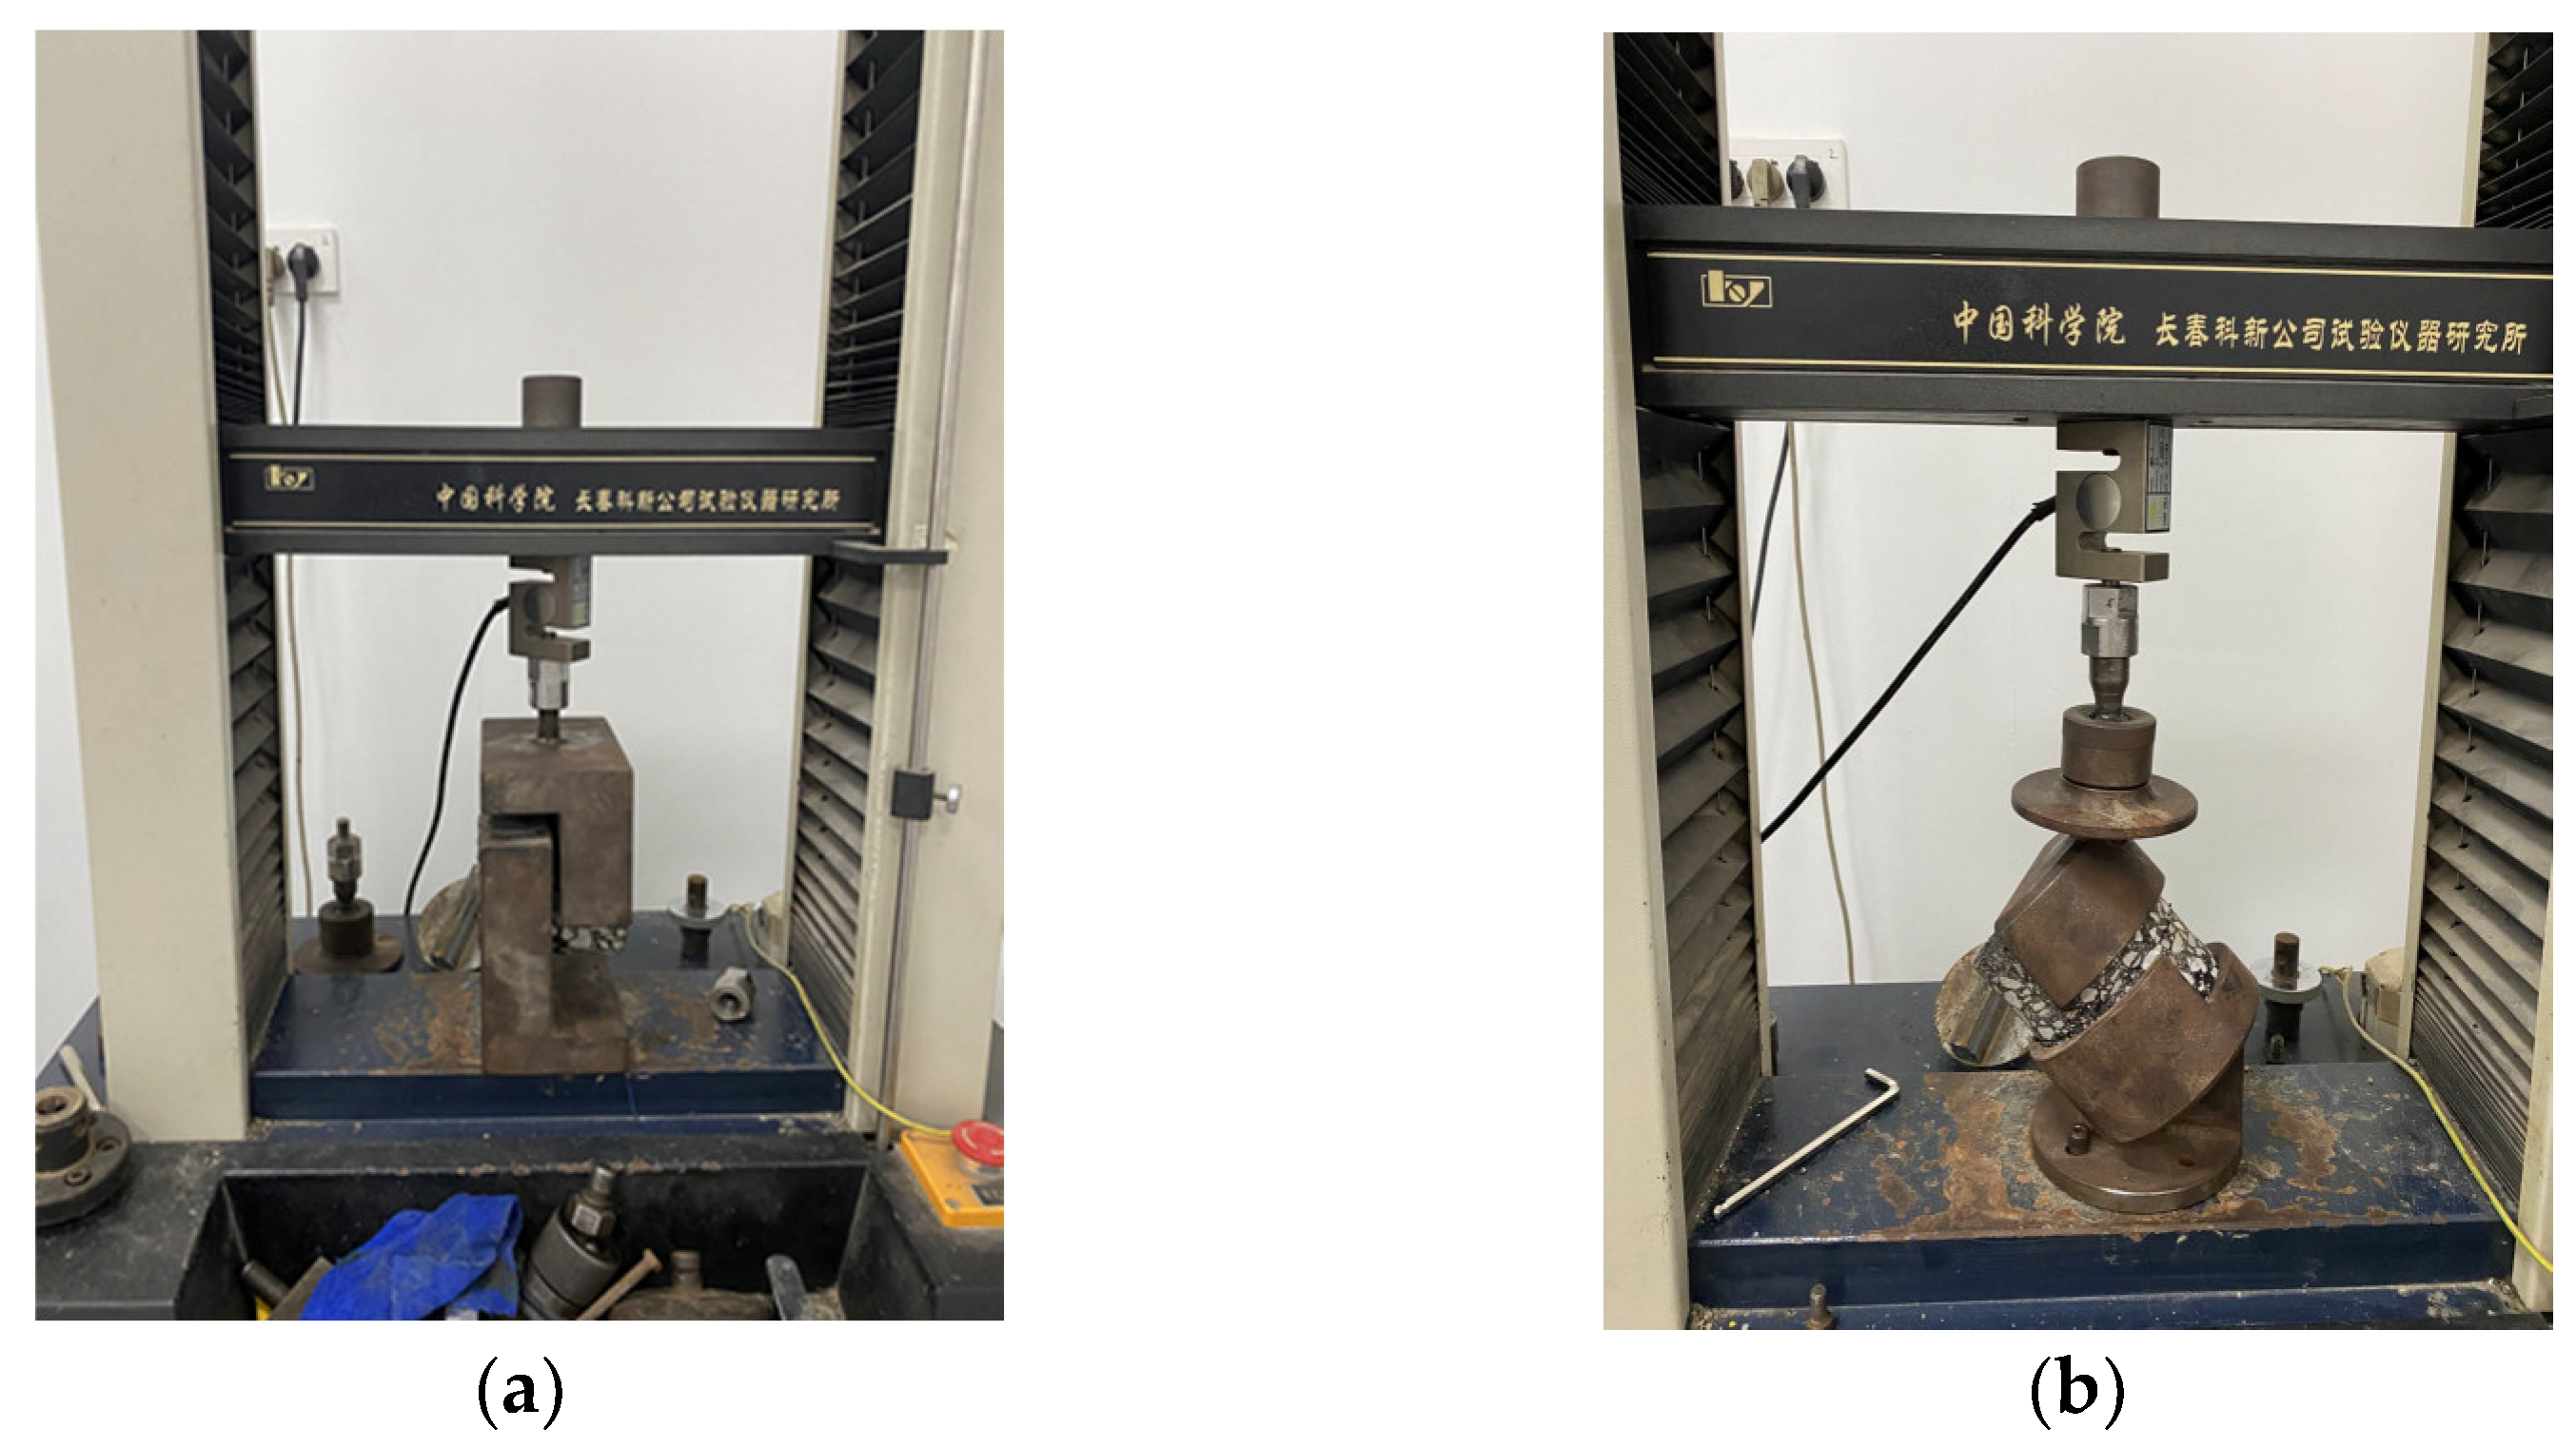
In this study, a constant shear displacement rate of 2.54 mm/min was applied at an ambient temperature of 20 °C for both the direct shear tests and oblique shear tests. This shear displacement rate has been used in many research projects [14,15,16]. Tests were ended when the shear strength reached 60% of the maximum shear strengths. The direct shear and oblique shear apparatus are shown in Figure 3. The direct shear equipment has a gap width of 5 mm, while the oblique shear apparatus has a gap width of 10 mm.
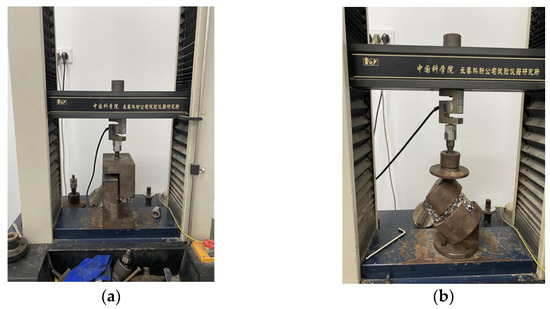
Figure 3.
The direct shear and oblique shear apparatus: (a) the direct shear apparatus; (b) the oblique shear apparatus (Chinese in the figure: Changchun Kexin Company Test Instrument Research Institute, Chinese Academy of Sciences).
3. Results and Analysis
3.1. Interface Direct Shear Strength
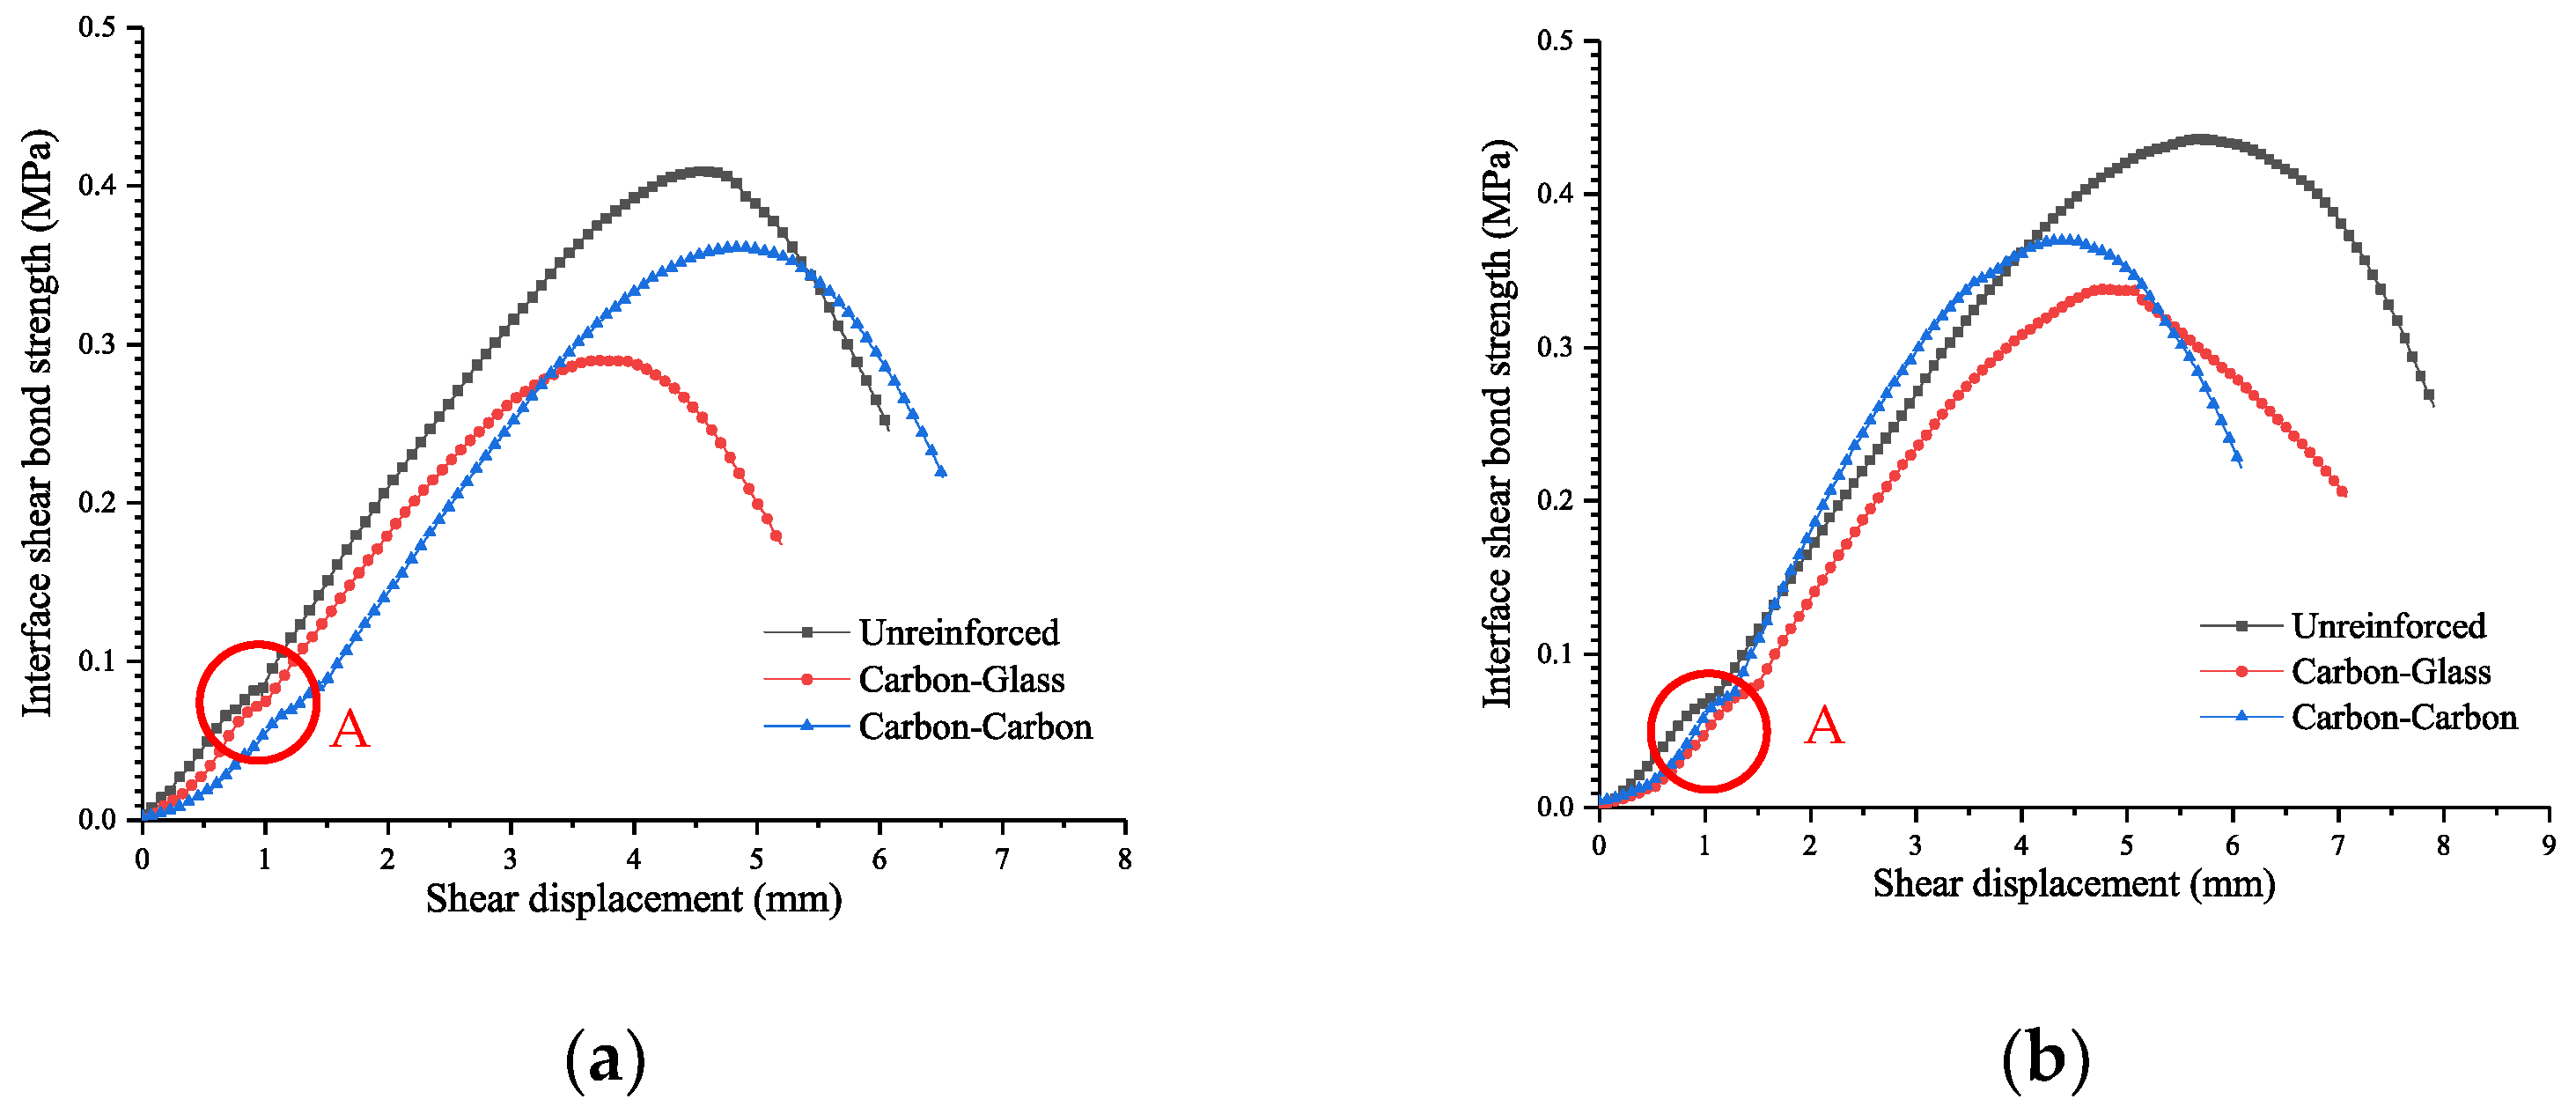
Figure 4 and Figure 5 show the results of the direct shear tests. From Figure 4, it can be seen that the ultimate direct shear strengths of the unreinforced asphalt were 0.436 MPa and 0.409 MPa, corresponding to AC-20C and AC-13C, respectively. The ultimate direct shear strengths of the CG geogrid-reinforced samples were 0.338 MPa and 0.290 MPa, while the CC geogrid-reinforced samples reached 0.369 MPa and 0.361 MPa, corresponding to AC-20C and AC-13C, respectively. The ultimate direct shear strengths of the geogrid-reinforced samples were lower compared with the unreinforced samples. This is in accordance with previous investigations [8,9,11,12] carried out with various experimental devices. The ultimate interface direct shear strengths of CC geogrid-reinforced samples were higher than the CG geogrid-reinforced samples. It is considered that the difference was caused by the stiffness of longitudinal ribs. Comparing the AC-20C and AC-13C asphalt samples, it can be found that the interlayer direct shear strengths of AC-20C asphalt samples were higher than AC-13C asphalt samples. The reason may be the maximum aggregate size in the AC-20C was larger than in the AC-13C.
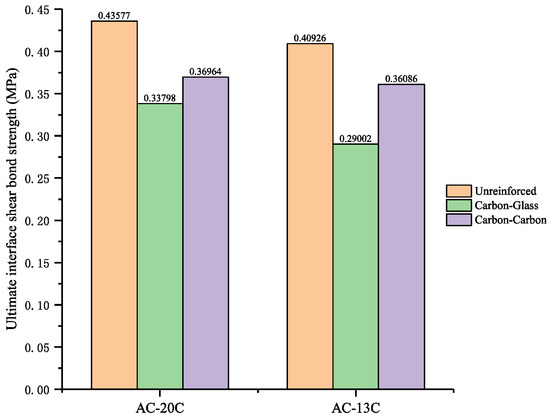
Figure 4.
The results of the direct shear tests.
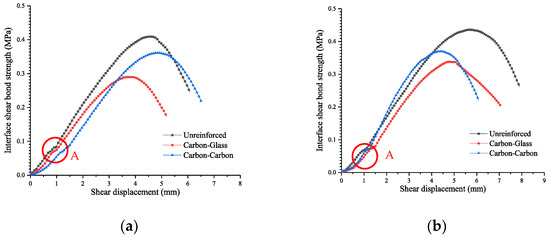
Figure 5.
Interface shear strength vs. shear displacement curves in direct shear experiment. (a) AC-13C and (b) AC-20C.
The shear strength vs. shear displacement curves are shown in Figure 5. The trends of the six curves are similar. This indicates that the interlayer bonding properties of the asphalt do not change when a geogrid is added; the changes occur in the interlayer bonding strength.
3.2. Interface Oblique Shear Strength
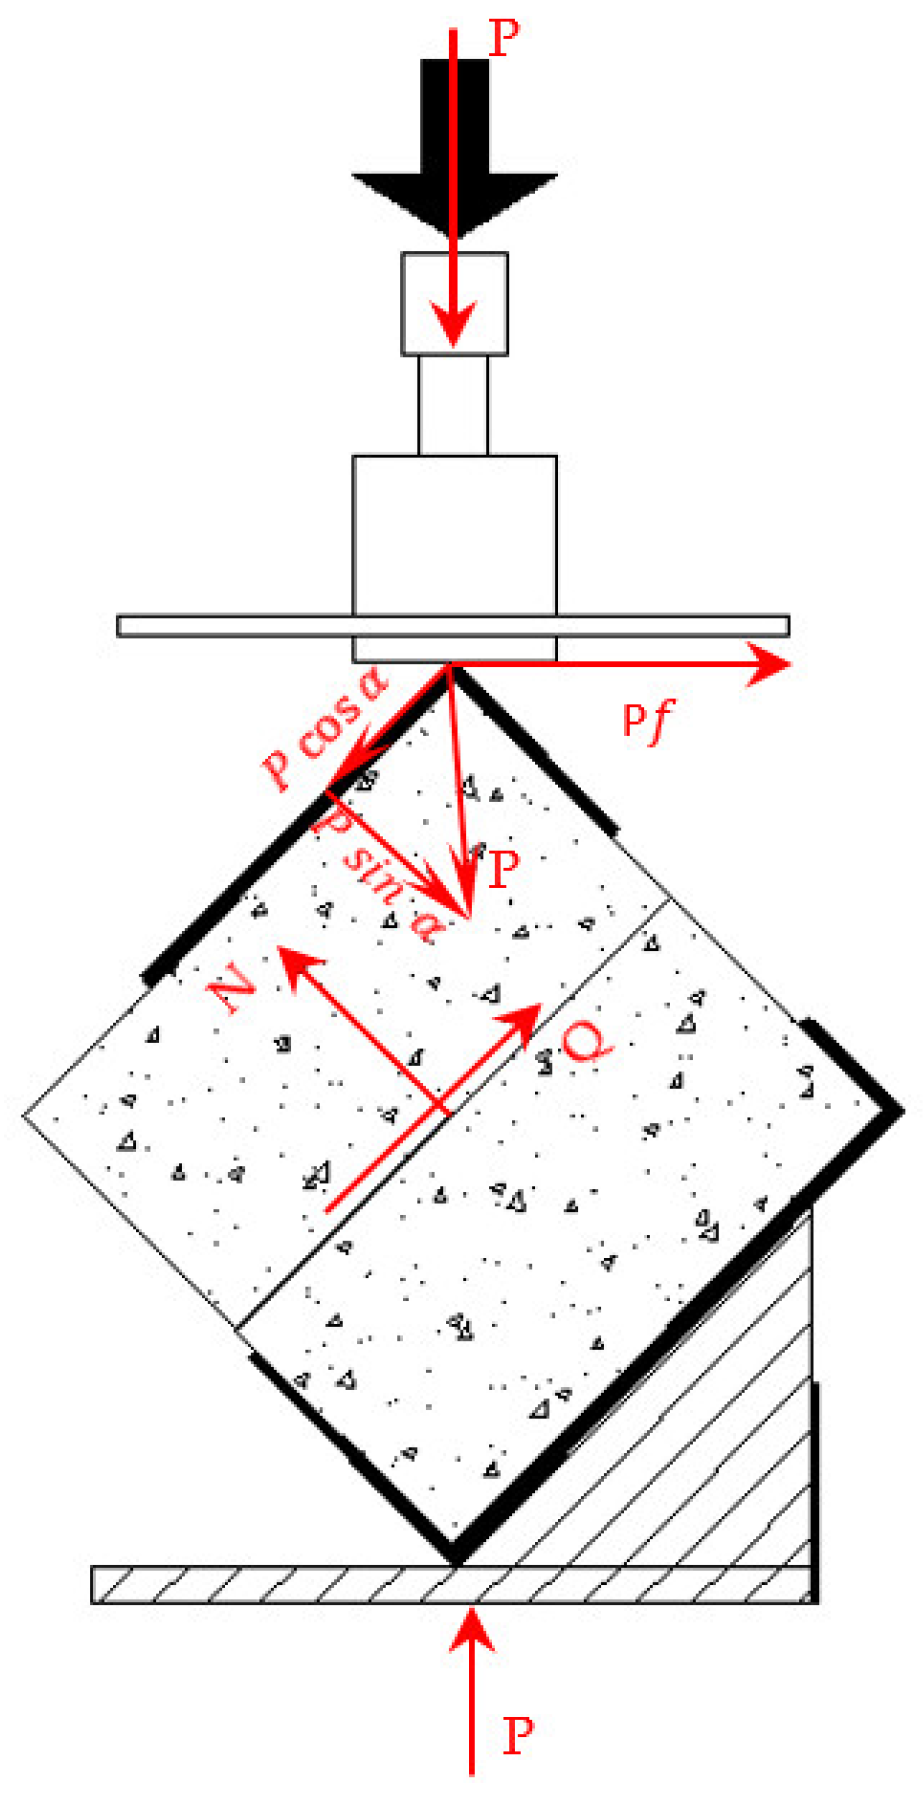
The stress state of the specimen under oblique shear is shown in Figure 6.
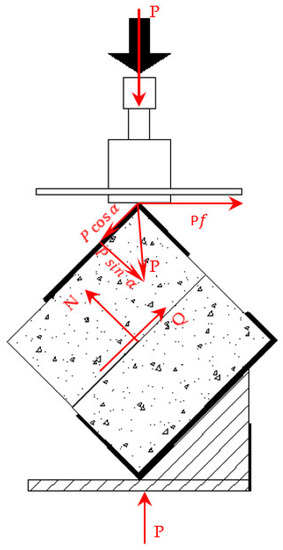
Figure 6.
The stress state of the specimen under oblique shear.
- P—Stress (The outputs of pressure senor), N
- N—Normal force on shear plane, N
- Q—Tangential force on shear plane, N
- ƒ—Friction coefficient, about 0.003
- α—Shear angle, 45°
- A—Shear area, mm
And,
- N-axis:
- Q-axis:
- Then,
- —Normal stress, MPa
- —Shear stress, MPa
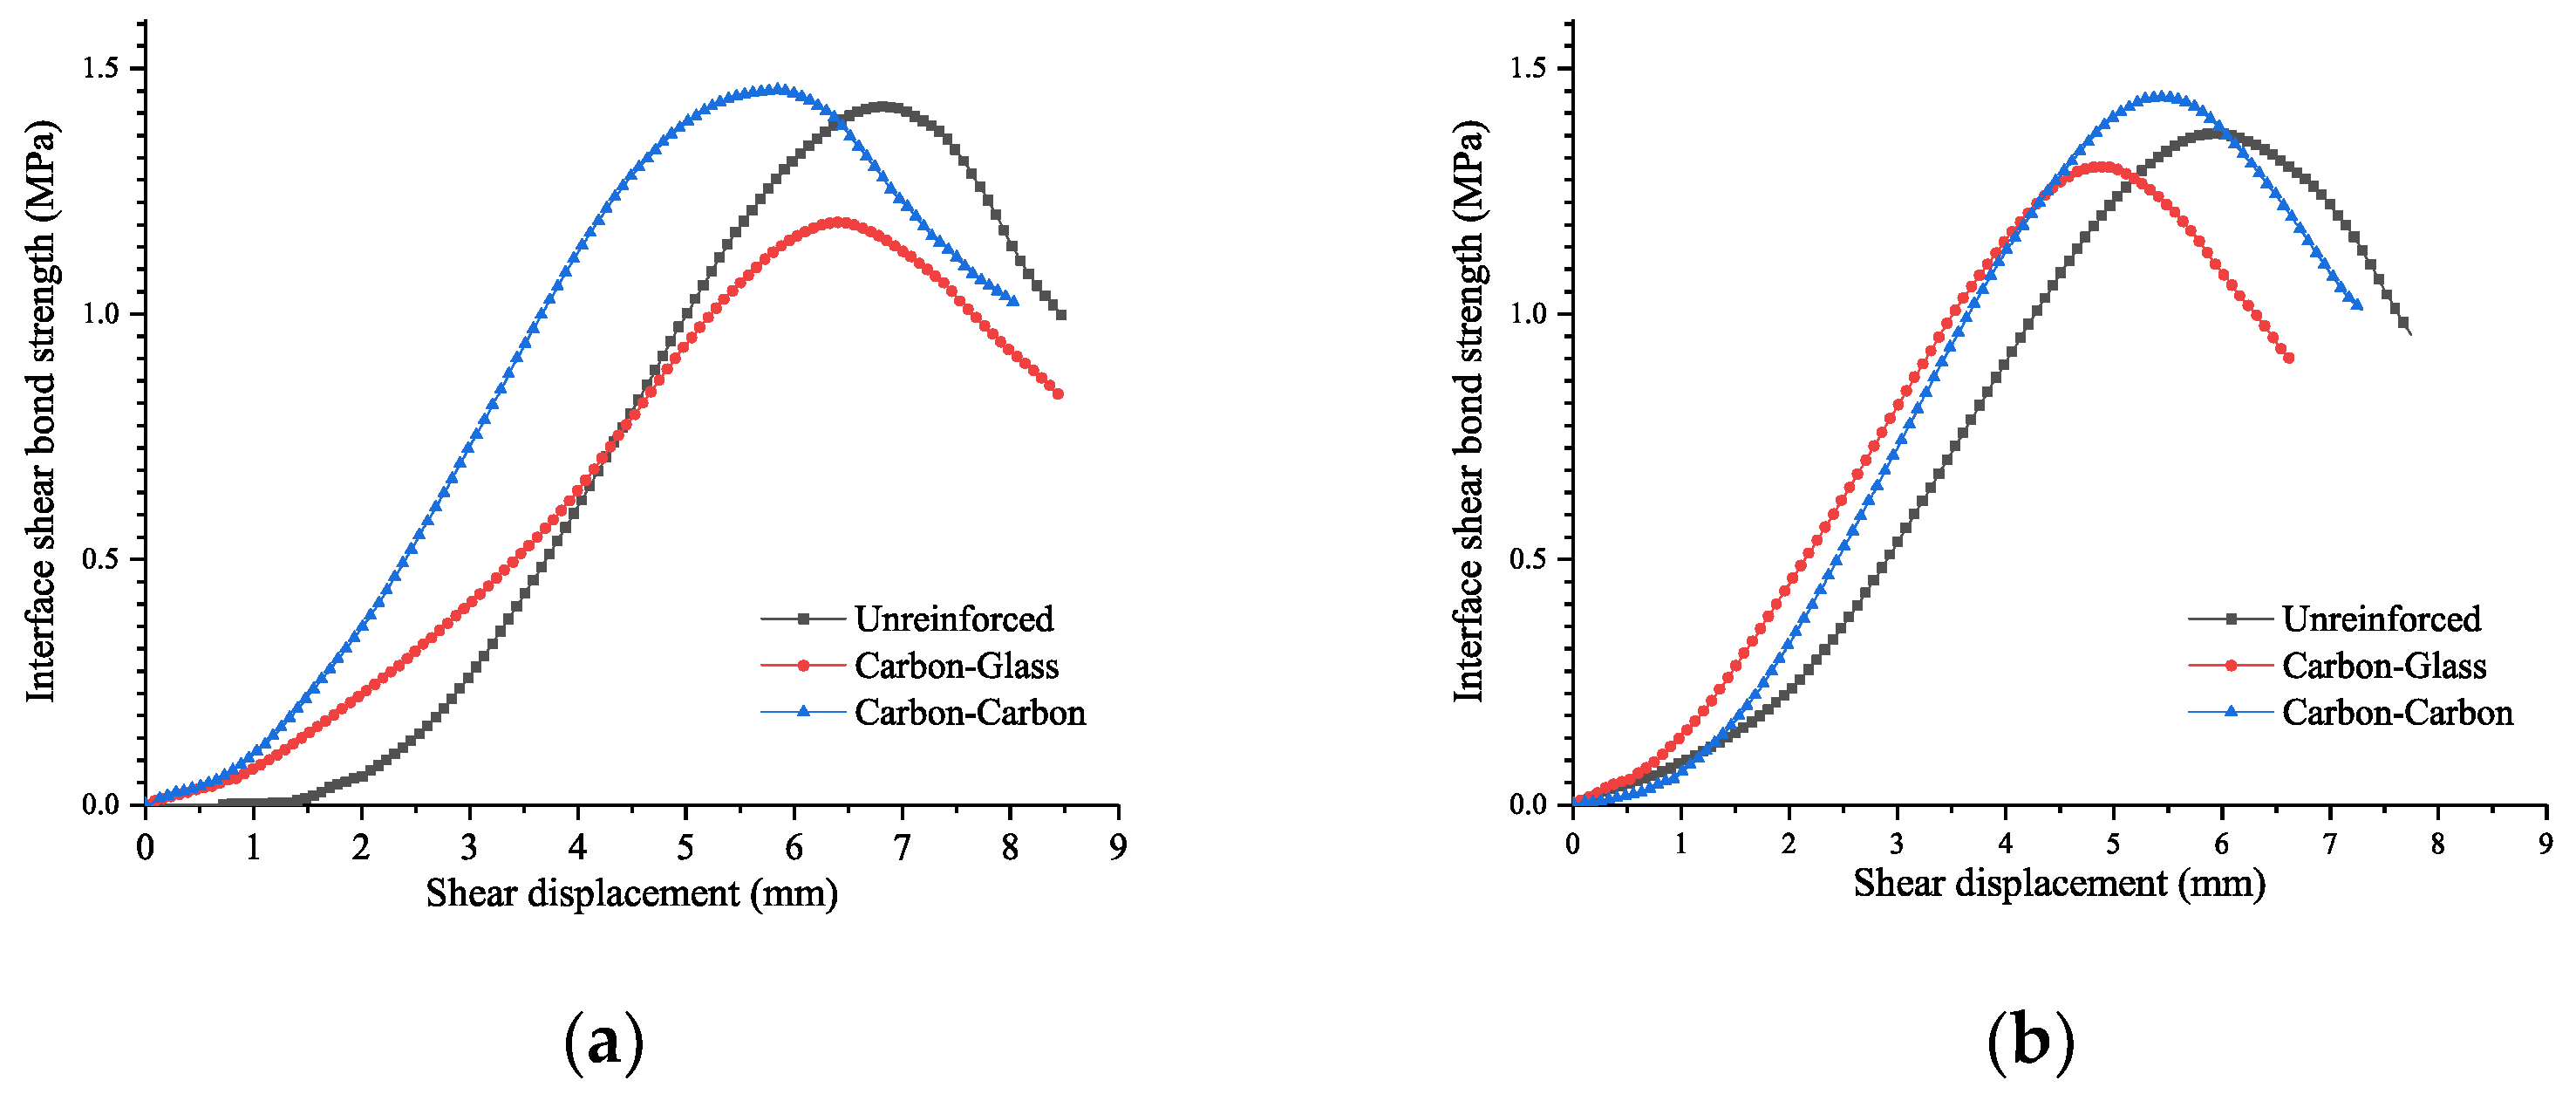
Figure 7 shows the results of the oblique shear tests. They show that, among the three types of asphalt samples, the ultimate oblique shear strength of the CC geogrid-reinforced sample was the highest, with values of 1.441 MPa and 1.456 MPa, corresponding to AC-20C and AC-13C, respectively. The unreinforced sample was second, with values of the ultimate oblique strength of 1.368 MPa and 1.422 MPa, corresponding to AC-20C and AC-13C; respectively. The CG geogrid-reinforced sample was the lowest, with values of 1.300 MPa and 1.203 MPa for AC-20C and AC-13C, respectively.
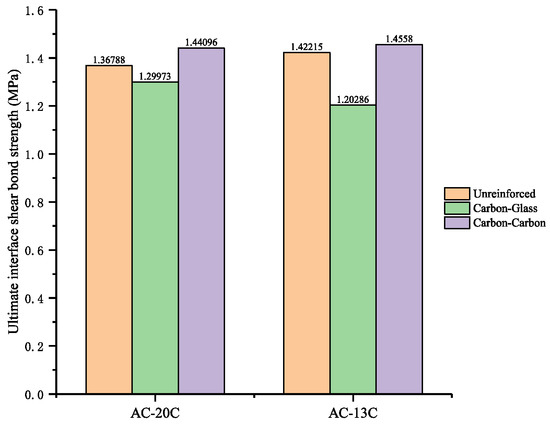
Figure 7.
The results of the oblique shear tests.
Comparing the AC-20C and AC-13C asphalt samples, it can be seen that the ultimate oblique shear strengths of the AC-20C asphalt samples are almost the same as those of the AC-13C asphalt samples. In the oblique shear test, with the generation and increase of normal stress, the effect of the asphalt mixture gradation on interlayer shear strength decreases. The AC-20C and AC-13C samples had a tendency to behave the same as would a granular material.
Comparing the direct shear curves and the oblique shear curves, it can be seen that the direct shear curves show vibration when the shear displacements reach 1–2 mm, denoted by point “A”. It is believed that the direct shear strength is mainly provided by cohesion and friction. When the shear displacement exceeds 2 mm, cohesion between asphalt layers becomes dominant. The oblique shear curves are smooth throughout the whole shear process. (See Figure 8).
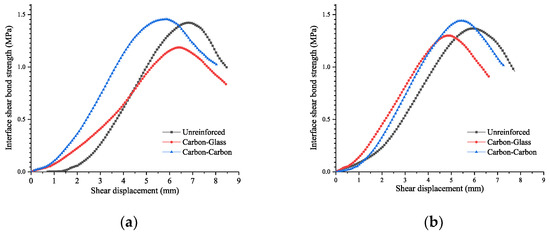
Figure 8.
Interface shear strength vs. shear displacement curves in the oblique shear experiment. (a) AC-13C and (b) AC-20C.
3.3. τ-σ Graph
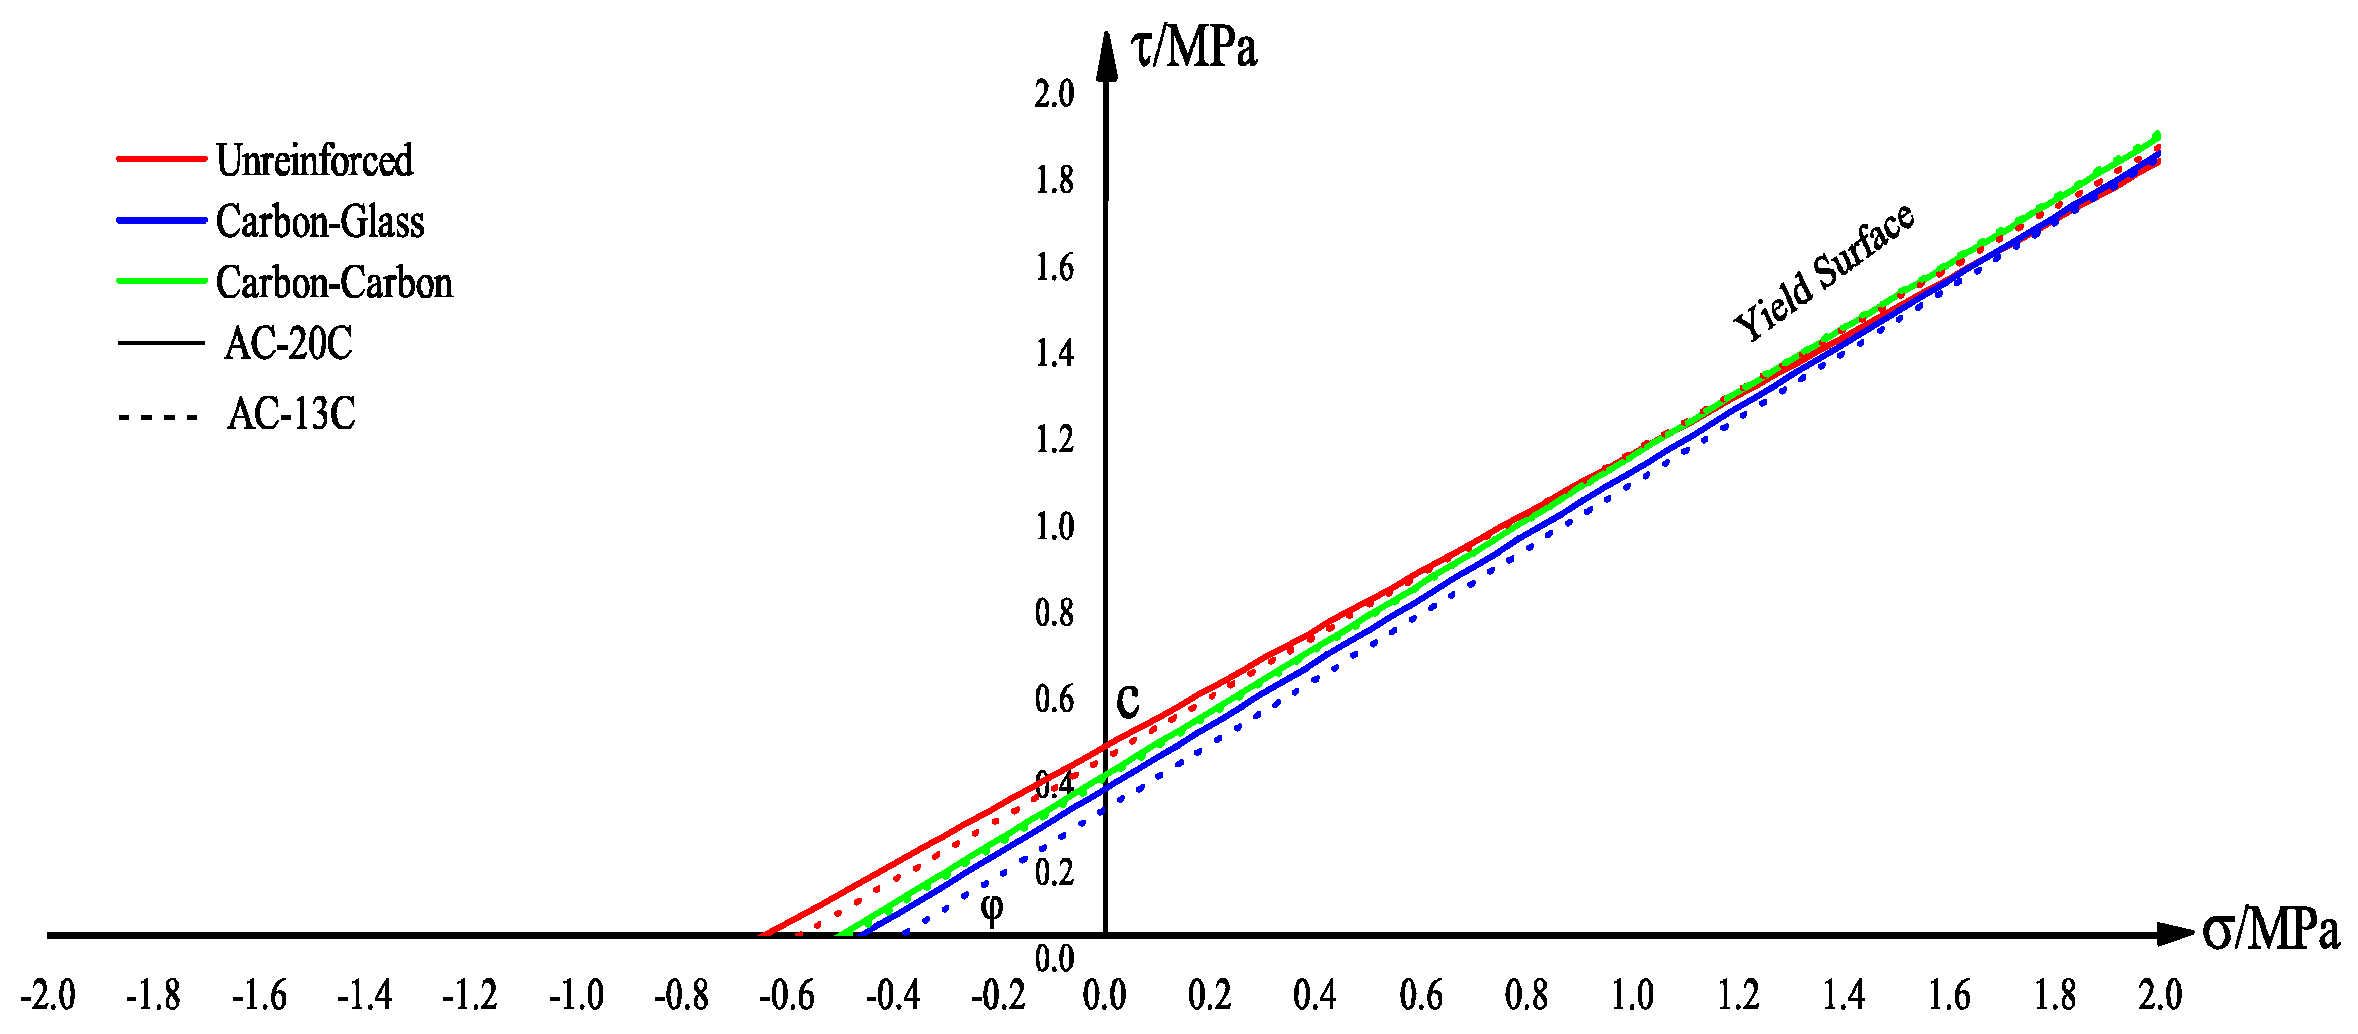
The direct shear test can be considered as an oblique shear test with a shear angle (α) of 90°. Then, normal stress , ; with assumed to be about 0.003, . The τ-σ graph is shown in Figure 10. It can be seen that with the normal stress increasing, the shear stress substantially converges to a certain value. It can be concluded that the geogrid-reinforced asphalt and unreinforced asphalt have the same interfacial bonding strengths under high normal stress, especially since the geogrid’s transverse and longitudinal ribs are made of the same material have the same stiffness. From the data shown in Figure 4, Figure 7, and Figure 9, the yield surface can be drawn in Figure 10. The values of φ are shown in Table 4. The friction angle of the reinforced asphalt is obviously higher than that for the unreinforced asphalt, which means that the mesh structure of the geogrid enhances the friction between asphalt layers.
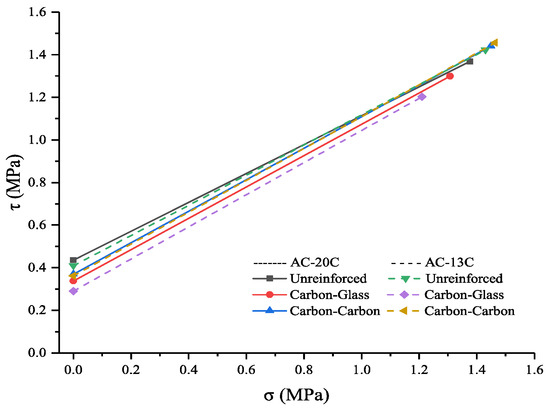
Figure 9.
τ-σ image from the direct shear and oblique shear tests.
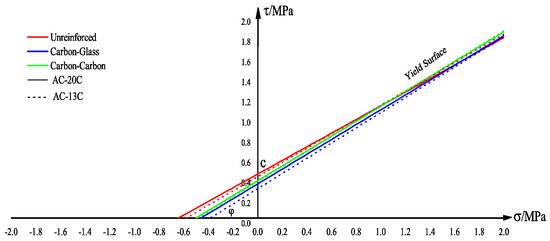
Figure 10.
The yield surface.
Table 4.
The values of φ of different asphalts.
4. Summary
This article has discussed the interlaminar shear characteristics of geogrid-reinforced asphalt and unreinforced asphalt through direct shear and oblique shear tests. The following conclusions can be drawn regarding the results presented:
- The interlaminar direct shear strength of geogrid-reinforced asphalt was lower than that of unreinforced asphalt. The direct shear strength of carbon–carbon geogrid-reinforced asphalt was reduced by 4% and that of carbon–glass geogrid-reinforced asphalt was reduced by 10%.
- For the oblique shear test, the carbon–carbon geogrid-reinforced asphalt had the highest shear strength of the three asphalts. The oblique shear strength was about four times the direct shear strength.
- The geogrid-reinforced asphalt and unreinforced asphalt had similar strength vs. shear displacement curves for both the direct shear and oblique shear tests. The oblique shear curves were smooth throughout the whole process, but the direct shear curves showed an area of oscillation.
- The interlayer direct shear strengths of the AC-20C asphalt samples were higher than those of the AC-13C asphalt samples. The oblique shear strengths of the AC-20C asphalt samples were almost the same as the AC-13C asphalt samples.
- With the normal stress increasing, the shear stress gradually converged to a certain value. The friction angle of the reinforced asphalt was obviously higher than that of the unreinforced asphalt.
When a vehicle is driving on asphalt pavement, it will shear the asphalt pavement obliquely at different angles. In this paper, due to the limitations of the test equipment, oblique shear tests at various angles were not carried out, but rather we only performed the test at 45°. In future work, the modeling of other oblique angles will be developed so as to more fully understand the bonding characteristics of geogrid-reinforced asphalt.
Author Contributions
Conceptualization, Q.L.; formal analysis, H.W.; investigation, Q.L.; data curation, Z.Y.; writing—original draft preparation, Q.L.; writing—review and editing, G.Y.; supervision, G.Y.; project administration, Q.L.; funding acquisition, G.Y. All authors have read and agreed to the published version of the manuscript.
Funding
This research was funded by the Innovation Funding Project for Postgraduates in Hebei Province (Grant no. CXZZBS2021113).
Institutional Review Board Statement
Not applicable.
Informed Consent Statement
Not applicable.
Data Availability Statement
Not applicable.
Conflicts of Interest
The authors declare no conflict of interest.
References
- Zofka, A.; Maliszewski, M.; Maliszewska, D. Glass and carbon geogrid reinforcement of asphalt mixtures. Road Mater. Pavement Des. 2017, 18, 471–490. [Google Scholar] [CrossRef]
- Lee, J.H.; Baek, S.B.; Lee, K.H.; Kim, J.S.; Jeong, J.H. Long-term performance of fiber-grid-reinforced asphalt overlay pavements: A case study of Korean national highways. J. Traffic Transp. Eng. (Engl. Ed.) 2019, 6, 366–382. [Google Scholar] [CrossRef]
- Kim, H.; Sokolov, K.; Poulikakos, L.D.; Partl, M.N. Fatigue evaluation of porous asphalt composites with carbon fiber reinforcement polymer grids. Transp. Res. Rec. 2009, 2116, 108–117. [Google Scholar] [CrossRef]
- Zamora-Barraza, D.; Calzada-Peréz, M.; Castro-Fresno, D.; Vega-Zamanillo, A. New procedure for measuring adherence between a geosynthetic material and a bituminous mixture. Geotext. Geomembr. 2010, 28, 483–489. [Google Scholar] [CrossRef]
- Raab, C.; Partl, M.N. Interlayer bonding of binder, base and subbase layers of asphalt pavements: Long-term performance. Constr. Build. Mater. 2009, 23, 2926–2931. [Google Scholar] [CrossRef]
- Petit, C.; Chabot, A.; Destrée, A.; Raab, C. Recommendation of RILEM TC 241-MCD on interface debonding testing in pavements. Mater. Struct. Constr. 2018, 51, 96. [Google Scholar] [CrossRef]
- Correia, N.S.; Mugayar, A.N. Effect of binder rates and geogrid characteristics on the shear bond strength of reinforced asphalt interfaces. Constr. Build. Mater. 2021, 269, 121292. [Google Scholar] [CrossRef]
- Sagnol, L.; Quezada, J.C.; Chazallon, C.; Stöckner, M. Effect of glass fibre grids on the bonding strength between two asphalt layers and its Contact Dynamics method modelling. Road Mater. Pavement Des. 2019, 20, 1164–1181. [Google Scholar] [CrossRef]
- Pasetto, M.; Pasquini, E.; Giacomello, G.; Baliello, A. Innovative composite materials as reinforcing interlayer systems for asphalt pavements: An experimental study. Road Mater. Pavement Des. 2019, 20, S617–S631. [Google Scholar] [CrossRef]
- Sudarsanan, N.; Karpurapu, R.; Amrithalingam, V. An investigation on the interface bond strength of geosynthetic-reinforced asphalt concrete using Leutner shear test. Constr. Build. Mater. 2018, 186, 423–437. [Google Scholar] [CrossRef]
- Walubita, L.F.; Nyamuhokya, T.P.; Komba, J.J.; Ahmed Tanvir, H.; Souliman, M.I.; Naik, B. Comparative assessment of the interlayer shear-bond strength of geogrid reinforcements in hot-mix asphalt. Constr. Build. Mater. 2018, 191, 726–735. [Google Scholar] [CrossRef]
- Francesco, C.; Leonello, B.; Gilda, F.; Andrea, G. Shear and flexural characterization of grid-reinforced asphalt pavements and relation with field distress evolution. Mater. Struct. 2015, 48, 959–979. [Google Scholar] [CrossRef]
- Hu, T.; Zi, J.-M.; Jin, S.-J. Shear Performance of Bridge Deck Pavement Based on Multi-angle Shear Test. J. Civ. Eng. Manag. 2019, 36, 104–108. [Google Scholar] [CrossRef]
- Ferrotti, G.; Canestrari, F.; Virgili, A.; Grilli, A. A strategic laboratory approach for the performance investigation of geogrids in flexible pavements. Constr. Build. Mater. 2011, 25, 2343–2348. [Google Scholar] [CrossRef]
- Ferrotti, G.; Canestrari, F.; Pasquini, E.; Virgili, A. Experimental evaluation of the influence of surface coating on fiberglass geogrid performance in asphalt pavements. Geotext. Geomembr. 2012, 34, 11–18. [Google Scholar] [CrossRef]
- Mohammad, L.N.; Raqib, M.A.; Huang, B.; Mohammad, L.N. Influence of Asphalt Tack Coat Materials on Interface Shear Strength. Transp. Res. Record. 2002, 2, 56–65. [Google Scholar] [CrossRef]


Publisher’s Note: MDPI stays neutral with regard to jurisdictional claims in published maps and institutional affiliations. |
© 2022 by the authors. Licensee MDPI, Basel, Switzerland. This article is an open access article distributed under the terms and conditions of the Creative Commons Attribution (CC BY) license (https://creativecommons.org/licenses/by/4.0/).