Article

Study on the Self-Repairing Effect of Nanoclay in Powder Coatings for Corrosion Protection

1
Department of Chemical and Biochemical Engineering, Western University, London, ON N6A 5B9, Canada
2
Department of Chemistry, Western University, London, ON N6A 5B7, Canada
3
Zhengzhou Research Institute, Harbin Institute of Technology, Zhengzhou 450000, China
4
Surface Science Western, Western University, London, ON N6G 0J3, Canada
5
Department of Statistical and Actuarial Sciences, Western University, London, ON N6A 5B7, Canada
6
Collaborative Innovation Center of Chemical Science and Engineering (Tianjin), School of Chemical Engineering and Technology, Tianjin University, Tianjin 300072, China
*
Authors to whom correspondence should be addressed.
Coatings 2023, 13(7), 1220; https://doi.org/10.3390/coatings13071220
Submission received: 30 April 2023 / Revised: 2 July 2023 / Accepted: 4 July 2023 / Published: 7 July 2023
(This article belongs to the Special Issue Modern Methods of Shaping the Structure and Properties of Coatings)

Abstract

:
Powder coatings are a promising, solvent-free alternative to traditional liquid coatings due to the superior corrosion protection they provide. This study investigates the effects of incorporating montmorillonite-based nanoclay additives with different particle sizes into polyester/triglycidyl isocyanurate (polyester/TGIC) powder coatings. The objective is to enhance the corrosion-protective function of the coatings while addressing the limitations of commonly employed epoxy-based coating systems that exhibit inferior UV resistance. The anti-corrosive and surface qualities of the coatings were evaluated via neutral salt spray tests, electrochemical measurements, and surface analytical techniques. Results show that the nanoclay with a larger particle size of 18.38 µm (D50, V) exhibits a better barrier effect at a lower dosage of 4%, while a high dosage leads to severe defects in the coating film. Interestingly, the coating capacitance is found, via electrochemical impedance spectroscopy, to decrease during the immersion test, indicating a self-repairing capability of the nanoclay, arising from its swelling and expansion. Neutral salt spray tests suggest an optimal nanoclay dosage of 2%, with the smaller particle size (8.64 µm, D50, V) nanoclay providing protection for 1.5 times as many salt spray hours as the nanoclay with a larger particle size. Overall, incorporating montmorillonite-based nanoclay additives is suggested to be a cost-effective approach for significantly enhancing the anti-corrosive function of powder coatings, expanding their application to outdoor environments.

Graphical Abstract

1. Introduction

Anti-corrosive coatings are commonly utilized to prevent metallic substrates from corroding [1,2]. Among these coatings, solvent-borne liquid coatings are the most commonly used on the market, but there has been a shift towards powder coatings in recent years. This change is occurring because powder coatings help reduce the use of volatile organic compounds (VOCs) and hazardous air pollutants (HAPs) as solvents, making them a potentially more environmentally friendly option [3,4,5]. In addition, powder coatings are recognized for their 4Es, which include being ecological, economical, energy-efficient, and highly effective compared to their liquid counterparts. These advantages have contributed to the growing popularity of powder coatings [5,6,7,8].
Powder coatings come in two main varieties: thermoplastic and thermosetting. The latter is typically preferred due to its higher performance, achieved through a cross-linking reaction that occurs during thermal or UV curing [4,9]. A typical thermosetting powder coating formula consists of resin, a curing agent (collectively referred to as the “binder”), additives, pigments, and fillers, which are all crucial components for achieving the desired properties and performance.
Thermosetting powder coatings use a variety of binders, including polyester cross-linked with triglycidyl isocyanurate (TGIC) or β-hydroxyalkyl amide (HAA) [10], epoxy [11], polyester–epoxy hybrid, polyurethane (PU) [12], and polyacrylate [5]. While epoxy powder coatings offer superior corrosion protection, they are unsuitable for outdoor topcoat applications due to their poor UV resistance [4,5]. In contrast, polyester powder coatings are UV resistant and can be used as both basecoat/primer and topcoat [3,4]. For polyester systems, using HAA as the curing agent is more environmentally friendly [13,14], but its cured coating film is more porous than the TGIC system due to the water vapor released from the cross-linking reaction [4,9]. Therefore, this study adopted a polyester/TGIC binder.
An anti-corrosive additive is an additional component of coatings that can enhance their properties. These additives work through three main mechanisms: barrier shielding, galvanic effects (sacrificial anode), and inhibitive effects [1]. In terms of barrier effect, many solid particles, especially those with high aspect ratios, have been used to enhance the protective qualities of coating films and polymer composites [11,15]. This effect is primarily due to the increased tortuosity of transport pathways within the coating and the inhibited ingress and uptake of the corrosive medium (electrolyte) [13,16,17]. Micaceous iron oxide (MIO) and nanoclays are two examples of additives that fall into this category [1,18,19]. Other one-dimensional and zero-dimensional nanomaterials, such as graphene [20], graphene oxides [21], MXenes [22], and their derivatives have been reported to provide an enhanced barrier effect. However, the high cost of these novel materials would limit their application in commodity anti-corrosive coatings.
Nanoclay based on montmorillonite [(Na,Ca)0.33(Al,Mg)2(Si4O10)(OH)2·nH2O (MMT)], with a plate thickness of 1 nm, is a commonly used clay in polymers and coatings [18,23,24]. Montmorillonite can be derived from bentonite, and the terms are often used interchangeably [14,25]. Surface treatment of the clay has been shown to improve the interfacial adhesion and compatibility between the particle surface and polymer matrix [17,18]. As a smectite mineral, montmorillonite has a large specific surface area and exhibits high swelling and expansion capability in contact with water [13,25]. It has been used as a rheological modifier (thickener) and an anti-corrosive additive for waterborne coatings [26,27,28]. Additionally, it serves as a functional filler in various polymer composites for enhancing impermeability [14,16,17,29,30,31,32,33,34,35,36]. However, its use in powder coatings remains rare.
Incorporating nanoclay particles with a layered structure into polymers can increase their barrier properties by increasing the tortuosity of the transport pathway for aggressive species, similarly to other lamellar-shaped pigments [1,13,16]. Van der Zwaag also demonstrated that nanoclay could fill moisture-induced cracks in sol-gel-based coatings as an expandable phase [37]. Huttunen-Saarivirta et al. [11] investigated the effect of MMTs on epoxy powder coatings and found that the mechanical properties and barrier effect of the coatings were both improved. Platelet-shaped MMTs had a stronger barrier effect than rod-like ones. Additionally, Zhu et al. noted that nanoclay acted as a dispersing aid, facilitating the dispersion of other coating components [38]. Its water-absorbing ability could also trap electrolyte inside the cured coating film, inhibiting the ingress of corrosive media during environmental exposure.
Apart from the chemical structure of the incorporated additive particles, factors such as particle size, particle size distribution (PSD), aspect ratio, and surface treatment significantly affect their characteristics and performance in coatings and polymer composites. Experimental and modeling efforts studies have been conducted to investigate these factors [11,15,39,40,41,42,43], and it has been reported that particle size could impact the behavior and properties of clay in coating systems [11,15,39,40,42].
This study compares two nanoclays with different particle sizes and particle size distributions (PSDs) at various dosages in a polyester/TGIC powder coating binder. The effects of these nanoclays on the mechanical and anti-corrosive properties of the coatings were assessed using applicable ASTM and ISO standards for industrial applications as well as electrochemical impedance spectroscopy (EIS), which has been widely used for coating performance evaluation and formulation optimization [44,45,46,47,48].

2. Materials and Methods

2.1. Materials and Coating Formulations

This study investigated two sets of cost-effective montmorillonite (MMT) that were surface-modified with a quaternary ammonium salt, Claytone® HT (C1, with a larger particle size, see Figure 1a), and CLOISITE® 30B (C2, with a smaller particle size, see Figure 1b) (BYK USA Inc., Wallingford, CT, USA). These were incorporated into a polyester/TGIC binder using the standard manufacturing process for powder coatings. The surface treatment of the clay was found to improve the interfacial adhesion and compatibility between the particle surface and the polymer matrix [17,18]. Other treatment methods, such as plasma or ozone exposure [49], may serve similar purposes and can be compared in future studies.
Table 1 shows the montmorillonite particle sizes measured using a laser diffraction particle size analyzer (BT9300S, Bettersize Instruments Ltd., Dandong, China).
The study evaluated and compared the anti-corrosive effects of the two nanoclays in a previously optimized powder coating formulation (see Table 2). A range of additive dosages (i.e., contents or concentrations) were tested to determine the optimal dosages, and the resulting formulations with different dosages of the two nanoclays are shown in Table 3. The naming scheme for each formulation reflects the different levels of dosages.

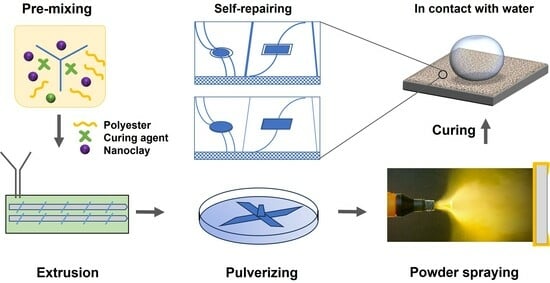
2.2. Preparation of Powder-Coated Panels

The raw materials in the powder coating formulations were pre-mixed and extruded in a laboratory-scale powder coating extruder (SLJ-10, Yantai Donghui Powder Coating Equipment Co., Yantai, China). The infeed, plastification, and homogenizing zones were optimized and maintained at temperatures of 80, 90, and 100 °C, respectively, with a twin-screw rotation speed of 300 rpm, screw feeder speed of 10 rpm, and rolling chiller speed of 10 rpm. The torque was maintained within 80 ± 5% of the equipment’s capacity. The hot extrudates were cooled, crushed, pulverized, and sieved to produce coating powders with a median diameter (D50, V) of 35 ± 3 µm.
The powder coatings were electrostatically sprayed onto standard phosphated steel panels (ASTM D609 Type 2 [50], Q-Lab Corporation, Cleveland, OH, USA) using a Gema OptiSelect corona gun and an OptiStar manual gun control unit (Gema Switzerland GmbH, Gallen, Switzerland) at a constant voltage of −50 kV. The panels were cured for 15 min at 200 °C to cross-link the coating films fully. Film thicknesses were measured using a film thickness gauge PosiTector 6000 (DeFelsko Corporation, Ogdensburg, NY, USA) as per ASTM D7091–13 [51] and confirmed under a scanning electron microscope. Coated panels with film thicknesses of 60 ± 5 µm were selected for testing and characterization.

2.3. Coating Performance Evaluations

Coating performance was evaluated using various ASTM (ASTM International, formerly known as the American Society for Testing and Materials) standards. The surface quality of the coatings was evaluated using a Rhopoint IQ 20/60 gloss meter (goniophotometer, Rhopoint Instruments Ltd., St Leonards, UK) to measure specular gloss and distinctness-of-image (DOI) according to ASTM D523–14 [52] and D5767–18 [53]. The mechanical properties of the coatings were assessed using ASTM standards for cross-cut adhesion (D3359–09) [54], pencil hardness (D3363–05) [55], and impact resistance (D2794−93, Reapproved 2010) [56].

2.4. Anti-Corrosive Performance Evaluations

2.4.1. Neutral Salt Spray Tests

To evaluate the anti-corrosive performance of the coated panels, a neutral salt spray test was conducted in accordance with ASTM B117−16 [57] using a salt spray chamber MX-9204 (Associated Environmental Systems, Ayer, MA, USA). Two 0.5 mm wide scribes were made to expose the steel substrate before testing. Every 500 h, the sample panels were removed from the chamber, rinsed, and scraped vigorously with a flexible plastic spatula alongside the scribe, following ASTM D1654–08 (Reapproved 2016) Section 8.1.1 Method 1 [58]. The time taken to reach a mean creepage of 2 mm was recorded as a result.

2.4.2. Electrochemical Tests and Degree of Rusting

Electrochemical techniques, especially electrochemical impedance spectroscopy (EIS), have been instrumental in obtaining insightful information on organic coating films [44,59,60]. In widely adopted organic coatings models, the coating film is considered non-conductive, with pores over the cross-sections that gradually permeate with conductive electrolyte during immersion test [61,62]. The ingress of the electrolyte through the pores can be analyzed visually or by an equivalent electrical circuit (EEC) modeling and breakpoint frequency analysis [59], allowing for quantitative interpretation and comparison of the effect of defects in the coating [63,64,65]. By fitting EECs to EIS spectra, multiple indicators, such as the coating capacitance and pore resistance, can be used to monitor the coating evolution during immersion over time [66,67].
The coating film is a dielectric medium between the metallic substrate and the electrolyte in contact with the coating surface. Its capacitance is expressed by Equation (1),
C = ε 0 ε r A d
where C is the coating capacitance, ε0 the vacuum permittivity (8.83 × 10⁻¹⁴ F/cm), εr the dielectric constant (relative electrical permittivity) of the coating, A the area of the coating surface, and d the coating film thickness. The latter value changes with electrolyte uptake through the microscopic pores inside the coating film. The volumetric content of water Xv inside the coating film can be estimated using the Brasher–Kingsbury equation in Equation (2) [48,68], which has been verified to yield values close to gravimetric values obtained experimentally [69,70],
X v = log 10 C c o a t ,   t C c o a t ,   0 log 10 80
where Ccoat,t is the coating capacitance at time t, Ccoat,0 the initial coating capacitance, and 80 the relative electrical permittivity of water at 20 °C.
The lower breakpoint frequency, as shown in Equation (3), is proportional to the delaminated area and can be used to identify the initiation and estimate the degree of coating degradation [64,71,72],
f b = A d 2 π ε 0 ε r ρ 0 A
where Ad and A are the delaminated and total areas of the coating film, respectively, and ρ0 the specific ionic resistance of the coating.
In addition to EIS, measurements of the open circuit potential (OCP, also called corrosion potential, Ecorr) and polarization resistance (Rp) are also non-destructive electrochemical techniques that can be used to monitor coating changes over time [73,74,75,76,77]. In coating research, OCP is used to compare the chemical activity of different coating systems and formulations qualitatively, with a higher OCP value indicating a more protective system [77,78,79] (if the cathodic reaction is unchanged). The Rp value, defined in Equation (4), can be obtained by measuring the current response within the pseudo-linear region of potential at OCP ±5 to ±10 mV [65,80]. The Rp value is inversely proportional to the corrosion rate of the material, as shown in Equation (5). In the case of a defective coating film, the decrease in Rp corresponds to an increase in the exposed substrate area over time.
1 R p = I E E 0
R p 1 i c o r r
Compared to EIS measurement and interpretation, monitoring OCP and Rp are faster and easier procedures that do not require highly sophisticated instruments and software.
A conventional three-electrode electrochemical cell was used for all the electrochemical measurements. The cell was housed inside a Faraday cage to reduce electromagnetic interference from external sources. A saturated calomel electrode (SCE, 0.242 V vs. standard hydrogen electrode, SHE) was used as the reference electrode, and a Pt plate as the counter electrode; 5% NaCl by weight in Type I water (resistivity 18.2 MΩ∙cm) was used as the electrolyte. An integrated potentiostat and frequency response analyzer (FRA), Solartron Analytical Modulab XM CHAS 08 (AMETEK Scientific Instruments, Oak Ridge, TN, USA) and Modulab XM ECS software version 3.4 were used to perform the OCP, Rp, and EIS measurements and data collection.
The electrochemical impedance spectroscopy (EIS) scanning was subsequently conducted in a frequency range from 10 mHz to 100 kHz using an OCP ± 10 mV (absolute) sinusoidal potential perturbation. The OCP was measured first, followed by the Rp, which was measured potentiodynamically within the range of OCP ± 10 mV at a scan rate of 10 mV/min. The three measurements were all conducted at a 1-day interval to monitor changes in the coating film. The EIS fitting was performed using ZView software (Scribner Associates Inc., Southern Pines, NC, USA) version 4.0c.
In addition to these measurements, the degree of rusting was also graded through visual inspection using ASTM D610–08 (Reapproved 2019) [81] after the immersion tests. This standard provides a visual reference for grading the degree of rusting on metal surfaces. The overall purpose of these tests was to monitor the effectiveness of the coating film in preventing rust and to identify any changes in the coating film over time.

2.5. Characterization Techniques

The characterization techniques used in the study include scanning electron microscopy (SEM), field emission scanning electron microscopy (FE-SEM), confocal laser scanning microscopy (CLSM), Raman spectroscopy, X-ray diffractometry (XRD), and X-ray micro-computed tomography (microCT).
For SEM, an S-3900 SEM (Hitachi High-Tech Corporation, Tokyo, Japan) with an Oxford ULTIM MAX 65 SDD X-ray analyzer (Oxford Instruments plc, Abingdon, UK) or a SU3500 variable pressure SEM (Hitachi High-Tech Corporation, Tokyo, Japan) combined with an Oxford Aztec X-Max50 SDD X-ray analyzer (Oxford Instruments plc, Abingdon, UK) were used. SEM was used to analyze the additive particles and the cross-sections of the coating films. FE-SEM imaging was performed with a Hitachi SU8230 Regulus ultra high-resolution field emission SEM (Hitachi High-Tech Corporation, Tokyo, Japan) to study the details of the particle dispersion in the coating film.
For CLSM, a LSM 900 confocal laser scanning microscope for materials (Carl Zeiss Microscopy GmbH, Jena, Germany) was used. CLSM was used to examine the coating surface morphology and roughness. The acquired data were processed using ConfoMap version 7.4.8341 (Digital Surf, Besançon, France).
An InVia Reflex Raman Spectrometer at a 633 nm laser wavelength (Renishaw plc, Gloucestershire, UK) was employed for Raman spectroscopy. Raman spectroscopy was used to identify the corrosion products and chemical reaction mechanisms.
For XRD, a Rigaku SmartLab automated multipurpose X-ray diffractometer with a Cu source, equipped with a Cross Beam Optics (CBO) system and a 2D HyPix-3000 detector XRD (Rigaku Corporation, Akishima, Japan), was used. XRD was also used to characterize the corrosion products for large, coated surface areas (approximately 100 mm × 100 mm). A grazing incidence XRD with an incidence angle of 3° was used for all measurements.
Finally, for microCT, the instrument used was a ZEISS Xradia Context microCT (Carl Zeiss Microscopy GmbH, Jena, Germany). MicroCT was used for non-destructive 3D imaging. The acquired data were reconstructed by ZEISS Scout-and-Scan software, and the data post-processing and visualization were performed using Dragonfly Pro version 4.0.0.569 software.

3. Results and Discussion

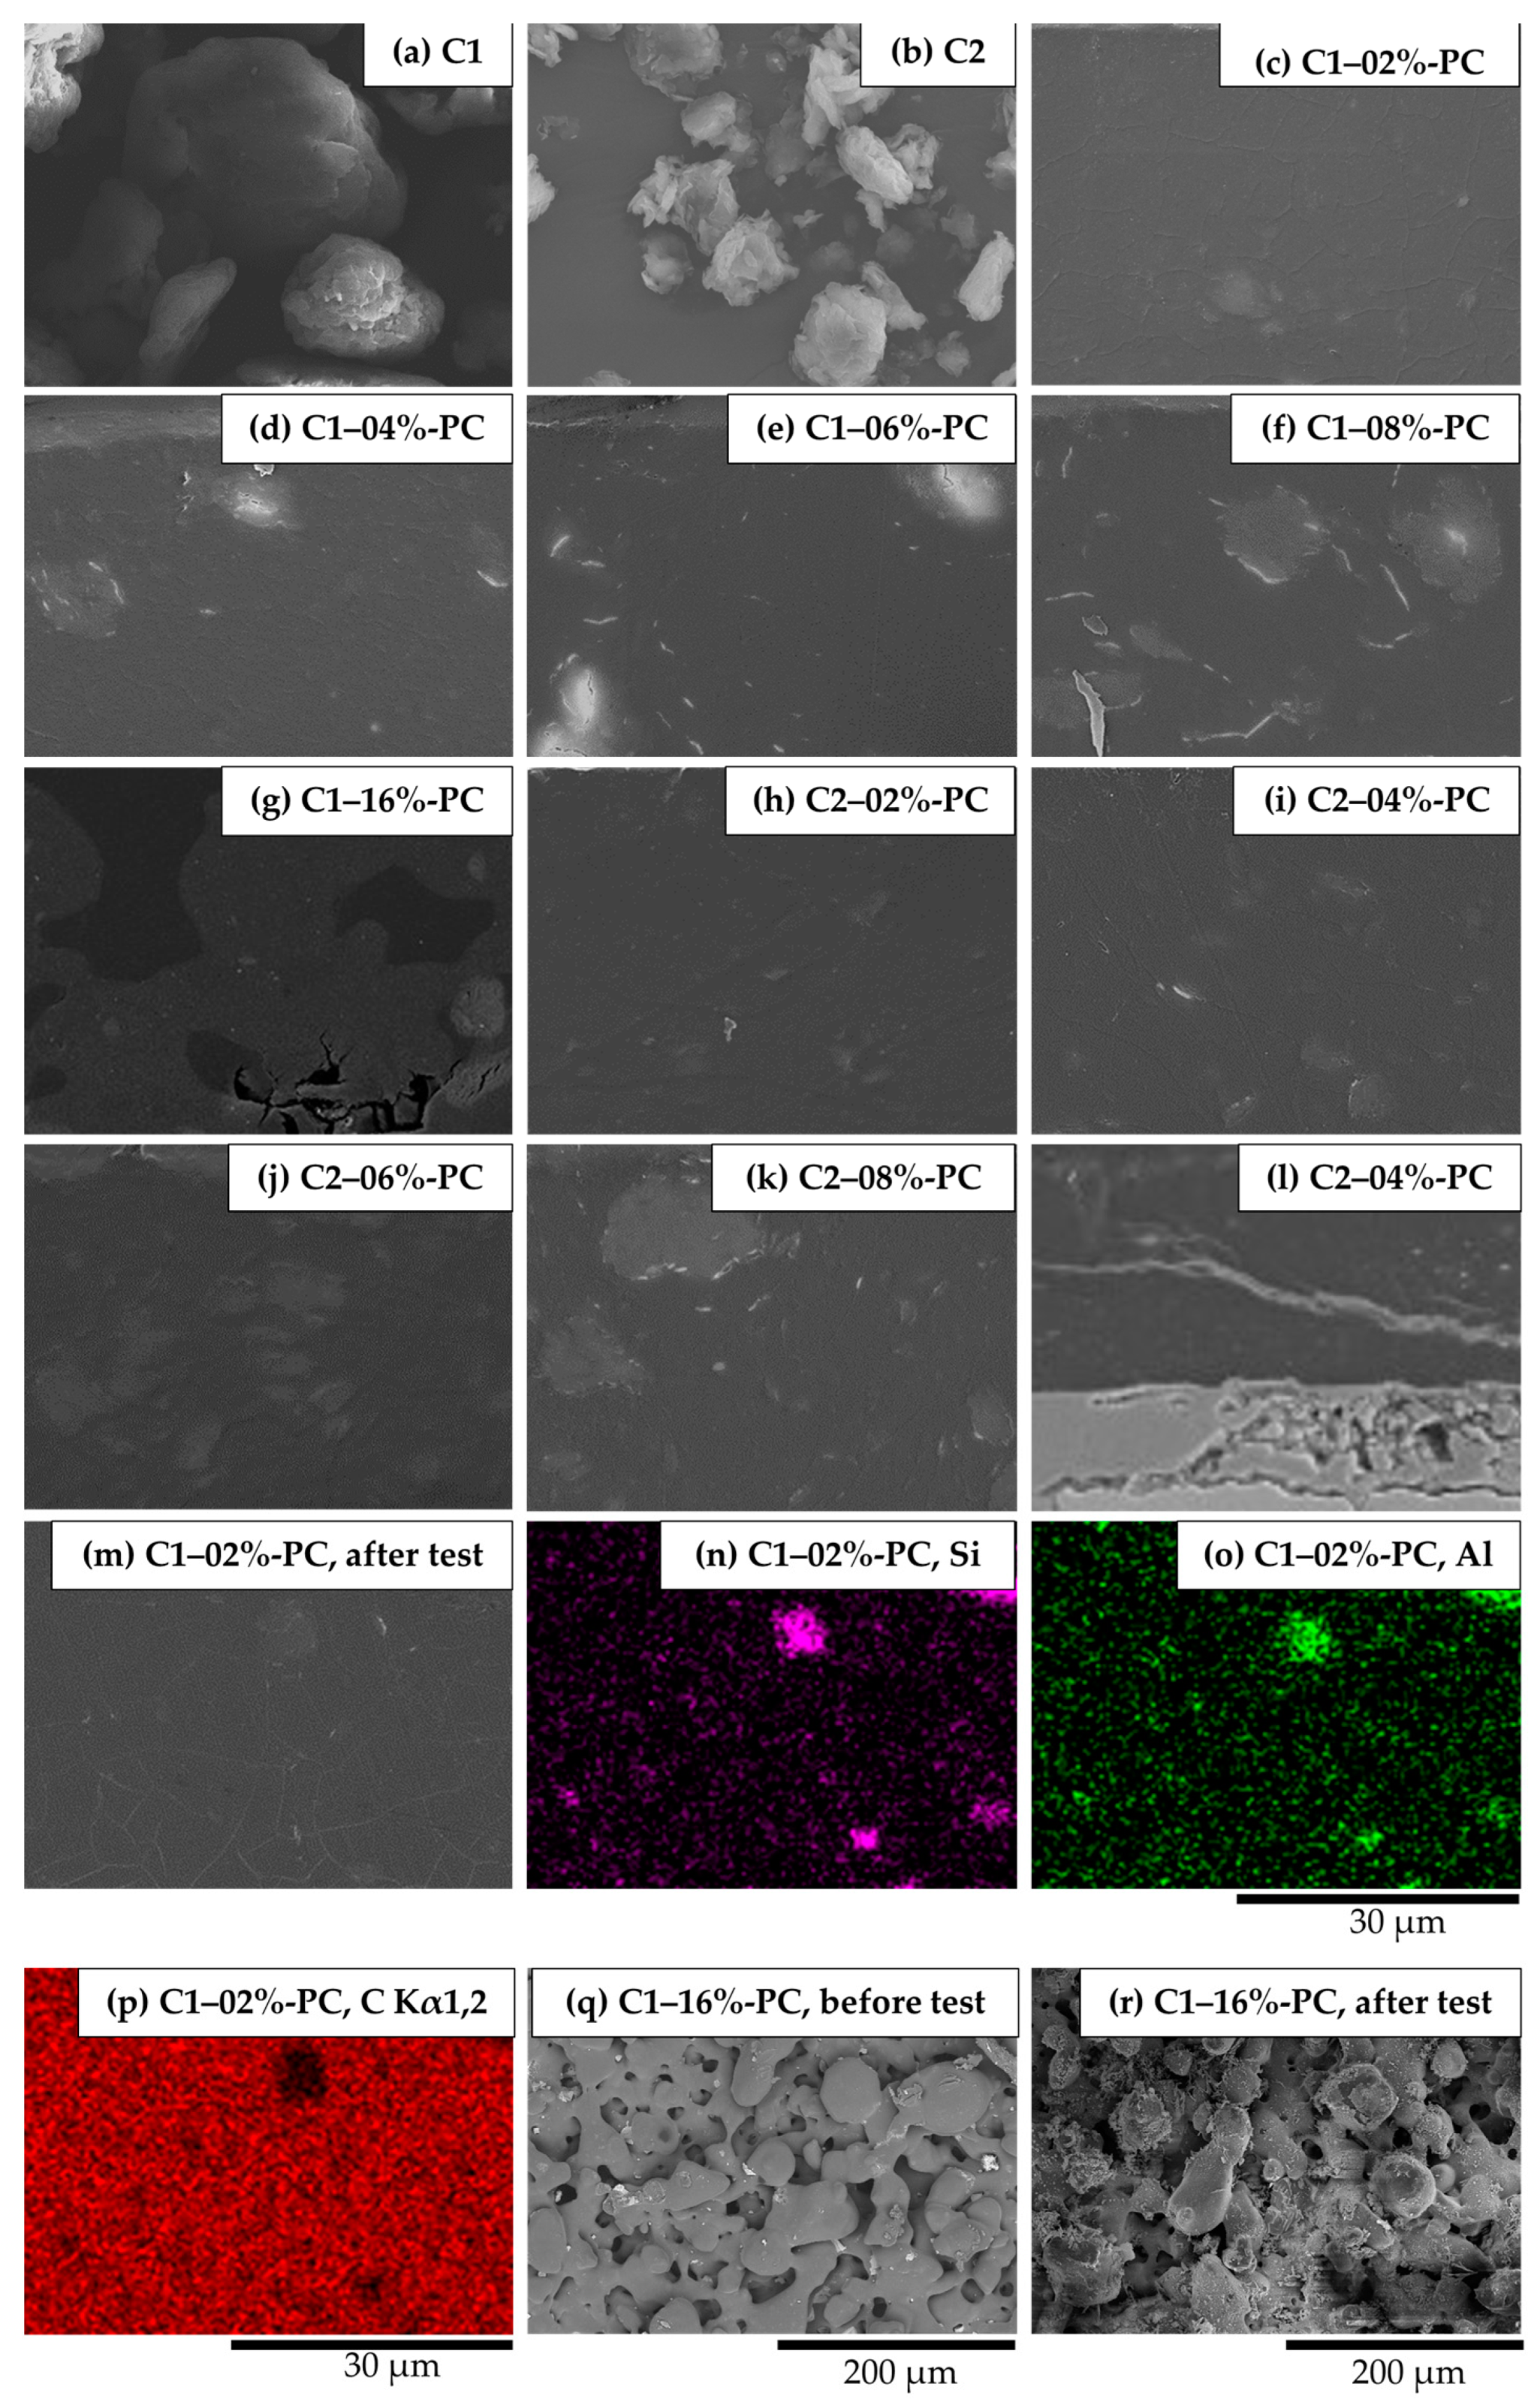
3.1. Coating Morphologies

Figure 1c–f,h–k show that the nanoclay particles were dispersed in the polymer matrices as platelets at dosages of 2, 4, 6, and 8%. Only a small number of agglomerates with diameters of approximately 10 µm were observed, and no visible pores or voids were present in multiple 8 mm wide cross-section specimens for each formulation. However, when the clay dosage was increased to 16% in the coating prepared from the formula C1–16%-PC, severe defects—including voids, pores, and micrometer-scale channels—were formed due to the inhibited flow and leveling, as shown in Figure 1g. The higher melt viscosities of the polymeric binder at high particle content caused deterioration of the coating uniformity and integrity.
The immersion test revealed cracks inside the coating films of multiple specimens, as shown in Figure 1m. The cracks resulted from the swelling and expansion of the nanoclay particles in the confined space of the rigid polymer matrix. For coatings with a nanoclay dosage of 16% (C1–16%-PC), inadequate coating flow and the film contraction during cross-linking caused severe defects, leading to aggravated performance deterioration in the immersion test. The corrosion spots in the coating cross-sections after immersion were inspected using SEM and EDS mapping, as shown in Figure 1l,n–p (the coating with 2% nanoclay, C1–02%-PC). Corrosion products of the steel substrate were present inside and around the pores on the coating surface, as shown in Figure 1q,r.
FE-SEM imaging exhibited the dispersion of nanoclay particles with a broad size distribution in the binder (Figure 2a,b) and proved that the nanoclay particles existed in both intercalated (binder intercalated between nanoclay layers, Figure 2c,d) and exfoliated (binder presenting no ordering along the stacking axis of the nanoclay layer) forms [82]. There was a significant number of particles successfully dispersed to be 10 nm in diameter (Figure 2e,f).
Surface scanning using CLSM was performed to measure the roughness of the coating. As shown in Figure 3a,c–j, the coating surfaces transitioned from glossy to a sandpaper-like visual appearance with an increase in nanoclay dosage. The calculated surface roughness values as per ISO 25178 [83] are shown in Figure 3b. The confocal maps showed that larger nanoclay dosages led to lower effective film thicknesses for the same measured film thickness. The decreased effective film thickness and increased defects in the coating films could both contribute to deteriorated protective performance.
MicroCT images (Figure 4a,b, a 3D video can be found in the Supplementary Materials) show that the particles were uniformly dispersed in a 60 µm × 750 µm × 750 µm coating film with only a small number of agglomerates. The X-ray micro-computed tomography was able to show the inner structure of a significantly larger area than the small image field of SEM.
In summary, the nanoclay dosages significantly affected the coating morphology, surface roughness, and effective film thickness. Higher dosages led to more defects and worse protective performance. The microCT technique provided a more comprehensive view of the inner structure of the coating than did SEM.

3.2. Coating Properties

The cross-cut adhesion, as measured by ASTM D3359, was found to be 4B for all coatings (with less than 5% of the area removed in the test), and this good adhesion was maintained even after a prolonged immersion test for electrochemical measurements. The specular gloss, DOI, and reflection haze were measured as a function of the additive dosage, and these values are plotted in Figure 5a,b. Larger nanoclay particles resulted in lower gloss and DOI values.
Figure 5c,d show the mechanical property values for pencil hardness and impact resistance. The addition of nanoclay with a larger particle size improved the coating hardness at 2% and 4% dosages, while the nanoclay with smaller particle size had no such effect. Only the addition of nanoclay with the smaller particle size improved the impact resistance. The coatings with dosages of 2% and 4% of larger nanoclay particles exhibited decreased impact resistance, but they still met the requirement for anti-corrosive applications in the industry.

3.3. Electrochemical Measurement Results
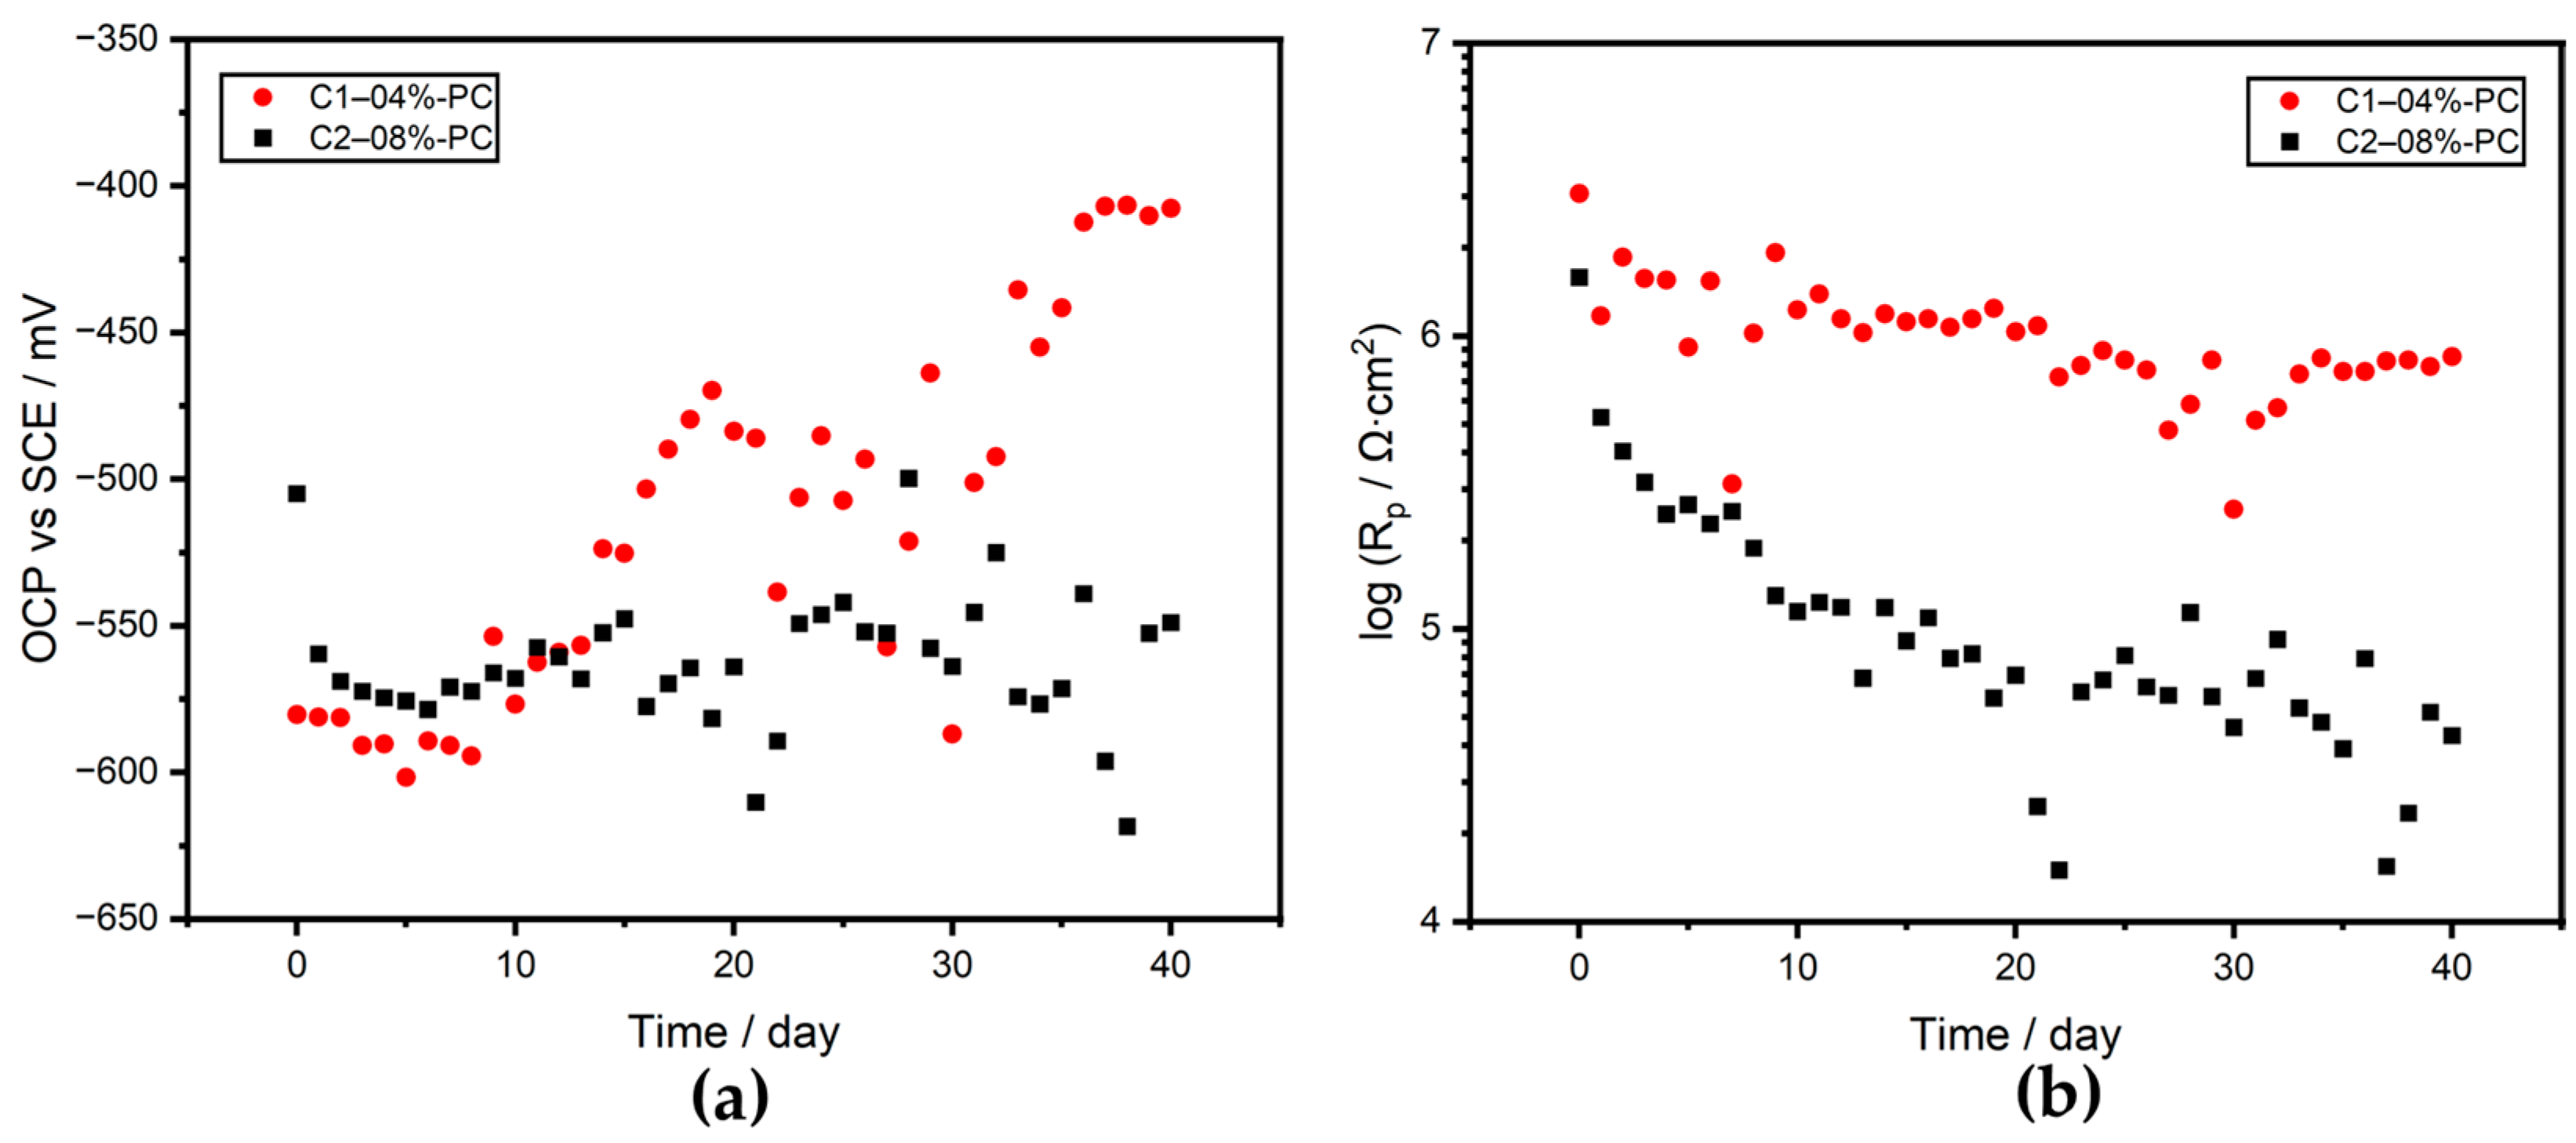
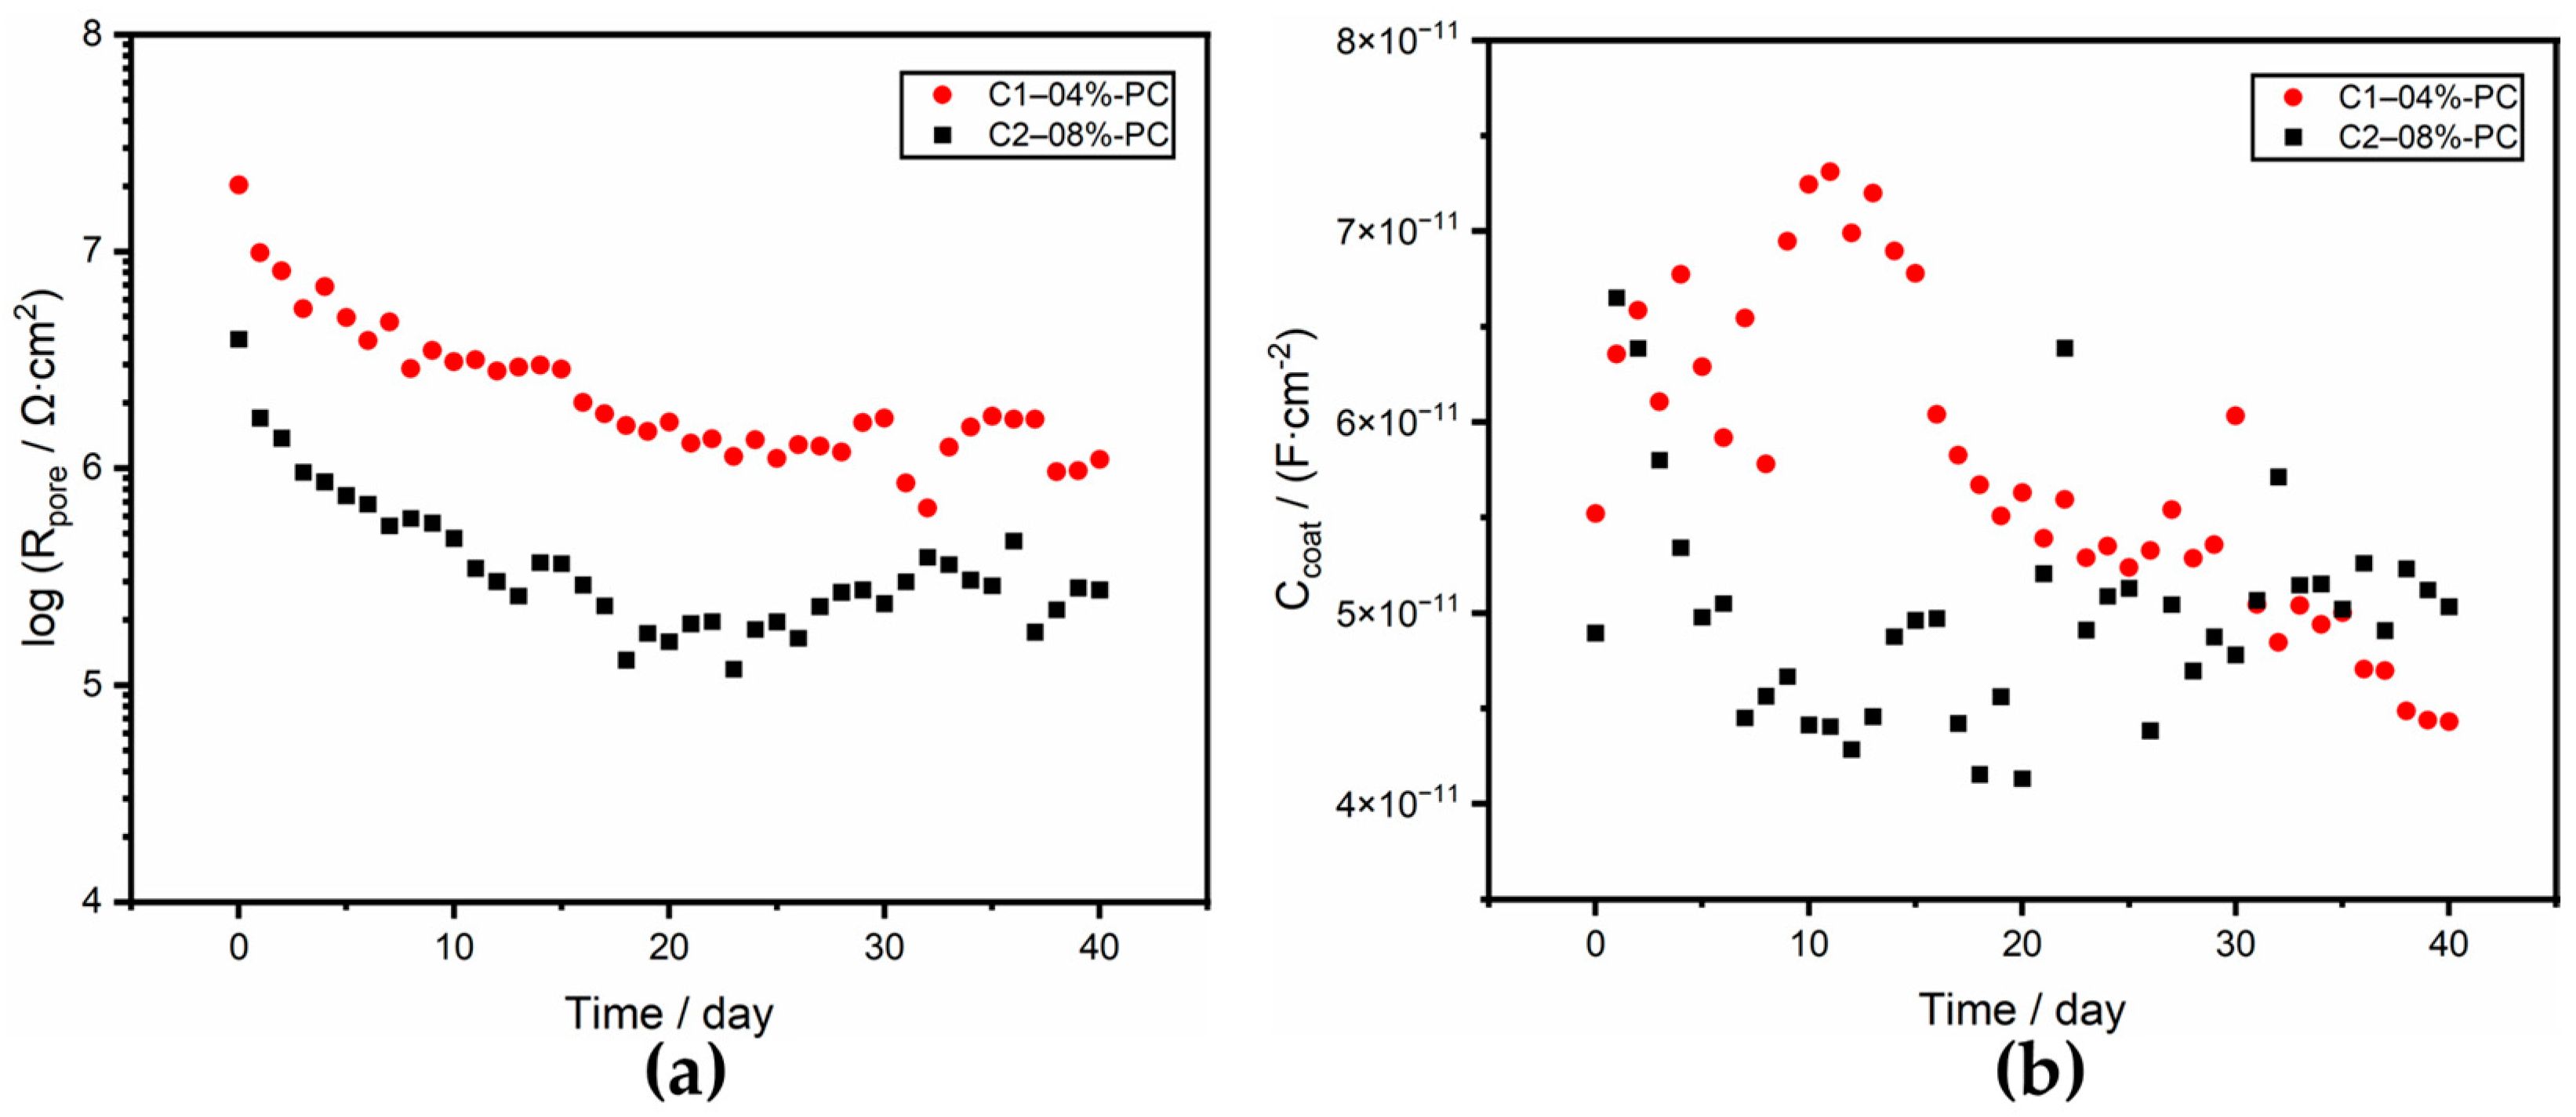
3.3.1. OCP and Rp

To evaluate the protection performance of nanoclay-containing coatings, the OCP and Rp values for all the coated sample panels were recorded as a function of immersion time. Figure 6 shows the results for Days 0–5.
The OCP value of the uncoated steel substrate decreased from −617 mVSCE to −745 mVSCE during the first 5 days of immersion, with visible corrosion and discoloration observed after only 15 min in the electrolyte. The coated panels exhibited higher OCP and Rp values than the substrate, indicating the shielding effect of coating films. The stochastic layer-by-layer clay particle swelling and expansion at different depths inside the coating films caused fluctuations in both OCP and Rp. The decrease in both values over time indicated continuous electrolyte ingress into the coating films.
Figure 7 shows the OCP and Rp values of coatings with C1 4% and C2 8% over a prolonged immersion of 40 days. Coatings with higher OCP values also had higher Rp values, indicating stronger protection. The coatings with nanoclay particles of larger size exhibited a stronger barrier effect than those with smaller size. The optimal dosages for nanoclays C1 and C2 were found to be 4% and 8%, respectively, based on significantly higher OCP and Rp values. At the high dosage of 16%, both values for the two series were significantly lower than those of other formulae, including the clearcoat (Control-PC), due to increased porosity and severity of defects within the coating film, which agreed with the transition of the coating morphology.

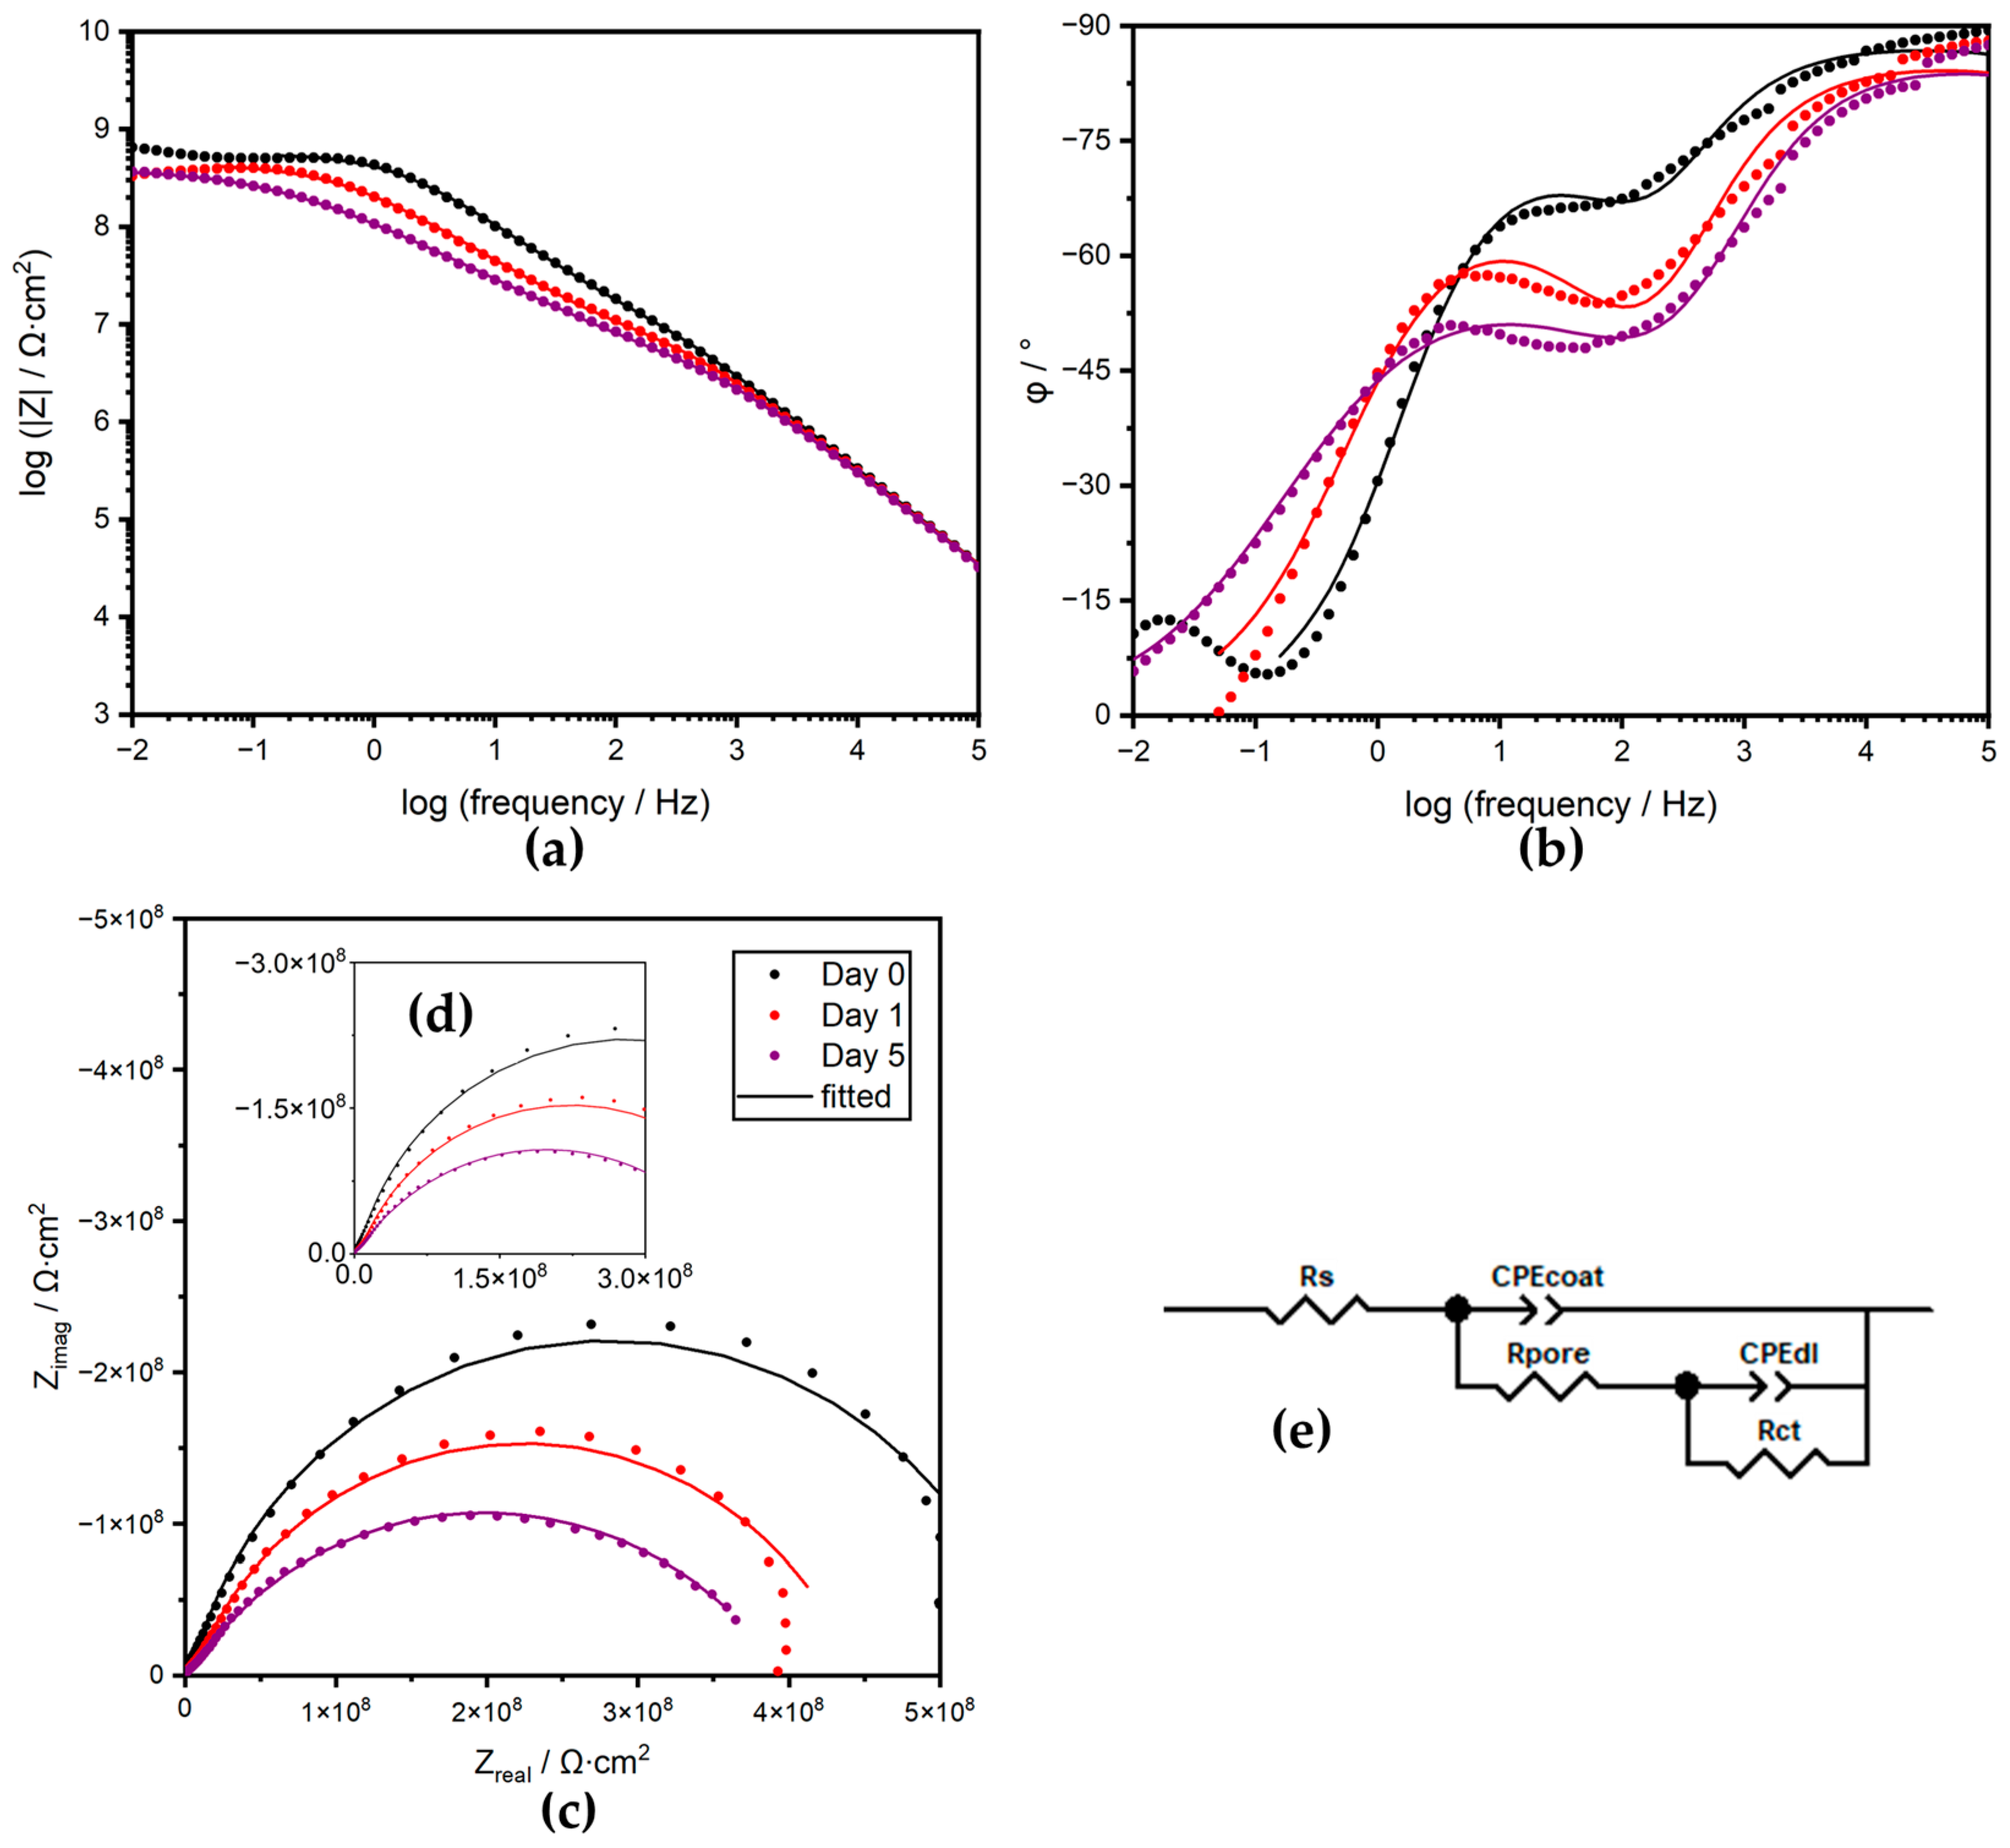
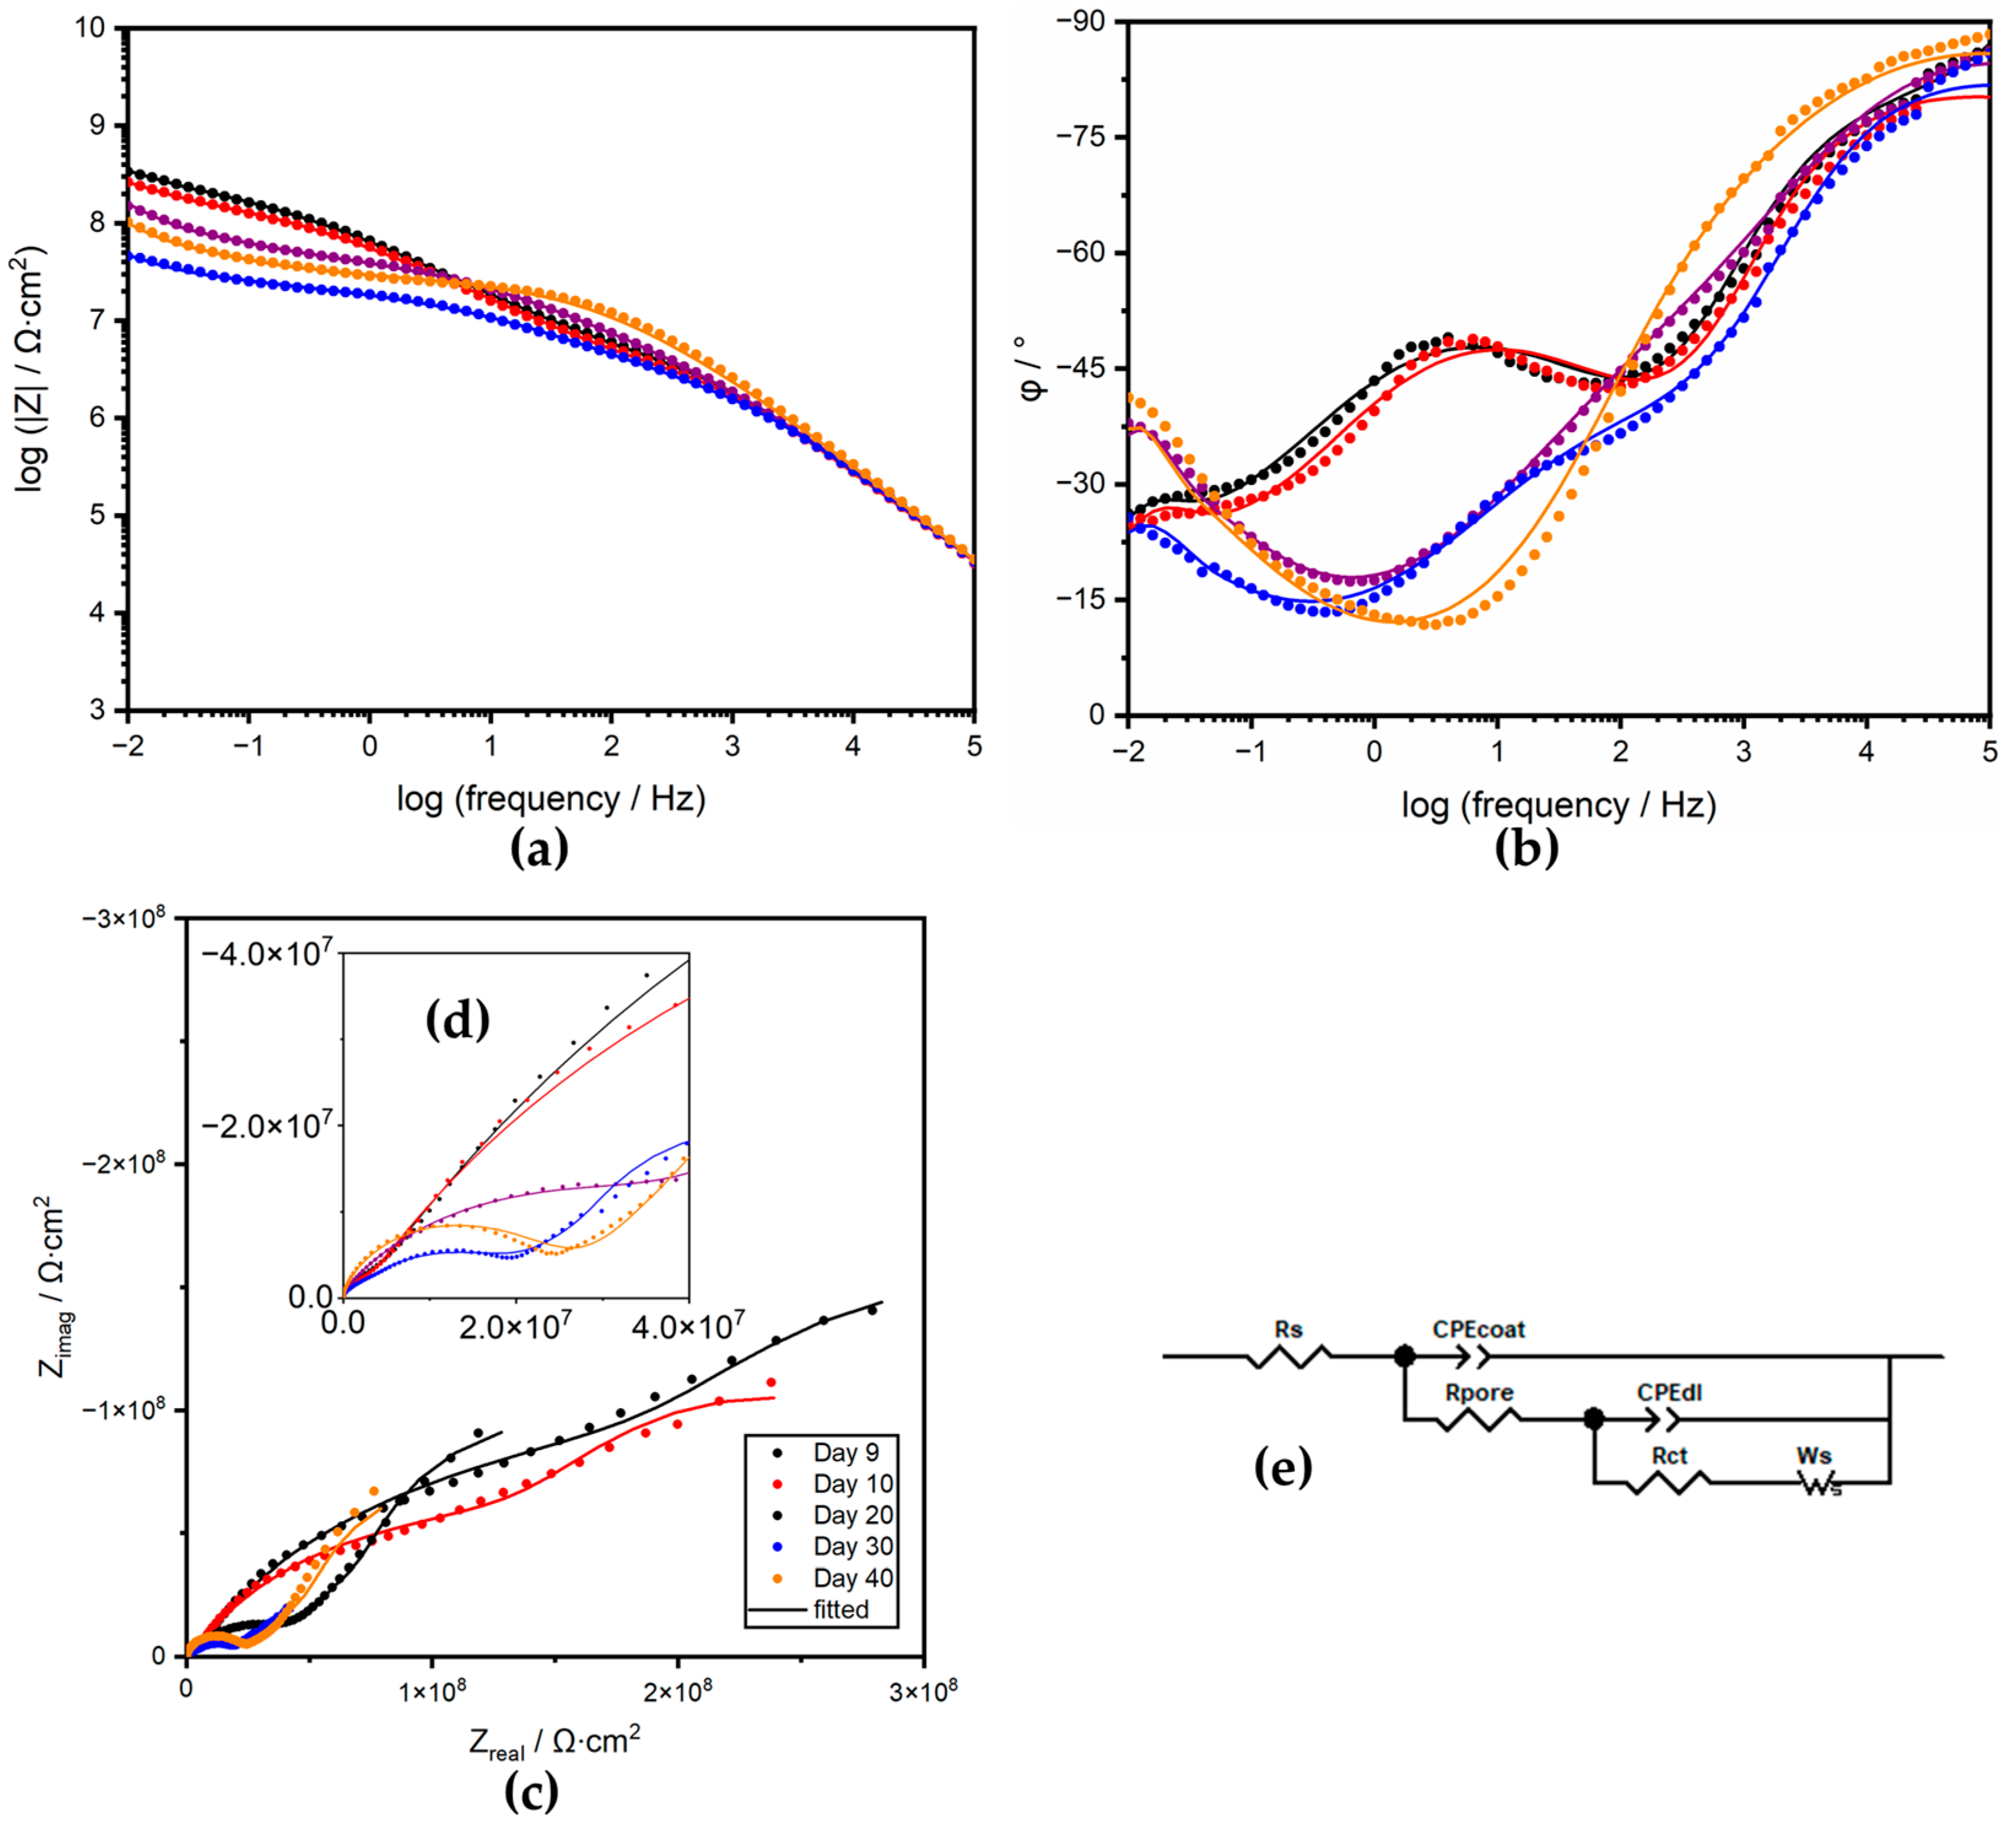
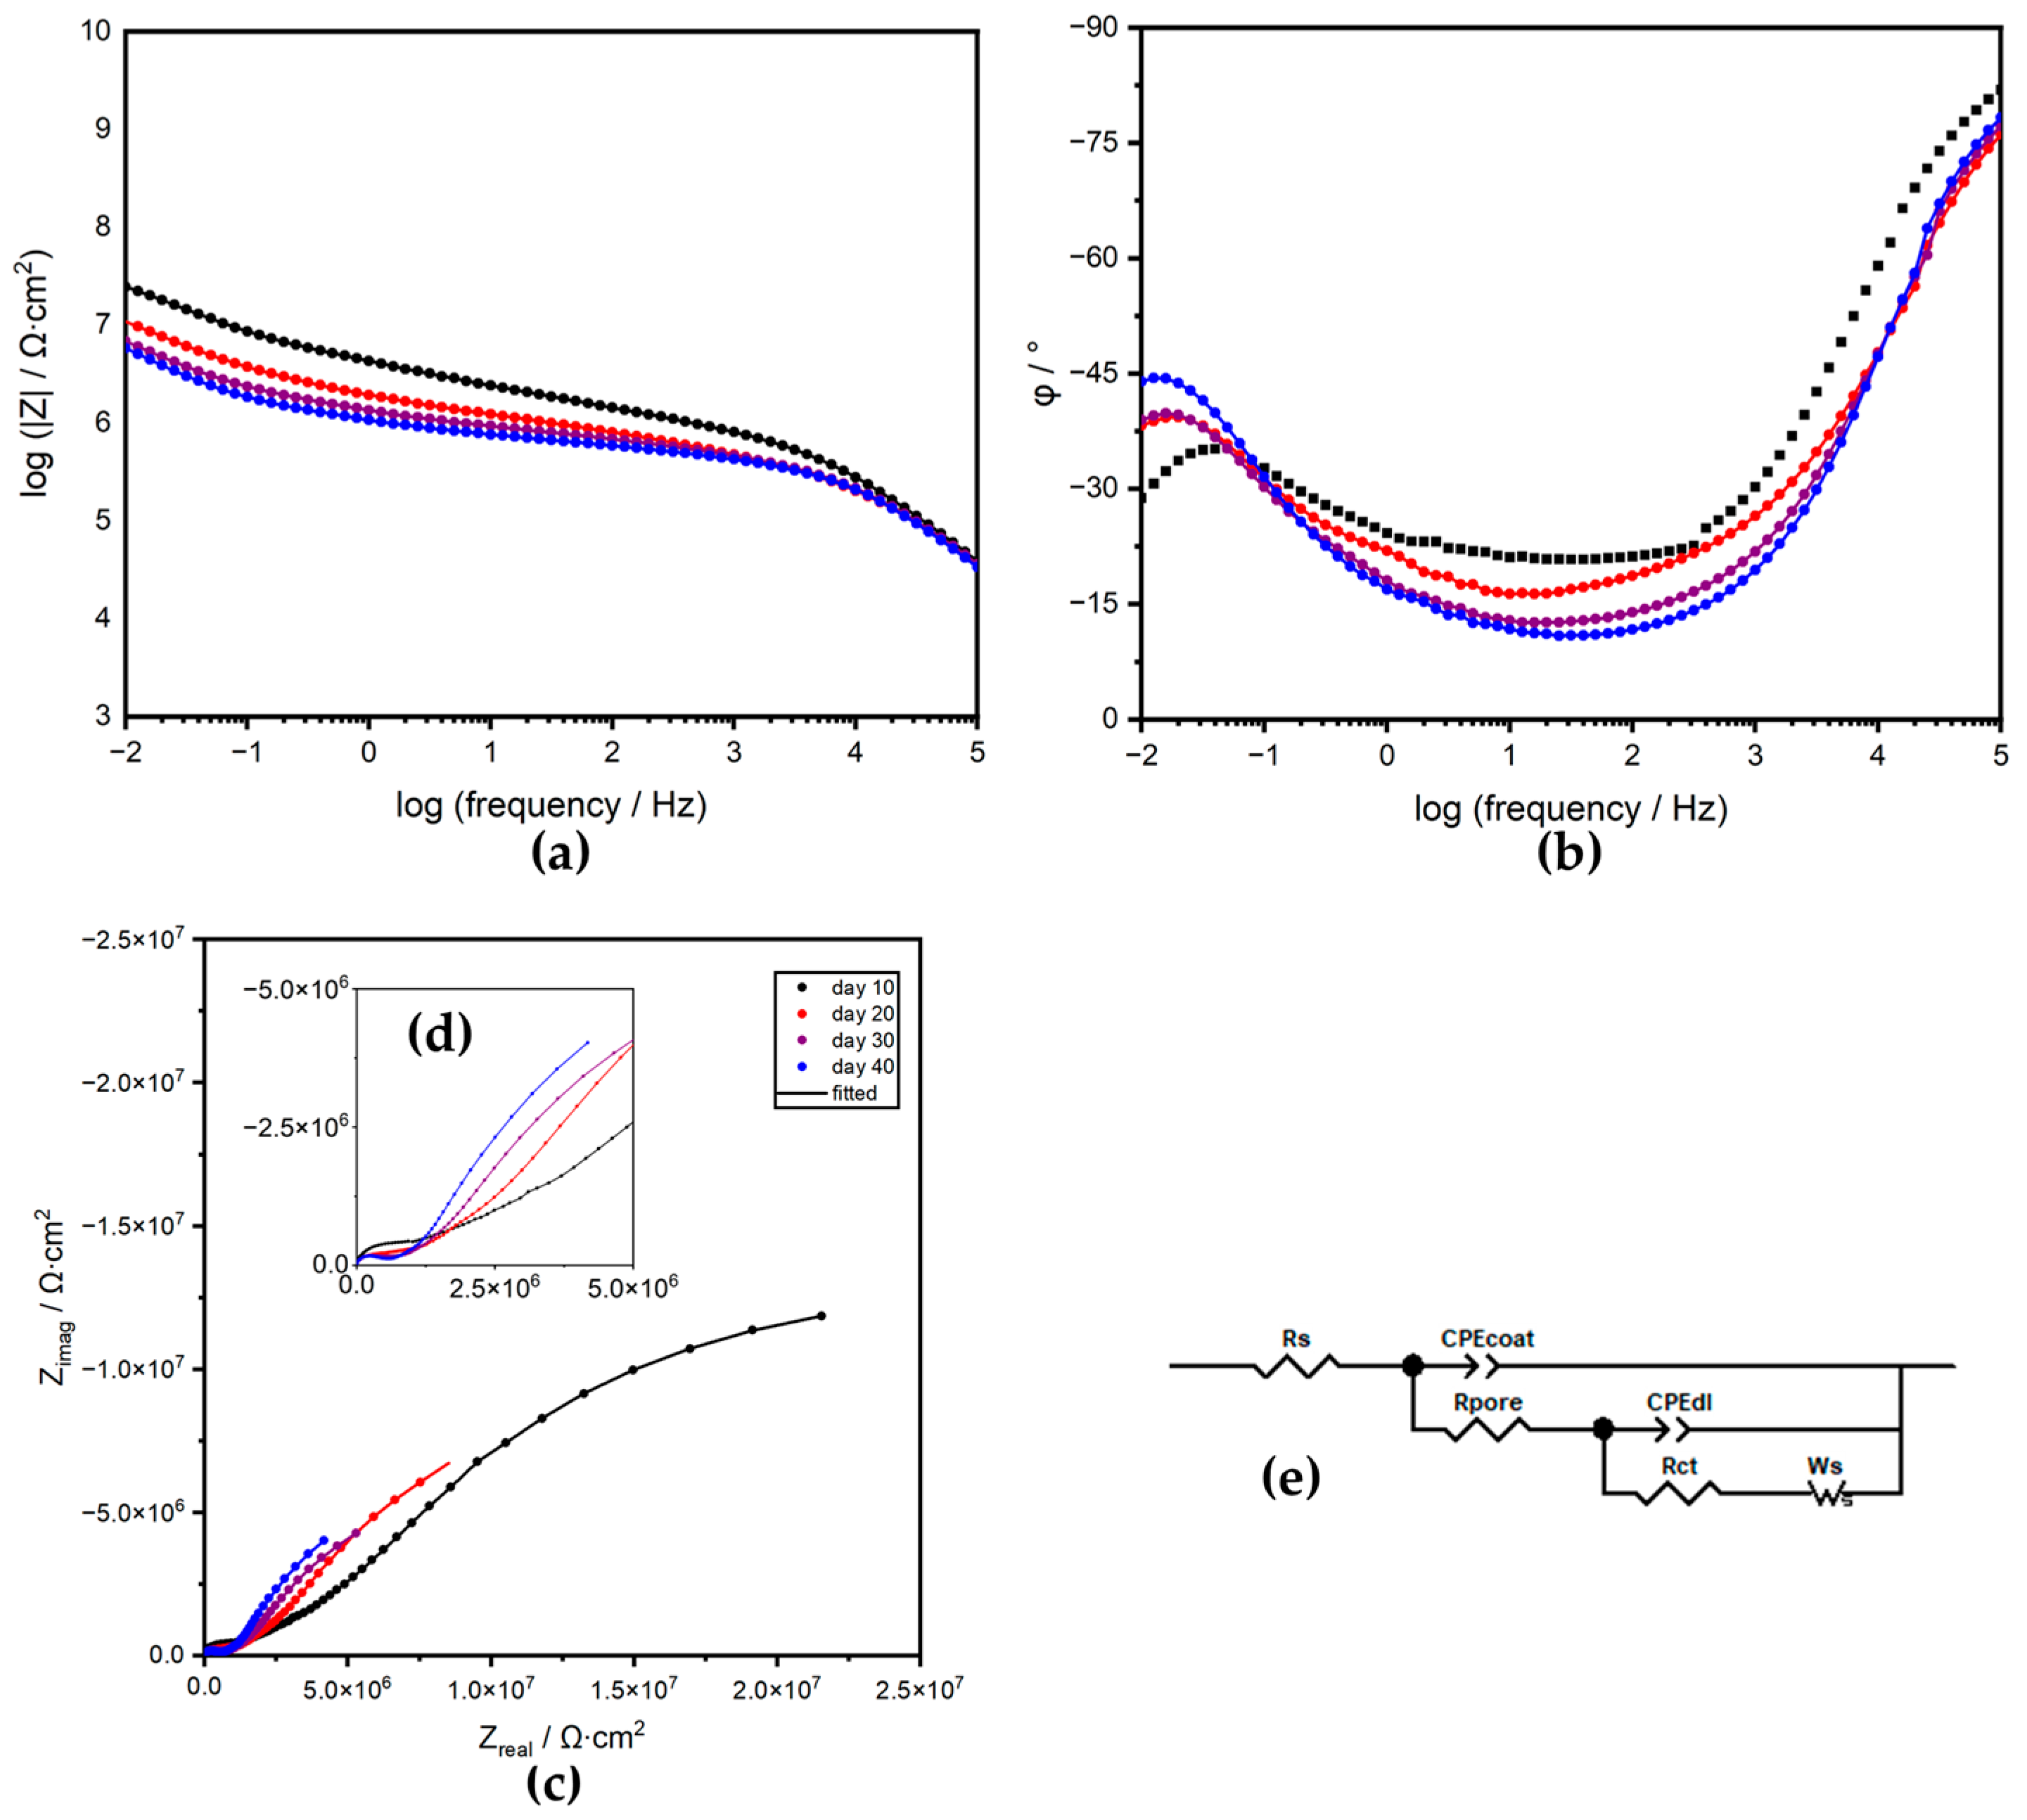
3.3.2. Electrical Equivalent Circuit Analysis

EIS measurements were carried out for 40 days on two specimens covered by coatings with the optimal additive dosages, until both test panels reached a rust grade of 9-G (0.03% rusted) in the general rusting category, in accordance with ASTM D610 [81]. The EIS spectra of the specimen C1–04%-PC are shown in Figure 8a–d and Figure 9a–d. Two equivalent electrical circuits (EECs, Figure 8e and Figure 9e) were employed to fit the EIS data, and the values obtained, along with each χ2 goodness of fitting, are listed in Table 4.
The Nyquist plots revealed that the coating film exhibited two transition stages. The coating film exhibited a pure barrier effect during the first eight days. To fit these spectra, the equivalent electrical circuits shown in Figure 8e were used, comprising electrical components such as Rs, Rpore, and Rct, which represent the solution (electrolyte) resistance, coating pore resistance, and charge transfer resistance at the electrolyte/substrate interface, respectively. Additionally, two constant phase elements (CPEs)—namely CPEcoat and CPEdl, as defined in Equation (6)—were used instead of the coating capacitance and double layer capacitance to obtain good fits, mainly due to the inhomogeneity of the coating structure and involved interfaces [84]. The equivalent electrical circuits are superimposed with the coating structure, as shown in Figure 10a,b,
Z ω = 1 Q j ω α
where Q and α are the CPE parameters, j the imaginary unit (j2 = −1), and 0 < α ≤ 1. When α = 0, the CPE shows pure resistance, and when α = 1, the CPE shows pure capacitance.
Higher impedance modulus at low frequency, a phase angle closer to −90° at high frequency, and a lower breakpoint frequency (the frequency at which the phase angle φ = –45°) correspond to a stronger barrier effect [44,63,85]. Generally, Rpore has a strong correlation with the long-term protective performance of coating films [62,65] and can also be used as an indicator of coating transition. All the fitted CPEcoat values from the fitting procedure were converted into coating capacitance using the Hsu and Mansfeld method [86]. The calculated Ccoat values were plotted in Figure 11 with the Rpore values.
For the spectra collected between Days 9 and 40, the Nyquist plots showed angles of 45° and above 45° in the low-frequency region, indicating the diffusion of Fe2+ or oxygen [44]. The EEC in Figure 9e was used, and a generalized Warburg element with a short terminus [87], defined in Equation (7), was added in series with Rct,
Z w s = R D tanh j ω T D P j ω T D P
in which T D = l 2 D , R D = σ l D , where σ is the Warburg coefficient, l is the effective diffusion layer thickness, D is the effective diffusion coefficient of the migrating species, and P is the exponential factor of the Warburg element.
Over the course of the immersion test, the Rpore value decreased with time in an exponential decay pattern, indicating the progression of electrolyte ingress. However, the coating capacitance did not follow the previously reported pattern, in which the value increased with the ingress and reached a plateau after saturation and then went up again when coating film delamination increased the exposed substrate area [88]. In this nanoclay-containing coating film, the Rpore value decreased to a stable value around Day 10, and during the same period, the Ccoat value increased, as the electrolyte-filled channels had much higher capacitance than the solid polymer. It is possible that the end of this stage was caused by the saturation of the coating film with electrolyte. As a result, the Rct value slowly decreased due to coating delamination and the propagation of under-coating corrosion.
Between Days 9 and 40, the Rpore value decreased slightly, while the Ccoat value also decreased. However, the compression of the space between the nanoclay particle surfaces and the surrounding polymer matrix due to the expansion and swelling of the nanoclay particles made it impossible to estimate the water content using the Brasher–Kingsbury method (Equation (2)). This unusual phenomenon demonstrated that the cracks in the coating films after the immersion tests were caused by the densification of the coating film structure and the partial squeezing of the electrolyte pathways, as schematized in Figure 10c,d.
The coatings prepared from the formula C2–08%-PC with nanoclay C2 showed the best protective capability in the C2-containing series. EIS spectra of this specimen are shown in Figure 12a–d and Figure 13a–d. EECs shown in Figure 12e and Figure 13e were employed for the data fitting. Table 5 provides a comparison of the values obtained. The fitted Rpore values for C2 were smaller than those of C1, confirming the findings from the Rp comparison. Over the prolonged immersion, the transition of the Ccoat values in Figure 11b showed the same declining pattern as that of C1. Both nanoclays expanded when in contact with the electrolyte, providing a self-repairing capability to the coating. However, the higher nanoclay dosage in the coating prepared from the formula C2–08%-PC led to more severe coating delamination, as indicated by its lower Rct values.
Overall, the coating prepared from the formula C1–04%-PC exhibited superior protective capability compared to both the control and the other formulations. The use of nanoclay particles in this coating improved its barrier properties without compromising the structural integrity of the coating. These findings suggest that the addition of nanoclay particles to coatings can be an effective strategy for improving their protective capabilities. Similar results were obtained through the breakpoint frequency analysis, as shown in Figure S1.

3.4. Neutral Salt Spray Test Results

The neutral salt spray test is a common method of evaluating the anti-corrosion performance of coatings. In this study, the tests were conducted until a mean creepage of 2 mm was reached, and the results are plotted in Figure 14k. The coating with 2% of both nanoclays exhibited the best anti-corrosive enhancement, reaching salt spray hours of 1000 h and 1500 h before reaching 2 mm creepage. However, all the higher dosages of nanoclay led to the deterioration of coating performance, as evidenced by severe delamination of the coating films alongside the scribe marks (Figure 14a–j). The incorporation of swelling nanoclay also exacerbated the adhesion loss of the coatings. Comparing the visual appearance of scribe marks, one can see that the smaller particles exhibited slightly better performance in the salt spray tests.
The corrosion products and corrosion reactions were studied by X-ray diffraction (XRD) and Raman spectroscopy, and the results are shown in Figures S2 and S3.
These results suggest that once the coating film is mechanically damaged, the nanoclay particles may not be able to inhibit the electrolyte ingress in the direction parallel to the substrate. Even though the self-repairing function imparted by the nanoclay remains the same in the coating film, it is undermined by the delamination at the mechanically exposed coating-substrate interface, as schematized in Figure 10e,f. The findings highlight the differences between the salt spray test and electrochemical measurement results, as the former only captures corrosion propagation while bypassing the coating self-repairing process induced by electrolyte ingress. In contrast, the latter measures the complete process of coating films undergoing slow changes after immersion.
We emphasize the importance of choosing the appropriate evaluation method, which depends on the working conditions of the coatings, particularly the risk of mechanical damage [10].
This study has employed long-term electrochemical (in an electrolyte solution) and salt spray (in atmosphere) testing approaches and found slightly contradicting results because the nanoclay swelling, which in some cases had a self-healing effect, required water from the electrolyte solution. This finding might imply that the self-healing effect of nanoclay-containing coatings might depend on the humidity and environmental conditions during its service life. Future studies should investigate the effects of these factors.

4. Conclusions

In conclusion, the incorporation of montmorillonite-based nanoclay particles into powder coatings can enhance their anti-corrosive properties. Larger clay particles are more effective, although they result in lower surface quality. The nanoclay particles increase the tortuosity of the coating films, while their self-repairing capability contributes to better corrosion resistance. The study also emphasizes the importance of selecting the appropriate test method for the environment of interest when evaluating coating performance. Overall, this research provides useful information for developing more effective powder coatings with improved anti-corrosive properties and longer service life.

Supplementary Materials

The following supporting information can be downloaded at: https://www.mdpi.com/article/10.3390/coatings13071220/s1, Video S1: 3D structure of the coating prepared from the formula C1–02%-PC by MicroCT; Figure S1. Lower breakpoint frequencies determined on coatings prepared from the formulae C1–04%-PC and C2–08%-PC; Figure S2. (a,b) XRD patterns and (c,d) Raman spectra of the coatings prepared from the formulae PC-Control and C1–04%-PC [89]; Figure S3. Corrosion reactions of the steel substrate under the coating films.

Author Contributions

Conceptualization, M.S.Y. and H.Z. (Hui Zhang); data curation, M.S.Y., J.H., and J.C.; formal analysis, M.S.Y., J.H., J.C., J.D.H., J.J.N. and C.X.; funding acquisition, H.Z. (Hui Zhang); investigation, M.S.Y., J.H., J.C., and I.B.; methodology, M.S.Y., J.H., J.C., H.Z. (Hui Zhang), J.J.N. and C.X.; project administration, H.Z. (Hui Zhang), J.Z., H.Z. (Haiping Zhang), and J.J.N.; resources, J.C., J.J.N., I.B., and H.Z. (Hui Zhang); software, M.S.Y. and J.D.H.; supervision, H.Z. (Hui Zhang), Y.S.H., J.Z., and J.J.N.; validation, M.S.Y., J.H., J.C., H.Z. (Haiping Zhang), J.D.H., U.E., J.J.N. and C.X.; visualization, M.S.Y. and I.B.; writing—original draft, M.S.Y.; writing—review and editing, Y.S.H., J.H., J.C., U.E., J.J.N., C.X. and H.Z. (Hui Zhang). All authors have read and agreed to the published version of the manuscript.

Funding

This research was funded in part by: The Natural Sciences and Engineering Research Council of Canada (NSERC) Discovery Grants, grant numbers RGPIN-2018-06672, DGDND-2021-03997, RGPIN-2020-06856, and RGPIN-2018-06256; the Canada Research Chairs Program, grant number CRC-2019-00425; and the Wolfe–Western Fellowship, grant number 2020.

Institutional Review Board Statement

Not applicable.

Informed Consent Statement

Not applicable.

Data Availability Statement

Not applicable.

Acknowledgments

The authors would like to express gratitude for the technical support provided by the specialists at Surface Science Western (www.surfacesciencewestern.com) and the Department of Chemistry, Western University (The University of Western Ontario).

Conflicts of Interest

The authors declare no conflict of interest.

References

  1. Sørensen, P.A.; Kiil, S.; Dam-Johansen, K.; Weinell, C.E. Anti-corrosive Coatings: A Review. J. Coat. Technol. Res. 2009, 6, 135–176. [Google Scholar] [CrossRef]
  2. Fotovvati, B.; Namdari, N.; Dehghanghadikolaei, A. On Coating Techniques for Surface Protection: A Review. J. Manuf. Mater. Process. 2019, 3, 28. [Google Scholar] [CrossRef]
  3. Zhang, H.; Yang, M.S.; Bhuiyan, M.T.I.; Zhu, J. CHAPTER 15: Green Chemistry for Automotive Coatings: Sustainable Applications; The Royal Society of Chemistry: London, UK, 2019; Volume 2019, ISBN 9781782629948. [Google Scholar]
  4. Crapper, G. Powder Coatings. Polymer Science: A Comprehensive Reference; Elsevier: Amsterdam, The Netherlands, 2012; Volume 10, pp. 541–566. ISBN 9780080878621. [Google Scholar]
  5. Turner, S.; Baskir, J.; Nunez, C. Powder Coatings: A Technology Review. Pollut. Prev. Rev. 1999, Spring, 7–21. [Google Scholar]
  6. Schoff, C.K. Organic Coatings: The Paradoxical Materials. Prog. Org. Coat. 2005, 52, 21–27. [Google Scholar] [CrossRef]
  7. Misev, T.A.; Van Der Linde, R. Powder Coatings Technology: New Developments at the Turn of the Century. Prog. Org. Coat. 1997, 34, 160–168. [Google Scholar] [CrossRef]
  8. Liberto, N. Powder Coatings: Not Just Another Pretty Finish. Powder Coat. 2011, 1–7. [Google Scholar]
  9. Spyrou, E. Powder Coatings: Chemistry and Technology, 3rd Revise ed.; Vincentz Network GmbH & Co KG: Hannover, Germany, 2012; ISBN 978-3-86630-824-4. [Google Scholar]
  10. Yang, S.; Huang, J.; Chen, J.; Noël, J.J.; Barker, I.; Henderson, J.D.; He, P.; Zhang, H.; Zhang, H.; Zhu, J. A Comparative Study on the Anti-Corrosive Performance of Zinc Phosphate in Powder Coatings. Coatings 2022, 12, 217. [Google Scholar] [CrossRef]
  11. Huttunen-Saarivirta, E.; Vaganov, G.V.; Yudin, V.E.; Vuorinen, J. Characterization and Corrosion Protection Properties of Epoxy Powder Coatings Containing Nanoclays. Prog. Org. Coat. 2013, 76, 757–767. [Google Scholar] [CrossRef]
  12. Farshchi, N.; Gedan-Smolka, M. Polyurethane Powder Coatings: A Review of Composition and Characterization. Ind. Eng. Chem. Res. 2020, 59, 15121–15132. [Google Scholar] [CrossRef]
  13. Tan, B.; Thomas, N.L. Tortuosity Model to Predict the Combined Effects of Crystallinity and Nano-Sized Clay Mineral on the Water Vapour Barrier Properties of Polylactic Acid. Appl. Clay Sci. 2017, 141, 46–54. [Google Scholar] [CrossRef]
  14. Uddin, F. Clays, Nanoclays, and Montmorillonite Minerals. Metall. Mater. Trans. A Phys. Metall. Mater. Sci. 2008, 39, 2804–2814. [Google Scholar] [CrossRef]
  15. Wang, N.; Cheng, K.; Wu, H.; Wang, C.; Wang, Q.; Wang, F. Effect of Nano-Sized Mesoporous Silica MCM-41 and MMT on Corrosion Properties of Epoxy Coating. Prog. Org. Coat. 2012, 75, 386–391. [Google Scholar] [CrossRef]
  16. Al-Shahrani, A.; Taie, I.; Fihri, A.; Alabedi, G. Polymer-Clay Nanocomposites for Corrosion Protection. In Current Topics in the Utilization of Clay in Industrial and Medical Applications; InTech: London, UK, 2018. [Google Scholar] [CrossRef]
  17. Kotal, M.; Bhowmick, A.K. Polymer Nanocomposites from Modified Clays: Recent Advances and Challenges. Prog. Polym. Sci. 2015, 51, 127–187. [Google Scholar] [CrossRef]
  18. Ganjaee Sari, M.; Shamshiri, M.; Ramezanzadeh, B. Fabricating an Epoxy Composite Coating with Enhanced Corrosion Resistance through Impregnation of Functionalized Graphene Oxide-Co-Montmorillonite Nanoplatelet. Corros. Sci. 2017, 129, 38–53. [Google Scholar] [CrossRef]
  19. Szociński, M.; Darowicki, K. Performance of Zinc-Rich Coatings Evaluated Using AFM-Based Electrical Properties Imaging. Prog. Org. Coat. 2016, 96, 58–64. [Google Scholar] [CrossRef]
  20. Ding, R.; Li, W.; Wang, X.; Gui, T.; Li, B.; Han, P.; Tian, H.; Liu, A.; Wang, X.; Liu, X.; et al. A Brief Review of Corrosion Protective Films and Coatings Based on Graphene and Graphene Oxide. J. Alloys Compd. 2018, 764, 1039–1055. [Google Scholar] [CrossRef]
  21. Zheng, H.; Shao, Y.; Wang, Y.; Meng, G.; Liu, B. Reinforcing the Corrosion Protection Property of Epoxy Coating by Using Graphene Oxide–Poly(Urea–Formaldehyde) Composites. Corros. Sci. 2017, 123, 267–277. [Google Scholar] [CrossRef]
  22. Giménez, R.; Serrano, B.; San-Miguel, V.; Cabanelas, J.C. Recent Advances in MXene/Epoxy Composites: Trends and Prospects. Polymers 2022, 14, 1170. [Google Scholar] [CrossRef]
  23. Navarchian, A.H.; Joulazadeh, M.; Karimi, F. Investigation of Corrosion Protection Performance of Epoxy Coatings Modified by Polyaniline/Clay Nanocomposites on Steel Surfaces. Prog. Org. Coat. 2014, 77, 347–353. [Google Scholar] [CrossRef]
  24. Arianpouya, N.; Shishesaz, M.; Arianpouya, M.; Nematollahi, M. Evaluation of Synergistic Effect of Nanozinc/Nanoclay Additives on the Corrosion Performance of Zinc-Rich Polyurethane Nanocomposite Coatings Using Electrochemical Properties and Salt Spray Testing. Surf. Coat. Technol. 2013, 216, 199–206. [Google Scholar] [CrossRef]
  25. Faheem, U. Montmorillonite: An Introduction to Properties and Utilization; InTech: London, UK, 2016; Volume 1, p. 13. [Google Scholar] [CrossRef]
  26. Williams, G.; McMurray, H.N. Inhibition of Corrosion Driven Delamination on Iron by Smart-Release Bentonite Cation-Exchange Pigments Studied Using a Scanning Kelvin Probe Technique. Prog. Org. Coat. 2017, 102, 18–28. [Google Scholar] [CrossRef]
  27. Mills, D.J.; Jamali, S.S. The Best Tests for Anti-Corrosive Paints. And Why: A Personal Viewpoint. Prog. Org. Coat. 2017, 102, 8–17. [Google Scholar] [CrossRef]
  28. Grundmeier, G.; Schmidt, W.; Stratmann, M. Corrosion Protection by Organic Coatings: Electrochemical Mechanism and Novel Methods of Investigation. Electrochim. Acta 2000, 45, 2515–2533. [Google Scholar] [CrossRef]
  29. Guo, F.; Aryana, S.; Han, Y.; Jiao, Y. A Review of the Synthesis and Applications of Polymer-Nanoclay Composites. Appl. Sci. 2018, 8, 1696. [Google Scholar] [CrossRef]
  30. Pandey, J.K.; Reddy, K.R.; Mohanty, A.K.; Misra, M. Handbook of Polymernanocomposites. Processing, Performance and Application Volume A: Layered Silicates; Springer Science & Business Media: Berlin/Heidelberg, Germany, 2014; ISBN 9783642386497. [Google Scholar]
  31. Lee, K.-S.; Kobayashi, S. (Eds.) Polymer Materials Block-Copolymers, Nanocomposites, Organic/Inorganic Hybrids, Polymethylenes; Springer: Berlin/Heidelberg, Germany, 2010; ISBN 978-3-642-13626-6. [Google Scholar]
  32. Lee, K.M.; Han, C.D. Effect of Hydrogen Bonding on the Rheology of Polycarbonate/Organoclay Nanocomposites. Polymer 2003, 44, 4573–4588. [Google Scholar] [CrossRef]
  33. Tan, B.; Thomas, N.L. A Review of the Water Barrier Properties of Polymer/Clay and Polymer/Graphene Nanocomposites. J. Membr. Sci. 2016, 514, 595–612. [Google Scholar] [CrossRef]
  34. Fischer, H. Polymer Nanocomposites: From Fundamental Research to Specific Applications. Mater. Sci. Eng. C 2003, 23, 763–772. [Google Scholar] [CrossRef]
  35. Huang, C.; Qian, X.; Yang, R. Thermal Conductivity of Polymers and Polymer Nanocomposites. Mater. Sci. Eng. R Rep. 2018, 132, 1–22. [Google Scholar] [CrossRef]
  36. Raju, A.; Lakshmi, V.; Vishnu Prataap, R.K.; Resmi, V.G.; Rajan, T.P.D.; Pavithran, C.; Prasad, V.S.; Mohan, S. Adduct Modified Nano-Clay Mineral Dispersed Polystyrene Nanocomposites as Advanced Corrosion Resistance Coatings for Aluminum Alloys. Appl. Clay Sci. 2016, 126, 81–88. [Google Scholar] [CrossRef]
  37. Miccichè, F.; Fischer, H.; Varley, R.; van der Zwaag, S. Moisture Induced Crack Filling in Barrier Coatings Containing Montmorillonite as an Expandable Phase. Surf. Coat. Technol. 2008, 202, 3346–3353. [Google Scholar] [CrossRef]
  38. Seyedmehdi, S.A.; Zhang, H.; Zhu, J. Effect of Nanoclay on Electrical and Mechanical Properties of Polyurethane Conductive Coatings Filled with Nickel-Coated Carbon Fibers. Polym. Eng. Sci. 2014, 54, 1120–1125. [Google Scholar] [CrossRef]
  39. Mirabedini, S.M.; Kiamanesh, A. The Effect of Micro and Nano-Sized Particles on Mechanical and Adhesion Properties of a Clear Polyester Powder Coating. Prog. Org. Coat. 2013, 76, 1625–1632. [Google Scholar] [CrossRef]
  40. Feller, J.F.; Bruzaud, S.; Grohens, Y. Influence of Clay Nanofiller on Electrical and Rheological Properties of Conductive Polymer Composite. Mater. Lett. 2004, 58, 739–745. [Google Scholar] [CrossRef]
  41. Tyagi, S.; Ray, A.K.; Sood, Y.V. Surface Characteristics of Coating Layers Formed by Coating Pigments with Different Particle Sizes and Size Distribution. J. Coat. Technol. Res. 2010, 7, 747–756. [Google Scholar] [CrossRef]
  42. Kalendová, A. Effects of Particle Sizes and Shapes of Zinc Metal on the Properties of Anti-corrosive Coatings. Prog. Org. Coat. 2003, 46, 324–332. [Google Scholar] [CrossRef]
  43. Bierwagen, G.P.; Sanders, T.E. Studies of the Effects of Particle Size Distribution on the Packing Efficiency of Particles. Powder Technol. 1974, 10, 111–119. [Google Scholar] [CrossRef]
  44. Scully, J.R. Electrochemical Impedance of Organic-Coated Steel: Correlation of Impedance Parameters with Long-Term Coating Deterioration. J. Electrochem. Soc. 1989, 136, 979–990. [Google Scholar] [CrossRef]
  45. Ma, J.; Xu, J.; Gu, L.; Lai, G.; Chen, B.; Liu, S.; Zhao, H. Corrosion resistance of UV-cured urethane acrylate coatings containing dibutyl-substituted poly (3, 4-propylenedioxythiophene) as a corrosion inhibitor. Int. J. Electrochem. Sci. 2015, 10, 10104–10118. [Google Scholar] [CrossRef]
  46. Cubides, Y.; Castaneda, H. Corrosion Protection Mechanisms of Carbon Nanotube and Zinc-Rich Epoxy Primers on Carbon Steel in Simulated Concrete Pore Solutions in the Presence of Chloride Ions. Corros. Sci. 2016, 109, 145–161. [Google Scholar] [CrossRef]
  47. Sekine, I. Recent Evaluation of Corrosion Protective Paint Films by Electrochemical Methods. Prog. Org. Coat. 1997, 31, 73–80. [Google Scholar] [CrossRef]
  48. Sykes, J.M. A Variant of the Brasher-Kingsbury Equation. Corros. Sci. 2004, 46, 515–517. [Google Scholar] [CrossRef]
  49. Sharma, M.; Gao, S.; Mäder, E.; Sharma, H.; Wei, L.Y.; Bijwe, J. Carbon Fiber Surfaces and Composite Interphases. Compos. Sci. Technol. 2014, 102, 35–50. [Google Scholar] [CrossRef]
  50. ASTM D609-00; Standard Practice for Preparation of Cold-Rolled Steel Panels for Testing Paint, Varnish, Conversion Coatings, and Related Coating Products. ASTM International: West Conshohocken, PA, USA, 2017; pp. 1–3.
  51. ASTM D7091-13; Standard Practice for Nondestructive Measurement of Dry Film Thickness of Nonmagnetic Coatings Applied to Ferrous Metals and Nonmagnetic, Nonconductive Coatings Applied to Non-Ferrous Metals. ASTM International: West Conshohocken, PA, USA, 2013; pp. 1–7.
  52. ASTM D523; Standard Test Method for Specular Gloss. ASTM International: West Conshohocken, PA, USA, 2014; pp. 1–5.
  53. ASTM D5767-18; Standard Test Method for Instrumental Measurement of Distinctness-of-Image (DOI) Gloss of Coated Surfaces. ASTM International: West Conshohocken, PA, USA, 2018; pp. 1–7.
  54. ASTM D3359; Standard Test Methods for Measuring Adhesion by Tape Test. ASTM International: West Conshohocken, PA, USA, 2009; pp. 1–8.
  55. ASTM D3363-05; Standard Test Method for Film Hardness by Pencil Test. ASTM International: West Conshohocken, PA, USA, 2005.
  56. ASTM D 2794; Standard Test Method for Resistance of Organic Coatings to the Effects of Rapid Deformation (Impact). ASTM International: West Conshohocken, PA, USA, 1993.
  57. ASTM B 117; Standard Practice for Operating Salt Spray (Fog) Apparatus. ASTM International: West Conshohocken, PA, USA, 2016.
  58. ASTM D1654; Standard Test Method for Evaluation of Painted or Coated Specimens Subjected to Corrosive Environments. ASTM International: West Conshohocken, PA, USA, 2008; pp. 1–4.
  59. Hack, H.P.; Scully, J.R. Defect Area Determination of Organic Coated Steels in Seawater Using the Breakpoint Frequency Method. J. Electrochem. Soc. 1991, 138, 233–238. [Google Scholar] [CrossRef]
  60. McIntyre, J.M.; Pham, H.Q. Electrochemical Impedance Spectroscopy; a Tool for Organic Coatings Optimizations. Prog. Org. Coat. 1996, 27, 201–207. [Google Scholar] [CrossRef]
  61. Musiani, M.; Orazem, M.E.; Pébère, N.; Tribollet, B.; Vivier, V. Determination of Resistivity Profiles in Anti-Corrosion Coatings from Constant-Phase-Element Parameters. Prog. Org. Coat. 2014, 77, 2076–2083. [Google Scholar] [CrossRef]
  62. Croll, S.G. Electrolyte Transport in Polymer Barrier Coatings: Perspectives from Other Disciplines. Prog. Org. Coat. 2018, 124, 41–48. [Google Scholar] [CrossRef]
  63. Scully, J.R.; Hensley, S.T. Lifetime Prediction for Organic Coatings on Steel and a Magnesium Alloy Using Electrochemical Impedance Methods. Corrosion 1994, 50, 705–716. [Google Scholar] [CrossRef]
  64. Tsai, C.H.; Mansfeld, F. Determination of Coating Deterioration with EIS: Part II. Development of a Method for Field Testing of Protective Coatings. Corrosion 1993, 49, 726–737. [Google Scholar] [CrossRef]
  65. Kelly, R.G.; Scully, J.R.; Shoesmith, D.; Buchheit, R.G. Electrochemical Techniques in Corrosion Science and Engineering; CRC Press: Boca Raton, FL, USA, 2002; ISBN 9780203909133. [Google Scholar]
  66. Yuan, X.; Yue, Z.F.; Chen, X.; Wen, S.F.; Li, L.; Feng, T. EIS Study of Effective Capacitance and Water Uptake Behaviors of Silicone-Epoxy Hybrid Coatings on Mild Steel. Prog. Org. Coat. 2015, 86, 41–48. [Google Scholar] [CrossRef]
  67. Mansfeld, F.; Buchheit, R.G.; Cunningham, M.; Jensen, H.; Kendig, M.; Martinez, M.A. Discussion: A Correlation between Salt Spray and Electrochemical Impedance Spectroscopy Test Results for Conversion-Coated Aluminum Alloys. Corrosion 1998, 54, 595–597. [Google Scholar] [CrossRef]
  68. Moreno, C.; Hernández, S.; Santana, J.J.; González-Guzmán, J.; Souto, R.M.; González, S. Characterization of Water Uptake by Organic Coatings Used for the Corrosion Protection of Steel as Determined from Capacitance Measurements. Int. J. Electrochem. Sci. 2012, 7, 8444–8457. [Google Scholar] [CrossRef]
  69. Brasher, D.M.; Kingsbury, A.H. Electrical Measurements in the Study of Immersed Paint Coatings on Metal. I. Comparison between Capacitance and Gravimetric Methods of Estimating Water-Uptake. J. Appl. Chem. 1954, 4, 62. [Google Scholar] [CrossRef]
  70. Miszczyk, A.; Darowicki, K. Water Uptake in Protective Organic Coatings and Its Reflection in Measured Coating Impedance. Prog. Org. Coat. 2018, 124, 296–302. [Google Scholar] [CrossRef]
  71. Deflorian, F.; Fedrizzi, L.; Bonora, P.L. Determination of the Reactive Area of Organic Coated Metals Using the Breakpoint Method. Corrosion 1994, 50, 741–743. [Google Scholar] [CrossRef]
  72. Yin, K.M.; Lu, L.I. Parametric Study on the Electrochemical Impedance Spectroscopy of Organic-Coated Steels in Hydrochloric Acid Solutions. J. Coat. Technol. 2003, 75, 65–72. [Google Scholar] [CrossRef]
  73. Sahu, S.C.; Samantara, A.K.; Seth, M.; Parwaiz, S.; Singh, B.P.; Rath, P.C.; Jena, B.K. A Facile Electrochemical Approach for Development of Highly Corrosion Protective Coatings Using Graphene Nanosheets. Electrochem. Commun. 2013, 32, 22–26. [Google Scholar] [CrossRef]
  74. Liu, J.; Liu, T.; Guo, Z.; Guo, N.; Lei, Y.; Chang, X.; Yin, Y. Promoting Barrier Performance and Cathodic Protection of Zinc-Rich Epoxy Primer via Single-Layer Graphene. Polymers 2018, 10, 591. [Google Scholar] [CrossRef]
  75. Song, Z.; Qian, B. Effect of Graphene on the Electrochemical Protection of Zinc-Rich Coatings. Mater. Corros. 2018, 69, 1854–1860. [Google Scholar] [CrossRef]
  76. Liu, S.; Gu, L.; Zhao, H.; Chen, J.; Yu, H. Corrosion Resistance of Graphene-Reinforced Waterborne Epoxy Coatings. J. Mater. Sci. Technol. 2016, 32, 425–431. [Google Scholar] [CrossRef]
  77. Walter, G.W. A Critical Review of d.c. Electrochemical Tests for Painted Metals. Corros. Sci. 1986, 26, 39–47. [Google Scholar] [CrossRef]
  78. Ding, J.; Zhao, H.; Xu, B.; Zhao, X.; Su, S.; Yu, H. Superanticorrosive Graphene Nanosheets through π Deposition of Boron Nitride Nanodots. ACS Sustain. Chem. Eng. 2019, 7, 10900–10911. [Google Scholar] [CrossRef]
  79. Ye, Y.; Zhang, D.; Li, J.; Liu, T.; Pu, J.; Zhao, H.; Wang, L. One-Step Synthesis of Superhydrophobic Polyhedral Oligomeric Silsesquioxane-Graphene Oxide and Its Application in Anti-Corrosion and Anti-Wear Fields. Corros. Sci. 2019, 147, 9–21. [Google Scholar] [CrossRef]
  80. Askari, F.; Ghasemi, E.; Ramezanzadeh, B.; Mahdavian, M. Mechanistic Approach for Evaluation of the Corrosion Inhibition of Potassium Zinc Phosphate Pigment on the Steel Surface: Application of Surface Analysis and Electrochemical Techniques. Dye. Pigment. 2014, 109, 189–199. [Google Scholar] [CrossRef]
  81. ASTM-D610; Standard Practice for Evaluating Degree of Rusting on Painted Steel Surfaces. ASTM International: West Conshohocken, PA, USA, 2008; pp. 1–6.
  82. Tronto, J.; Cludia, A.; Naal, Z.; Barros Valim, J. Conducting Polymers/Layered Double Hydroxides Intercalated Nanocomposites. In Materials Science—Advanced Topics; InTech: London, UK, 2013. [Google Scholar]
  83. ISO 25178-1; Geometrical Product Specifications (GPS)—Surface Texture: Areal—Part 1: Indication of Surface Texture. International Organization for Standardization: Geneva, Switzerland, 2016; pp. 1–25.
  84. Amand, S.; Musiani, M.; Orazem, M.E.; Pébère, N.; Tribollet, B.; Vivier, V. Constant-Phase-Element Behavior Caused by Inhomogeneous Water Uptake in Anti-Corrosion Coatings. Electrochim. Acta 2013, 87, 693–700. [Google Scholar] [CrossRef]
  85. Touzain, S.; Le Thu, Q.; Bonnet, G. Evaluation of Thick Organic Coatings Degradation in Seawater Using Cathodic Protection and Thermally Accelerated Tests. Prog. Org. Coat. 2005, 52, 311–319. [Google Scholar] [CrossRef]
  86. Hsu, C.H.; Mansfeld, F. Technical Note: Concerning the Conversion of the Constant Phase Element Parameter Y0 into a Capacitance. Corrosion 2001, 57, 747–748. [Google Scholar] [CrossRef]
  87. Taylor, S.R. Incentives for Using Local Electrochemical Impedance Methods in the Investigation of Organic Coatings. Prog. Org. Coat. 2001, 43, 141–148. [Google Scholar] [CrossRef]
  88. Upadhyay, V.; Harkal, U.D.; Webster, D.C.; Bierwagen, G.P. Preliminary Investigation of the Impact of Polymer Composition on Electrochemical Properties of Coatings as Determined by Electrochemical Impedance Spectroscopy. J. Coat. Technol. Res. 2013, 10, 865–878. [Google Scholar] [CrossRef]
  89. Misawa, T.; Hashimoto, K.; Shimodaira, S. The Mechanism of Formation of Iron Oxide and Oxyhydroxides in Aqueous Solutions at Room Temperature. Corros. Sci. 1974, 14, 131–149. [Google Scholar] [CrossRef]
Figure 1. SEM images: original nanoclay particles (a) C1, (b) C2; cross-sections of nanoclay-containing coatings with different C1 dosages in PC (cg) 2%–16%; cross-sections of nanoclay-containing coatings with different C2 contents in PC (hk) 2%–8%; (l) localized corrosion spot on the coating prepared from C2–04%-PC; (m) coating prepared from C1–02%-PC after immersion test; EDX maps of (n) Si, (o) Al, and (p) C of image (m); coating surfaces prepared from C1–02%-PC (q) before and (r) after immersion tests.
Coatings 13 01220 g001
Figure 2. FE-SEM images: cross-sections of the coating with C1 4%, (a) large nanoclay particles with space at the particle–binder interface; (b) small nanoclay particles embedded in the coating binder; (c) nanoclay particle with a layered structure; (d) magnified layered structures with binder inside the layers; (e) particle clusters embedded in the binder; (f) magnified nanoscale particles embedded in the binder.
Coatings 13 01220 g002
Figure 3. (a) Confocal surface map of the coating prepared from the formula Control-PC; (b) coating surface roughness values; (cf) nanoclay-containing coatings with different C1 dosages (2%–8%) in PC; (gj) nanoclay-containing coatings with different C2 dosages (2%–8%) in PC.
Coatings 13 01220 g003
Figure 4. MicroCT images (a,b), at two angles of view, of a coating prepared from the formula C1–02%-PC; scale bar length = 750 µm.
Coatings 13 01220 g004
Figure 5. Coating surface quality values (a) specular gloss, (b) DOI; mechanical property values (c) pencil hardness, (d) impact resistance. The error bars represent the standard deviation of 3 independent measurements.
Coatings 13 01220 g005
Figure 6. OCP and Rp of the coatings with (a,b) C1 0%–16%, (c,d) C2 0%–16%; Days 0–5.
Coatings 13 01220 g006
Figure 7. (a) OCP and (b) Rp values of the coatings with C1 4% and C2 8%; Days 0–40.
Coatings 13 01220 g007
Figure 8. Representative EIS spectra (ad) of an electrode with a coating prepared from the formula C1–04%-PC; (e) EEC for data fitting, Days 0, 1, and 5.
Coatings 13 01220 g008
Figure 9. Representative EIS spectra (ad) of an electrode with a coating prepared from the formula C1–04%-PC; (e) EEC for data fitting, Days 9, 10, 20, 30, and 40.
Coatings 13 01220 g009
Figure 10. Schematics for (a,b) EECs and coating structure, (c,d) the protective mechanism of nanoclay, (e,f) delamination of the nanoclay-containing coating after mechanical damage.
Coatings 13 01220 g010
Figure 11. Fitted values of (a) Rpore and (b) Ccoat; coatings prepared from the formulae C1–04%-PC and C2–08%-PC.
Coatings 13 01220 g011
Figure 12. Representative EIS spectra (ad) of an electrode with a coating prepared from the formula C2–08%-PC, (e) EEC for data fitting, Days 0, 1, 5, and 9.
Coatings 13 01220 g012
Figure 13. Representative EIS spectra (ad) of an electrode with a coating prepared from the formula C2–08%-PC, (e) EEC for data fitting, Days 10, 20, 30, and 40.
Coatings 13 01220 g013
Figure 14. (aj) Images of test specimens covered by nanoclay-containing coatings after neutral salt spray testing; (k) salt spray hours to reach a mean creepage of 2 mm.
Coatings 13 01220 g014
Table 1. Particle sizes of montmorillonite nanoclays measured in D.I. water, refractive index input = 1.55.
CodeAdditiveParticle Size/µmDensity/(g/cm3)
D10, VD50, VD90, V
C1Claytone® HT4.4918.3846.101.70
C2CLOISITE® 30B1.918.6423.081.98
Table 2. Binder formulation of the polyester/TGIC powder clearcoat (PC).
ComponentCompositionContent/wt.%
ResinCarboxylated polyester90.8
Curing agentTGIC6.8
Flow and leveling agentpolyacrylate1.6
Degassing agentBenzoin0.8
Table 3. Naming and formulae of powder coatings with nanoclays C1 and C2 in a polyester/TGIC binder.
Formula CodeNanoclay/wt.%Binder/wt.%
Control-PC0.0100.0
C1–02%-PC2.098.0
C1–04%-PC4.096.0
C1–06%-PC6.094.0
C1–08%-PC8.092.0
C1–16%-PC16.084.0
C2–02%-PC2.098.0
C2–04%-PC4.096.0
C2–06%-PC6.094.0
C2–08%-PC8.092.0
C2–16%-PC16.084.0
Table 4. Fitted values of EEC elements; a coating prepared from the formula C1–04%-PC.
TimeCPEcoatRporeCalculated CcoatCPEdlRctWs, RDWs, TDWs, Pχ2
DaysQc/
Ω−1∙cm−2∙sα
αcoatΩ∙cm−2F∙cm−2Qd/
Ω−1∙cm−2∙sα
αdlΩ∙cm−2Ω∙cm2∙sPs
06.71 × 10−110.9712.02 × 1075.52 × 10−112.16 × 10−100.8045.41 × 108 7.04 × 10⁻⁴
19.58 × 10−110.9459.87 × 1066.35 × 10−118.30 × 10−100.7514.35 × 108 1.53 × 10⁻³
59.87 × 10−110.9444.95 × 1066.29 × 10−112.42 × 10−90.6253.91 × 108 5.22 × 10⁻⁴
91.34 × 10−100.9213.49 × 1066.95 × 10−114.34 × 10−90.6022.88 × 1082.88 × 1084.49 × 1030.5007.56 × 10−4
108.42 × 10−110.9093.09 × 1067.24 × 10−114.45 × 10−90.6201.55 × 1082.13 × 1084.01 × 1030.5007.56 × 10−4
205.09 × 10−90.9571.63 × 1065.63 × 10−113.46 × 10−90.5344.46 × 1072.02 × 1083.51 × 1030.5582.06 × 10−4
301.12 × 10−100.9321.70 × 1066.03 × 10−117.11 × 10−90.5382.04 × 1074.52 × 1075.54 × 1030.5004.52 × 10−4
404.43 × 10−111.0001.10 × 1064.43 × 10−111.12 × 10−90.5592.53 × 1071.65 × 1087.42 × 1030.5541.68 × 10−4
Table 5. Fitted values of EEC elements; a coating prepared from the formula C2–08%-PC.
TimeCPEcoatRporeCalculated CcoatCPEdlRctWs, RDWs, TDWs, Pχ2
DaysQcoat/
Ω−1∙cm−2∙sn
αcoatΩ∙cm2F∙cm−2Qdl/
Ω−1∙cm−2∙sn
αdlΩ∙cm2Ω∙cm2∙sPs
08.15 × 10−110.9443.93 × 1064.89 × 10−113.07 × 10−100.7394.99 × 108 2.34 × 10⁻⁴
12.38 × 10−100.8631.70 × 1066.65 × 10−113.59 × 10−90.7261.67 × 108 2.38 × 10⁻³
51.13 × 10−100.9227.47 × 1054.98 × 10−113.68 × 10−80.4451.97 × 1076.49 × 1076.80 × 1020.5004.20 × 10−4
97.91 × 10−110.9495.57 × 1054.67 × 10−114.09 × 10−80.4304.63 × 1066.30 × 1074.57 × 1030.5008.69 × 10−4
108.43 × 10−110.9454.75 × 1054.11 × 10−115.94 × 10−80.3964.01 × 1064.51 × 1073.17 × 1030.5001.77 × 10−4
207.51 × 10−110.9551.58 × 1054.13 × 10−118.52 × 10−80.3741.59 × 1062.24 × 1076.00 × 1030.5221.50 × 10−4
301.06 × 10−100.9312.37 × 1054.78 × 10−111.17 × 10−70.3689.81 × 1051.33 × 1075.84 × 1030.5451.91 × 10−4
401.10 × 10−100.9342.75 × 1055.03 × 10−111.46 × 10−70.3907.03 × 1051.14 × 1075.52 × 1030.5893.72 × 10−4
Disclaimer/Publisher’s Note: The statements, opinions and data contained in all publications are solely those of the individual author(s) and contributor(s) and not of MDPI and/or the editor(s). MDPI and/or the editor(s) disclaim responsibility for any injury to people or property resulting from any ideas, methods, instructions or products referred to in the content.

