Article

The Influence of Microstructure Characteristics on Thickness Measurement of TBCs Using Terahertz Time-Domain Spectroscopy

1
School of Materials Science and Engineering, Beihang University (BUAA), Beijing 100191, China
2
Frontier Research Institute of Innovative Science and Technology, Beihang University (BUAA), Beijing 100191, China
3
Tianmushan Laboratory, Hangzhou 311115, China
*
Author to whom correspondence should be addressed.
Coatings 2024, 14(1), 79; https://doi.org/10.3390/coatings14010079
Submission received: 30 November 2023 / Revised: 24 December 2023 / Accepted: 29 December 2023 / Published: 5 January 2024

Abstract

:
Thermal barrier coatings (TBCs) exhibit excellent thermal insulation capabilities, proving crucial in enhancing the performance of turbine blades. Accurate measurement of TBC thickness is pivotal for the quality control and health monitoring of turbine blades. However, the absence of suitable non-destructive testing (NDT) methods poses a challenge in ensuring precise quality control and health assessment of TBCs. This study investigates the efficacy of terahertz time-domain spectroscopy (THz-TDS) in measuring TBCs thickness, specifically focusing on the microstructure characteristics of the top coat (TC), including grain morphology, internal porosity, surface roughness, and agglomerates. The findings emphasize the significance of grain morphology in determining thickness measurement due to the varied terahertz wave propagation modes. Moreover, the study involved polishing EB-PVD and APS samples to mitigate surface roughness. This process revealed a discernible linear correlation between reduced surface roughness and decreased measurement errors. The slopes of the error reduction curves ranged from 0.59 to 1.7 for EB-PVD and 2.17 to 5.79 for APS samples. Furthermore, the research observed THz light scattering within internal pores, resulting in diminished outgoing energies and subsequent increments in measurement errors.

1. Introduction

Thermal barrier coatings (TBCs) technology, high-temperature structural materials, and efficient blade cooling technology are critical technologies of high-pressure turbine blade technology for high-performance aero engines. The performance of coatings is crucial to the working state of the blades and even the engines. The thinning and chipping of the top coat (TC), as well as the internal debonding, caused the failure of TBCs. Due to its extraordinary stability and low thermal conductivity, yttria-stabilized zirconia (YSZ) is applied to produce TBCs [1,2,3]. It has been reported [4] that the increase in the thickness of TC reduces the surface temperature at the rate of 4–9 °C per 25.4 μm of the cooled components in gas turbine engines. However, the inappropriate thickness of TBCs will lead to chipping of the TC or overheating of the substrate. In addition, the non-uniform thickness of the TC, which is due to the rough surface before spraying, will cause serious internal stress, resulting in the failure of TBCs [5,6,7]. Therefore, the thickness of the TC significantly influences the performance of TBCs [8,9]. The measurement of the thickness is extremely important for the health monitoring of TBCs.
The metallographic method is generally used for thickness measurement, which is the most accurate way. However, this destructive method is not only complicated but also not suitable for real-time observations; furthermore, it cannot contribute to the health monitoring of TBCs. It is important to develop a suitable non-destructive testing (NDT) method for measuring the thickness of TC. Among the various NDT methods, the eddy current method measures the thickness of the TC by obtaining the distance between the probe and the conductive layer [10]. However, due to the characteristics of multiple layers and geometry on the turbine blades, the non-uniform electrical conductivity and the bond coat (BC) or film cooling hole can mislead the signals, resulting in reduced accuracy. Otherwise, the ultrasonic detection method is also used for thickness measurement through parameters such as sound speed, sound attenuation, and ultrasonic signal dispersion [11]. The complicated structures of turbine blades cause problems of echo and interference, which makes the ultrasonic detection method ineffective in the thickness measurement of TBCs. For infrared thermal imaging technology, internal defects in the sample affect heat transfer, resulting in an uneven surface temperature distribution. Thermal images can be recorded by infrared thermal imagers to characterize the thickness of TC [12,13], and the results of infrared thermal analysis show a field distribution. The changing thermal conductivities of TBCs will produce unstable results, which will lead to uncontrollable measurement errors. Taking the disadvantages of the NDT methods above into consideration, a new NDT method for thickness measurement of TBCs has been developed rapidly with its high accuracy, good safety, and easy data processing, which is called the terahertz time-domain spectroscopy (THz-TDS) method.
Terahertz waves exhibit the property of being permeable on ceramics while almost entirely reflected by metals (reflectance R > 99.5%@1 THz for metals [14]). This characteristic is suitable for measurement in TBC systems that only need to detect the thickness of the TC and do not require terahertz waves to pass through the BC or the substrate. In 2009, American researchers White et al. [15] proposed the relationship between thickness, refractive index of TC, and time-domain spectral time delay Δt as follows:
d = c × Δ t 2 n
In 2010, American scholars Chen et al. [16] put forward the supplementary formula for terahertz waves incident to the surface of the sample at an angle of φ as follows:
Δ t = 2 n d c · c o s φ
However, for the coatings actually used, the refractive index is not a fixed value because of the influence of cracks, pores, and defects in the samples. In 2013, Japanese researchers Fukuchi et al. [17,18] came up with a method to determine the refractive index and thickness of TC by using the reflection mode of THz-TDS. The fast Fourier transform (FFT) is applied to the time domain signals to obtain the frequency characteristic parameters, and then the thickness of the sample is calculated. FFT processing is performed on the first three reflected echoes of the sample, and the frequency characteristic functions FS, FR1, and FR2 of the surface echo S, the first echo R1, and the second echo R2 are obtained. It can be derived from the Fresnel formula that:
F S F R 2 F R 1 2 = r 12 r 21 t 12 t 21 = n 1 2 4 n
where r12 and t12 are the reflection and transmission coefficients when the terahertz wave is incident on the surface from the air side, and r21 and t21 are the reflection and transmission coefficients when the terahertz wave is incident on the surface from the TC side, respectively. The difference compared with scanning electron microscopy (SEM) observation is about 30 μm when the thickness of TC is 330 μm.
Yuan B. et al. [19] discovered that when the thickness decreased, the signals of multiple reflection peaks would overlap due to the reduced time delay between reflection peaks. Ye DD et al. [20] used Monte Carlo simulation to study the scattering effect of TC with pores. Scattering reduces the terahertz energies and increases extinction, time domain broadening, and the optical paths. The scattering of terahertz waves increases with the increase in internal pores, resulting in a decrease in refractive index. Combining this conclusion with the relationship between the refractive index and the thickness of coatings, it can be seen that the increase in porosity will lead to a decrease in the measurement accuracy of the thickness using the THz-TDS method. Therefore, porosity is an important evaluation index for the accuracy of thickness measurement. Ye DD et al. [21,22] used Principal Component Analysis (PCA) to reduce the dimension of terahertz spectral data and established a model using the Support Vector Machine (SVM) method to predict the porosity. This method subtracts the mean value of each sample vector from the vector itself, thereby improving the prediction accuracy of the model by subtracting redundant spectral data. The refractive index, extinction coefficients, and relative broadening ratios of the samples in the range of 0.6~1.4 THz were extracted to characterize the microstructures of the samples. The correlation coefficients R of the calculated results are all above 95%, which effectively characterizes the microstructure characteristics of TC. Rui Li et al. [23] adopted the fast independent component analysis (fast ICA) algorithm to process terahertz time-domain data and extract kurtosis as a parameter to represent changes in porosities of TBCs. Considering the differences in the microstructure characteristics of the samples, it can be inferred that the errors in the thickness measurements are caused by the combination of surface roughness, internal porosities, and internal agglomerates of the samples. The NDT of the thickness of TBCs on aeroengine blades is crucial to the evaluation of thermal insulation and thermal shock performances [24]. As an emerging frontier in science and technology, the research work of THz-TDS in the field of thickness measurement of TBCs is currently focused on the deduction and calculation of thickness measurement formulas [25,26,27]. Moreover, combined with experimental data, the characterization of microstructure features such as porosity by using model formulas and machine learning methods [28,29,30] is also researched. However, there is no systematic study on the influences of microstructure characteristics, including grain morphology, surface roughness, porosity, and internal agglomerates, on the accuracy of thickness measurement of TBCs. As can be seen from the above discussion, it is precisely these characteristics that have an important impact on the accuracy of the TC thickness calculation. Stable and accurate results are crucial for THz-TDS to exert its advantages in the field of thickness measurement of TBCs.
Due to the complex microstructures of the TBCs, the influences of the pores, rough surfaces, and agglomerates formed during production on the thickness measurement of TBCs by THz-TDS are not completely clear, resulting in inaccurate test results. By combining Fresnel’s law with the relationship between the first three echoes of the terahertz signals, the calculation model of the relationship between refractive index and thickness can be established [17,18]. Based on the previous work, TBC samples prepared by atmospheric plasma spraying (APS) and electron beam physical vapor deposition (EB-PVD) processes were selected in this paper to measure the thicknesses of the top coat by the THz-TDS method and then compared with the thicknesses measured by SEM observations to give the measurement errors of the two methods. By calculating the errors, the influences of the microstructure characteristics on the thickness measurement accuracies of THz-TDS under different preparation technologies were studied, and the ways to improve the accuracy were explored so that the terahertz NDT method could play an important role in the field of thickness measurement of TBCs.
The purpose of this paper is to comprehensively study the influences of various microstructure characteristics on the thickness measurement errors of TBCs, improve the scientific and reliability of the terahertz method in the field of NDT for TBC thickness, and lay a foundation for subsequent thickness monitoring and life judgment works.

2. Materials and Methods

2.1. Specimen Preparation

The EB-PVD samples used in this paper adopted IC21 alloy as the substrate, which are machined into discs with a diameter of 12 mm and a thickness of 2 mm. These discs were sanded by 400#, wet sandblasted (0.2 MPa, 30 s), and ultrasonic cleaned. Then, HY5 with a thickness of about 30–50 μm was prepared by the multi-arc ion plating (AIP) method as the BC. After plating, the samples were heat treated in a vacuum furnace at 1050 °C for 2 h, and then shot peening was performed (0.2 MPa, 3–5 s). After that, the samples were heat treated in a vacuum furnace at 1050 °C for 2 h, followed by wet sandblasting and ultrasonic cleaning, and finally the TC was prepared by EB-PVD.
The substrate materials and dimensions of APS samples were consistent with those of EB-PVD samples. After the surface was polished to 400#, the substrate was dry sandblasted with a 60-mesh white corundum at 0.4–0.6 MPa pressure as well as ultrasonic cleaned. Then the HY5 with a thickness of about 30–50 μm was prepared by the High Velocity Air Fuel (HVAF) method as the BC, and the YSZ was sprayed as TC by APS. Finally, the samples were thermally diffused in a vacuum furnace at 860 °C for 6 h. The size distributions of YSZ powders used in this paper are 15–55 μm for APS-A samples and 40–96 μm for APS-B samples, respectively, and the basic coating preparation process information is shown in Table 1.
The differences in interface roughness introduced by different BC preparation technologies have little effect on terahertz signals and can be ignored. This premise is based on the research results of Cao B. et al. [31], who used a combination of simulation and experiment to find that terahertz waves propagate in the samples and then attenuate, making the effects of the internal rough interface on the signals much less than those of the surface roughness, with an error of less than 1%.

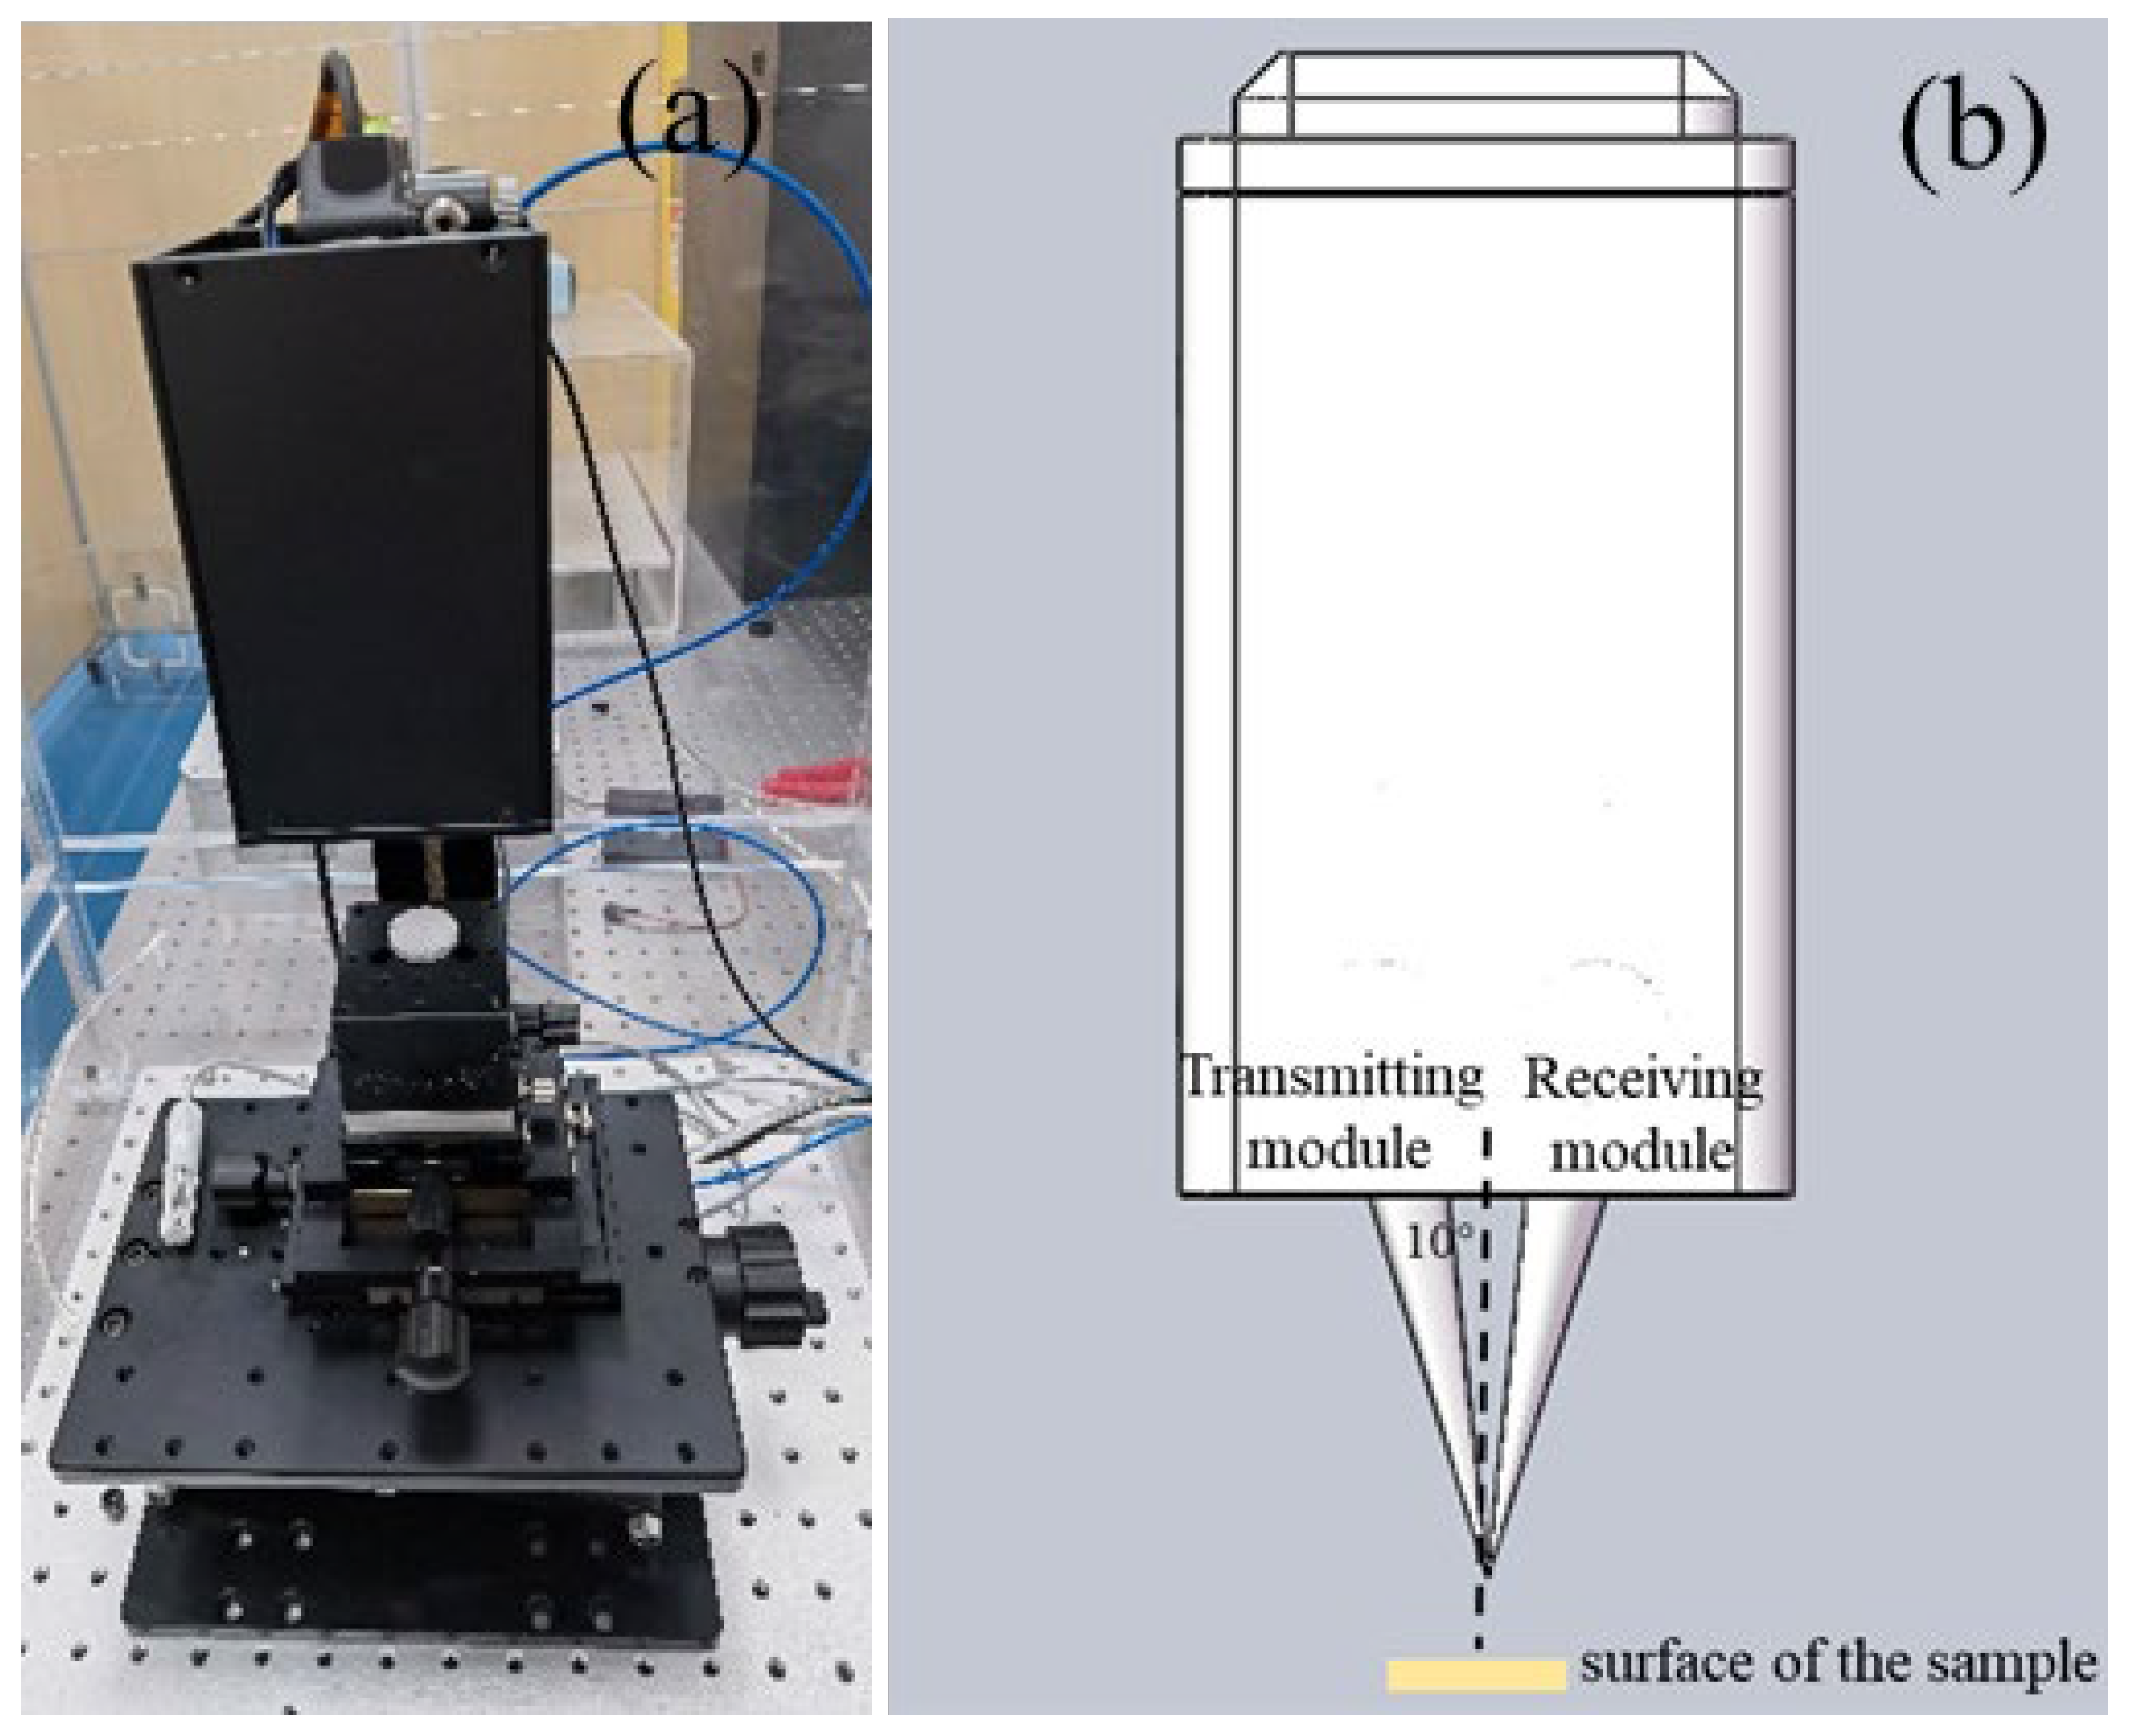
2.2. Terahertz Time-Domain Spectroscopy Test

The TBC samples were ultrasonic cleaned to remove the influence of impurities and pollutants. And a reflection module with an incident angle of 10° was configured for the terahertz time-domain spectrometer (Teraflash_TF-1927, TOPTICA Photonics, Munich, Germany, Figure 1). The sample table was constructed as a 360° adjustable rotating platform to facilitate testing of different sample positions. The reflection module and the sample table were placed in an acrylic, atmospheric-sealed box measuring 45 cm × 45 cm × 70 cm. An aluminum alloy optical platform was placed on the bottom, and two KF25 holes were reserved for the passage of high-purity nitrogen (99.999%), which were used to control the internal humidity below 5% and reduce the interference of water vapor on the terahertz signals of the samples. In addition, an infrared locator and a digital locator were also installed. The infrared locator was horizontally placed beside the reflection module, flush with the probe. The digital locator was used to mark the samples so that the surface of the samples could be placed in the focus position to obtain the maximum terahertz signals. The THz-TDS tests were performed by rotating the sample table to obtain the maximum terahertz signals and marking the test position of the current samples (hereinafter referred to as “T-position”). All the samples are positioned by the infrared positioner, so as to ensure the stability of the received signals. The system parameters are listed in Table 2.

2.3. Phase Composition and Microstructure Characterization

The samples were cut with a diamond wire at the “T-position “of the samples and polished with 120#, 240#, 400#, 600#, 800#, 1000#, 1500#, 2000#, and 3000# sandpaper in turn so as to obtain longitudinal section backscattered electron images by SEM (Apreo S Lovac, FEI, Brno, Czech Republic), and then the thicknesses of the samples were obtained by measuring the TC segments.
Besides, the porosities were collected from SEM images combined with Image J (×64, version 1.8.0) software, as the pores and coating parts in the TC images of samples were distinguished by the threshold setting method, and the pixel area ratios of the pore parts were calculated. The porosities used in this paper were the average calculated after three counts of the samples. In addition, the porosities of the EB-PVD samples were the percentage of volume occupied by the columnar crystal gaps.
The surface roughness was measured by a surface roughness meter (TR200, Beijing Jitai Instrument Testing Equipment Co., Ltd., Beijing, China) with an accuracy of 0.001 μm and then characterized by Ra. “T-position” of each sample was tested three times, and the average was taken as the roughness data for final use.
In addition, the phase of the samples was detected using a high-resolution laser Raman spectrometer (LabRAM HR Evolution, HORIBA Scientific, Grenoble, France) with an excitation wavelength of 532 nm (Ne laser). The wave number ranges from 100 cm−1 to 800 cm−1.

3. Results and Discussion

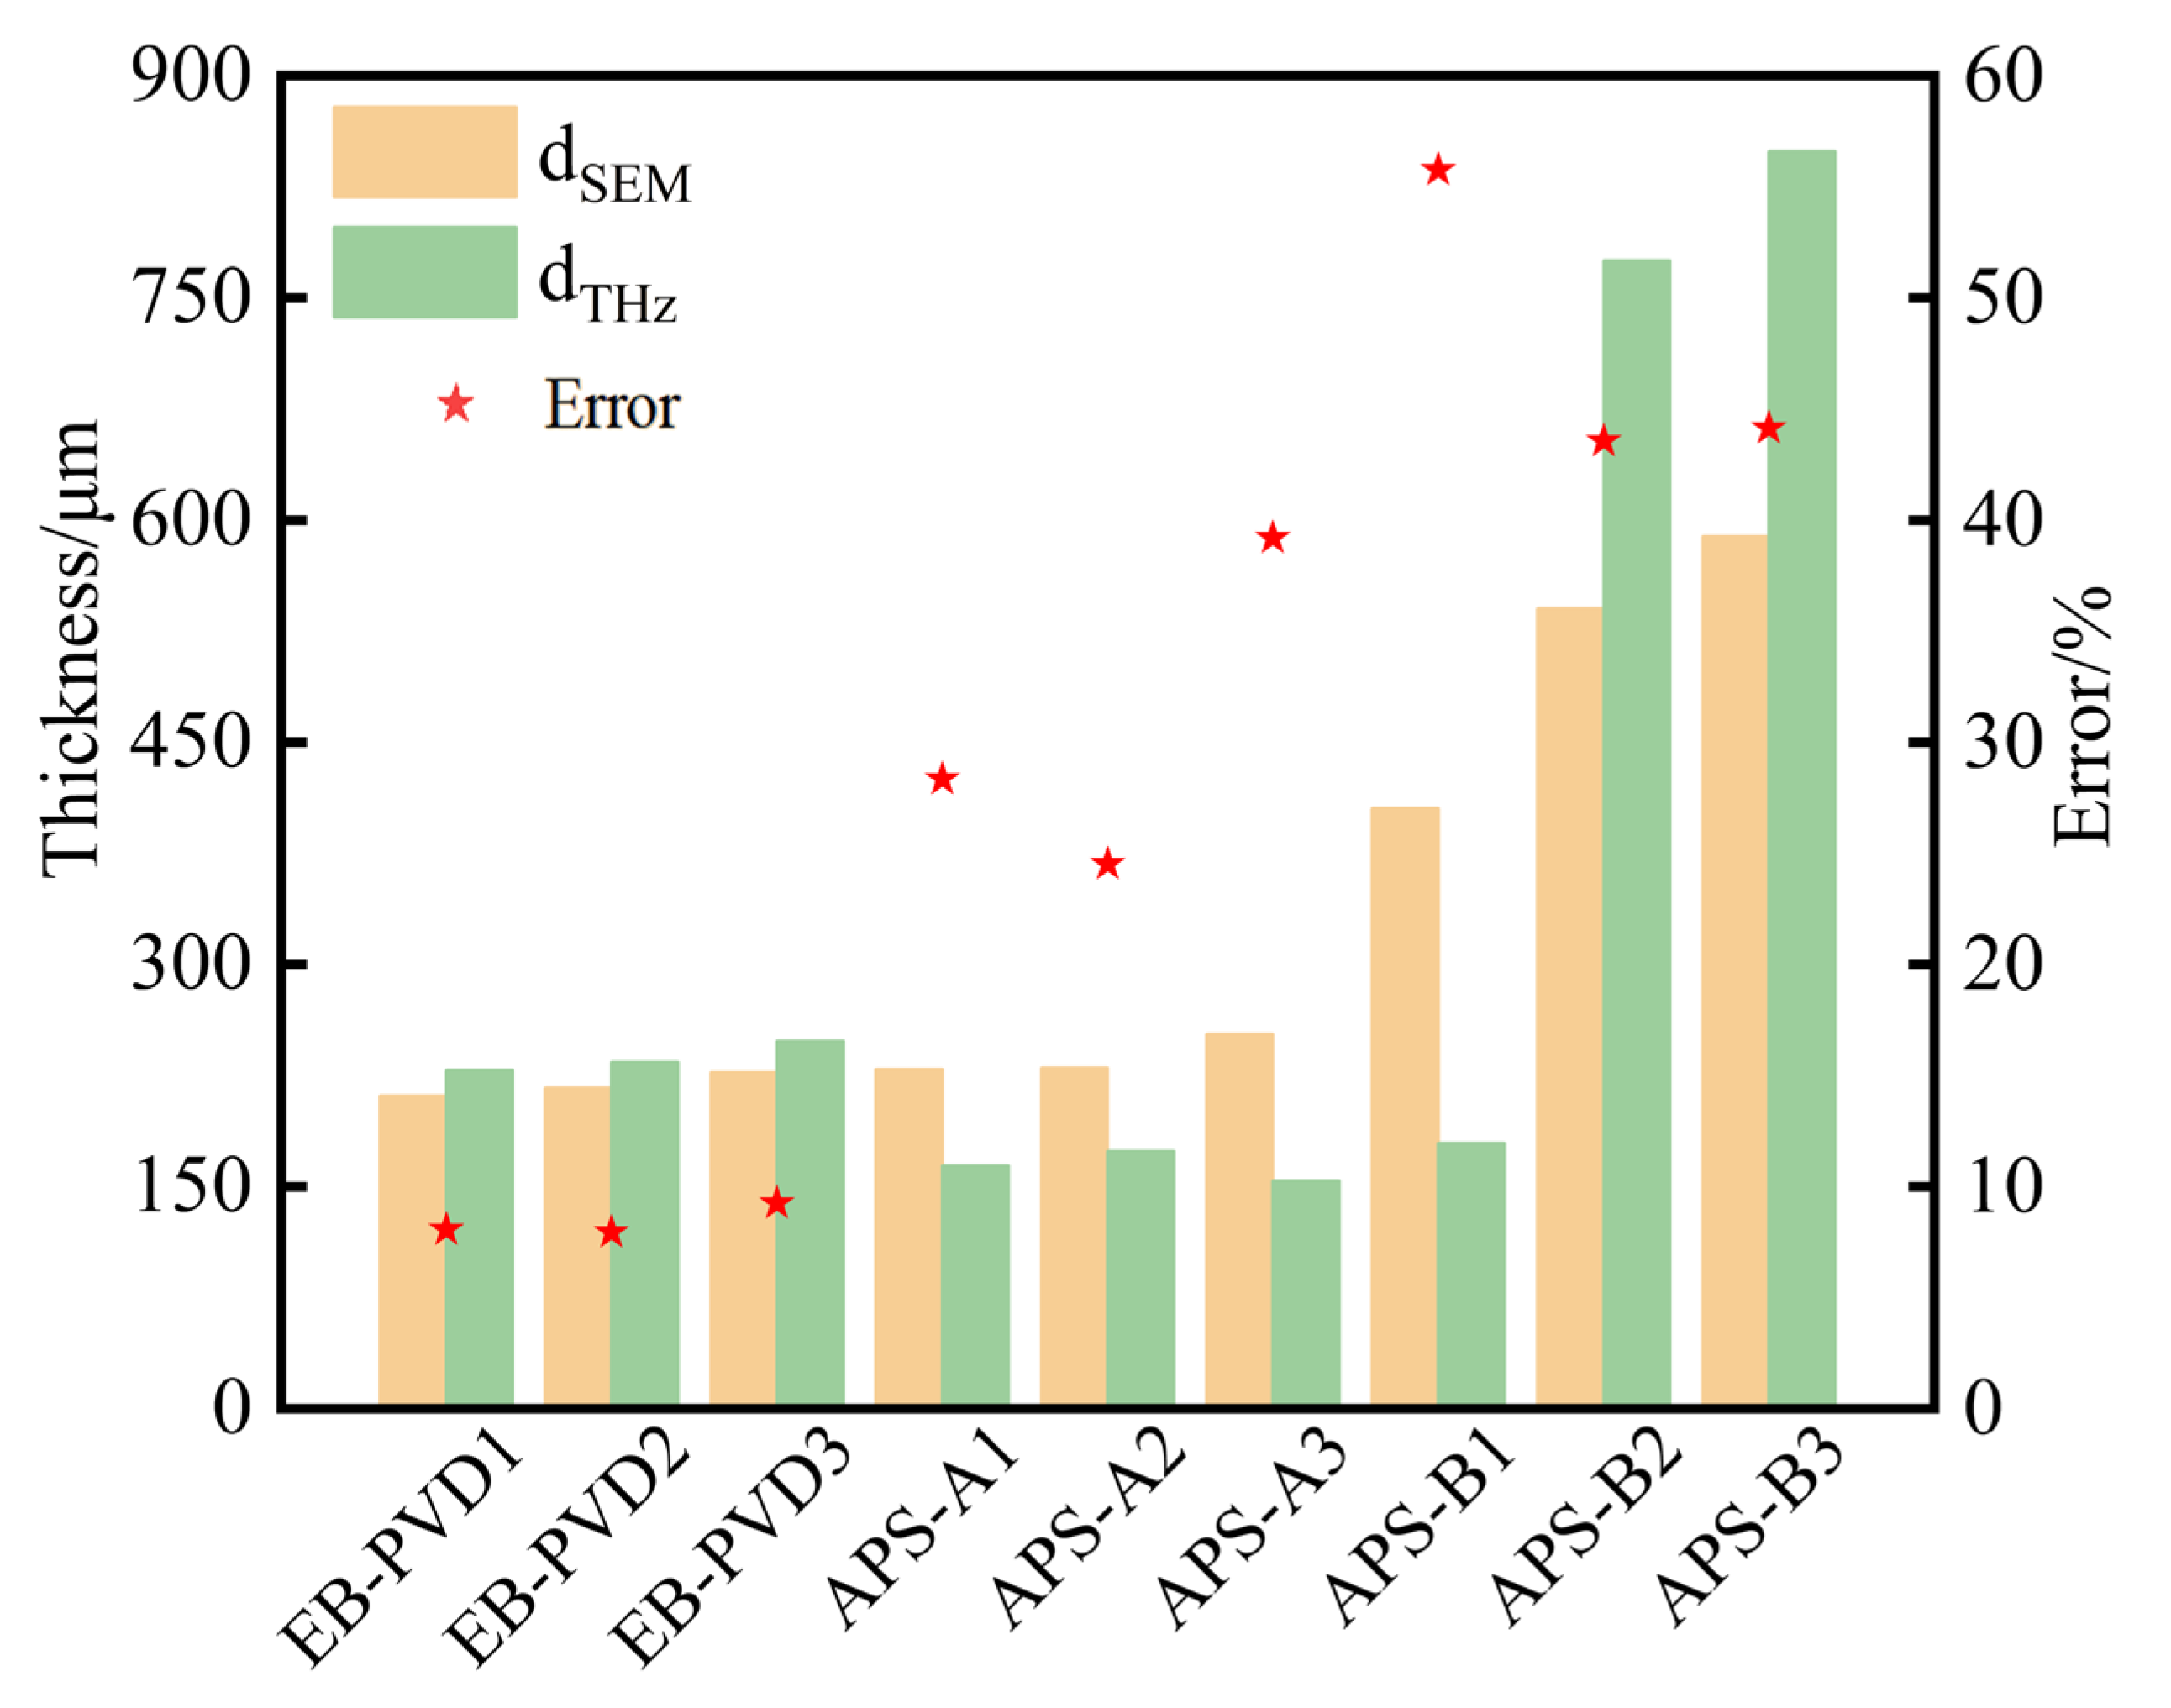
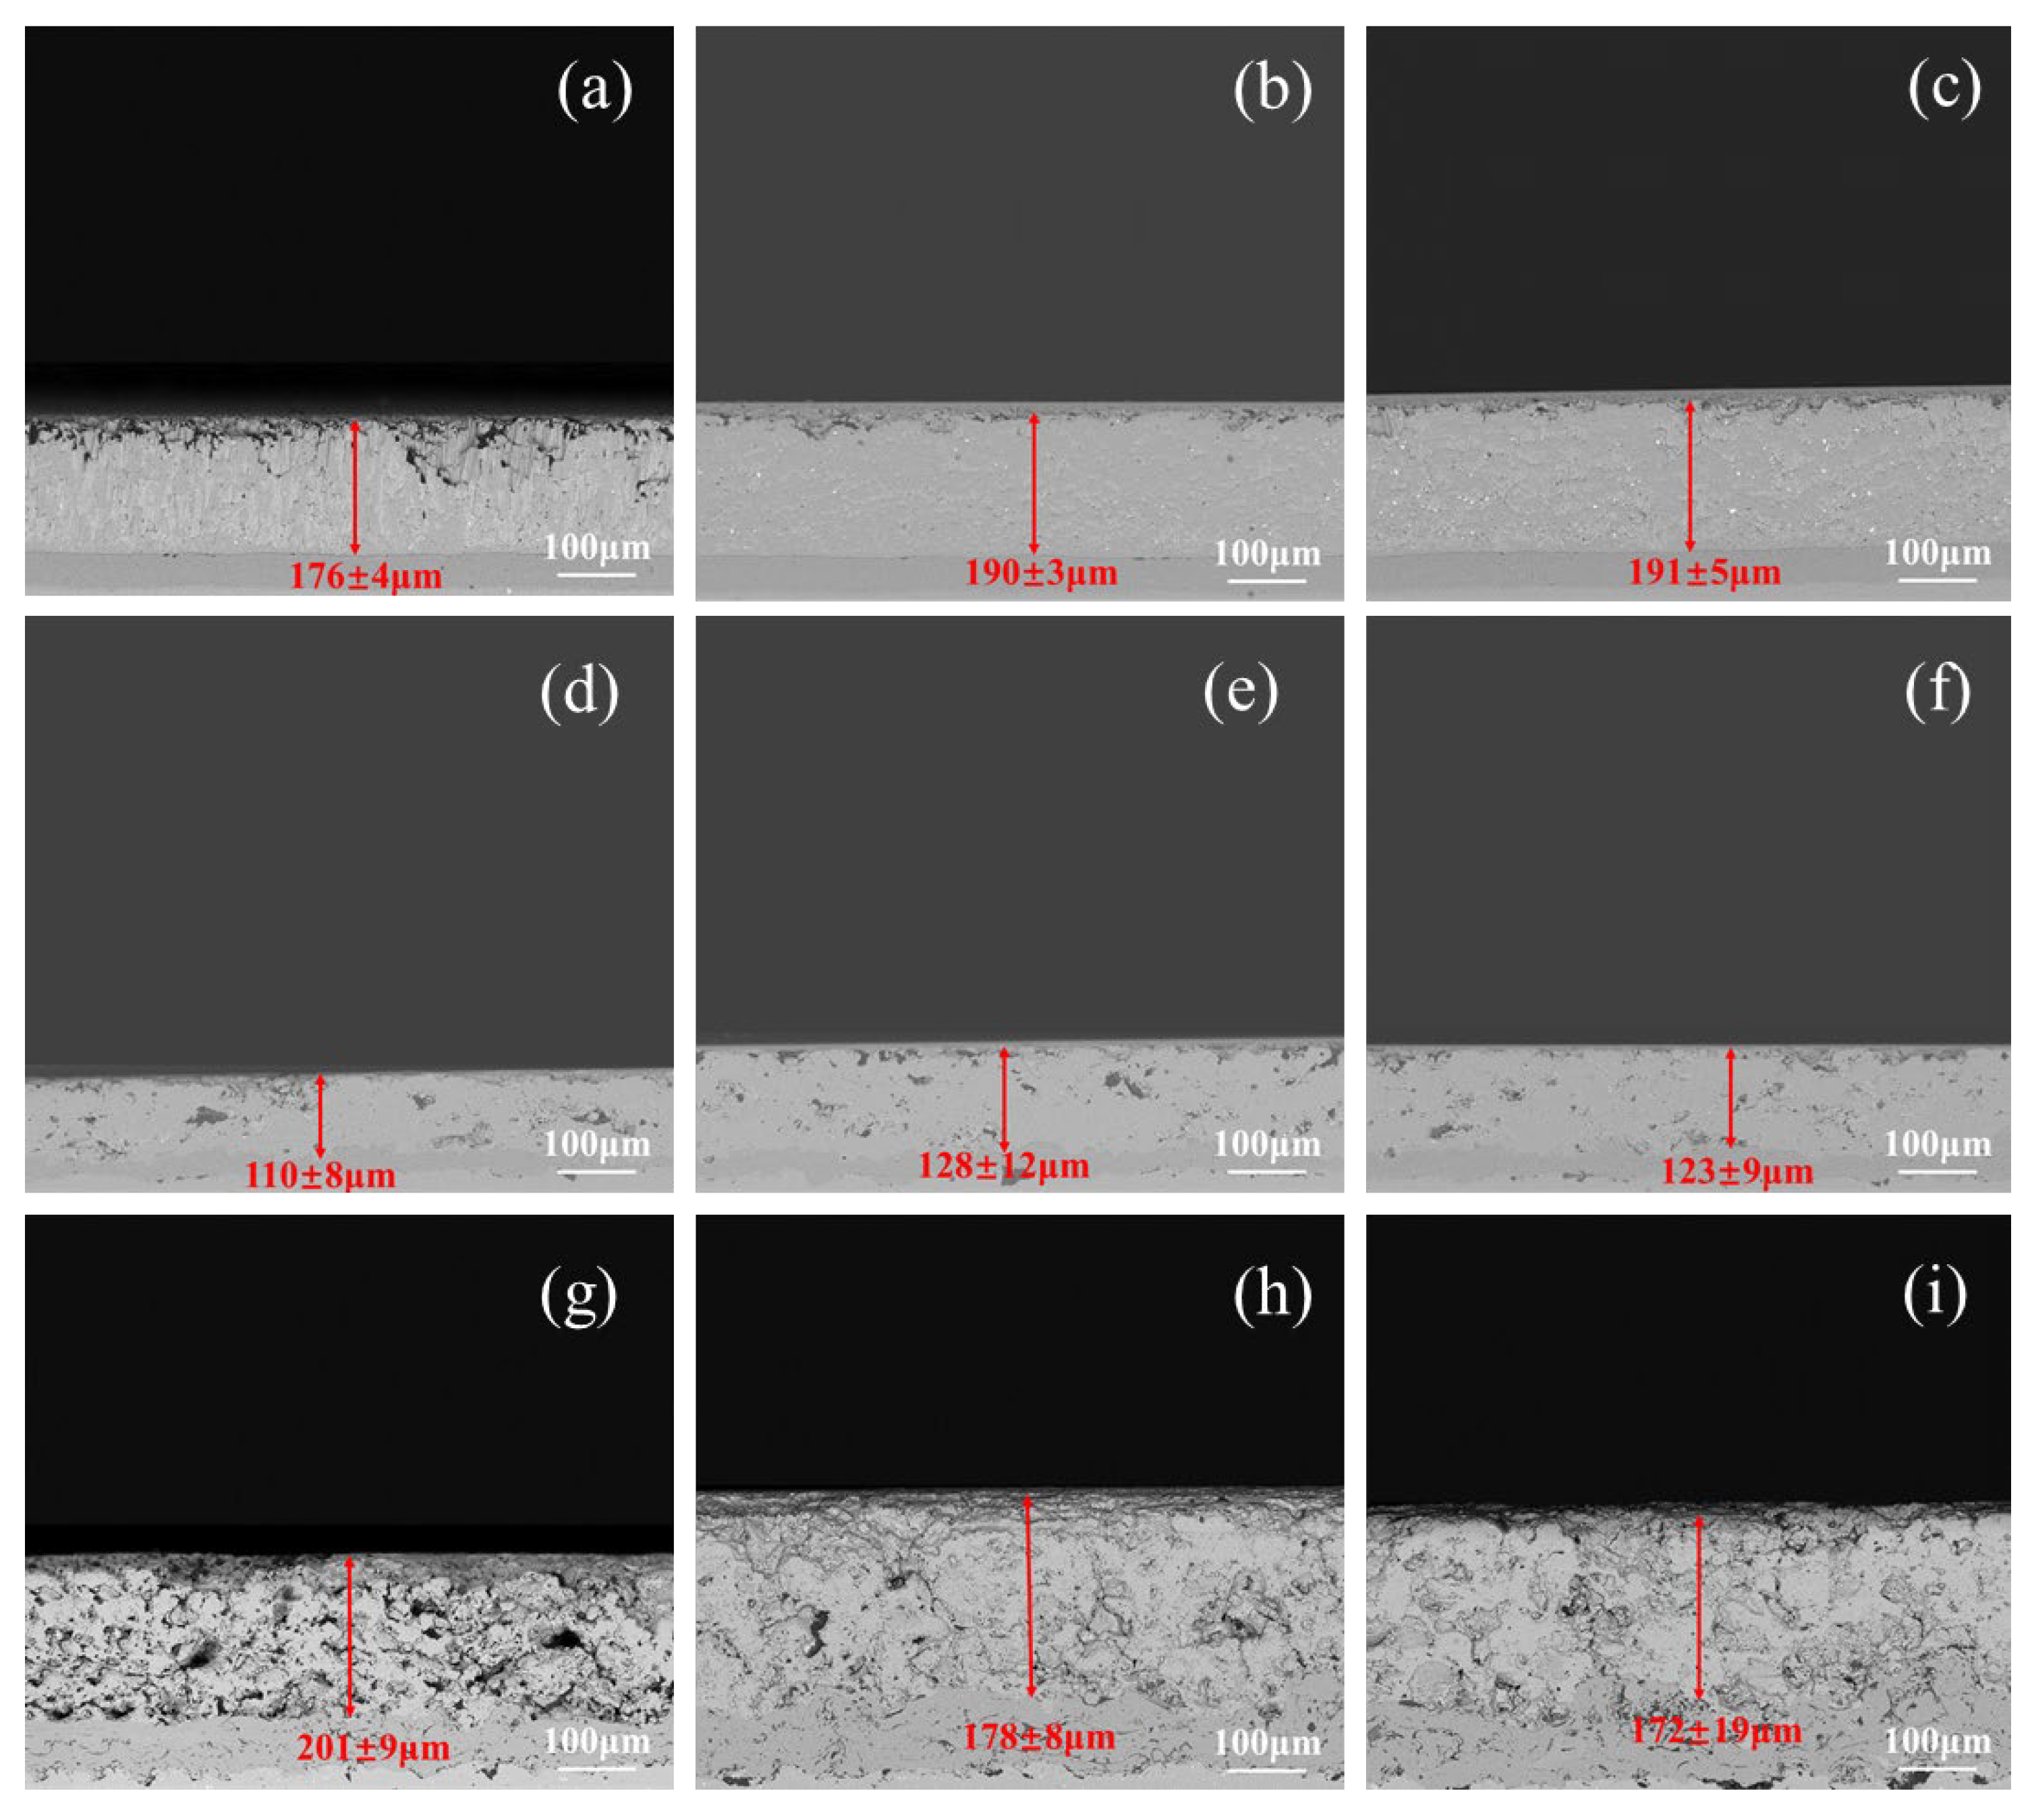
3.1. Thickness Measured by Terahertz Time Domain Amplitude Signals

As shown in Figure 2a, terahertz waves reach the surface of samples at an incident angle φ, and S, R1, and R2 correspond to the first three reflected echo signals, respectively. They represent the reflected echoes of terahertz waves that reach the upper surface of the TC, the echoes that are reflected back to the receiver after the terahertz waves pass through the TC to reach the BC interface, and the echoes that continue to be reflected.
Combined with the interaction between the frequency characteristics of the first three echoes proposed by Fukuchi et al. [17,18], the unknown X is given as a parameter related to the electric field intensities of the terahertz waves according to Fresnel’s law:
X = E 1 E 3 E 2 2
where E1, E2, and E3 are the electric field intensities calculated from peak-peak values as shown in Figure 2b of the first three echoes, respectively.
Considering the refractive index, Equation (4) becomes:
E 1 E 3 E 2 2 = r 01 r 10 t 01 t 10 = n 1 2 4 n
where r01 and t01 are the reflection and transmission coefficients when the terahertz wave is incident on the surface from the air side, and r10 and t10 are the reflection and transmission coefficients when the terahertz wave is incident on the surface from the TC side, respectively.
Since the object of study in this paper is TC, n > 1, so:
n = 2 X + 1 + 2 X 2 + X
Then, according to the relation between thickness and refractive index proposed by White et al. [15]:
d = c × Δ t 2 n
It can be obtained that:
d = c × Δ t 4 X + 4 X 2 + X + 2
Considering the incidence angle φ, the equation for calculating the thickness of TC by time domain amplitude signals is as follows:
d = c × Δ t × cos φ 4 X + 4 X 2 + X + 2
The thicknesses of TBC samples with different preparation technologies and parameters were measured and calculated by the THz-TDS method and then compared with the results observed from SEM. The backscattered electron images of the samples are shown in Figure 3.
Figure 4 shows the thickness obtained by the two methods. Where dSEM represents the SEM measurement results and dTHz is obtained by the THz method. The red five-pointed stars in the figure represent the errors between them, and the measurement error is defined as:
E r r o r = d S E M d T H z d S E M × 100
It was found that the errors of the samples prepared by EB-PVD are below 10%, while the errors of the APS samples range from 24.5% to 55.8%, respectively (as shown in Figure 4).

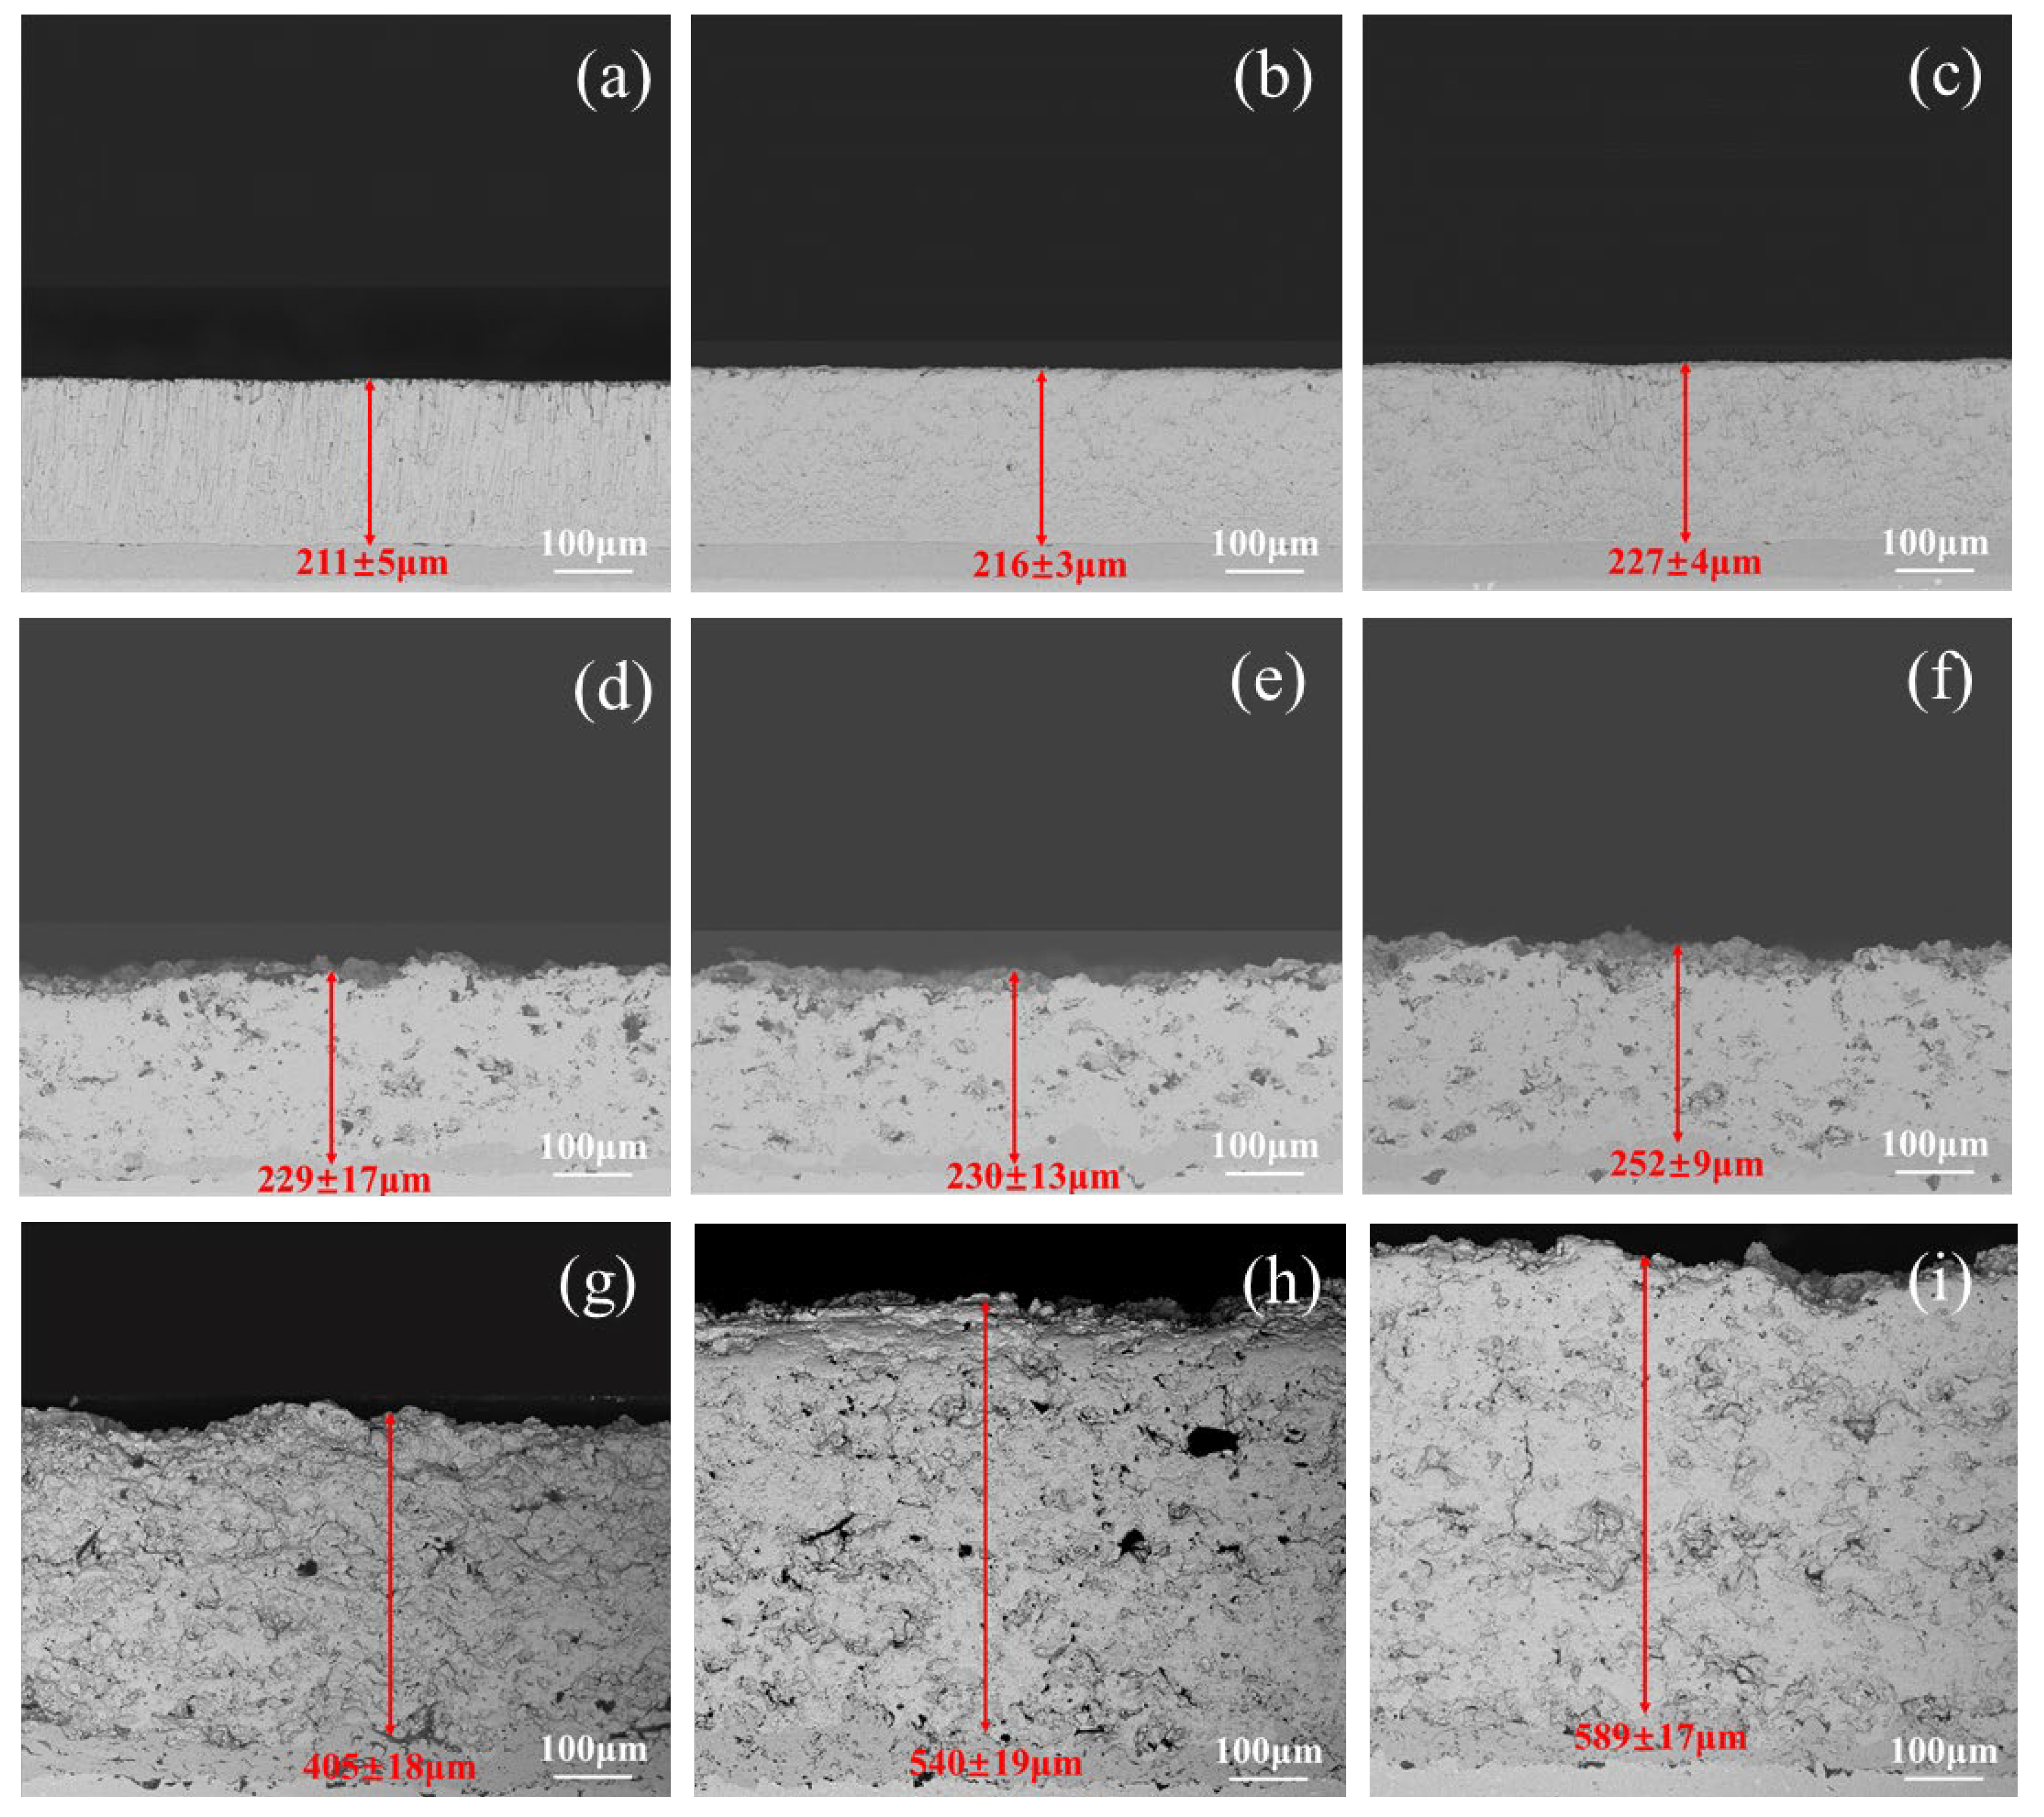
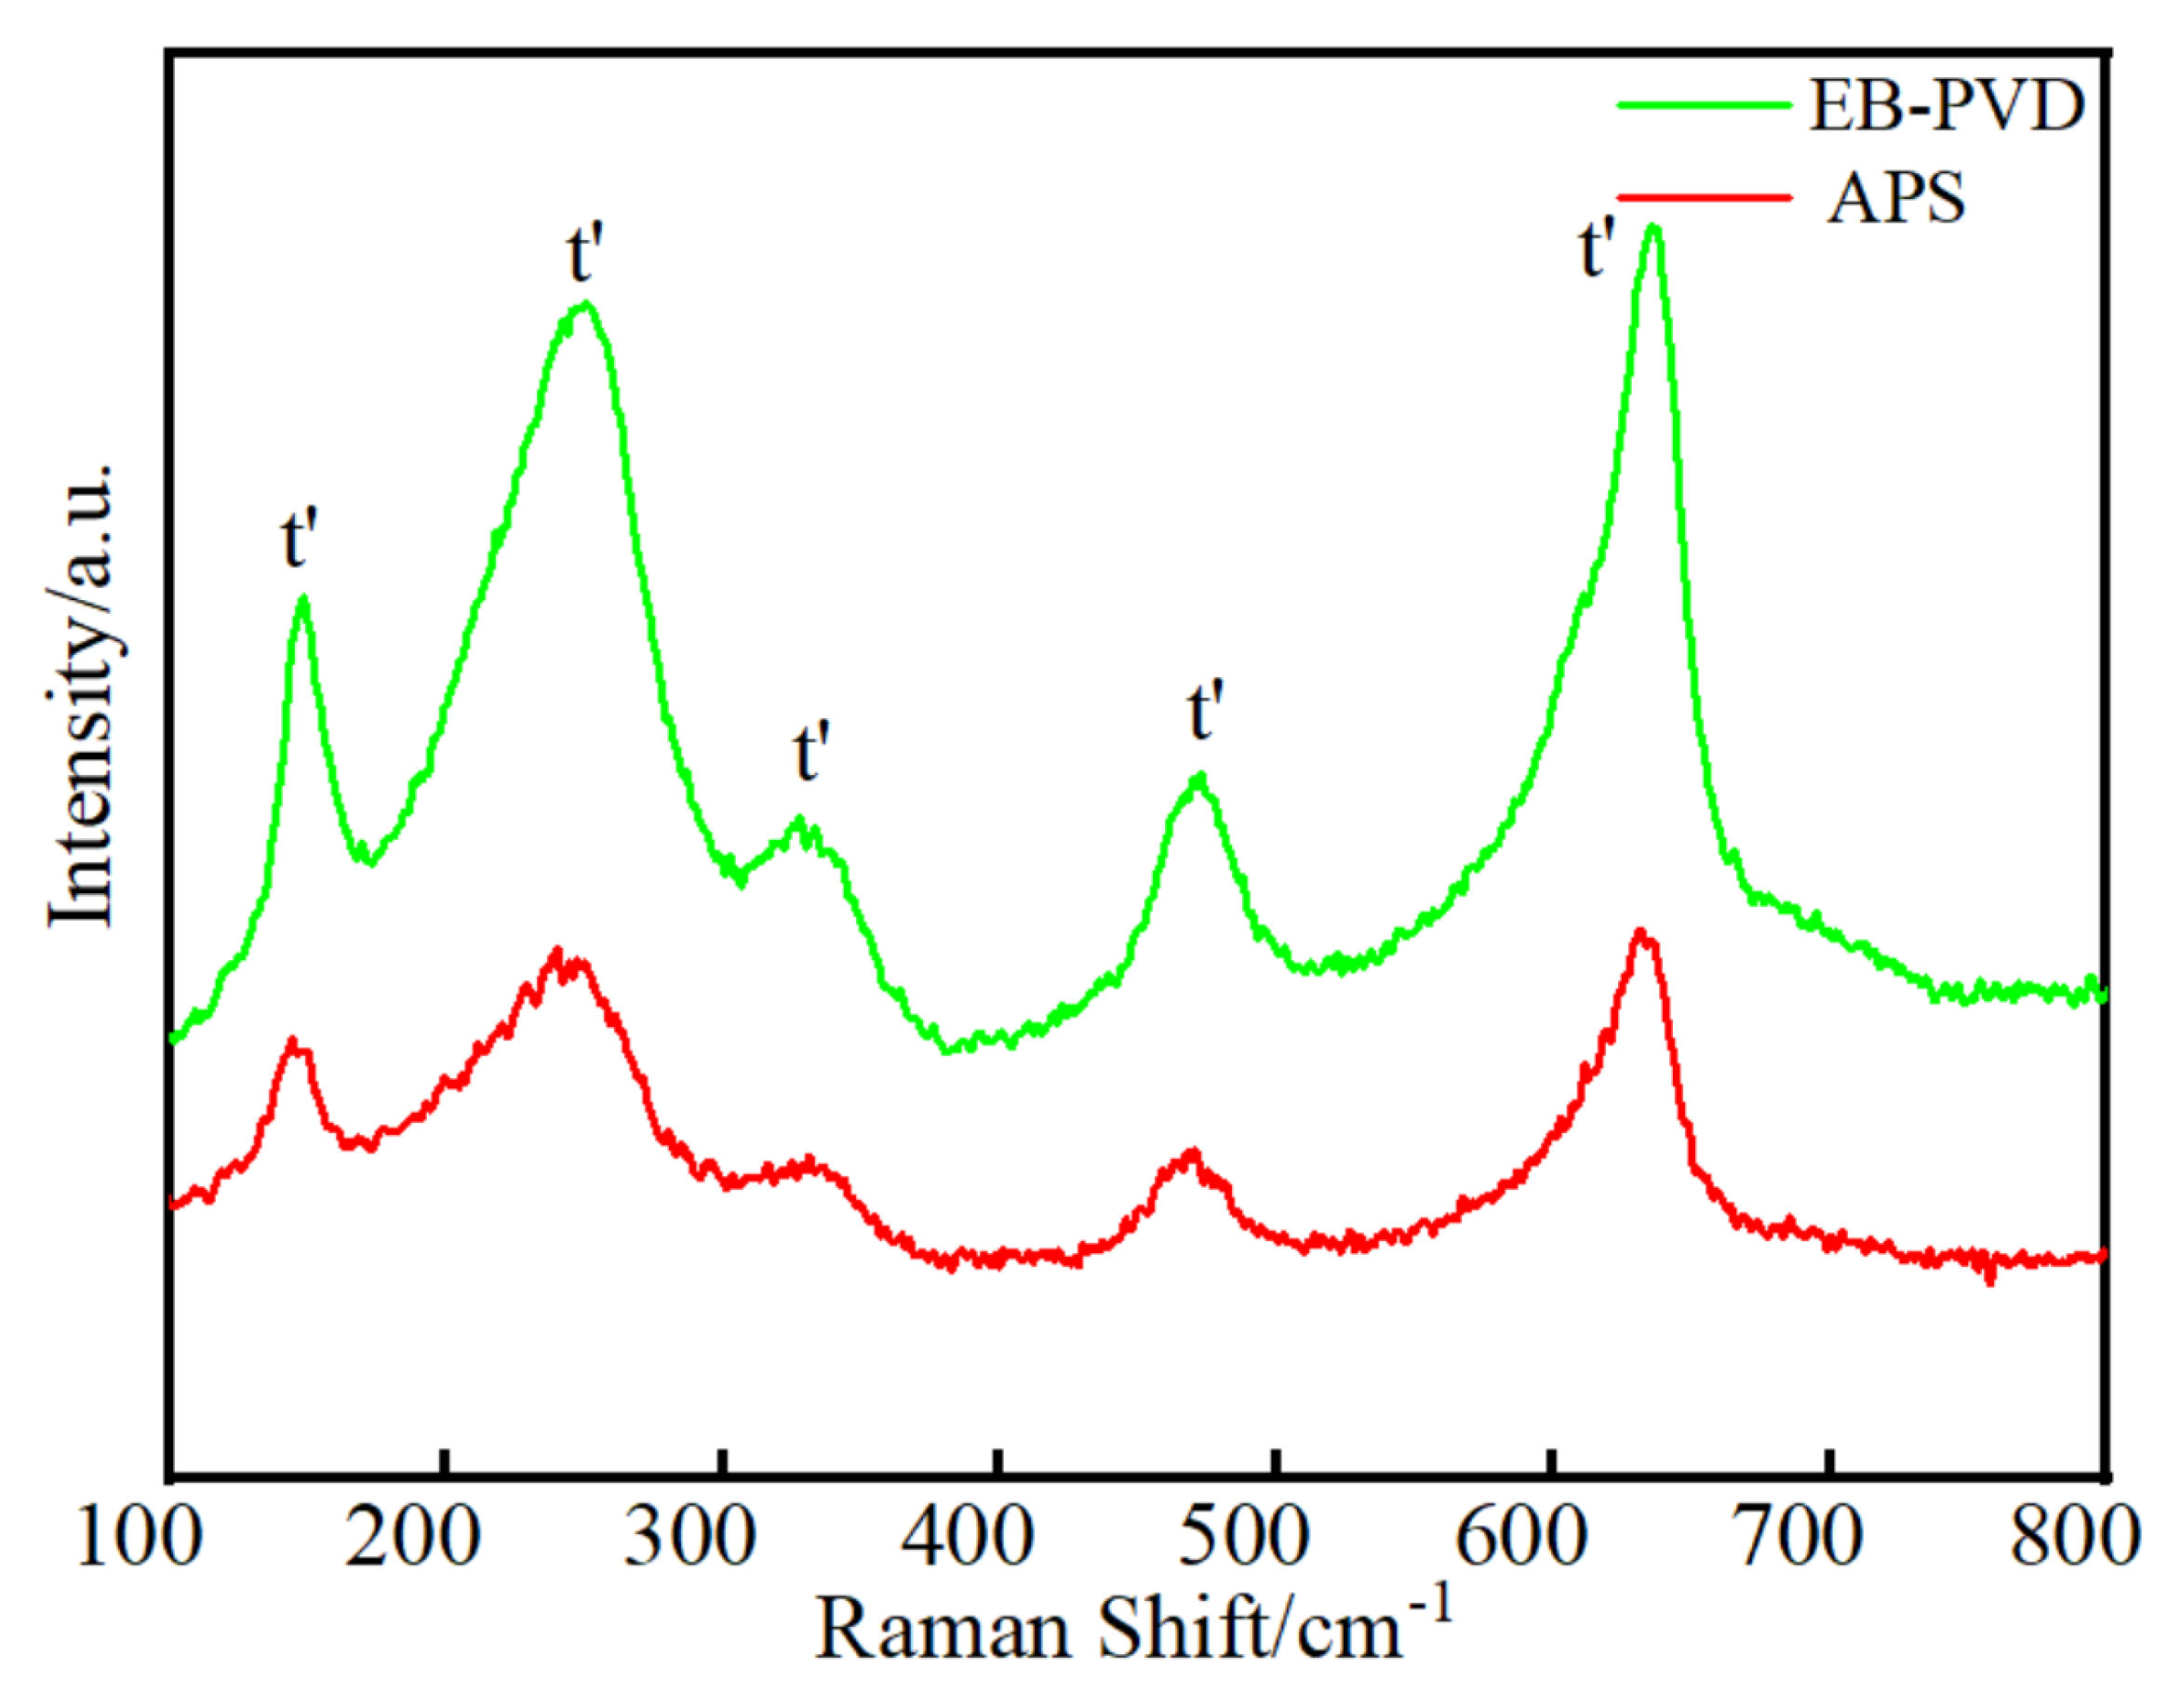
3.2. Phase Composition and Grain Morphology

The test results of EB-PVD samples in this study were consistent with the results of the thickness error of about 10% reported in Fukuchi T. et al. [18], while the data of APS samples showed a large error distribution. In order to investigate the thickness errors of the THz method for the coatings prepared by the two technologies, the phases of the samples prepared by the two technologies were detected first. The Raman spectra of the samples were tested using a high-resolution laser Raman spectrometer, as shown in Figure 5.
It can be seen that the characteristic peaks of 148 cm−1, 252 cm−1, 334 cm−1, 471 cm−1, and 636 cm−1 appear in both EB-PVD samples and APS samples are metastable tetragonal phase t’, so the errors are not caused by the differences in phases. Here, the difference in peak intensity is caused by the difference in thickness of the samples. This conclusion is consistent with the study of Watanabe M. et al. [32]. Furthermore, considering the obvious difference in grain morphology between them, the optical paths of terahertz waves propagating in the typical columnar crystal structure prepared by EB-PVD and the layered structure prepared by the APS are shown in Figure 6. For the EB-PVD samples (Figure 6a), the dendrite gaps are close to the incidence and propagation directions of terahertz waves; the transverse grain boundaries are less when the waves propagate through the grain, so the energy loss during the propagation process is less too. However, the APS samples (Figure 6b), which possess layered structures, will encounter layered spaces when terahertz waves propagate through the samples. The terahertz waves propagate in an uneven medium consisting of YSZ and air gaps. Due to the large number of pores, the scattering accumulation of terahertz photons in the transverse gap results in a reduction in the energy returned to the receiver, corresponding to the terahertz amplitude signals weakened in the thickness calculation equation. Therefore, compared with the EB-PVD samples, it can be inferred that the thickness errors of the APS samples increase due to the decreased energy.
In addition, the terahertz time domain pulse echo patterns of the EB-PVD and APS samples are also different. Figure 7 gives the typical spectrograms. Numbers 1, 2, 3, 4, 5, and 6 in Figure 7a represent the crest and trough of echo signal S, the crest and trough of echo signal R1, and the trough and peak of echo signal R2, respectively. Numbers 1, 2, 3, 4, 5, and 6 in Figure 7b represent the trough and peak of echo signal S, the trough and peak of echo signal R1, and the peaks and troughs of echo signal R2, respectively. They are arranged on the horizontal axis from left to right.
The typical terahertz time domain pulse echoes of the samples prepared by the two technologies were statistically analyzed in terms of full width at half maximum (FWHM) and amplitude intensity, and the results are drawn in Figure 8.
It can be seen that the first three pulse echoes of the EB-PVD samples present a relatively uniform FWHM, and their intensities show a ratio relationship of 3.36:2.29:1. As for the APS samples, with the increase in reflection times, the FWHM gradually widened, and the signal intensity ratio was 15.41:4.05:1. According to Figure 2b, the optical distances of the R1 and R2 echoes in the samples are 2dcosφ and 4dcosφ, respectively. As there is no energy loss caused by scattering when terahertz waves propagate in an ideal medium, the ratio of the intensities would be 4:2:1. It is clear that the propagation of terahertz waves in the EB-PVD samples is closer to the ideal state. The terahertz waves in the APS samples experience more scattering accumulation, so the signal intensity ratio deviates greatly from the ideal ratio relation, and this deviation increases the errors of the thicknesses.

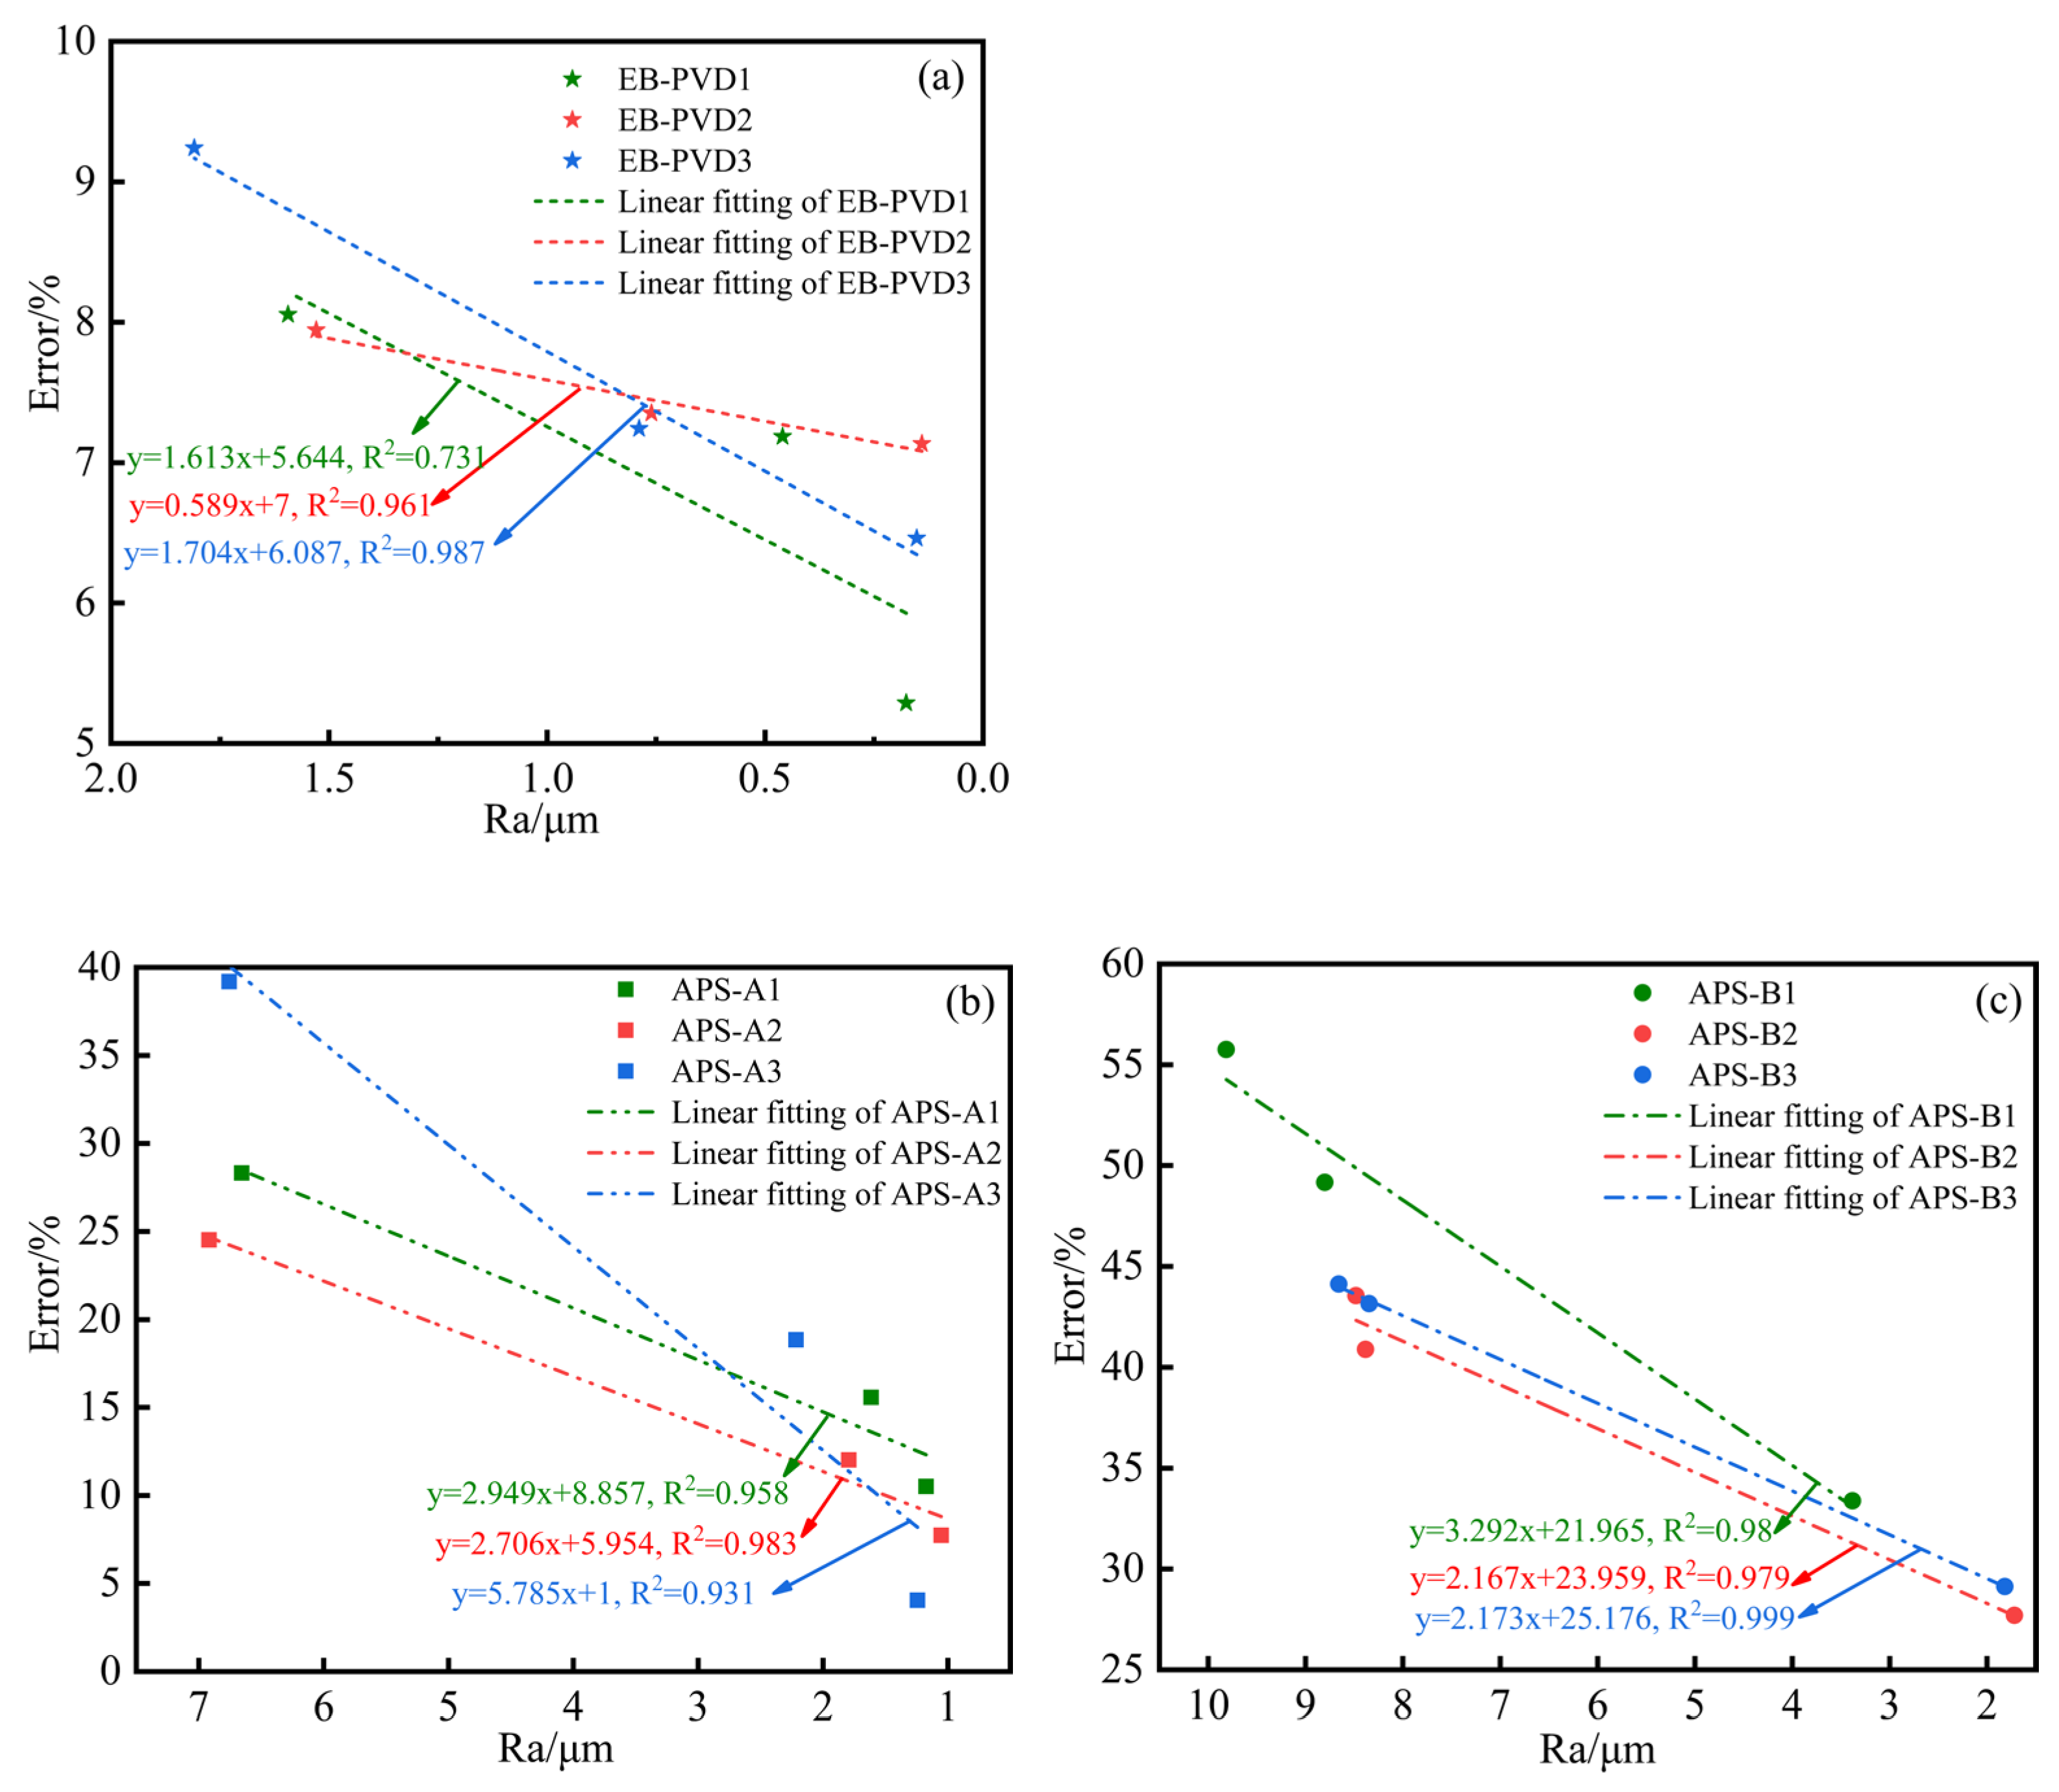
3.3. Surface Roughness
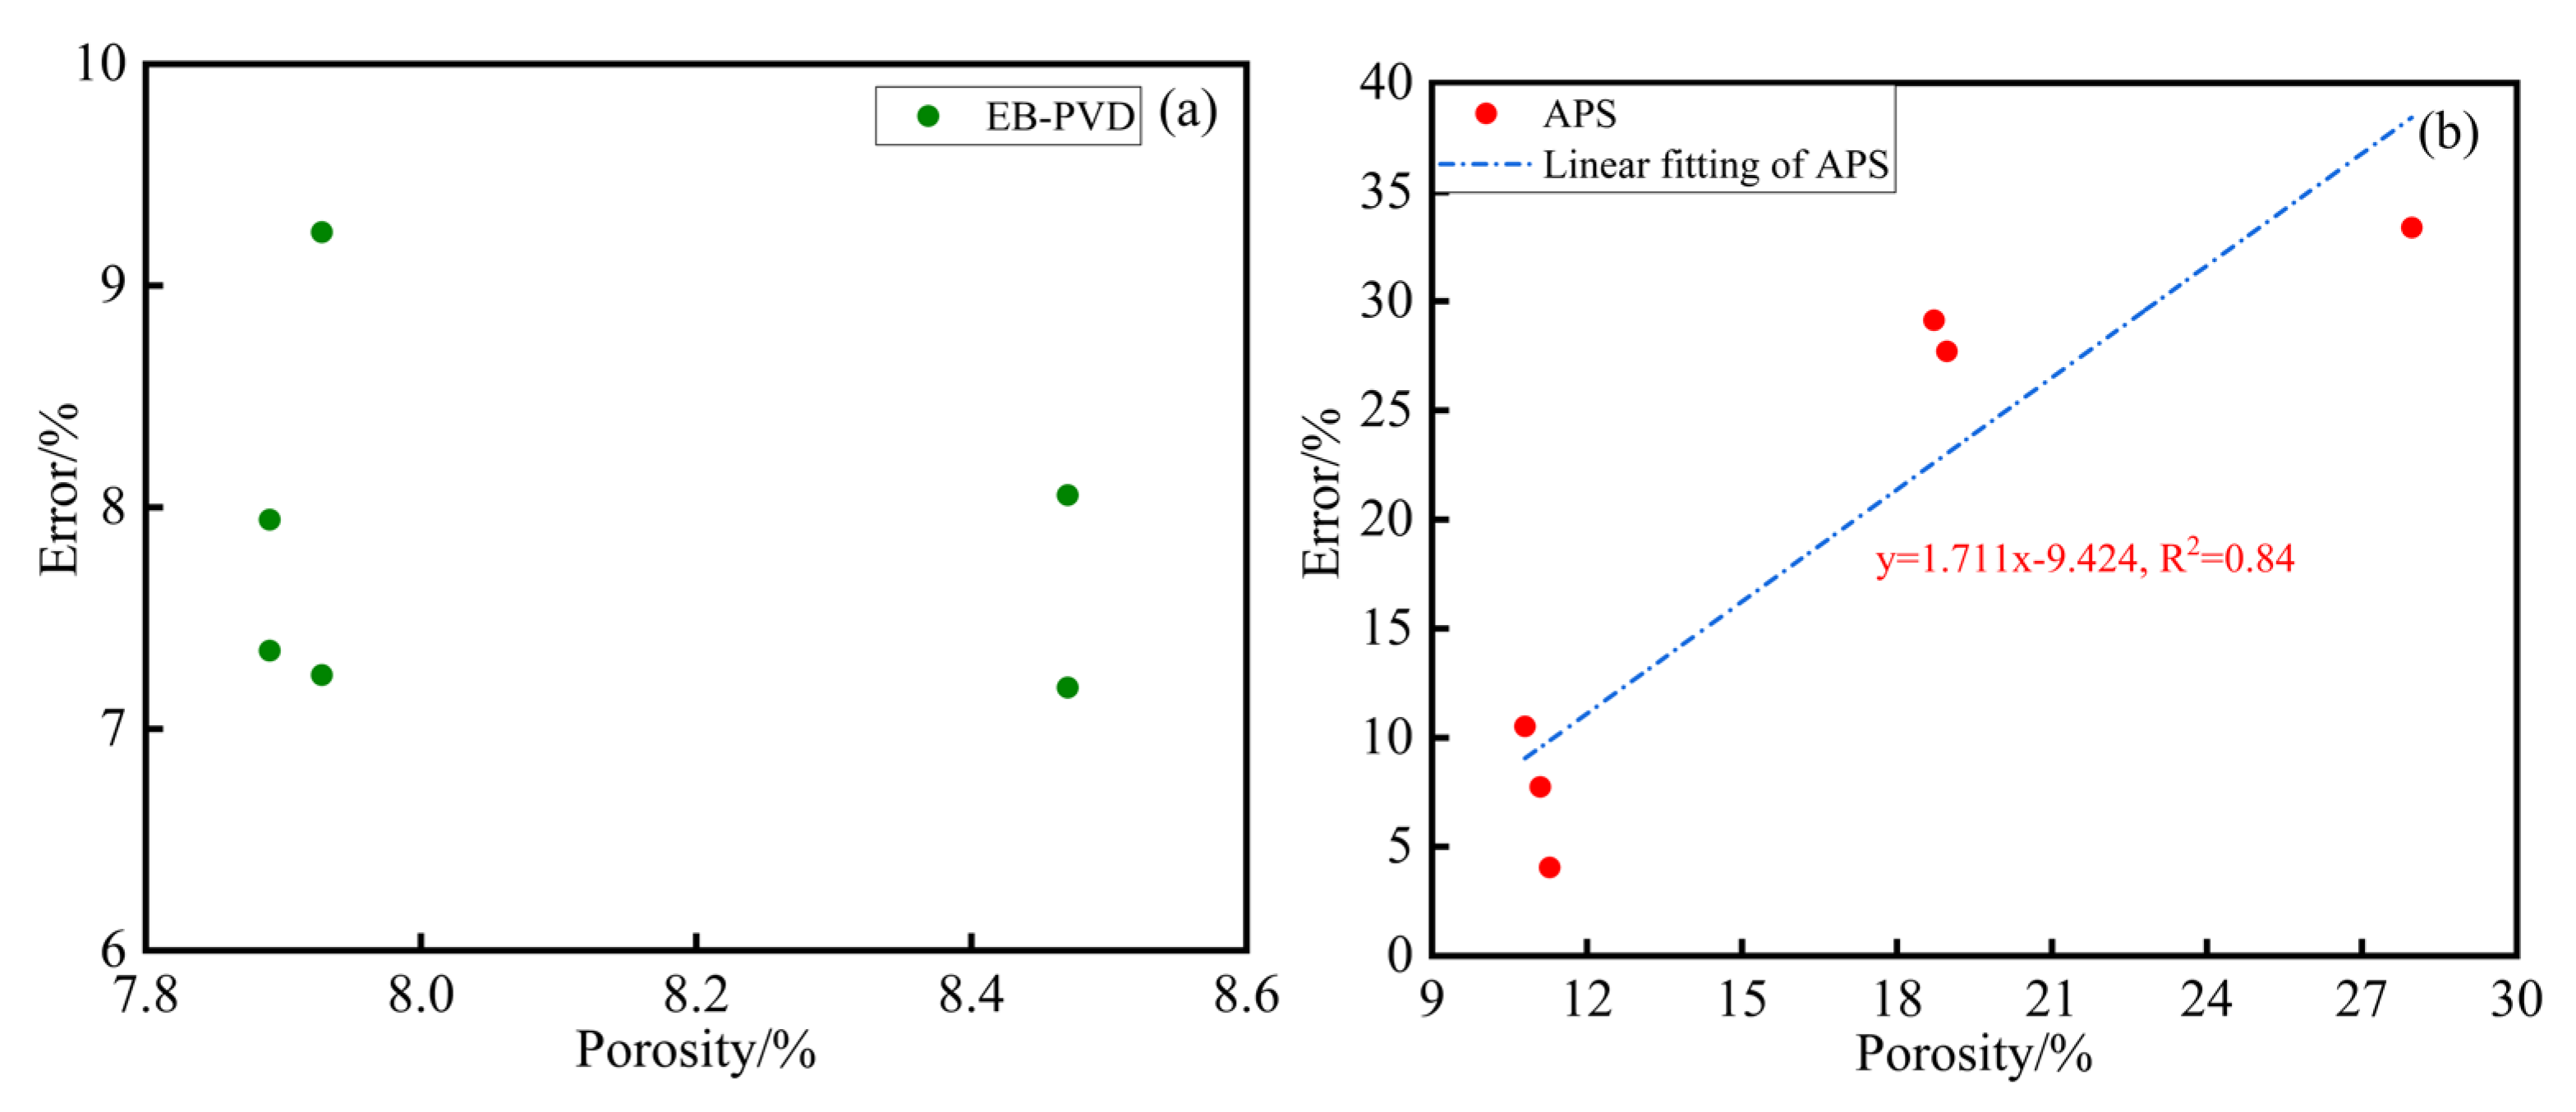
The surface roughness of APS samples is often greater than that of EB-PVD samples due to the different characteristics of coating preparation. Research [33,34,35,36,37,38] showed that with the increase in roughness, the terahertz signals will be attenuated by the complex scattering phenomena on the surface of the samples, resulting in a decrease in detectable reflected signals and an increase in measurement errors.
In order to discuss the influence of surface roughness on thickness measurement errors, the surfaces of the original TBC samples were polished twice. The backscattered electron images of longitudinal sections are shown in Figure 9 and Figure 10, with P1 and P2 as prefixes to distinguish them from the labels of the original samples. The red arrows are used to indicate the measured thicknesses. The evolutional relationships between the thickness errors and the surface roughness can be obtained and plotted in Figure 11.
As can be seen from Figure 11, the measurement errors of all the TBC samples tend to decrease as the surface roughness reduces. However, EB-PVD samples have relatively low slopes (between 0.59 and 1.7) due to their lower original surface roughness (Ra < 1.8 μm) compared with the APS samples (Ra > 6.7 μm). Because of the larger initial surface roughness, grinding to reduce the surface roughness can significantly reduce the errors (the slopes of the curves range from 2.17 to 5.79) of APS samples. Therefore, the surface roughness of the samples should be reduced by controlling the shot peening sizes or other methods without affecting the other performances of the TBCs, which makes the application of the terahertz NDT method in the thickness measurement of TBCs more convenient and feasible.
It can be seen from Table 3 that, under the same surface roughness level, the errors of the samples from the three groups are 9.24%, 12.02%, and 29.13%, respectively. This indicates that there are some other error-influencing factors, such as grain morphology discussed in Section 3.2 and pores, which will be discussed in Section 3.4 below.

3.4. Porosity

Six EB-PVD and APS samples exhibiting the least surface roughness were chosen from the entire sample set. The investigation focused on understanding the impact of porosity on thickness measurement errors and minimizing the influence of surface roughness. Figure 12 illustrates the correlations between porosities and the measurement errors of the samples.
Figure 12 demonstrates that EB-PVD samples depict an absence of a discernible correlation between porosities and errors, primarily attributable to the consistent and stable porosity values within a small distribution range. Conversely, APS samples exhibit a clear linear relationship. The relatively low R2 value in this case is suspected to stem from differing size distributions between the raw powders used for APS samples. Notably, larger powder sizes amplify errors in the APS-B samples. Consequently, Figure 13 displays the typical microtopography of the two groups of APS samples for further analysis.
It can be seen from Figure 13 that there are obviously large agglomerates inside the samples, attributed to the utilization of larger YSZ powders in the APS-B samples. When terahertz waves interact with these agglomerates, they undergo increased absorption, thereby diminishing the energy that can be received back from the detector. This interaction subsequently amplifies the errors in thickness measurement.

4. Conclusions

This study utilized both APS and EB-PVD technologies to fabricate TBC samples featuring diverse grain morphologies, porosities, surface roughness, and internal agglomerates. Through the application of the THz-TDS method to measure TBC thicknesses, the resultant errors were compared against SEM results, leading to the following conclusions:
(1)
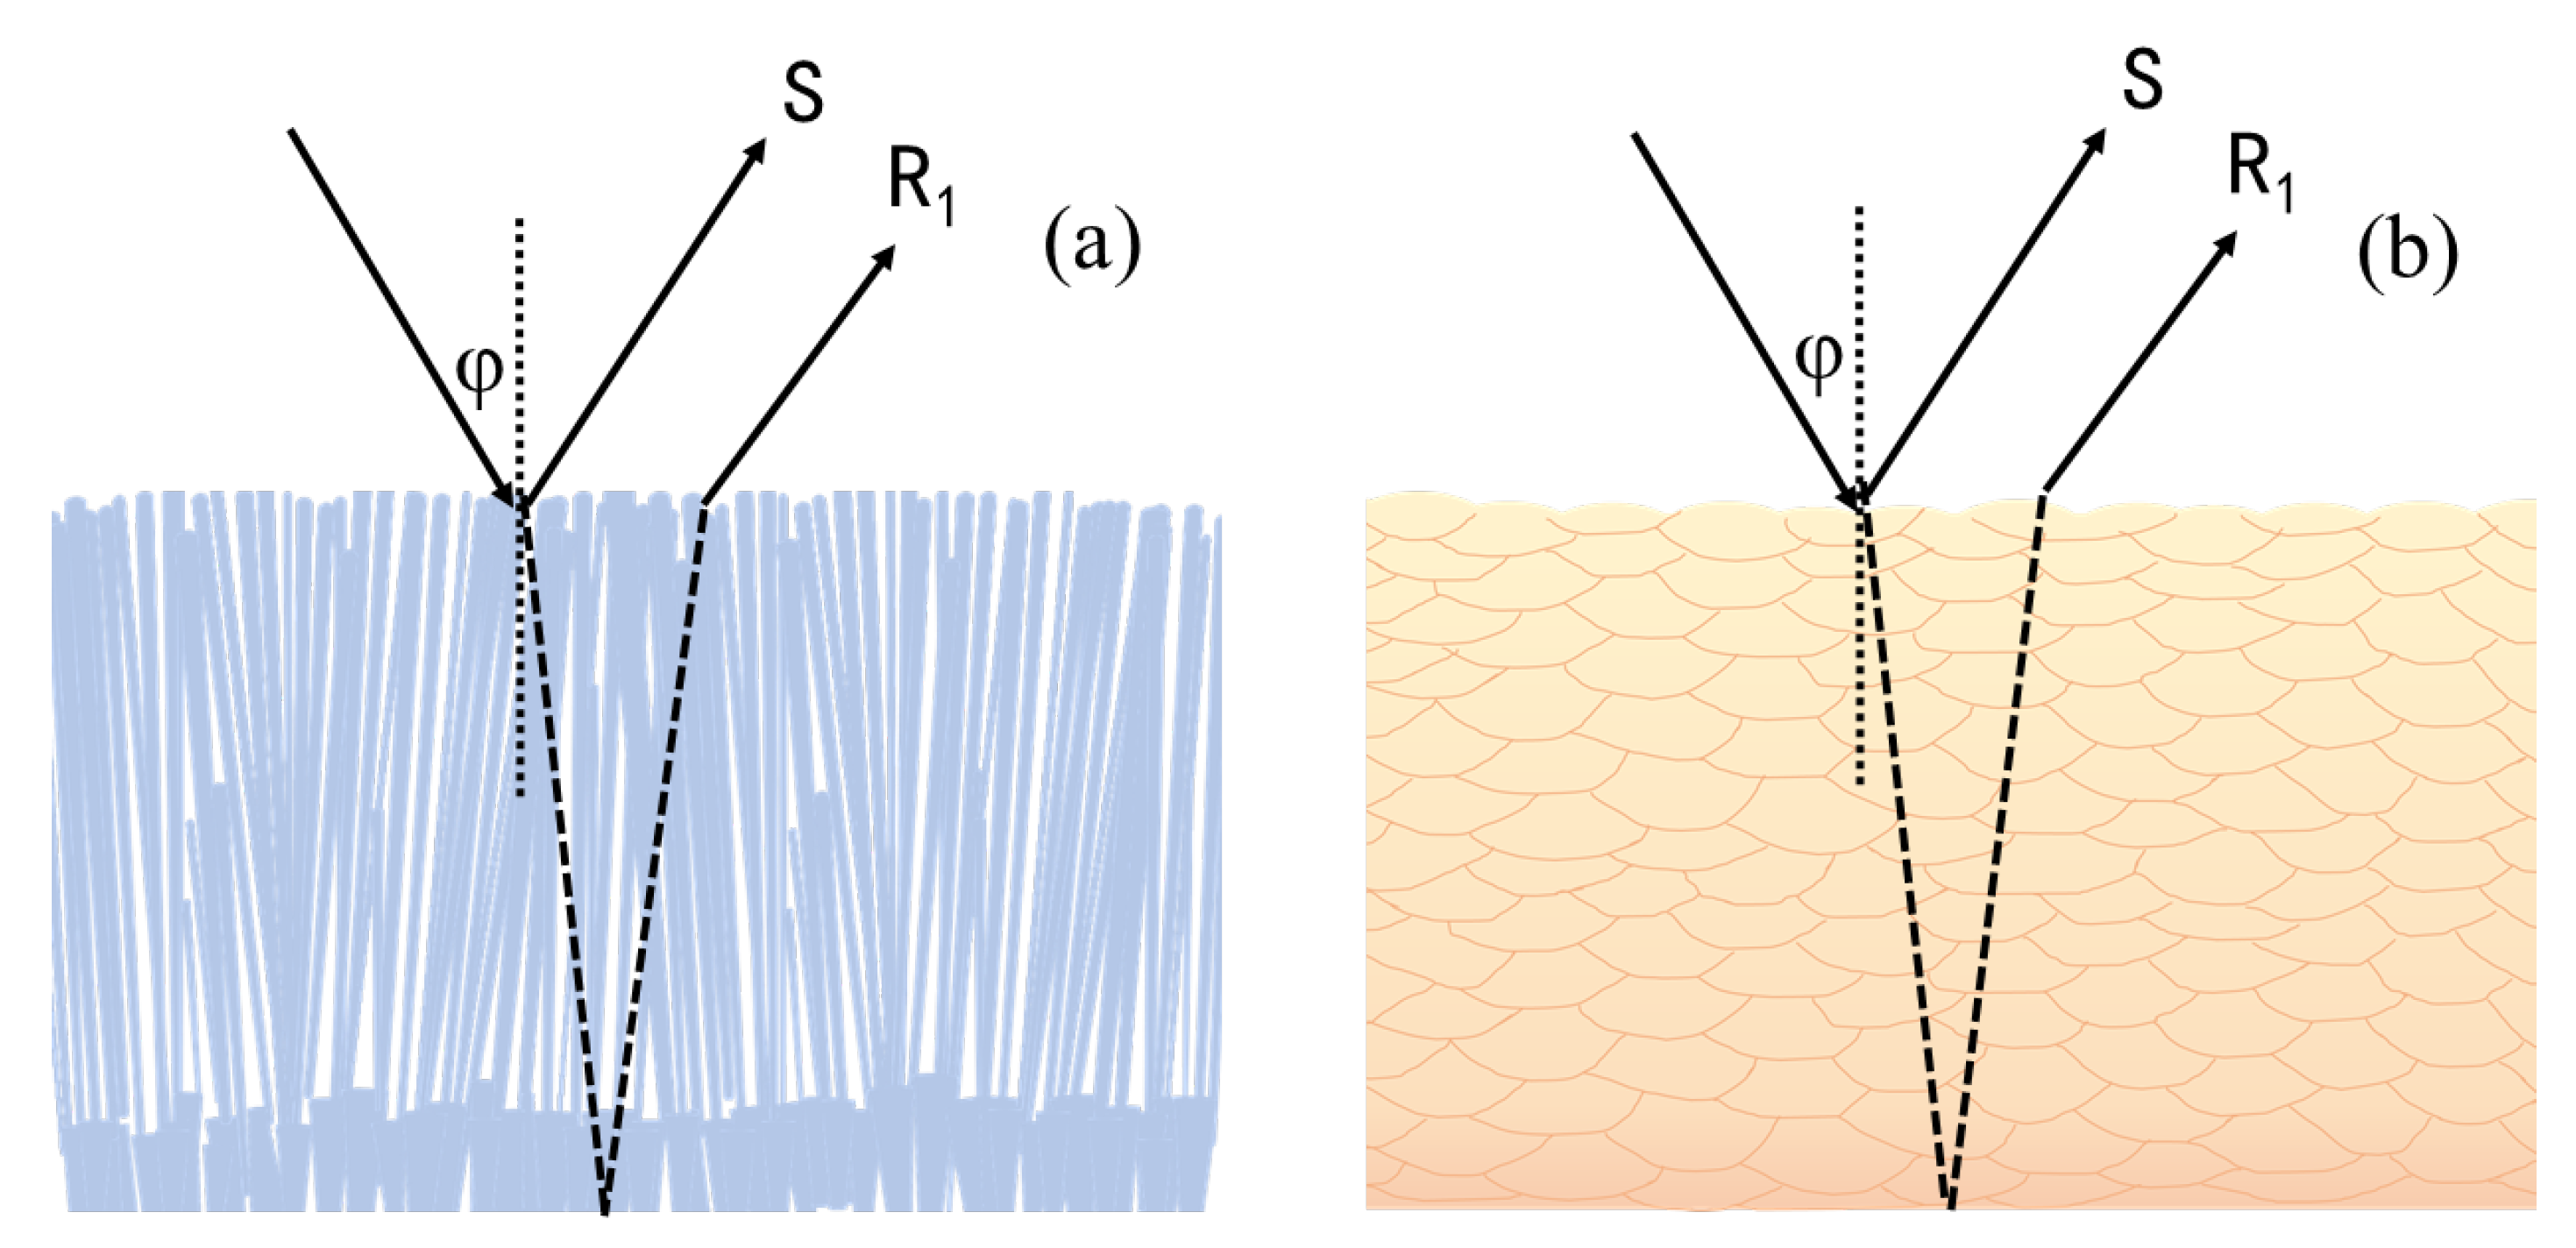
In EB-PVD samples, the dendrite aligns closely with the direction of terahertz wave incidence and propagation. Consequently, encounters with transverse grain boundaries and cracks during wave propagation within the grain are less frequent compared to APS samples. This configuration results in relatively lower energy losses during propagation. Conversely, in APS samples, terahertz waves traverse a heterogeneous layered structure comprising YSZ and air due to the overlapping nature of the coatings and the presence of gaps. The scattering accumulation of terahertz photons within the transverse gaps leads to reduced energies received by the detector. This reduction in signal intensities within the thickness calculation equation ultimately increases thickness errors.
(2)
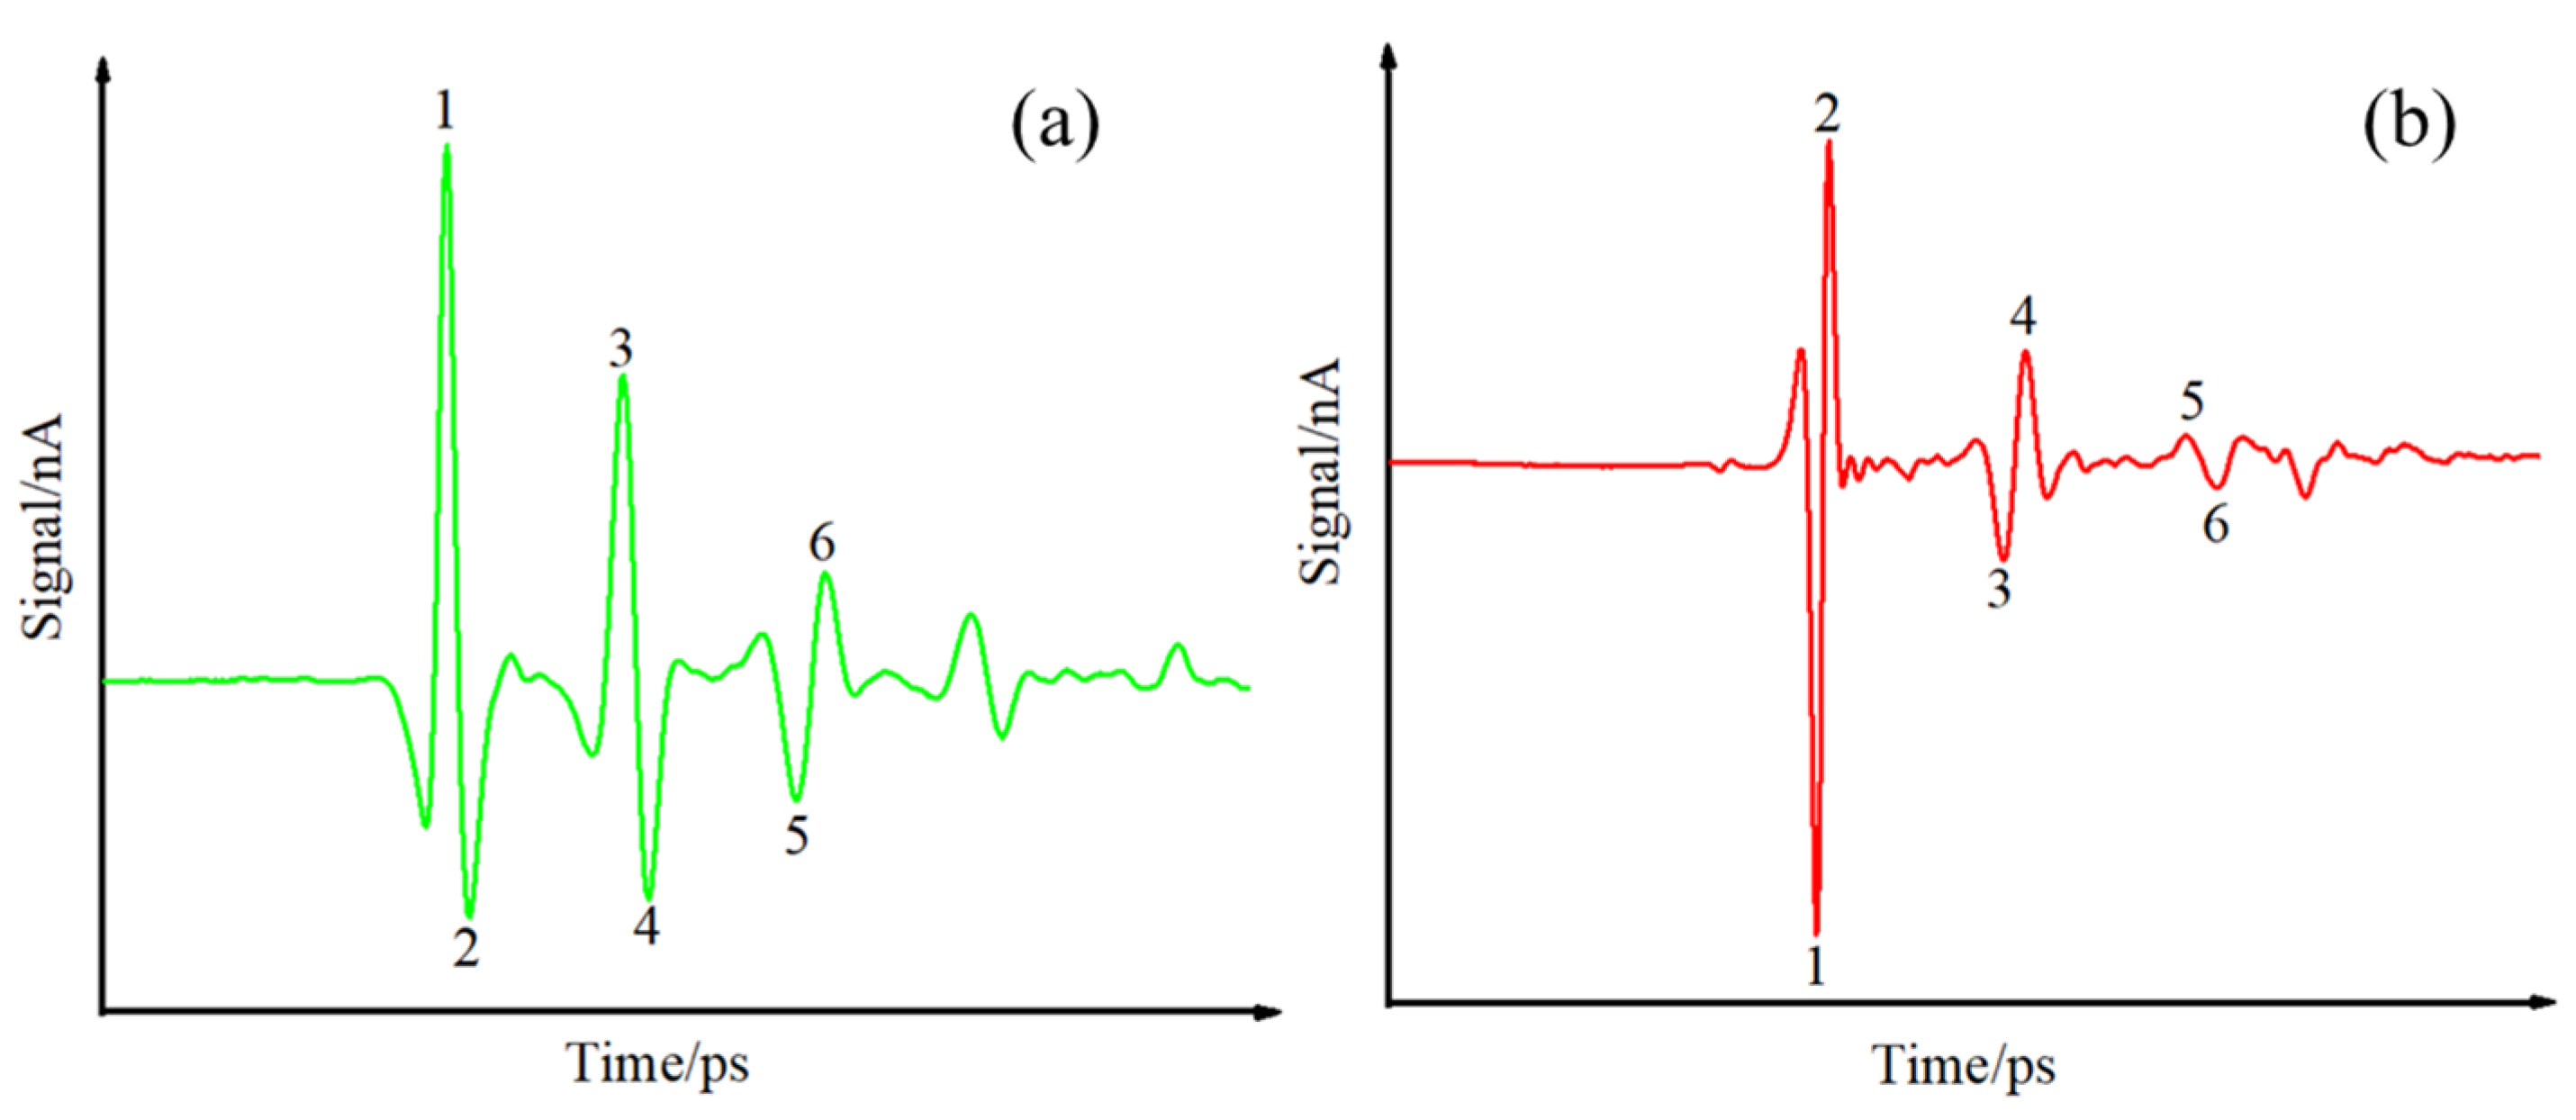
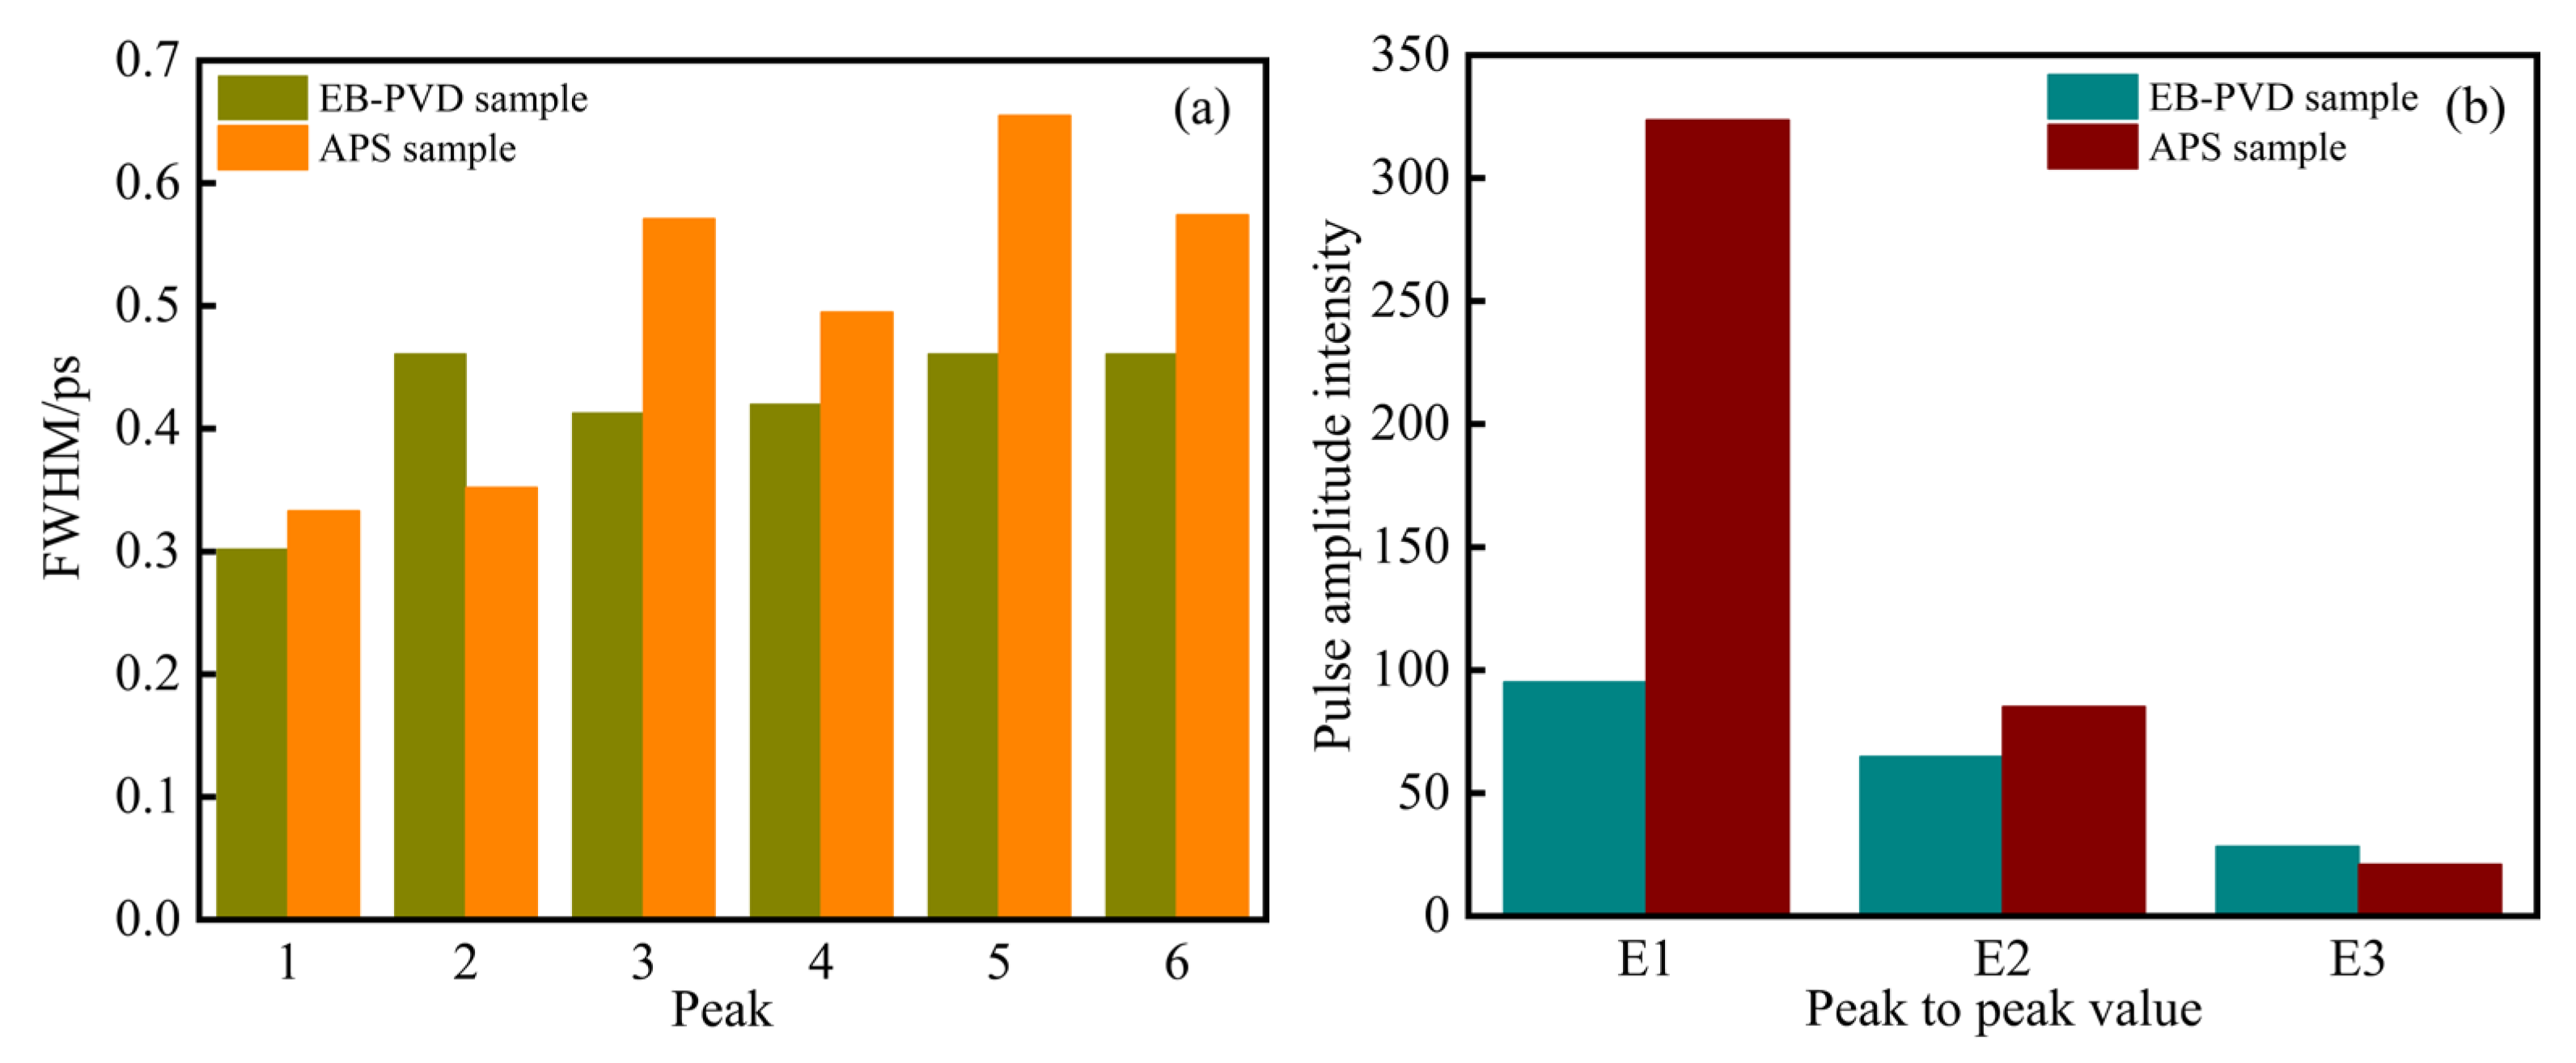
When compared to the terahertz time-domain spectra of APS samples, the pulse intensity ratios observed in the first three instances of EB-PVD coatings more closely resemble the ideal state where there is minimal energy loss due to scattering. Consequently, this similarity results in smaller errors.
(3)
When the terahertz waves interact with rough surfaces, the detected reflected signals undergo reduction due to attenuation and distortion caused by scattering phenomena. Through polishing the samples to decrease surface roughness, it was observed that the thickness errors of the samples diminish proportionally with reduced roughness. Notably, owing to their inherently low initial surface roughness, the impacts of surface roughness alterations on EB-PVD samples are comparatively smaller than on APS samples. In future scientific research and engineering, the exploration of coating preparation processes with the lowest possible surface roughness to avoid compromising coating properties is imperative. This pursuit aims to enhance the role of the terahertz method in accurately measuring the thickness of TBC samples.
(4)
The presence of pores and agglomerates within the samples leads to a broadening of the pulse echoes in the time-domain spectra. This extension increases the time interval Δt within the calculation formula, consequently reducing the accuracy of thickness measurement, particularly noticeable in APS samples. While estimating the trends in error variations concerning porosities, the lower R2 value is believed to stem from distinct size distributions in the raw powders utilized in APS samples. Future research will involve utilizing TBC samples exhibiting broader porosity ranges while maintaining consistent size distributions through a controlled preparation process. This strategic approach aims to further scientifically investigate the relationships between porosities and measurement errors.

Author Contributions

H.Z.: investigation, conceptualization, data curation, writing—original draft preparation and writing—review and editing; Y.X.: software and formal analysis; Y.F.: validation; L.G.: validation; Y.S.: supervision, validation, resources, and project administration; Y.P.: supervision; X.B.: validation and supervision; S.G.: resources. All authors have read and agreed to the published version of the manuscript.

Funding

This research was funded by the Beijing Natural Science Foundation (No. 22B20116), the Funds of the Zhejiang Provincial Natural Science Foundation of China (No. LZ23E020005), the Science Center for Gas Turbine Project (No. P2022-B-IV-009-001), the National Science and Technology Major Project (No. J2019-VII-0008-0148), and by University-Industry Cooperation Project (No. HFZL2021CXY016).

Informed Consent Statement

Not applicable.

Data Availability Statement

Data are contained within the article.

Acknowledgments

We would like to thank Beihang University for their contribution to funding acquisition and project administration.

Conflicts of Interest

The authors declare no conflicts of interest.

References

  1. David, R.C.; Simon, R.P. Thermal barrier coating materials. Mater. Today 2005, 8, 22–29. [Google Scholar] [CrossRef]
  2. Lee, P.H.; Lee, S.Y.; Kwon, J.Y.; Myoung, S.W.; Lee, J.H.; Jung, Y.G.; Jung, Y.G.; Cho, H.; Paik, U. Thermal cycling behavior and interfacial stability in thick thermal barrier coatings. Surf. Coat. Technol. 2010, 205, 1250–1255. [Google Scholar] [CrossRef]
  3. Ahmaniemi, S.; Vuoristo, P.; Mäntylä, T.; Cernuschi, F.; Lorenzoni, L. Modified thick thermal barrier coatings: Thermophysical characterization. J. Eur. Ceram. Soc. 2004, 24, 2669–2679. [Google Scholar] [CrossRef]
  4. Available online: http://www.gepower.com/prod_serv/products/tech_docs/en/downloads/ger3569g.pdf (accessed on 15 December 2023).
  5. Tilmann, B.; Olena, T.; Roland, H.; Singheiser, L. TBCs for Gas Turbines under Thermomechanical Loadings: Failure Behaviour and Life Prediction. J. Energy Power Eng. 2013, 7, 647–653. [Google Scholar] [CrossRef]
  6. Padture, N.P. Thermal Barrier Coatings for Gas-Turbine Engine Applications. Science 2002, 296, 280–284. [Google Scholar] [CrossRef] [PubMed]
  7. Mehboob, G.; Liu, M.J.; Xu, T.; Hussain, S.; Mehboob, G.; Tahir, A. A review on failure mechanism of thermal barrier coatings and strategies to extend their lifetime. Ceram. Int. 2019, 46, 8497–8521. [Google Scholar] [CrossRef]
  8. Cao, X.Q.; Vassen, R.; Stöver, D. Ceramic materials for thermal barrier coatings. J. Eur. Ceram. Soc. 2004, 24, 1–10. [Google Scholar] [CrossRef]
  9. Lu, Z.; Myoung, S.W.; Kim, E.H.; Lee, J.H.; Jung, Y.G. Microstructure evolution and thermal durability with coating thickness in APS thermal barrier coatings. Mater. Today Proc. 2014, 1, 35–43. [Google Scholar] [CrossRef]
  10. Zhang, D.; Yu, Y.; Lai, C.; Tian, G. Thickness measurement of multi-layer conductive coatings using multifrequency eddy current techniques. Nondestruct. Test. Eval. 2016, 31, 191–208. [Google Scholar] [CrossRef]
  11. Lescribaa, D.; Vincent, A. Ultrasonic characterization of plasma-sprayed coatings. Surf. Coat. Technol. 1996, 81, 297–306. [Google Scholar] [CrossRef]
  12. Newaz, G.; Chen, X. Progressive damage assessment in thermal barrier coatings using thermal wave imaging technique. Surf. Coat. Technol. 2005, 190, 7–14. [Google Scholar] [CrossRef]
  13. Shrestha, R.; Kim, W. Evaluation of coating thickness by thermal wave imaging: A comparative study of pulsed and lock-in infrared thermography-part I: Simulation. Infrared Phys. Technol. 2017, 83, 124–131. [Google Scholar] [CrossRef]
  14. Lee, Y.S. Principles of Terahertz Science and Technology; National Defence Industry Press: Beijing, China, 2012; p. 8. [Google Scholar]
  15. White, J.; Fichter, G.; Chernovsky, A.; Whitaker, J.F.; Das, D.; Pollock, T.M.; Zimdars, D.; Thompson, D.O.; Chimenti, D.E. Time-domain terahertz non-destructive evaluation of aeroturbine blade thermal barrier coatings. AIP Conf. Proc. 2009, 28, 434–439. [Google Scholar] [CrossRef]
  16. Chen, C.C.; Lee, D.J.; Pollock, T.; Whitaker, J.F. Pulsed-terahertz reflectometry for health monitoring of ceramic thermal barrier coatings. Opt. Express 2010, 18, 3477–3486. [Google Scholar] [CrossRef] [PubMed]
  17. Fukuchi, T.; Fuse, N.; Okada, M.; Fujii, T.; Mizuno, M.; Fukunaga, K. Measurement of refractive index and thickness of topcoat of thermal barrier coating by reflection measurement of terahertz waves. Electron. Commun. Jpn. 2013, 96, 37–45. [Google Scholar] [CrossRef]
  18. Fukuchi, T.; Fuse, N.; Okada, M.; Ozeki, T.; Fujii, T.; Mizuno, M.; Fukunaga, K. Topcoat Thickness Measurement of Thermal Barrier Coating of Gas Turbine Blade Using Terahertz Wave. Electr. Eng. Jpn. 2014, 189, 1–8. [Google Scholar] [CrossRef]
  19. Yuan, B.; Wang, W.; Ye, D.; Zhang, Z.; Fang, H.; Yang, T.; Wang, Y.; Zhong, S. Nondestructive Evaluation of Thermal Barrier Coatings Thickness Using Terahertz Technique Combined with PCA–GA–ELM Algorithm. Coatings 2022, 12, 390. [Google Scholar] [CrossRef]
  20. Ye, D.; Wang, W.; Zhou, H.; Huang, J.; Wu, W.; Gong, H.; Li, Z. In-situ evaluation of porosity in thermal barrier coatings based on the broadening of terahertz time-domain pulses: Simulation and experimental investigations. Opt. Express 2019, 27, 28150–28165. [Google Scholar] [CrossRef]
  21. Ye, D.; Wang, W.; Zhou, H.; Fang, H.; Huang, J.; Li, Y.; Gong, H.; Li, Z. Characterization of thermal barrier coatings microstructural features using terahertz spectroscopy. Surf. Coat. Technol. 2020, 394, 125836. [Google Scholar] [CrossRef]
  22. Ye, D.; Li, R.; Xu, J.; Pan, J. Data-Driven Method for Porosity Measurement of Thermal Barrier Coatings Using Terahertz Time-Domain Spectroscopy. Coatings 2023, 13, 1060. [Google Scholar] [CrossRef]
  23. Li, R.; Ye, D.; Zhang, Q.; Xu, J.; Pan, J. Nondestructive Evaluation of Thermal Barrier Coatings’ Porosity Based on Terahertz Multi-Feature Fusion and a Machine Learning Approach. Appl. Sci. 2023, 13, 8988. [Google Scholar] [CrossRef]
  24. Reed, R.C. The Superalloys Fundamentals and Applications; Cambridge University Press: Cambridge, UK, 2006; pp. 324–333. [Google Scholar]
  25. Zhao, W.; Wang, S.; Li, L.A.; Liu, D.; Li, C.; Wang, Z. Characterizing the Thermally Grown Oxide in Thermal Barrier Coating by Terahertz Time Domain Spectroscopy. Coatings 2023, 13, 376. [Google Scholar] [CrossRef]
  26. Jiang, X.; Xu, Y.; Hu, H.; Xie, W. Nondestructive testing of corrosion thickness in coated steel structures with THz-TDS. Measurement 2023, 217, 113088. [Google Scholar] [CrossRef]
  27. Liu, L.; Yu, H.; Zheng, C.; Ye, D.; He, W.; Wang, S.; Li, J.; Wu, L.; Zhang, Y.; Xie, J.; et al. Nondestructive Thickness Measurement of Thermal Barrier Coatings for Turbine Blades by Terahertz Time Domain Spectroscopy. Photonics 2023, 10, 105. [Google Scholar] [CrossRef]
  28. Ye, D.; Wang, W.; Zhou, H.; Li, Y.; Fang, H.; Huang, J.; Gong, H.; Li, Z. Quantitative Determination of Porosity in Thermal Barrier Coatings Using Terahertz Reflectance Spectrum: Case Study of Atmospheric-Plasma-Sprayed YSZ Coatings. IEEE Trans. Terahertz Sci. Technol. 2020, 10, 383–390. [Google Scholar] [CrossRef]
  29. Hakobyan, D.; Hamdi, M.; Redon, O.; Ballestero, A.; Mayaudon, A.; Boyer, L.; Durand, O.; Abraham, E. Non-destructive evaluation of ceramic porosity using terahertz time-domain spectroscopy. J. Eur. Ceram. Soc. 2022, 42, 525–533. [Google Scholar] [CrossRef]
  30. Ye, D.; Wang, W.; Xu, Z.; Yin, C.; Zhou, H.; Li, Y. Prediction of Thermal Barrier Coatings Microstructural Features Based on Support Vector Machine Optimized by Cuckoo Search Algorithm. Coatings 2020, 10, 704. [Google Scholar] [CrossRef]
  31. Cao, B.; Wang, M.; Li, X.; Fan, M.; Tian, G. Noncontact Thickness Measurement of Multilayer Coatings on Metallic Substrate Using Pulsed Terahertz Technology. IEEE Sens. J. 2020, 20, 3162–3171. [Google Scholar] [CrossRef]
  32. Watanabe, M.; Kuroda, S.; Yamawaki, H.; Shiwa, M. Terahertz dielectric properties of plasma-sprayed thermal-barrier coatings. Surf. Coat. Technol. 2011, 205, 4620–4626. [Google Scholar] [CrossRef]
  33. Cacciari, I.; Siano, S. THz Characterization of Corroded Metals: The Influence of Surface Roughness. In Proceedings of the 18th Italian National Conference on Photonic Technologies (Fotonica 2016), Rome, Italy, 6–8 June 2016. [Google Scholar]
  34. Cacciari, I.; Siano, S. Use of THz Reflectometry for Roughness Estimations of Archeological Metal Surfaces. J. Infrared Millim. Terahertz Waves 2017, 38, 503–517. [Google Scholar] [CrossRef]
  35. Fukuchi, T.; Fuse, N.; Mizuno, M.; Fukunaga, K. Surface Roughness Measurement Using Terahertz Waves. In Proceedings of the 3rd International Conference on Industrial Application Engineering, Kitakyushu, Japan, 28–31 March 2015; pp. 294–299. [Google Scholar]
  36. Cacciari, I.; Agresti, J.; Siano, S. Combined THz and LIPS analysis of corroded archaeological bronzes. Microchem. J. 2016, 126, 76–82. [Google Scholar] [CrossRef]
  37. Anastasi, R.F.; Madaras, E.I. Terahertz NDE for metallic surface roughness evaluation. In Proceedings of the Nondestructive Evaluation for Health Monitoring and Diagnostics, San Diego, CA, USA, 26 February–2 March 2006. [Google Scholar]
  38. Ye, D.; Wang, W.; Huang, J.; Lu, X.; Zhou, H. Nondestructive Interface Morphology Characterization of Thermal Barrier Coatings Using Terahertz Time-Domain Spectroscopy. Coatings 2019, 9, 89. [Google Scholar] [CrossRef]
Figure 1. A sample tested by terahertz time-domain spectroscopy. (a) physical picture; (b) schematic diagram.
Coatings 14 00079 g001
Figure 2. (a) Optical path diagram of THz wave propagation in a TBCs sample; (b) a typical time-domain spectrum of a TBCs sample measured by THz-TDS.
Coatings 14 00079 g002
Figure 3. SEM backscattering images of the longitudinal section of the original TBC samples. (a) EB-PVD1; (b) EB-PVD2; (c) EB-PVD3; (d) APS-A1; (e) APS-A2; (f) APS-A3; (g) APS-B1; (h) APS-B2; (i) APS-B3.
Coatings 14 00079 g003
Figure 4. Thickness and errors of TBC samples measured by SEM as well as THz-TDS methods.
Coatings 14 00079 g004
Figure 5. The Raman spectra of EB-PVD and APS samples.
Coatings 14 00079 g005
Figure 6. Optical path diagrams of the typical structures of the terahertz waves passing through (a) EB-PVD and (b) APS samples.
Coatings 14 00079 g006
Figure 7. Typical time domain spectrograms of (a) EB-PVD and (b) APS samples.
Coatings 14 00079 g007
Figure 8. (a) Full width at half maximum (FWHM) and (b) pulse amplitude intensity of the EB-PVD and APS samples.
Coatings 14 00079 g008
Figure 9. SEM backscattering images of longitudinal sections of TBC samples after first polishing. (a) P1-EB-PVD1; (b) P1-EB-PVD2; (c) P1-EB-PVD3; (d) P1-APS-A1; (e) P1-APS-A2; (f) P1-APS-A3; (g) P1-APS-B1; (h) P1-APS-B2; (i) P1-APS-B3.
Coatings 14 00079 g009
Figure 10. SEM backscattering images of longitudinal sections of TBC samples after secondary polishing. (a) P2-EB-PVD1; (b) P2-EB-PVD2; (c) P2-EB-PVD3; (d) P2-APS-A1; (e) P2-APS-A2; (f) P2-APS-A3; (g) P2-APS-B1; (h) P2-APS-B2; (i) P2-APS-B3.
Coatings 14 00079 g010
Figure 11. The variation trends of measurement errors of (a) EB-PVD, (b) APS-A, and (c) APS-B samples with surface roughness.
Coatings 14 00079 g011
Figure 12. The relationships between porosities and measurement errors of (a) EB-PVD and (b) APS samples.
Coatings 14 00079 g012
Figure 13. Morphology images of (a) APS-A and (b) APS-B samples.
Coatings 14 00079 g013
Table 1. Basic preparation parameters of technologies for coatings.
TechnologiesBasic Parameters
HVAFSpray distance of 150 mm;
Air flow rate of 84.2 L/min;
Propane flow rate of 86.5 L/min;
Robot traverse speed of 800 mm/s;
Powder delivery rate of 15–20 g/min
APSArc current of 560 A;
Arc voltage of 59 V;
Primary plasma gas (Ar) flow of 35 L/min;
Secondary plasma gas (H2) flow of 6.5 L/min;
Powder feeding gas (Ar) flow of 3.5 L/min;
Spray distance of 120 mm;
Powder delivery rate of 40 g/min
AIPArc current of 170 A
Evaporation temperature of 450 °C;
Bias voltage of −30 V;
Vacuum degree of 0.03 Pa
EB-PVDCurrent of 0.5~1 A;
Voltage of 22 ± 2 KV;
Substrate temperature of 900 °C;
Rotate speed of 15 r/min;
Feed rate of 0.3 mm/min
Table 2. The system parameters of a terahertz time-domain spectrometer.
ItemsParameters
terahertz beam diameter2.5 mm
dynamic range100 dB
spectral bandwidth50 μm
spectral resolution4.9 GHz
delay line scanning range0–200 ps
Table 3. Basic data sheet for samples with similar surface roughness.
Sample LabelsdSEM/μmPorosity/%Ra/μmError/%
EB-PVD3227.127.931.819.24
P1-APS-A2170.5111.091.7912.02
P2-APS-B3171.6318.721.81229.13
Disclaimer/Publisher’s Note: The statements, opinions and data contained in all publications are solely those of the individual author(s) and contributor(s) and not of MDPI and/or the editor(s). MDPI and/or the editor(s) disclaim responsibility for any injury to people or property resulting from any ideas, methods, instructions or products referred to in the content.

