Article

Investigation of the Influence of the Oxygen Flow Rate on the Mechanical, Structural and Operational Properties of 86WC-10Co-4Cr Coatings, as Determined Using the High-Velocity Oxyfuel Spraying Method

by
Bauyrzhan Rakhadilov
1,
Nazerke Muktanova
2,3,*,
Ainur Seitkhanova
4,5,
Dauir Kakimzhanov
2,3 and
Merkhat Dautbekov
2,3
1
Research Center “Surface Engineering and Tribology”, Sarsen Amanzholov East Kazakhstan University, Ust-Kamenogorsk 070000, Kazakhstan
2
International School of Engineering, Daulet Serikbayev East Kazakhstan Technical University, Ust-Kamenogorsk 070002, Kazakhstan
3
PlasmaScience LLP, Ust-Kamenogorsk 070010, Kazakhstan
4
High School of Natural Science, Pavlodar Pedagogical University, Pavlodar 140000, Kazakhstan
5
Engineering Centre “Innotechmash”, Ust-Kamenogorsk 070000, Kazakhstan
*
Author to whom correspondence should be addressed.
Coatings 2024, 14(10), 1275; https://doi.org/10.3390/coatings14101275
Submission received: 11 September 2024 / Revised: 30 September 2024 / Accepted: 4 October 2024 / Published: 6 October 2024
(This article belongs to the Special Issue Advances in Thermal Spray Coatings: Technologies and Applications)

Abstract

:
The structural-phase composition and tribological and performance properties of coatings based on an 86WC-10Co-4Cr composition obtained by the HVOF method at varying (150 L/min, 170 L/min, 190 L/min) oxygen flow rates were studied. The results showed that the coefficient of friction of coatings in gear oil remained almost unchanged with the variation in oxygen flow rate. However, microhardness increased significantly with an increasing oxygen flow rate, reaching a maximum at 190 L/min. An increasing oxygen flow rate was also accompanied by an increase in roughness and coating thickness, with a decrease in porosity, particularly notable at 190 L/min. Adhesion strength reached the maximum values for the A2 and A3 coatings under high loads. The phase composition of the coatings included WC, W2C and CoO phases irrespective of the oxygen flow rate, and their microstructure was characterized by a more homogeneous and dense structure. Thus, this study confirmed that the optimal oxygen flow rate for achieving an improved performance and tribological characteristics of 86WC-10Co-4Cr coatings is 190 L/min.

1. Introduction

One of the key classes of pipeline valves is shut-off valves designed for periodic or one-time shutdown of pipelines or facilities. The main type of industrial shut-off valve is a gate valve, which is used for transportation of oil and gas through complex pipeline networks, ensuring operational safety and environmental protection [1].
Currently, many industrial enterprises of the Republic of Kazakhstan engaged in the production of pipeline valves, such as JSC “Ust-Kamenogorsk Valve Plant” (Ust-Kamenogorsk), LLP “Kazakhstan Armature Plant” (Temirtau) and “Pavlodar Pipeline Valve Plant” (Pavlodar), continue to use outdated surfacing and coating technologies, including electric arc surfacing and galvanic chrome plating. These methods do not provide high tribological and corrosion characteristics of gate-seat assemblies. In addition, there are enterprises (for example, JSC “Ust-Kamenogorsk plant of industrial valves”, Ust-Kamenogorsk, RK), which have not yet mastered and implemented the technology of surfacing or spraying in the production of parts of gate valves [2]. Therefore, the need for comprehensive research and development on technological bases for increasing the service life of domestic gate valves, which can provide good operational safety and competitiveness of gate valves, is highly relevant. By introducing new technologies and methods in the production of gate valves, it is possible to significantly improve the quality of products and thereby make a certain contribution to the economy of the country of the Republic of Kazakhstan [3].
To date, there are many methods such as air plasma spraying (APS) [4], vacuum plasma spraying (VPS) [5], detonation spraying [6,7], arc spraying [8], flame spraying [9] and high-velocity oxyfuel spraying (HVOF) [10,11] to improve the durability of valve parts. However, in several studies [12,13,14], the HVOF process has been recognized for its advantages including low porosity, high erosion and corrosion resistance, high hardness and wear resistance, good adhesion and improved performance compared to the above-mentioned methods. The HVOF method has been widely used for carbide-based coatings such as 88WC-12Co [15,16], Cr3C2-NiCr [17,18,19] and 86WC-10Co-4Cr [20,21], which helps to improve the service life of shut-off valve parts. In particular, 86WC-10Co-4Cr-based metal–ceramic coatings have proven to be highly wear- and erosion-resistant materials, which are used in various industries including the marine industry, oil and gas drilling, pressure metalworking, power generation and offshore structures [22,23,24,25].
Cobalt (Co) in the metal–ceramic (cermet) coating composition is commonly used as a metal binder due to its low interfacial energy, optimal wetting and excellent adhesion in the solid state [26,27]. WC-Co based cermets have attracted considerable attention from researchers in the field of wear-resistant coatings [28,29]. However, despite their high wear resistance, the corrosion resistance of WC-based cermets depends largely on the binder metal phase, such as Co, Ni, CoCr or NiCr [19,30]. It has been found that high wear resistance characteristics are achieved with the CoCr matrix, which provides effective binding to carbides and prevents their loss at particle boundaries during wear [31,32].
However, in order to achieve high tribological characteristics of 86WC-10Co-4Cr coatings obtained by the HVOF process, spraying parameters should be systematically optimized to improve their quality and performance. In the HVOF process, such parameters are oxygen consumption, fuel consumption (e.g., acetylene, propane and others), distance between the substrate and spray nozzle, powder flow rate, powder shape and particle size, particle velocity and temperature, spray angle and substrate preheating [10,33]. These parameters affect the process results such as coating thickness, porosity, hardness, impact toughness, wear resistance, corrosion resistance and oxidation resistance. Therefore, many studies have been conducted by scientists to optimize the HVOF parameters. For example, Vignesh S. [34] sought to minimize porosity and increase hardness by optimizing HVOF spray parameters. They investigated the effects of fuel and oxygen flow rate, powder feed rate, spraying distance and carrier gas flow rate. The oxygen flow rate was found to be a key factor determining the porosity and hardness of the coating. Wang Y. et al. [35] investigated iron-based amorphous solids and their processing parameters. They found that the proportion of unmelted particles and porosity increased with an increasing powder feed rate and decreased with an increasing oxygen/fuel ratio. Zhang H. et al. [36] used different atomization parameters to create three iron-based metallic glass coatings. They found that the porosity decreases with increasing powder feed, whereas the amorphous phase content first increases and then decreases. A study [37] examined the effect of processing parameters of a tungsten carbide coating on a nickel substrate. It was found that hardness, compressive residual stresses, corrosion resistance, wear resistance and toughness improved when optimum parameters were selected. The deposition process significantly affects the performance of WC-based coatings, and the structure and composition of the powder feedstock are also important [38]. Chang Li et al. [39] modeled the flow field of the HVOF process using kerosene as the fuel, investigating the velocity, temperature and trajectory of WC-12Co particles. They studied the effects of the oxygen/fuel ratio, particle shape and size, and injection angle on the flame flow, finding that the oxygen/fuel ratio directly affected the flame flow characteristics. The best results for quality coating were achieved at a particle size of 10–30 μm and an injection angle of 45°. Zois D. et al. [40] used the HVOF technique to atomize stainless steel powder and statically optimized the atomization parameters. They observed that the corrosion resistance of the coating mainly depends on its porosity, which is primarily affected by the oxygen-to-fuel ratio. The porosity of the coating also decreases with short and moderate spray distances. For WC-Co-Cr coatings, the effect of the oxygen-to-fuel ratio on corrosion resistance was investigated by Picas J.A. et al. [11]. They found that porosity decreased with an increasing oxygen-to-fuel ratio, leading to improved corrosion resistance. Huang Y. et al. [38] prepared WC-10Co-4Cr nanostructured coatings by the HVOF method and studied their mechanical properties, microstructure and erosion and corrosion resistance by varying the process parameters. In their experiments, the oxygen flow rate was 100 L/min and the coating thickness was about 250 μm. They observed that the coatings obtained by thermal spraying using liquid fuel had higher corrosion resistance than those sprayed using gas fuel. Recently, Hong Sh. et al. [41] applied the Taguchi method to optimize the HVOF spraying parameters (spray distance, oxygen flow and kerosene flow) to achieve maximum hardness and wear resistance of WC-Co-Cr nanostructured coatings. They found a correlation between the atomization parameters, hardness and microstructure of the coatings.
It should be noted that our previous studies [2,3] analyzed various spraying parameters, including the initial powder size and spraying distance, that influence the structural-phase and tribological properties of WC-10Co-4Cr coatings produced by the HVOF method. In [3], samples made from powders of four different fractions, 0–20 μm, 20–30 μm, 30–40 μm and 40–45 μm, were investigated. It was found that the smaller fraction particles (0–20 μm) were subjected to overheating, which favored the decarburization process. Medium-sized particles (20–30 μm and 30–40 μm) prevented overheating and were characterized by a more homogeneous structure. Large powder fractions (40–45 μm) did not reach a sufficient temperature for complete melting, which led to the formation of pores in the coating layers. In a subsequent study [2], coatings were obtained by varying the spraying distance. The results showed that the optimum spraying distance for 86WC-10Co-4Cr coatings with improved wear resistance and hardness characteristics and low porosity is 300 mm.
Literature analysis shows that the available information on the prediction of porosity, hardness and structural and phase properties of tungsten carbide (WC)-based metal–ceramic coatings, including HVOF spraying parameters, is insufficient. In this regard, the aim of the present study was to investigate the influence of the oxygen flow rate on the phase composition, microstructure, tribological properties and adhesion strength of 86WC-10Co-4Cr coatings obtained by the HVOF method.

2. Materials and Methods

A common spherical, agglomerated and sintered 86WC-10Co-4Cr powder with a particle size of 15–45 μm was used as a starting powder, as shown in Figure 1a (AO “Polema”, Tula, Russia). The image presented in Figure 1a was obtained using the backscattered electron method. All coatings were applied on samples made of high-alloy, corrosion-resistant steel 30X13, which were sandblasted before spraying. The chemical composition of the substrate and 86WC-10Co-4Cr powder were described in detail in a previous study [3]. From the SEM pattern of the powder (Figure 1a), a graph of powder particle distribution was plotted, which is shown in Figure 1b, where the average particle size is 28 μm and the standard deviation is 8 μm.
For the deposition of 86WC-10Co-4Cr powders, the GTV HVOF-GLC high-velocity oxyfuel spraying system (Sakarya, Turkey) was used. The GTV HVOF-GLC system operated based on a process that utilized gas combustion to generate thermal energy. This energy was used to melt and accelerate the powder particles. A distinctive feature of this system was its ability to accelerate powder particles to supersonic speeds, reaching values of up to 700 m/s. The spraying gun in the system was attached to a KUKA ZH 16 robot, which provided horizontal–vertical movement. In all cases, the orientation of the spray gun remained perpendicular to the substrates. Propane, oxygen and nitrogen were used as fuel, auxiliary and carrier gases, respectively. At high pressure, the gases were mixed in the chamber, after which the powder was fed into the burner with the help of the carrier gas (nitrogen) from the powder feeder. At the burner outlet, the powders entered the flame, where they melted to a plastic state and were then directed onto the pre-prepared surface (substrate), forming a coating.
In this work, three coatings obtained at different oxygen flow rates were investigated while the other spraying parameters were kept constant. The collaborative work on HVOF coatings was carried out at the Thermal Spray Technologies Research and Application Laboratory, Sakarya University, Sakarya, Turkey. The spraying parameters are summarized in Table 1.
A Vickers hardness tester (Metolab 502, Saint Petersburg, Russia) was used to measure the hardness at the cross-sections of 86WC-10Co-4Cr metal–ceramic coatings. The applied load and dwell time were 0.1 kg and 10 s, respectively. The average hardness values of the coatings were determined from 10 measurements. The surface and cross-sectional microstructure of the sprayed coating was examined using a scanning microscope (SEM, Tescan Vega 4, Brno, Czech Republic). Porosity measurements were determined using optical microscopy (Olympus Corporation, OLYMPUS BX53M, Tokyo, Japan) equipped with an image analyzer on polished cross-sections of the coating at 10× magnification. The phase composition of the coatings was determined by X-ray diffraction (XRD, X’PertPRO (Philips Corporation, Amsterdam, The Netherlands) with Cu-Kα (λ = 1.54 Å) radiation operated at a voltage and current of 40 kV and 30 mA, respectively. Measurements were performed over a range of diffraction angles 2θ from 10° to 100°. For the experiments, the step width and exposure time were set to 0.05° and 1 s, respectively, for each step. The surface roughness of the coatings (Ra) was measured with a SURTRONIC S-100 SERIES Taylor-Hobson roughness tester (London, UK). Tribological tests on the sliding friction were carried out on a Tribometer TRB3 (Anton-Paar, Buchs, Switzerland) with a ball on a disk. Test conditions: normal load N = 6 N; sliding velocity υ = 0.3 m/s; 6 mm ball from 100Cr6; friction length L = 300 m; working medium = transmission oil. To evaluate the adhesion strength of the coating, tear-off tests were performed according to ASTM C633-01 “Standard Test Method for Adhesion or Cohesion Strength of Thermal Spraying Coatings” [42]. According to this standard, if fracture occurs at the boundary of the topcoat and the bonding layer or at the boundary of the bonding layer and the substrate, this value is called adhesion. If fracture occurs within the topcoat or binder layer, this indicates the cohesive strength of the coating [43,44,45]. The tests were carried out using a Zwick/Roell Z050 tear-off machine (Ulm, Germany). The tear-off force was applied from a 25.4 mm diameter progressively compressible pin to the coating surface. The pin was bonded to the pavement using 3M Scotch-Weld Epoxy Structural Adhesive 2214 (St. Paul, MN, USA), which has a strength of 60 MPa. Prior to testing, the adhesive was softened in a muffle furnace at 180 °C and cured for two hours in air. The shear rate of the crosshead was set to 0.013 mm/s in accordance with ASTM C633-01 [42]. During the test, the loading force [MPa] and strain [%] of the samples were measured using extensometers.

3. Results and Discussion

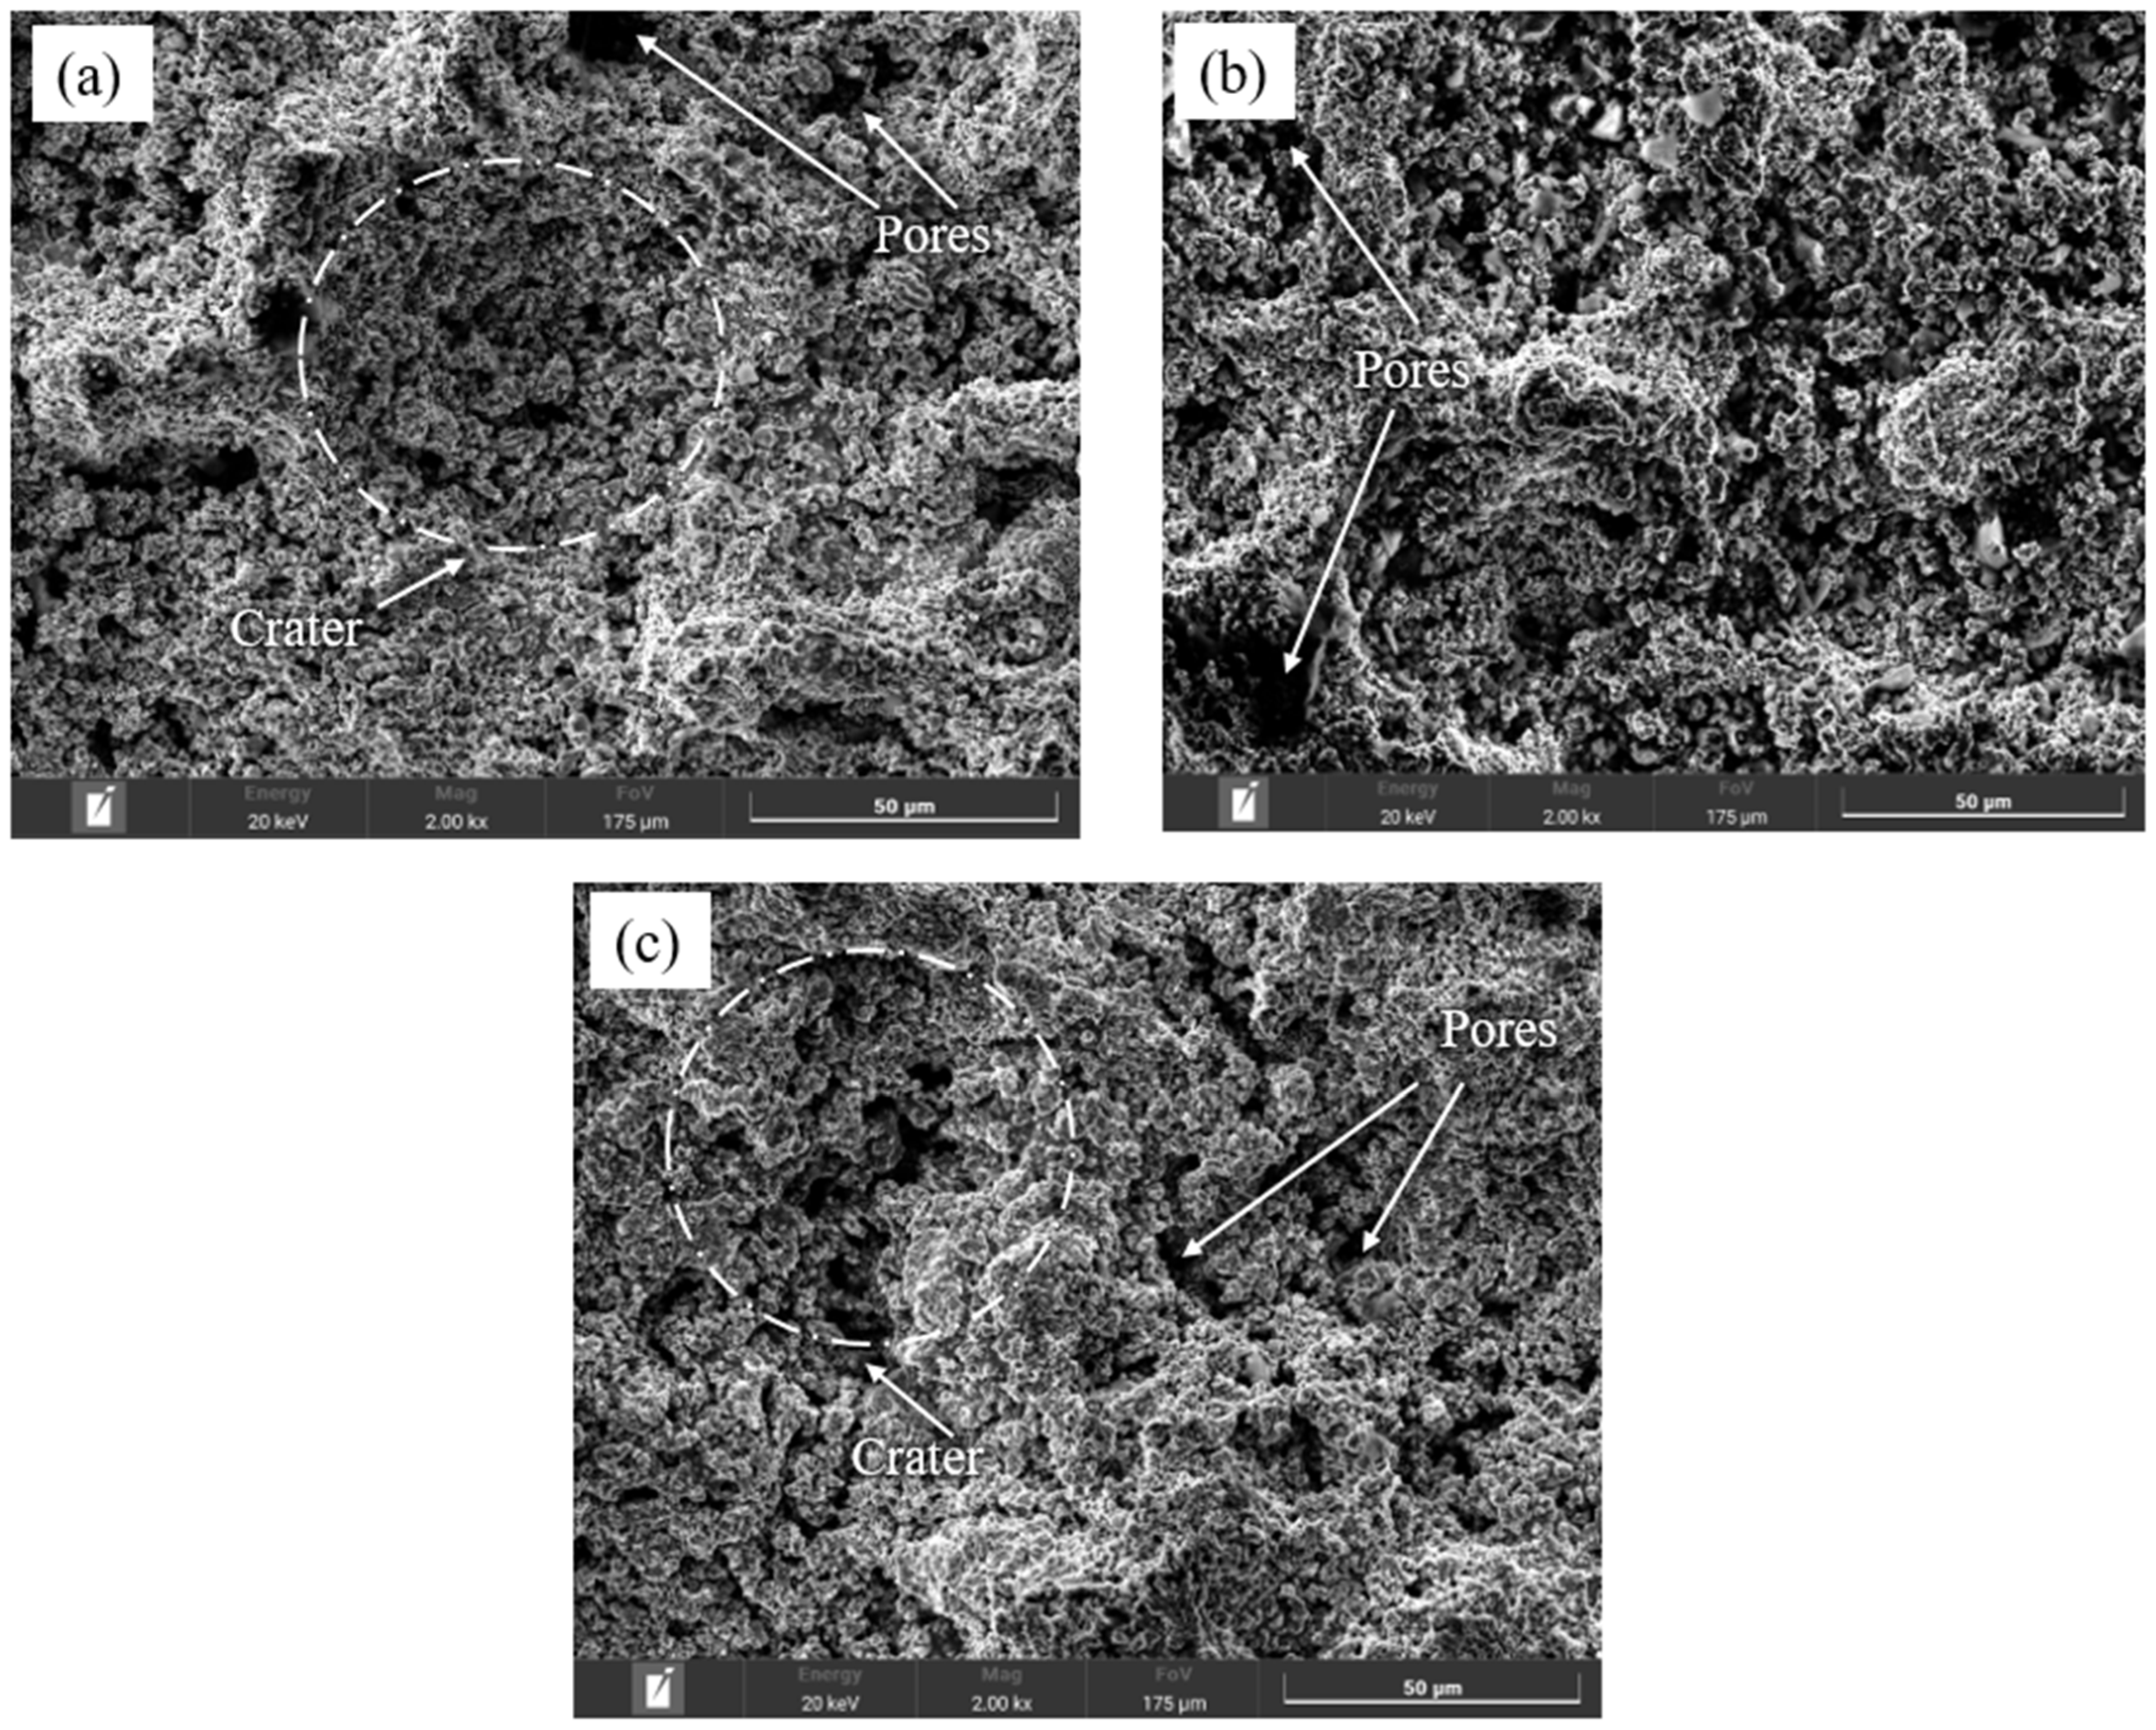
SEM images of the surface morphology of the 86WC-10Co-4Cr coatings obtained by the HVOF method are shown in Figure 2. The surface of all coatings is characterized by pronounced roughness, and deep craters and pores can be observed, but there are no cracks.
The formation of deep craters is probably due to non-uniform cooling of the coating, which resulted in the formation of thermal stresses. These stresses, in turn, caused the appearance of craters on the coating surface. When analyzing the SEM images (Figure 2), it can be clearly seen from Figure 3a that the surface of all coatings is uneven, and the surface roughness (Ra) values for coatings A1, A2 and A3 were 4.61 μm, 4.76 μm and 7.47 μm, respectively, according to the analysis. Based on the data in Table 1, Figure 3b shows that with increasing oxygen consumption, the surface of the coatings acquires a rougher morphology (Figure 2c), which leads to an increase in the average roughness.
Possibly, high values of Ra could also indicate high values of temperature and particle velocity during the spraying process, which most likely led to an increase in the surface roughness of the coating. This is due to the increased oxygen flow rate, which increases the flame temperature. Under such conditions, excessive melting of the powder particles is possible, which may result in the formation of large droplets on the substrate surface. These melted particles can form irregularities and increase the roughness of the coating, which is also supported by the results of other researchers [46,47]. Figure 3b shows graphical representations of the total height of the roughness profile Rt of the coatings and the arithmetic mean deviation Ra of the surface profile from the center line. According to the roughness calculation methodology, Rt is defined as the difference in height between the highest point (peak) and the lowest point (trough) on the measured surface area. For sample A3, the Rt value is twice as high as the other A1 and A2 coatings. This indicates the presence of significant irregularities or defects on the surface of coating A3 and also provides information on the maximum surface deviations from the average. The Rt values for the A1, A2 and A3 coatings were 33 µm, 34 µm and 55 µm, respectively.
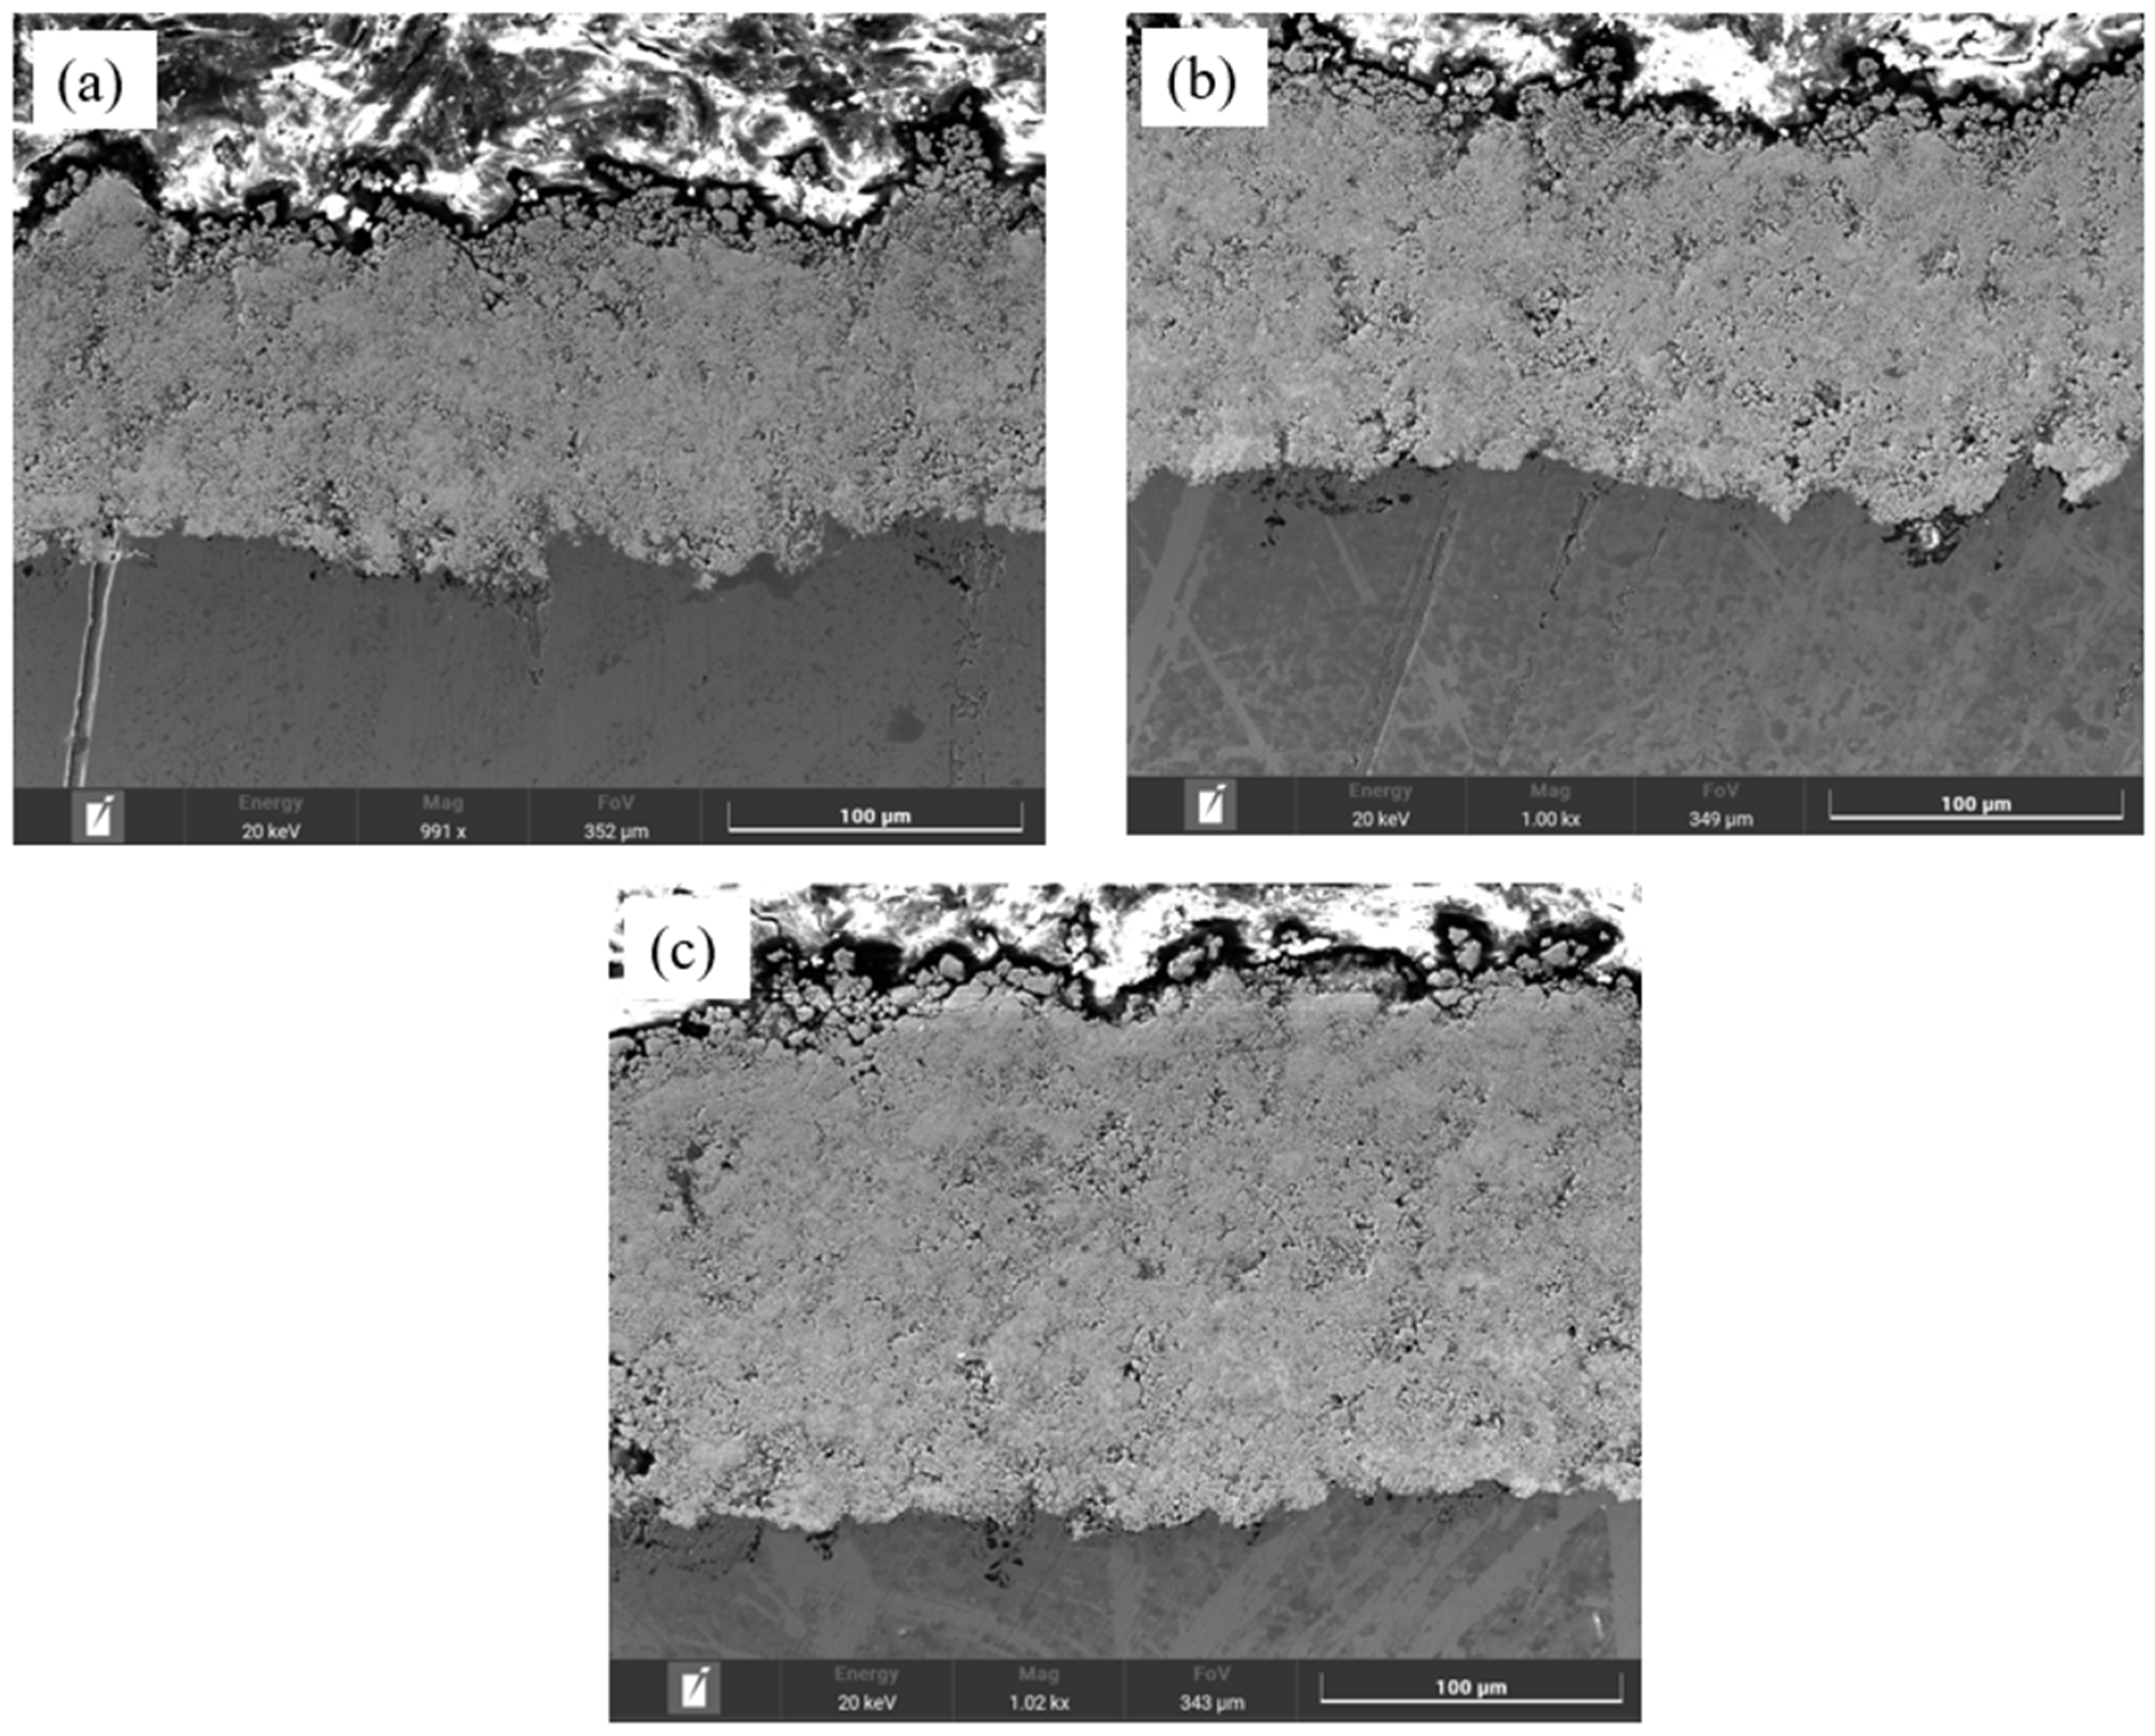
Figure 4 shows the cross-sectional microstructures of the A1, A2 and A3 coatings obtained at different oxygen flow rates. It is easy to see that all three types of coatings adhere well to the substrate, without obvious delaminations and cracks, have a dense structure and have low porosity. With the increase in oxygen flow, a nonlinear relationship in porosity was observed in the coatings: coating A3 has a porosity of 1% at an oxygen flow rate of 190 L/min, while the porosity values of coatings A2 and A1 are 1.5% and 1.3% at oxygen flow rates of 170 L/min and 150 L/min, respectively. The occurrence of pores is also suggested by binder shrinkage, formation of gas bubbles due to decarburization and oxidation, and the presence of unmelted particles [48]. However, no significant difference in porosity was observed in the cross-sectional morphology of the coatings. The increase in oxygen flow rate also affected the thickness of the coatings, which is possibly due to the increase in temperature and particle velocity, resulting in a thicker coating. The thickness of the coatings increased with an increasing oxygen flow rate at 150 L/min, 170 L/min and 190 L/min, with results of 121 μm, 130 μm and 177 μm for samples A1, A2 and A3, respectively.
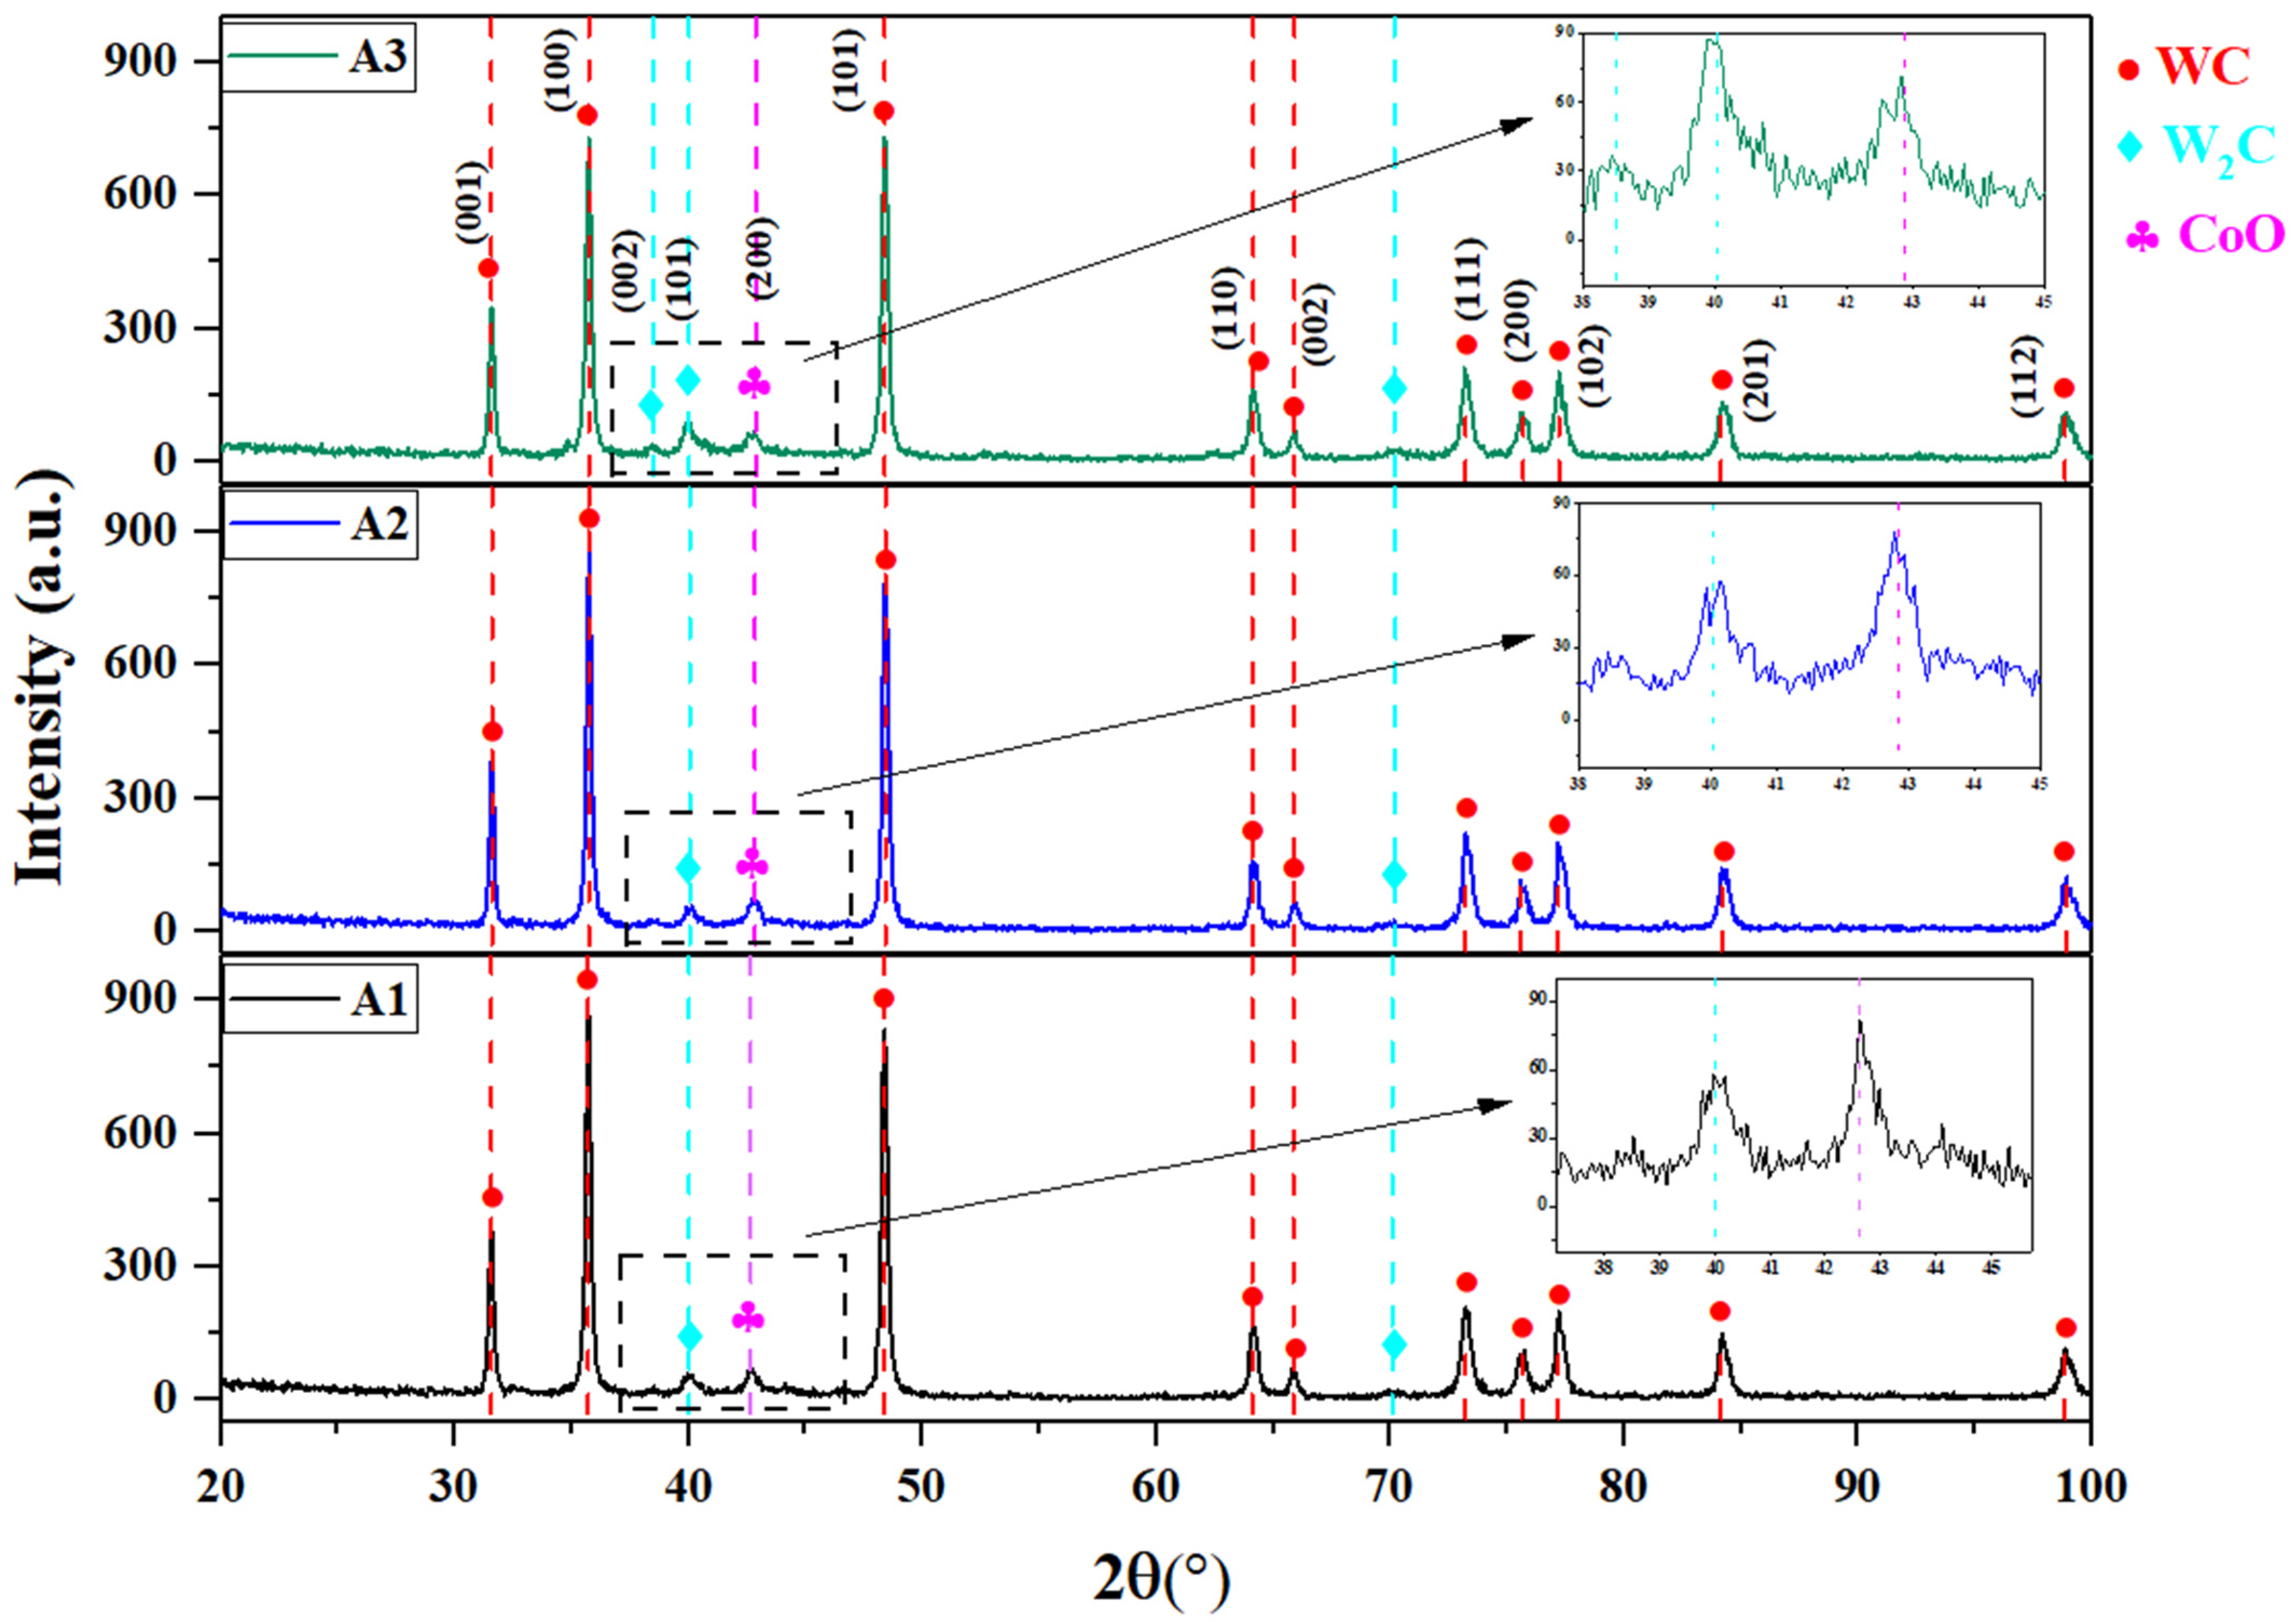
Figure 5 shows the X-ray diffraction patterns of the coatings obtained at different oxygen flow rates. In addition to the main phase of higher tungsten carbide (WC), lower tungsten carbide (W2C) and cobalt oxide (CoO) phases are also present in the coatings, regardless of the oxygen flow rate. The W2C and CoO phases are formed as a result of thermal decomposition of the powder during spraying, which is in agreement with [49]. The formation of the CoO oxide phase is explained by the use of an oxidizing environment of gas-flame products of an oxygen–propane mixture during high-speed gas-flame spraying, which leads to a more intense interaction of WC with oxygen. This interaction causes a partial loss of carbon, meaning the excess carbon formed by WC decomposition diffuses into the metal matrix, promoting the formation of W2C and CoO phases. The X-ray diffraction patterns (Figure 5) show that varying the oxygen flow rate leads to changes in the intensities of the diffraction peaks of the phases. For example, the XRD of the A3 coating shows an increase in the intensity of diffraction peaks of the W2C phase at 38.4° and 40° angles as compared to other coatings, which is due to the increase in oxygen flow rate. When the oxygen flow rate is increased from 150 L/min to 170 L/min in the A1 and A2 coatings, no significant changes in the intensity of the peaks at these angles are observed.
Table 2 shows data on the phase composition of the coatings analyzed by the POWDERCELL full profile analysis program (version 2.4). Experimental and calculated diffractograms were compared graphically. According to the phase composition analysis (Table 2), carried out by the XRD method (Figure 5), the following phases were detected in the coatings: WC, W2C and CoO. As can be seen from Table 2, when increasing the oxygen flow rate up to 190 L/min, an increase in the content of the low tungsten carbide phase W2C up to 7% and a decrease in the content of the cobalt oxide phase CoO up to 40% are observed. There was no significant change in the size of the WC phase, which is the main phase; its content was about 50% on all coatings. However, the difference in the size of the CSR can clearly be seen. The larger the crystallite size, the narrower the diffraction lines in the diffractogram or, on the contrary, the smaller the size, the wider they are [50]. In this context, Table 2 shows that the CSR sizes of the WC, W2C and CoO phases on the A3 coating are smaller than those on other coatings (A1 and A2). The smaller CSR size not only contributes to the preservation of phase intensity but also favorably affects the tribological properties of the coating. The lattice parameters provide accurate information about the structure of the phases, while the microstress allows for estimating the internal deformations of the phase crystal lattices. The larger the value of microstress, the more the crystal structures of the phases undergo internal deformations [50]. Consequently, Table 2 shows that on the A1 and A2 coatings, the crystal lattices of the W2C and CoO phases experience significant internal deformations. Based on the X-ray diffraction analysis, it can be concluded that the phase composition of the coatings improves with an increasing oxygen flow rate.
Crystallographic parameters and phase identification were obtained from the ICDD PDF-2 database using the POWDERCELL full-profile analysis program (version 2.4). For the CoO phase, data from the Inorganic Crystal Structure Database (ICSD) were used. More detailed information is presented in a previous research paper [3].
The results of measuring the average microhardness values from the cross-sectional microhardness of the A1, A2 and A3 coatings as a function of the oxygen flow rate showed that the A3 coating exhibited the highest microhardness, at an oxygen flow rate of 190 L/min, while the A1 coating showed the lowest microhardness, at an oxygen flow rate of 150 L/min. These results indicate that a high oxygen flow rate significantly improved the mechanical properties of 86WC-10Co-4Cr coatings, affecting their phase composition and microstructure. This, in turn, was reflected in the microhardness of the A1, A2 and A3 coatings. In this context, the hardness of the coatings correlates with the CoO phase content (Table 2) and pore distribution. Since CoO phases have significantly lower hardness compared to tungsten carbides, their significant amount in the coating structure led to an increase in the soft phase content, which decreased the microhardness of the A1 and A2 coatings. In addition, the increased porosity also contributed to the decreased hardness of these coatings. The pores in the A1 and A2 coatings acted as stress concentrators, making them more susceptible to deformation, which is consistent with the XRD data (Table 2). Thus, the sequential increase in oxygen consumption was accompanied by an increase in the microhardness values of the A1, A2 and A3 coatings, which were 496 ± 11 HV0.1, 554 ± 14 HV0.1 and 600 ± 9 HV0.1, respectively.
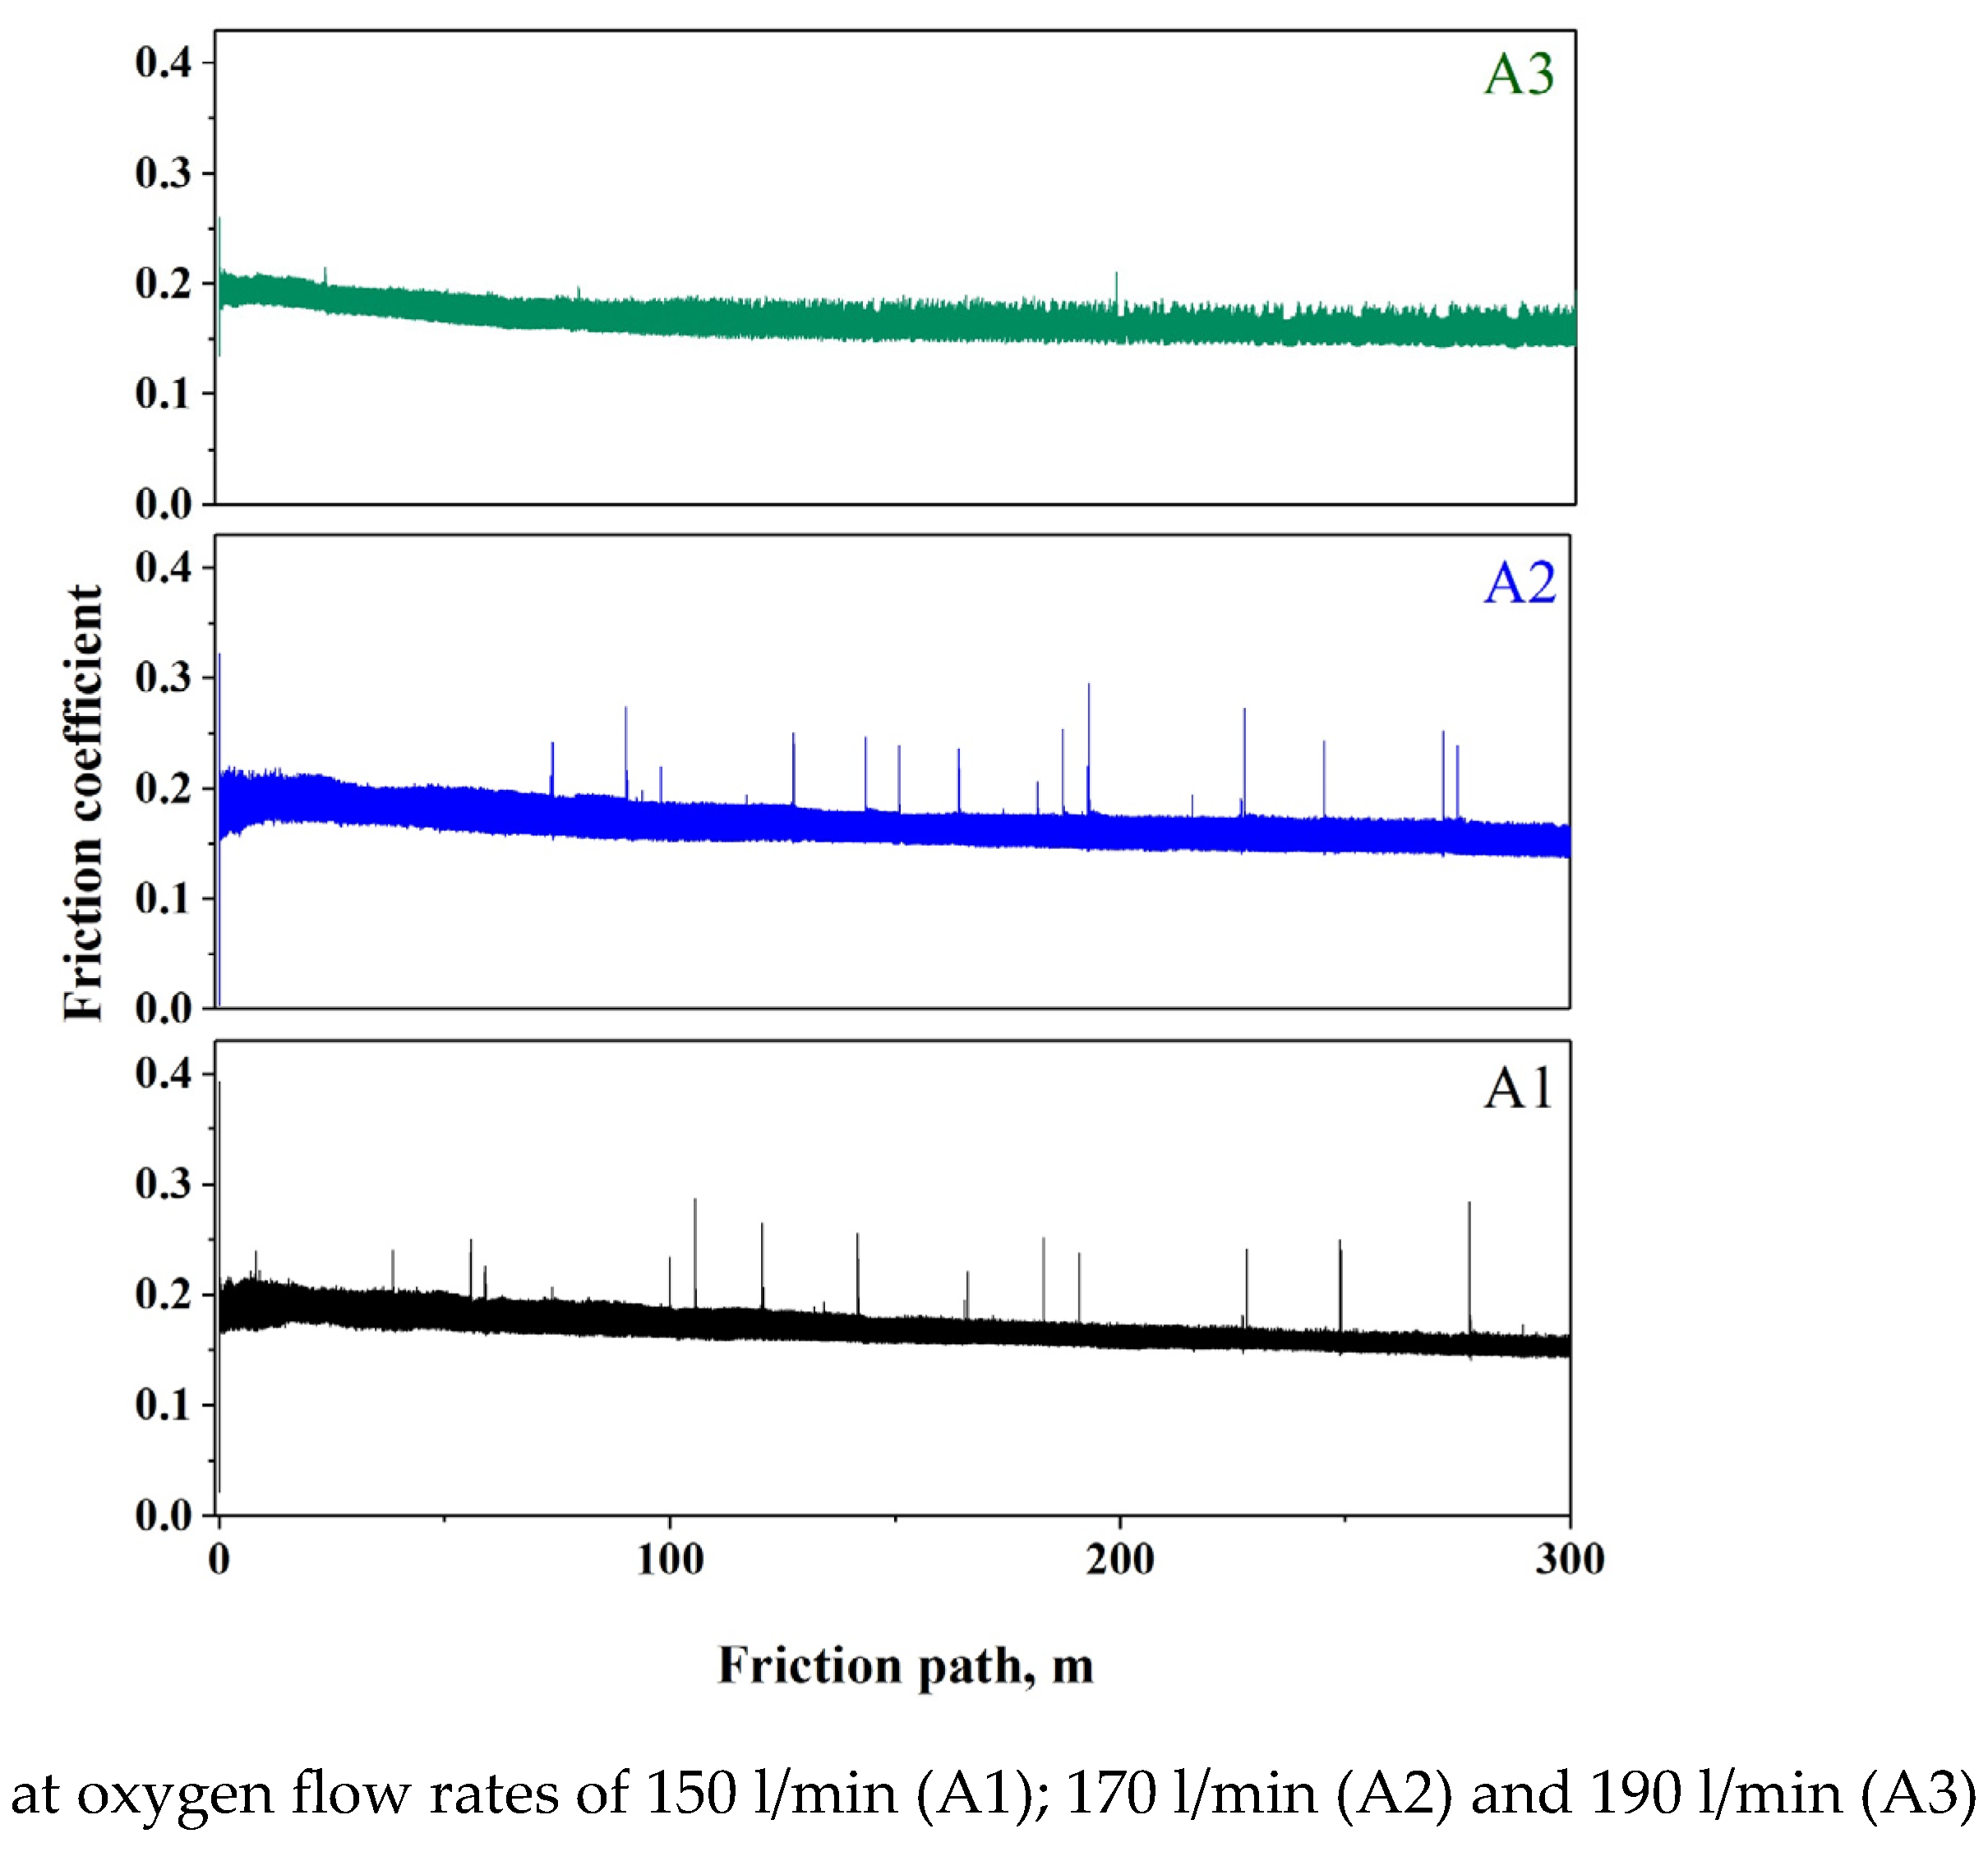
When determining the coefficient of friction of coatings obtained at different oxygen flow rates using the ball-disk method, no significant differences were found. As shown in Figure 6, the coefficient of friction of coatings subjected to the sliding friction test at a load of 6 N in transmission oil for 3 h remained almost the same for all samples, regardless of the oxygen flow rate. The friction coefficient values for samples A1, A2 and A3 were µ = 0.167, µ = 0.168 and µ = 0.169, respectively.
For clarity, Figure 7 shows microphotographs of the surfaces of 86WC-10Co-4Cr coatings after the sliding friction test. From Figure 7, it can be seen that the gear oil reduces the friction coefficients of the coatings, since the friction marks on the coating surfaces were not clearly detected. Consequently, it was not possible to assess the wear of the coating itself, as it was transparent, and it was difficult to measure the wear area of the disk trace with a profilometer.
To determine the adhesion strength of 86WC-10Co-4Cr coatings obtained by the HVOF method at different oxygen flow rates, 25.4 mm diameter pins were used and adhesive was applied. To dissolve and subsequently harden the adhesive, the pins were incubated in a muffle furnace at 180 °C for 2 h and then cooled in air. As shown in Figure 8, each sample was labeled with the oxygen flow rate. The finished samples, after curing, were placed in the center of the tear-off center of the testing machine for further testing.
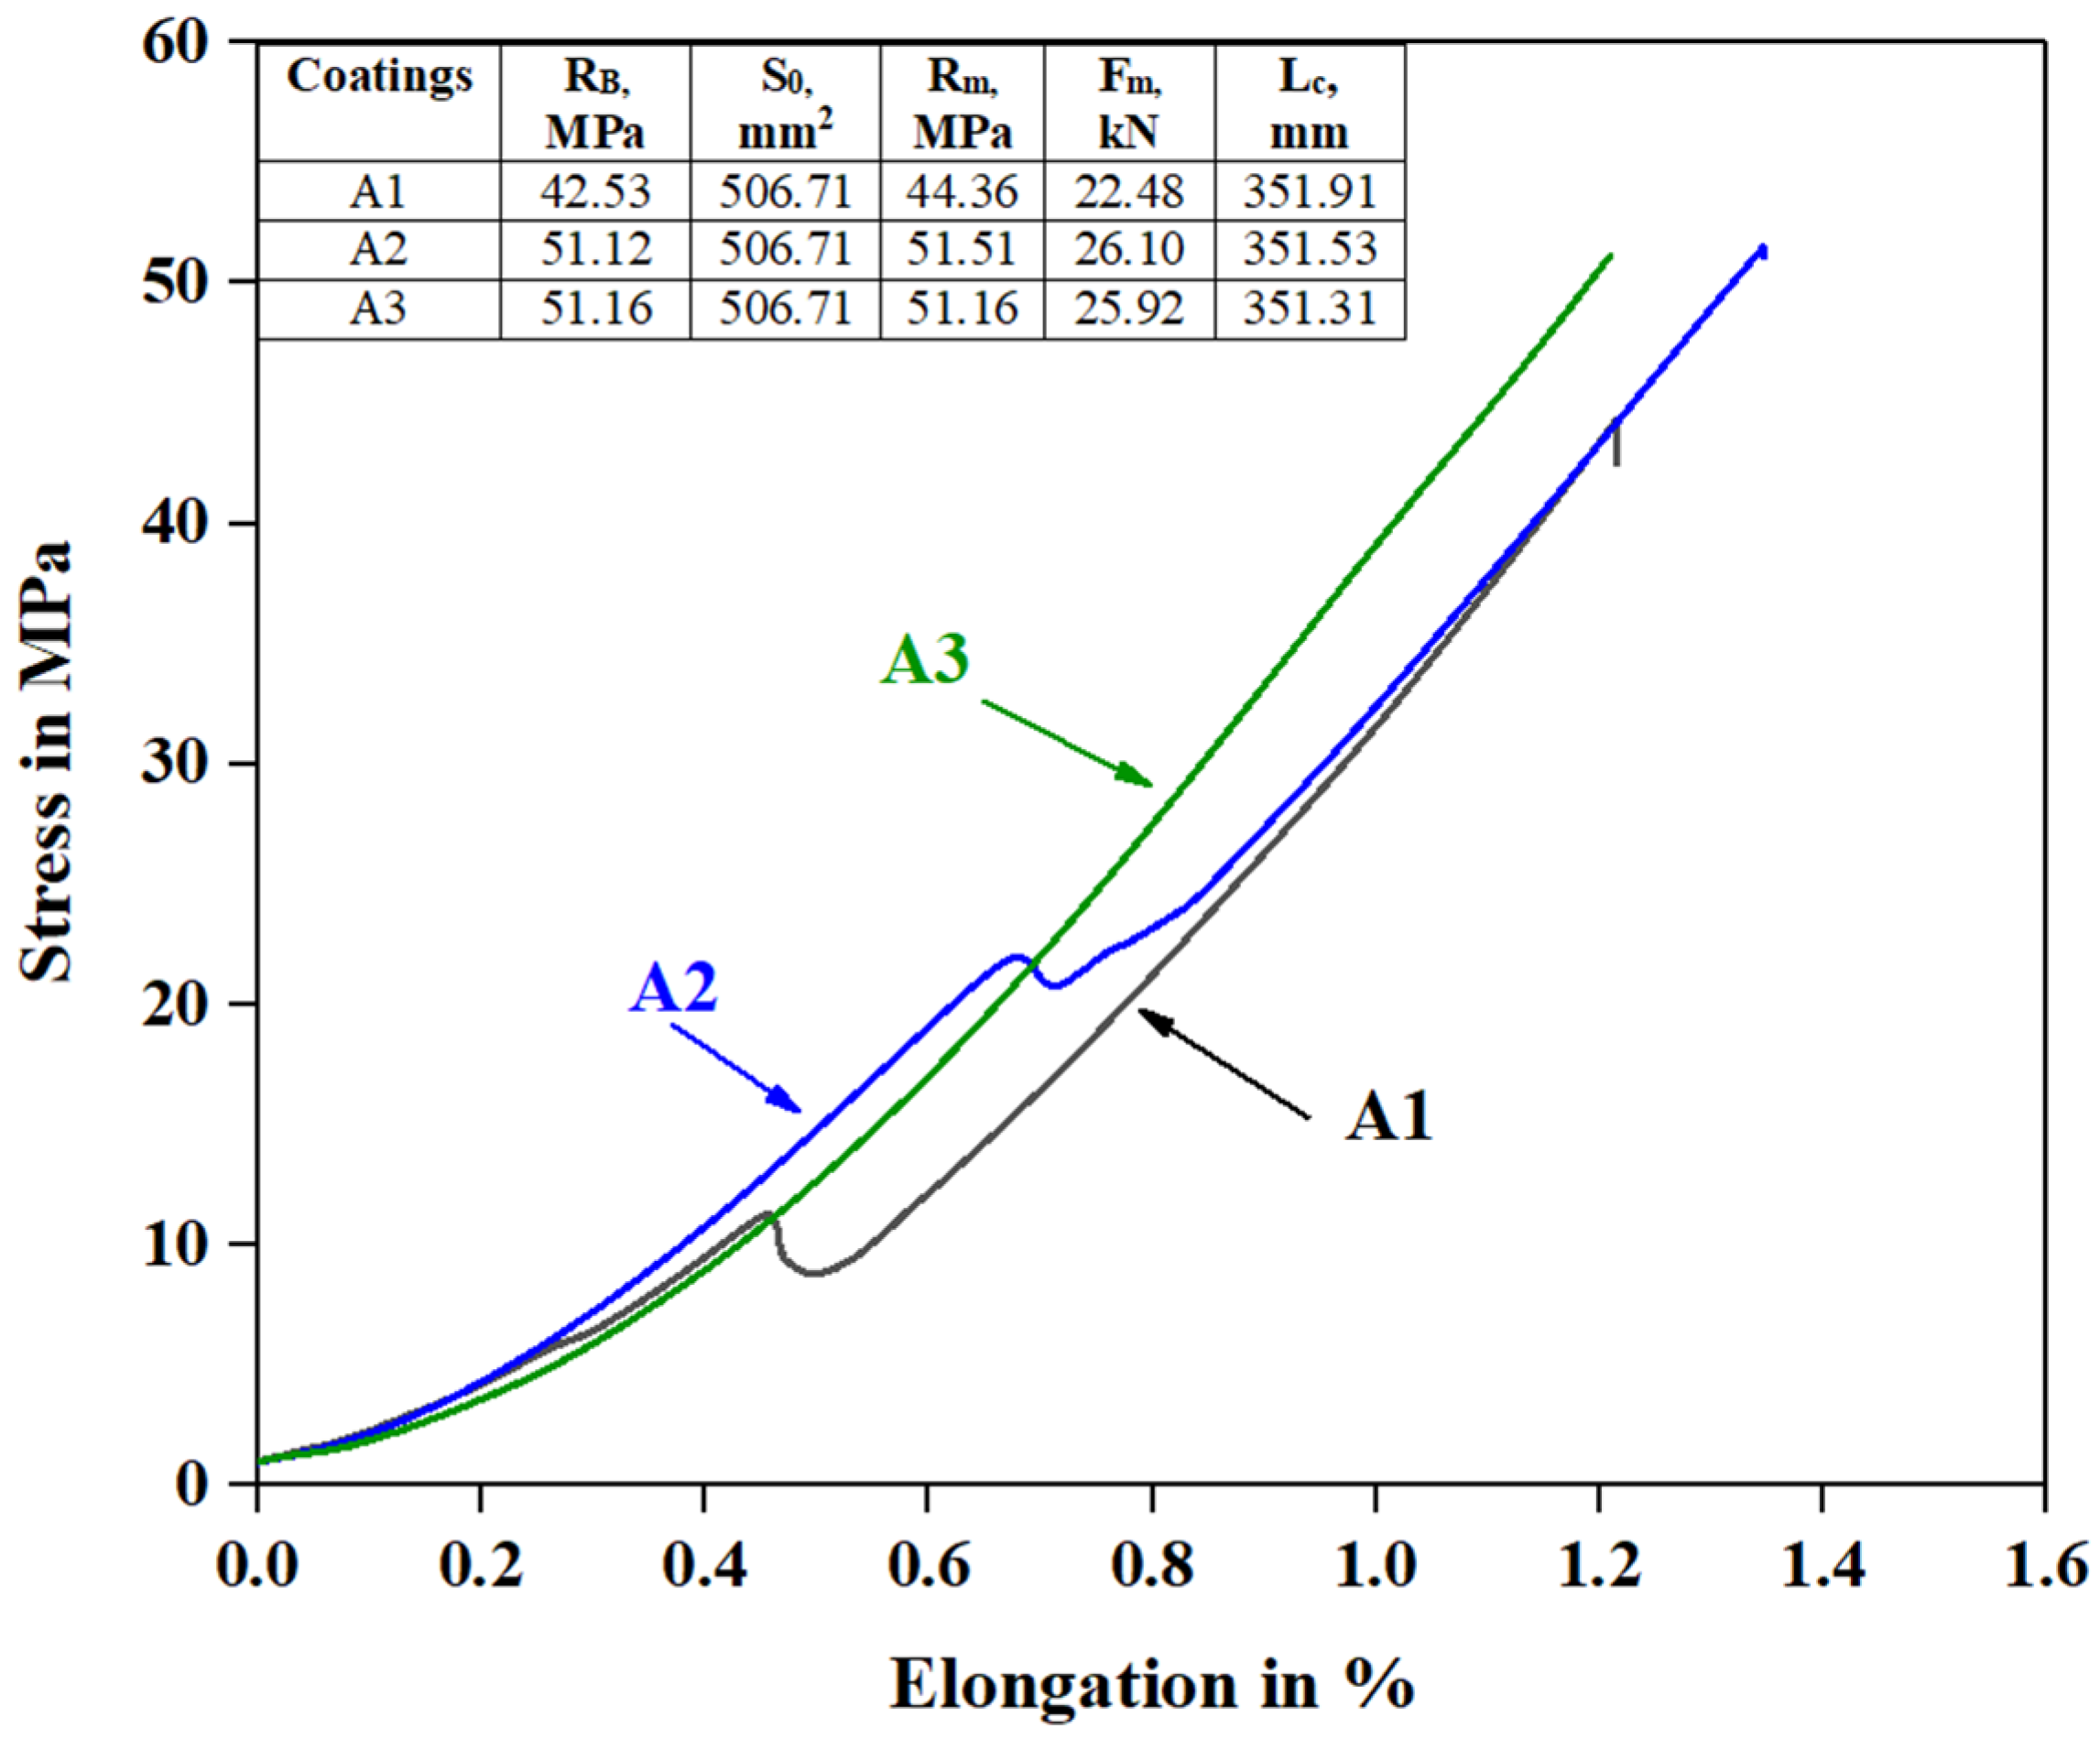
Based on our adhesion testing of the coatings, a graph of the dependence of stress on relative elongation was plotted, as shown in Figure 9. The table also shown in Figure 9 contains the test data of three coating samples (A1, A2 and A3), namely their mechanical properties. The measured parameters include tensile strength (RB); initial cross-sectional area of the sample (S0); maximum elongation (Rm); maximum load (Fm); and length at break (Lp).
To describe the curves in Figure 9, several parameters presented both in the graph and in the table should be considered. The graph clearly shows that as the oxygen flow rate increases, the strength performance parameters of the coatings improve. The tests show that the A1 coating has a curve (black) showing lower stress values at all elongation stages compared to the other coatings A2 and A3. The elongation varies from 0 to 1.2%. At the beginning, the A1 curve rises smoothly, but then at an elongation around 0.5%, there is a sharp jump in stress, which may be due to localized defects in the coating material, as shown in Figure 2a. These defects can lead to a non-uniform stress distribution, causing abrupt changes in the curve. The curve then continues to rise smoothly to 42.53 MPa at an elongation of 1.2%, indicating a lower strength and adhesion strength of the coating. Furthermore, for coating A2, the curve (blue) shows an intermediate behavior between coatings A1 and A3. It has a sharp bend at a stress level of about 25 MPa and an elongation of about 0.8%, and then it continues to increase more smoothly to 51.12 MPa at an elongation of about 1.4%. The stress jump at an elongation of about 0.8% can be attributed to the transition of the coating from an elastic to a plastic state. Consequently, the curve (green) of coating A3 shows the highest stress values compared to coatings A1 and A2. It starts similarly to the other coatings, but then it grows more steadily and without sudden jumps, reaching 51.16 MPa at an elongation of 1.4%. This indicates a better stress distribution and no significant defects in the coating. In general, the A2 and A3 coatings have similar tensile strength values, which are higher than that of the A1 coating. However, the curved line for coating A3 shows more stable and higher stress at the same elongation, indicating a better quality of coating A3. Thus, based on the data from the table and graph (Figure 9), coating A3 shows the best adhesion strength among the three coatings.
For a better illustration, Figure 10 shows photographs of the three coatings after the adhesion strength test.
Figure 10 shows the condition of the coatings after the peel test. A comparison of the adhesion strengths of samples A1, A2 and A3 demonstrates that as the coating thickness decreases, the adhesion strength of the top layer/bonding layer decreases, indicating a relationship between coating thickness and adhesion strength. Figure 10a shows that the coating has partially separated from the substrate, leaving traces on both surfaces. This indicates failure at the coating–substrate interface, suggesting a weaker adhesion strength. This is supported by the relatively low force (22.48 kN) required to break the bond. In the remaining coatings (Figure 10b,c), failure also occurred at the coating–substrate interface. However, as can be seen in Figure 10b,c, the coatings were not completely separated from the substrate, as evidenced by the highest force required for bond failure among the samples presented. These data are also consistent with the SEM images of the cross-sectional morphology of the coatings, presented in Figure 4b,c. These images (Figure 4b,c) show that there are no gaps or cracks at the coating–substrate interface, indicating good adhesion between the coating and the substrate. Thus, samples A2 and A3 show a high adhesion strength of the coating to the substrate, while sample A1 shows weaker adhesion.

4. Conclusions

This study found that the microstructure of all coatings remains uniform, indicating the stability of the deposition process when varying the oxygen flow rate. The reduction in porosity at an oxygen flow rate of 190 L/min suggests an improved particle density and adhesion to the substrate. At this flow rate, the relative porosity did not exceed 1.5%, which confirms the high bonding strength of coatings A2 and A3. An increase in the oxygen flow rate also leads to an increase in the thicknesses of the coatings and their microhardness, which reached maximum values at 190 L/min. X-ray diffraction analysis revealed the presence of key phases (WC, W2C and CoO), highlighting the impact of the oxygen flow rate on the structural characteristics of the coatings. The variation in oxygen flow rate did not significantly affect the coefficient of friction. These results are important for developing optimal parameters for coating deposition using the HVOF method, allowing for high strength and durability, which significantly enhance the performance characteristics of protected surfaces in industrial applications.
In upcoming research, mathematical modeling of all technological processes occurring in the high-velocity oxyfuel (HVOF) spray method will be conducted. The modeling will cover parameters such as the oxygen flow rate, particle fractions, spray distance, temperature and velocity of the combustible gases, particle flight speed, and pressure in the combustion chamber. These studies aim to provide a deeper understanding of all details related to the obtained results, as well as to previous research in this field.

Author Contributions

B.R. and N.M. formal analysis, supervision, writing—review and editing; A.S. and D.K. investigation, methodology; M.D. resources, data curation. All authors have read and agreed to the published version of the manuscript.

Funding

This study was funded by the Committee of Science of the Ministry of Science and Higher Education of the Republic of Kazakhstan (grant No. AP14870977).

Institutional Review Board Statement

Not applicable.

Informed Consent Statement

Not applicable.

Data Availability Statement

Data are contained within this article.

Conflicts of Interest

Nazerke Muktanova, Dauir Kakimzhanov and Merkhat Dautbekov are employed by PlasmaScience LLP. The remaining authors declare that the research was conducted in the absence of any commercial or financial relationships that could be construed as a potential conflict of interest.

References

  1. Efimova, A.; Panchenko, E.; Lopa, I. Longitudinal stability of retractable spindles of pipeline gates taking into account the supporting influence of the gland. Izv. Tula State Univ. Tech. Sci. 2012, 2, 312–318. (In Russian) [Google Scholar]
  2. Rakhadilov, B.; Muktanova, N.; Kakimzhanov, D.; Satbayeva, Z.; Kassenova, L.; Magazov, N. Investigation of the Influence of Powder Fraction on Tribological and Corrosion Characteristics of 86WC-10Co-4Cr Coating Obtained by HVOF Method. Coatings 2024, 14, 651. [Google Scholar] [CrossRef]
  3. Rakhadilov, B.; Muktanova, N.; Kakimzhanov, D.; Adilkanova, M.; Kurbanbekov, S.; Abdulina, S. Influence of Varying the Spraying Distance on the Structural-Phase State and Mechanotribological Properties of 86WC-10Co-4Cr-Based Coatings Obtained by the HVOF Method. Coatings 2024, 14, 264. [Google Scholar] [CrossRef]
  4. Kengesbekov, A.; Rakhadilov, B.; Sagdoldina, Z.; Buitkenov, D.; Dosymov, Y.; Kylyshkanov, M. Improving the Efficiency of Air Plasma Spraying of Titanium Nitride Powder. Coatings 2022, 12, 1644. [Google Scholar] [CrossRef]
  5. Druzhnova, Y. Development of methods of gas-thermal spraying of hardening coatings based on tungsten and chromium carbides (review). Proc. VIAM 2022, 10, 100–115. (In Russian) [Google Scholar]
  6. Rakhadilov, B.; Buitkenov, D.; Sagdoldina, Z.; Idrisheva, Z.; Zhamanbayeva, M.; Kakimzhanov, D. Preparation and Characterization of NiCr/NiCr-Al2O3/Al2O3 Multilayer Gradient Coatings by Gas Detonation Spraying. Coatings 2021, 11, 1524. [Google Scholar] [CrossRef]
  7. Rakhadilov, B.; Kakimzhanov, D.; Dautbekov, M.; Sagdoldina, Z.; Adylkanova, M.; Abylkalykova, R. Influence of Spraying Parameters on the Structure and Tribological Properties of Cr3C2-NiCr Detonation Coatings. Adv. Tribol. 2023, 2023, e6684656. [Google Scholar] [CrossRef]
  8. Abd Malek, M.; Saad, N.; Abas, S.; Shah, N. Thermal arc spray overview. IOP Conf. Ser. Mater. Sci. Eng. 2013, 46, 012028. [Google Scholar] [CrossRef]
  9. Skakov, M.; Ocheredko, I.; Tuyakbayev, B.; Bayandinova, M.; Nurizinova, M. Development and Studying of the Technology for Thermal Spraying of Coatings Made from Ultra-High-Molecular-Weight Polyethylene. Coatings 2023, 13, 698. [Google Scholar] [CrossRef]
  10. Qiao, L.; Wu, Y.; Hong, S.; Cheng, J.; Wei, Z. Influence of the High-Velocity Oxygen-Fuel Spray Parameters on the Porosity and Corrosion Resistance of Iron-Based Amorphous Coatings. Surf. Coat. Technol. 2019, 366, 296–302. [Google Scholar] [CrossRef]
  11. Picas, J.A.; Punset, M.; Baile, M.T.; Martín, E.; Forn, A. Effect of Oxygen/Fuel Ratio on the in-Flight Particle Parameters and Properties of HVOF WC-CoCr Coatings. Surf. Coat. Technol. 2011, 205, S364–S368. [Google Scholar] [CrossRef]
  12. Kumar, M.S.S.; Arulshri, K.P.; Thirumoorthy, C. HVOF Spray Parameter Optimization to Obtain Maximum Hardness and Minimum Porosity in WC-Co-Cr Coatings on AISI 304 Stainless Steel. Int. J. Appl. Eng. Res. 2015, 10, 38753–38765. [Google Scholar]
  13. Liu, J.; Chen, T.; Yuan, C.; Bai, X. Performance Analysis of Cavitation Erosion Resistance and Corrosion Behavior of HVOF-Sprayed WC-10Co-4Cr, WC-12Co, and Cr3C2-NiCr Coatings. J. Therm. Spray Technol. 2020, 29, 798–810. [Google Scholar] [CrossRef]
  14. Erne, M.; Kolar, D. Thermal Spraying of Oxide Ceramic and Ceramic Metallic Coatings. In Ceramic Coatings—Applications in Engineering; Shi, F., Ed.; InTech: London, UK, 2012; ISBN 978-953-51-0083-6. [Google Scholar]
  15. Dejun, K.; Tianyuan, S. Wear Behaviors of HVOF Sprayed WC-12Co Coatings by Laser Remelting under Lubricated Condition. Opt. Laser Technol. 2017, 89, 86–91. [Google Scholar] [CrossRef]
  16. Yifu, J.; Weicheng, K.; Tianyuan, S.; Ruihong, Z.; Dejun, K. Effect of Load on Friction-Wear Behavior of HVOF-Sprayed WC-12Co Coatings. J. Mater. Eng. Perform. 2017, 26, 3465–3473. [Google Scholar] [CrossRef]
  17. Ji, G.-C.; Li, C.-J.; Wang, Y.-Y.; Li, W.-Y. Microstructural Characterization and Abrasive Wear Performance of HVOF Sprayed Cr3C2–NiCr Coating. Surf. Coat. Technol. 2006, 200, 6749–6757. [Google Scholar] [CrossRef]
  18. Guilemany, J.M.; Espallargas, N.; Suegama, P.H.; Benedetti, A.V. Comparative Study of Cr3C2–NiCr Coatings Obtained by HVOF and Hard Chromium Coatings. Corros. Sci. 2006, 48, 2998–3013. [Google Scholar] [CrossRef]
  19. Zhou, W.; Zhou, K.; Li, Y.; Deng, C.; Zeng, K. High Temperature Wear Performance of HVOF-Sprayed Cr3C2-WC-NiCoCrMo and Cr3C2-NiCr Hardmetal Coatings. Appl. Surf. Sci. 2017, 416, 33–44. [Google Scholar] [CrossRef]
  20. Murugan, K.; Ragupathy, A.; Balasubramanian, V.; Sridhar, K. Optimizing HVOF Spray Process Parameters to Attain Minimum Porosity and Maximum Hardness in WC–10Co–4Cr Coatings. Surf. Coat. Technol. 2014, 247, 90–102. [Google Scholar] [CrossRef]
  21. Kumar, R.K.; Kamaraj, M.; Seetharamu, S.; Pramod, T.; Sampathkumaran, P. Effect of Spray Particle Velocity on Cavitation Erosion Resistance Characteristics of HVOF and HVAF Processed 86WC-10Co4Cr Hydro Turbine Coatings. J. Therm. Spray Technol. 2016, 25, 1217–1230. [Google Scholar] [CrossRef]
  22. Caltaru, M.; Badicioiu, M.; Ripeanu, R.G. Establishing the Tribological Behaviour of HVOF Hardfacing Applied at Petroleum Gate Valves. J. Balk. Tribol. Assoc. 2013, 19, 448–460. [Google Scholar]
  23. Kumar, H.; Chittosiya, C.; Shukla, V.N. HVOF Sprayed WC Based Cermet Coating for Mitigation of Cavitation, Erosion & Abrasion in Hydro Turbine Blade. Mater. Today Proc. 2018, 5, 6413–6420. [Google Scholar] [CrossRef]
  24. Thakur, L.; Arora, N. Sliding and Abrasive Wear Behavior of WC-CoCr Coatings with Different Carbide Sizes. J. Mater. Eng. Perform. 2013, 22, 574–583. [Google Scholar] [CrossRef]
  25. Wheeler, D.W.; Wood, R.J.K. Erosion of Hard Surface Coatings for Use in Offshore Gate Valves. Wear 2005, 258, 526–536. [Google Scholar] [CrossRef]
  26. Tarragó, J.M.; Ferrari, C.; Reig, B.; Coureaux, D.; Schneider, L.; Llanes, L. Mechanics and Mechanisms of Fatigue in a WC–Ni Hardmetal and a Comparative Study with Respect to WC–Co Hardmetals. Int. J. Fatigue 2015, 70, 252–257. [Google Scholar] [CrossRef]
  27. Cho, J.E.; Hwang, S.Y.; Kim, K.Y. Corrosion Behavior of Thermal Sprayed WC Cermet Coatings Having Various Metallic Binders in Strong Acidic Environment. Surf. Coat. Technol. 2006, 200, 2653–2662. [Google Scholar] [CrossRef]
  28. Fang, Z.Z.; Wang, X.; Ryu, T.; Hwang, K.S.; Sohn, H.Y. Synthesis, Sintering, and Mechanical Properties of Nanocrystalline Cemented Tungsten Carbide—A Review. Int. J. Refract. Met. Hard Mater. 2009, 27, 288–299. [Google Scholar] [CrossRef]
  29. Wood, R.J.K.; Herd, S.; Thakare, M.R. A Critical Review of the Tribocorrosion of Cemented and Thermal Sprayed Tungsten Carbide. Tribol. Int. 2018, 119, 491–509. [Google Scholar] [CrossRef]
  30. Asl, S.K.; Beyragh, M.R.S.; Noori, N.F. Study of Corrosion Behavior of Conventional and Nanostructured WC-Ni High Velocity Oxy Fuel (HVOF) Sprayed Coatings. Mater. Sci. Forum 2011, 673, 167–172. [Google Scholar] [CrossRef]
  31. Karimi, A.; Verdon, C.; Barbezat, G. Microstructure and Hydroabrasive Wear Behaviour of High Velocity Oxy-Fuel Thermally Sprayed WC-Co(Cr) Coatings. Surf. Coat. Technol. 1993, 57, 81–89. [Google Scholar] [CrossRef]
  32. Govande, A.R.; Chandak, A.; Sunil, B.R.; Dumpala, R. Carbide-Based Thermal Spray Coatings: A Review on Performance Characteristics and Post-Treatment. Int. J. Refract. Met. Hard Mater. 2022, 103, 105772. [Google Scholar] [CrossRef]
  33. Balki, M.K.; Sayin, C.; Sarıkaya, M. Optimization of the Operating Parameters Based on Taguchi Method in an SI Engine Used Pure Gasoline, Ethanol and Methanol. Fuel 2016, 180, 630–637. [Google Scholar] [CrossRef]
  34. Vignesh, S.; Shanmugam, K.; Balasubramanian, V.; Sridhar, K. Identifying the Optimal HVOF Spray Parameters to Attain Minimum Porosity and Maximum Hardness in Iron Based Amorphous Metallic Coatings. Def. Technol. 2017, 13, 101–110. [Google Scholar] [CrossRef]
  35. Wang, Y.; Jiang, S.L.; Zheng, Y.G.; Ke, W.; Sun, W.H.; Chang, X.C.; Hou, W.L.; Wang, J.Q. Effect of processing parameters on the microstructures and corrosion behaviour of high-velocity oxy-fuel (HVOF) sprayed Fe-based amorphous metallic coatings. Mater. Corros. 2013, 64, 801–810. [Google Scholar] [CrossRef]
  36. Zhang, H.; Hu, Y.; Hou, G.; An, Y.; Liu, G. The Effect of High-Velocity Oxy-Fuel Spraying Parameters on Microstructure, Corrosion and Wear Resistance of Fe-Based Metallic Glass Coatings. J. Non-Cryst. Solids 2014, 406, 37–44. [Google Scholar] [CrossRef]
  37. Kumari, S.; Satyanarayana, D.V.V.; Srinivas, M. Failure Analysis of Gas Turbine Rotor Blades. Eng. Fail. Anal. 2014, 45, 234–244. [Google Scholar] [CrossRef]
  38. Huang, Y.; Ding, X.; Yuan, C.-Q.; Yu, Z.-K.; Ding, Z.-X. Slurry Erosion Behaviour and Mechanism of HVOF Sprayed Micro-Nano Structured WC-CoCr Coatings in NaCl Medium. Tribol. Int. 2020, 148, 106315. [Google Scholar] [CrossRef]
  39. Li, C.; Gao, X.; Zhang, D.; Gao, H.; Han, X.; Zhang, B. Numerical investigation on the flame characteristics and particle behaviors in a HVOF spray process using kerosene as fuel. J. Therm. Spray Technol. 2021, 30, 725–738. [Google Scholar] [CrossRef]
  40. Zois, D.; Lekatou, A.; Vardavoulias, M.; Vaimakis, T.; Karantzalis, A.E. Partially Amorphous Stainless Steel Coatings: Microstructure, Annealing Behavior and Statistical Optimization of Spray Parameters. Surf. Coat. Technol. 2011, 206, 1469–1483. [Google Scholar] [CrossRef]
  41. Hong, S.; Wu, Y.; Wang, B.; Zheng, Y.; Gao, W.; Li, G. High-Velocity Oxygen-Fuel Spray Parameter Optimization of Nanostructured WC–10Co–4Cr Coatings and Sliding Wear Behavior of the Optimized Coating. Mater. Des. 2014, 55, 286–291. [Google Scholar] [CrossRef]
  42. Li, M.; Christofides, P.D. Modeling and Analysis of HVOF Thermal Spray Process Accounting for Powder Size Distribution. Chem. Eng. Sci. 2003, 58, 849–857. [Google Scholar] [CrossRef]
  43. Ghasemi, R.; Shoja-Razavi, R.; Mozafarinia, R.; Jamali, H. Comparison of Microstructure and Mechanical Properties of Plasma-Sprayed Nanostructured and Conventional Yttria Stabilized Zirconia Thermal Barrier Coatings. Ceram. Int. 2013, 39, 8805–8813. [Google Scholar] [CrossRef]
  44. Schweda, M.; Beck, T.; Offermann, M.; Singheiser, L. Thermographic Analysis and Modelling of the Delamination Crack Growth in a Thermal Barrier Coating on Fecralloy Substrate. Surf. Coat. Technol. 2013, 217, 124–128. [Google Scholar] [CrossRef]
  45. Ghasemi, R.; Vakilifard, H. Plasma-Sprayed Nanostructured YSZ Thermal Barrier Coatings: Thermal Insulation Capability and Adhesion Strength. Ceram. Int. 2017, 43, 8556–8563. [Google Scholar] [CrossRef]
  46. Ly, S.; Rubenchik, A.M.; Khairallah, S.A.; Guss, G.; Matthews, M.J. Metal Vapor Micro-Jet Controls Material Redistribution in Laser Powder Bed Fusion Additive Manufacturing. Sci. Rep. 2017, 7, 4085. [Google Scholar] [CrossRef]
  47. Zhang, P.; Bi, Z.; Yu, H.; Wang, R.; Sun, G.; Zhang, S. Effect of Particle Surface Roughness on the Flowability and Spreadability of Haynes 230 Powder during Laser Powder Bed Fusion Process. J. Mater. Res. Technol. 2023, 26, 4444–4454. [Google Scholar] [CrossRef]
  48. Wesmann, J.; Kuroda, S.; Espallargas, N. The role of oxide tribofilms on friction and wear of different thermally sprayed WC-CoCr. J. Therm. Spray Technol. 2017, 26, 492–502. [Google Scholar] [CrossRef]
  49. Magnani, M.; Suegama, P.; Recco, A.; Guilemany, J.; Fugivara, C.; Benedetti, A. WC-CoCr coatings sprayed by high velocity oxygen-fuel (HVOF) flame on AA7050 aluminum alloy: Electrochemical behavior in 3.5% NaCl solution. Mater. Res. 2007, 10, 377–385. [Google Scholar] [CrossRef]
  50. Kuznetsova, G. Qualitative X-ray Phase Analysis. Course of Lectures. 2005. Available online: https://portal.tpu.ru/SHARED/l/LOGVINENKOOV/subj/Tab/Tab/01_kachestven_rentgenophazn_analys.pdf (accessed on 11 September 2024). (In Russian).
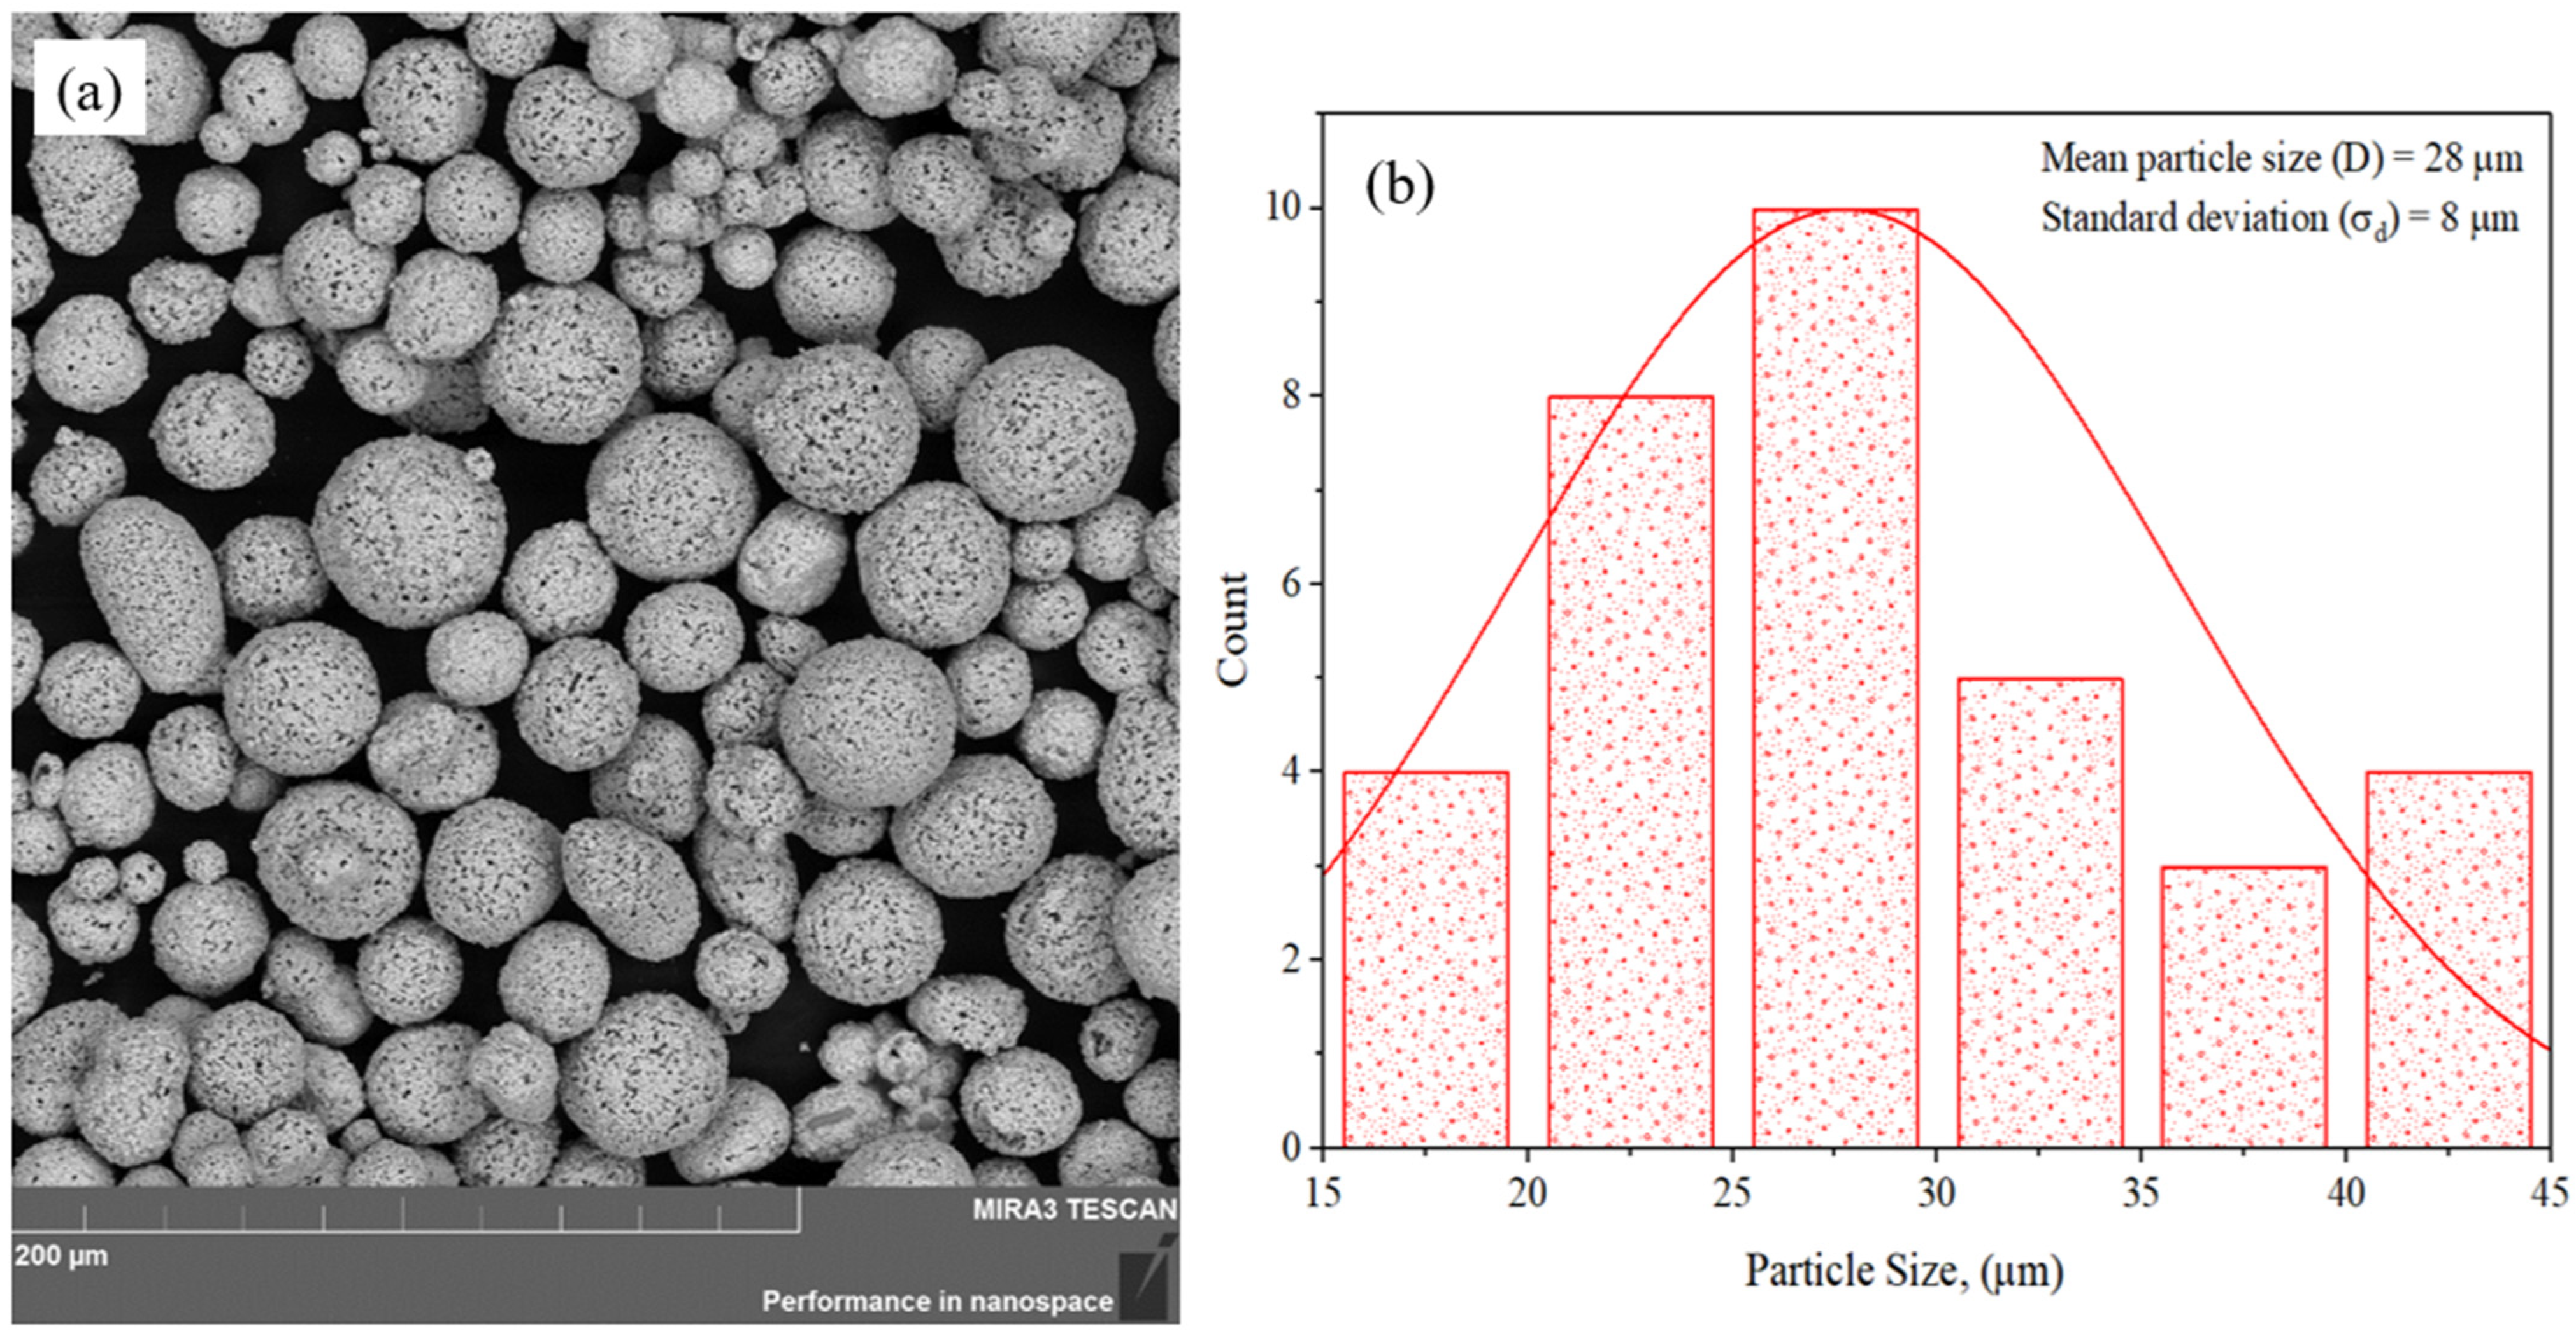
Figure 1. SEM image of morphology (a) and particle size distribution of initial 86WC-10Co-4Cr powder (b).
Coatings 14 01275 g001
Figure 2. SEM images of the surfaces of coatings sputtered with 86WC-10Co-4Cr powder with varying oxygen flow rates. (a) 150 L/min (sample A1), (b) 170 L/min (sample A2), (c) 190 L/min (sample A3).
Coatings 14 01275 g002
Figure 3. Results of surface roughness analysis of 86WC-10Co-4Cr coatings obtained with varying oxygen flow rates: graph of dependence of coating roughness height on the identifier path length (a) and graph offering a comparison of roughness values Ra and Rt (b).
Coatings 14 01275 g003
Figure 4. SEM images of the cross-sectional morphology of the 86WC-10Co-4Cr coatings obtained with varying oxygen flow rates: (a) 150 L/min (sample A1); (b) 170 L/min (sample A2); (c) 190 L/min (sample A3).
Coatings 14 01275 g004
Figure 5. Diffractograms of 86WC-10Co-4Cr coatings at different oxygen flow rates: A1—150 L/min, A2—170 L/min, A3—190 L/min.
Coatings 14 01275 g005
Figure 6. Graph of the dependence of the coefficient of friction on the friction path.
Coatings 14 01275 g006
Figure 7. Microphotographs of the sliding friction track of 86WC-10Co-4Cr coatings at different oxygen flow rates: (a) sample A1—150 L/min, (b) sample A2—170 L/min, (c) sample A3—190 L/min.
Coatings 14 01275 g007
Figure 8. Photographs of 86WC-10Co-4Cr coating samples before adhesion testing: A1—150 L/min, A2—170 L/min, A3—190 L/min.
Coatings 14 01275 g008
Figure 9. Plot of stress versus relative elongation for three 86WC-10Co-4Cr coating samples at different oxygen flow rates: A1 coating—150 L/min, A2 coating—170 L/min, A3 coating—190 L/min.
Coatings 14 01275 g009
Figure 10. Surface of stops and metal–ceramic 86WC-10Co-4Cr coatings after adhesion test: (a) A1—150 L/min, (b) A2—170 L/min, (c) A3—190 L/min.
Coatings 14 01275 g010
Table 1. Parameters of HVOF coating process.
Coatings Code
Example
86WC-10Co-4Cr (A1)86WC-10Co-4Cr
(A2)
86WC-10Co-4Cr
(A3)
Application
Process Parameters
Propane flow rate, L/min35
Oxygen flow rate, L/min150170190
Spraying distance, mm300
Powder feed rate, g/min100
Propane pressure0.39 MPa
Oxygen pressure0.88 MPa
Nitrogen pressure0.5 MPa
Table 2. Results of X-ray phase analysis.
SampleDetected PhasesPhase Content, wt%Lattice Parameters, (Å)CSR Size, nmΔd/d × 10−3
A1 coatingWC53a = 2.9005
c = 2.8330
350.61
W2C4a = 2.9614
c = 4.6884
152.364
CoO43a = 4.2507103.504
A2 coatingWC50a = 2.9011
c = 2.8328
380.482
W2C4a = 2.9554
c = 4.6641
277.302
CoO46a = 4.2451136.518
A3 coatingWC53a = 2.9027
c = 2.8345
301.02
W2C7a = 2.9624
c = 4.6924
130.894
CoO40a = 4.2506101.682
Note: CSR—coherent scattering regions of the crystallite. Δd/d × 10−3—value of microvoltage. wt%—mass content.
Disclaimer/Publisher’s Note: The statements, opinions and data contained in all publications are solely those of the individual author(s) and contributor(s) and not of MDPI and/or the editor(s). MDPI and/or the editor(s) disclaim responsibility for any injury to people or property resulting from any ideas, methods, instructions or products referred to in the content.