Article

Evaluation of the Fatigue Performance of Full-Depth Reclamation with Portland Cement Material Based on the Weibull Distribution Model

1
College of Energy and Transportation Engineering, Inner Mongolia Agricultural University, Hohhot 010018, China
2
National & Local Joint Engineering Laboratory of Transportation and Civil Engineering Materials, Chongqing Jiaotong University, Chongqing 400074, China
3
School of Civil Engineering and Environment, Zhengzhou University of Aeronautics, Zhengzhou 450046, China
*
Author to whom correspondence should be addressed.
Coatings 2024, 14(4), 437; https://doi.org/10.3390/coatings14040437
Submission received: 8 March 2024 / Revised: 2 April 2024 / Accepted: 3 April 2024 / Published: 7 April 2024
(This article belongs to the Special Issue Novel Cleaner Materials for Pavements)

Abstract

:
The full-depth reclamation with Portland cement (FDR-PC) technology embodies an environmentally friendly approach to solving the damage to old asphalt pavement. Fatigue failure emerges as the predominant mode of degradation for FDR-PC pavement. The fatigue characteristics of the full-depth reclamation with Portland cement cold recycled mixtures were evaluated through four-point bending tests. Three contents (4%, 5%, 6%) of cement and three base-to-surface ratios (10:0, 8:2, 6:4) were utilized. The fatigue equations were derived for the mixtures using a two-parameter Weibull distribution. The results indicate that all correlation coefficients of the Weibull distribution model surpass 0.88, effectively projecting the lifespan of FDR-PC. With increases in cement contents and base-to-surface ratios, the fatigue life of the mixture extends, though with an augmentation of stress sensitivity. Comparative analysis with the fatigue equation model parameters of the current Chinese specifications for the design of highway asphalt pavement reveals that mixtures with a 4% cement content and combinations of a 5% cement content with a low base-to-surface ratio meet the requirements for inorganic-binder-stabilized soil. Additionally, mixtures with a 5% cement content and a high base-to-surface ratio, along with those with a 6% cement content, fulfill the specifications for inorganic-binder-stabilized granular materials.

1. Introduction

With the rapid surge in road construction, addressing the repair of deteriorating roads has become imperative. Given the global challenges posed by climate change and economic factors, current endeavors in road construction and repair are primarily focused on harnessing substantial quantities of solid waste while augmenting the technical efficacy of road materials [1,2]. In China’s regular highways, asphalt pavements are typically relatively thin, ranging from 4 cm to 8 cm in thickness, thereby leading to damage patterns predominantly characterized by a combination of asphalt surface deterioration and base-layer degradation. Recycled materials primarily sourced from the old subgrade will pose challenges in terms of complex construction and cost-effectiveness if the old asphalt surface and base materials are categorized and reapplied separately. Therefore, full-depth cold recycling technology aligns exceptionally well with projects involving the conversion of regular highways’ thin asphalt layers, addressing intricacies and enhancing cost-effectiveness.
The full-depth reclamation with Portland cement (FDR-PC) is a cold recycling technology developed for old asphalt pavement, with its origins traced back to the United States and France in the 1950s [3,4]. The FDR-PC technique initiates with the utilization of on-site milling equipment to disintegrate the old pavement, proportionally mixing the reclaimed asphalt and base layers. After this phase, cement is introduced and uniformly blended, and then it is compacted to generate a new composite material [5]. Compared to alternative restoration methods, FDR-PC demonstrates superior mechanical properties, a shorter construction duration, minimal traffic disruption, cost-effectiveness, and reduced carbon emissions [6,7].
Although a new material, FDR-PC falls under the category of stable inorganic mixtures and is utilized as a base layer in reconstructed asphalt pavements. As is widely acknowledged, the fatigue performance of the base layer plays a crucial role in determining the overall design life of semi-rigid-base asphalt pavement structures. Fatigue failure is the predominant mode of structural deterioration in full-depth reclamation of pavement. The mixture design methods proposed in various countries, including the United States [8], Spain [9], Germany [10], South Africa [11], Australia, New Zealand [12], and Brazil [13], consistently emphasize the need for durability testing in addition to the 7-day unconfined compressive strength test during the design phase. In laboratory research, when focusing on the impact of reclaimed asphalt pavement (RAP), Jiang [14] observed that a higher RAP content decreases the fatigue life of FDR-PC mixtures. López [15] proposed that the influence of the RAP content on the fatigue behavior of the mixtures is intricate and necessitates a consideration of the cement content and layer thickness. When considering the impact of cement, Guthrie [16] and Yuan [17] highlighted that an increased cement content enhances the strength and stiffness of FDR-PC mixtures. Dixon [18] emphasized that cement improves durability by reducing the sensitivity to water, while Fedrigo [19] indicated that a high cement content enhances durability but may raise the risk of shrinkage, requiring usage restrictions. López [15] conducted a comprehensive study on the impact of RAP and cement on the fatigue properties of FDR-PC mixtures.
In field research, Syed [20] conducted on-site assessments of 75 highway projects in the United States, unveiling the stability and cost-effectiveness of FDR-PC during long-term use. However, in general, the existing research on the fatigue properties of FDR-PC mixtures is not comprehensive. Furthermore, considering the stochastic and discrete nature of concrete life, research methods employing linear regression and mean values have limitations. Therefore, noting the current scarcity of statistical and probabilistic approaches in existing studies, in this study, we utilized a two-parameter Weibull distribution for statistical and probabilistic investigations into the fatigue properties of FDR-PC.
The fatigue life of pavement materials exhibits stochasticity and discreteness. Their lifespan is influenced by various factors such as the concrete mix proportion, strength, and environmental conditions, all of which possess inherent randomness. Additionally, the strength of concrete is discretely distributed; even in specimens composed of concrete with well-controlled quality, the strength varies within a certain range [21]. Concrete lifespan experiments typically involve small sample sizes, rendering linear regression analysis susceptible to significant noise interference. To mitigate the impact of the discreteness of test data on the results of fatigue performance analysis, increasing the sample size is an effective solution. However, fatigue tests typically consume significant time, leading to a substantial increase in testing costs. Constrained by these factors, current laboratory fatigue tests for asphalt mixtures often utilize a limited number of specimens. Therefore, to accurately analyze the fatigue performance of asphalt mixtures with a small sample size, statistical analysis methods are essential.
The Weibull distribution stands as the foundational theory for reliability analysis and lifespan testing, providing a continuous probability distribution capable of modeling increasing, decreasing, or fixed failure functions. This model facilitates the description of any stage in the project lifespan and is extensively applied in reliability engineering [22,23,24]. Its proficiency in inferring distribution parameters using probability values makes it a widely employed tool in processing data from various lifespan tests [24]. In investigating the lifespan of concrete, Guo [25] utilized the dynamic modulus as a durability assessment indicator, revealing that stochastic analysis methods employing both two-parameter and three-parameter Weibull distributions effectively assess the degradation process of concrete in the Xining region in China. Wang [26], relying on the Weibull distribution model, established an impact damage prediction model for ultra-high-performance concrete. They analyzed the model’s precision using the decision coefficient R 2 , thereby effectively reflecting the damage development process of concrete under freeze–thaw and impact environments. Wang’s [27] research suggests that the Weibull distribution enables researchers to reduce the number of tests and articulate the impact failure strength of fiber-reinforced concrete from the perspectives of reliability and safety limits. Sun [28] applied a two-parameter Weibull distribution to describe the fatigue life distribution of asphalt concrete under varying conditions, demonstrating its relevance in observing material and environmental variations in laboratory experiments. Zhu [29] derived the damage evolution equation for alkali-resistant glass-fiber-reinforced concrete based on the Weibull distribution. These studies emphasize the extensive applicability and reliability of the Weibull distribution in concrete lifespan research.
Therefore, this study initiated the utilization of the full-depth reclamation with Portland cement cold recycled mixture, designed through the heavy compaction method. Following this, specimens were manufactured for four-point bending fatigue tests. To account for the stochastic and discrete characteristics of recycled mixture ’s lifespan, a two-parameter Weibull distribution was employed to optimize the fit of the fatigue equation. Subsequently, the fatigue equation was used to explore the stress sensitivity and lifespan limits of the cold recycled mixture across different cement contents and base-to-surface ratios.

2. Materials and Methods
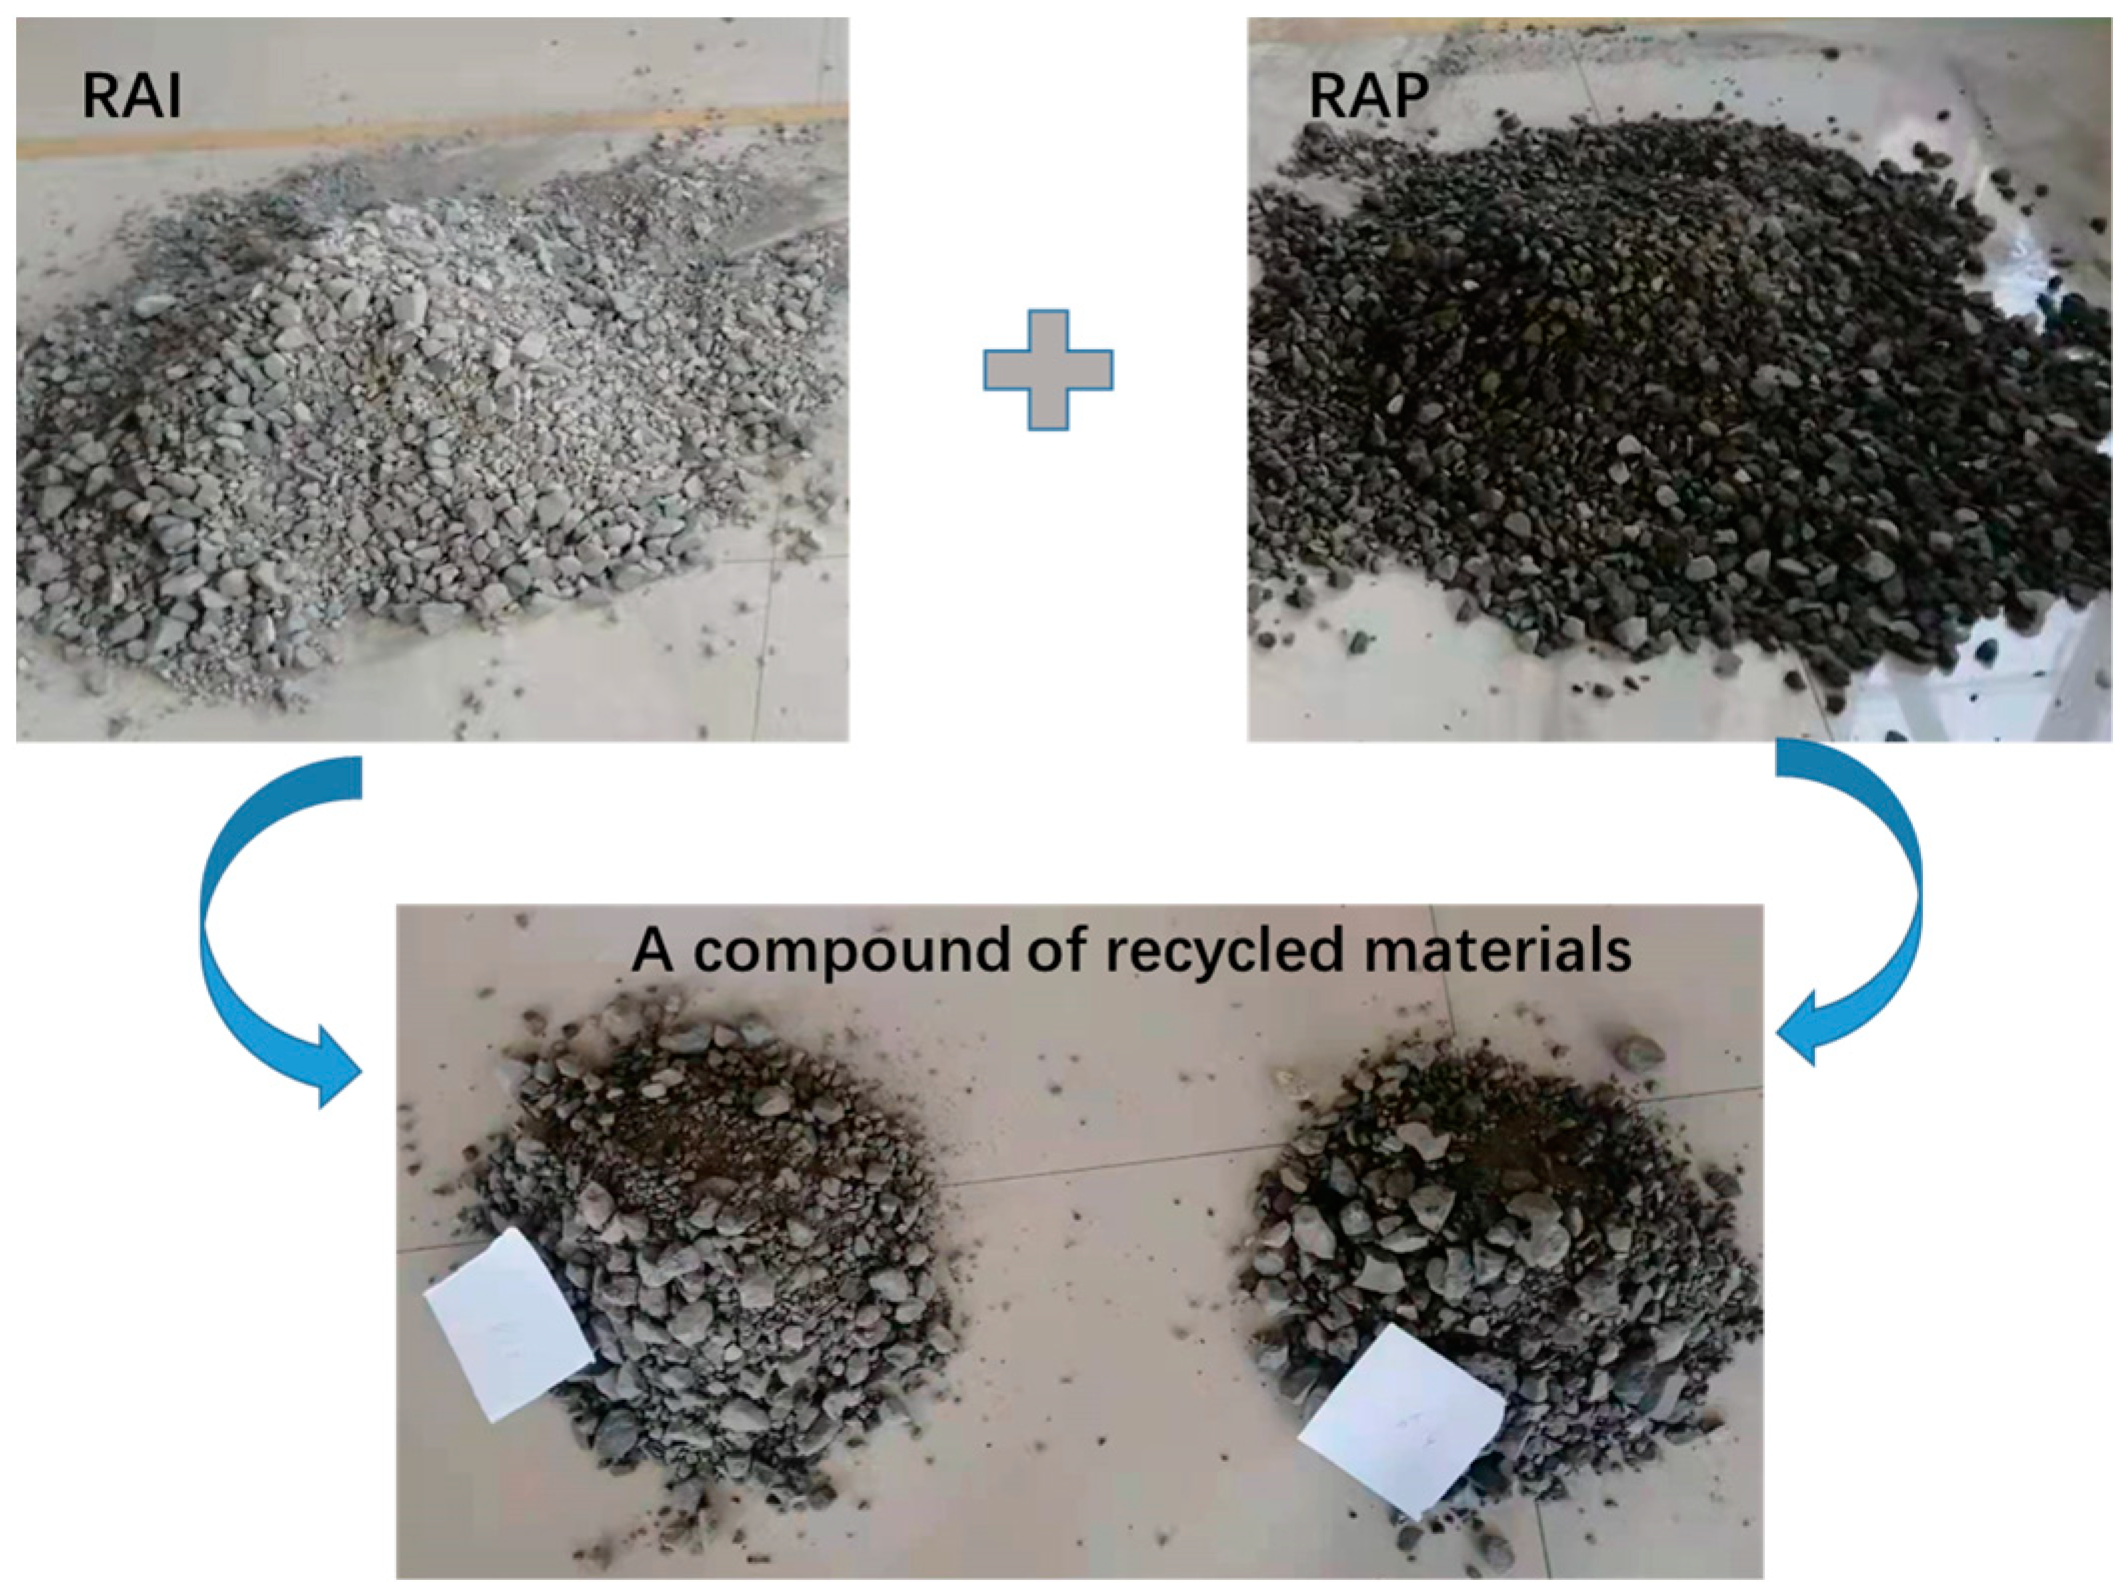
2.1. Raw Materials

The reclaimed materials originated from the 110 National Highway in Inner Mongolia in China, which serves as a secondary road network. The prevailing asphalt surface layer measured 4 cm and was composed of AC-16 asphalt mixture, while the base layer consisted of a 20 cm layer of cement-stabilized crushed stone.
The intricate challenge of segregating reclaimed asphalt pavement (RAP) and reclaimed inorganic-binder-stabilized aggregate (RIA) led, drawing upon construction expertise, to the decision to employ a milling machine for the stratified milling of both the old asphalt surface layer and the base layer. Subsequently, RAP and RIA underwent separation and extraction, followed by individual sieving post natural drying in the laboratory. To ensure precision in the gradation of blended recycled materials and minimize experimental errors, a systematic classification of RAP and RIA was executed, adhering to the criteria outlined in Table 1. The screening test results are visually presented in Figure 1.
Considering factors such as the thickness ratio between the old asphalt pavement surface layer and base layer, actual construction conditions, and economic considerations, it is common practice to limit the mass proportion of reclaimed asphalt pavement in full-depth recycling mixtures to a maximum of 40%. Consequently, three representative mineral compositions were devised for the experimentation, with base-to-surface ratios of 10:0, 8:2, and 6:4, respectively. As a result of these experiments, three distinct gradation curves were obtained for recycled materials. The synthesized gradation curve is illustrated in Figure 2.
The cement employed was ordinary Portland cement, graded at 42.5. The technical specifications are detailed in Table 2, adhering to the technical prerequisites stipulated in the Chinese specification JTG/T 5521—2019 [30].

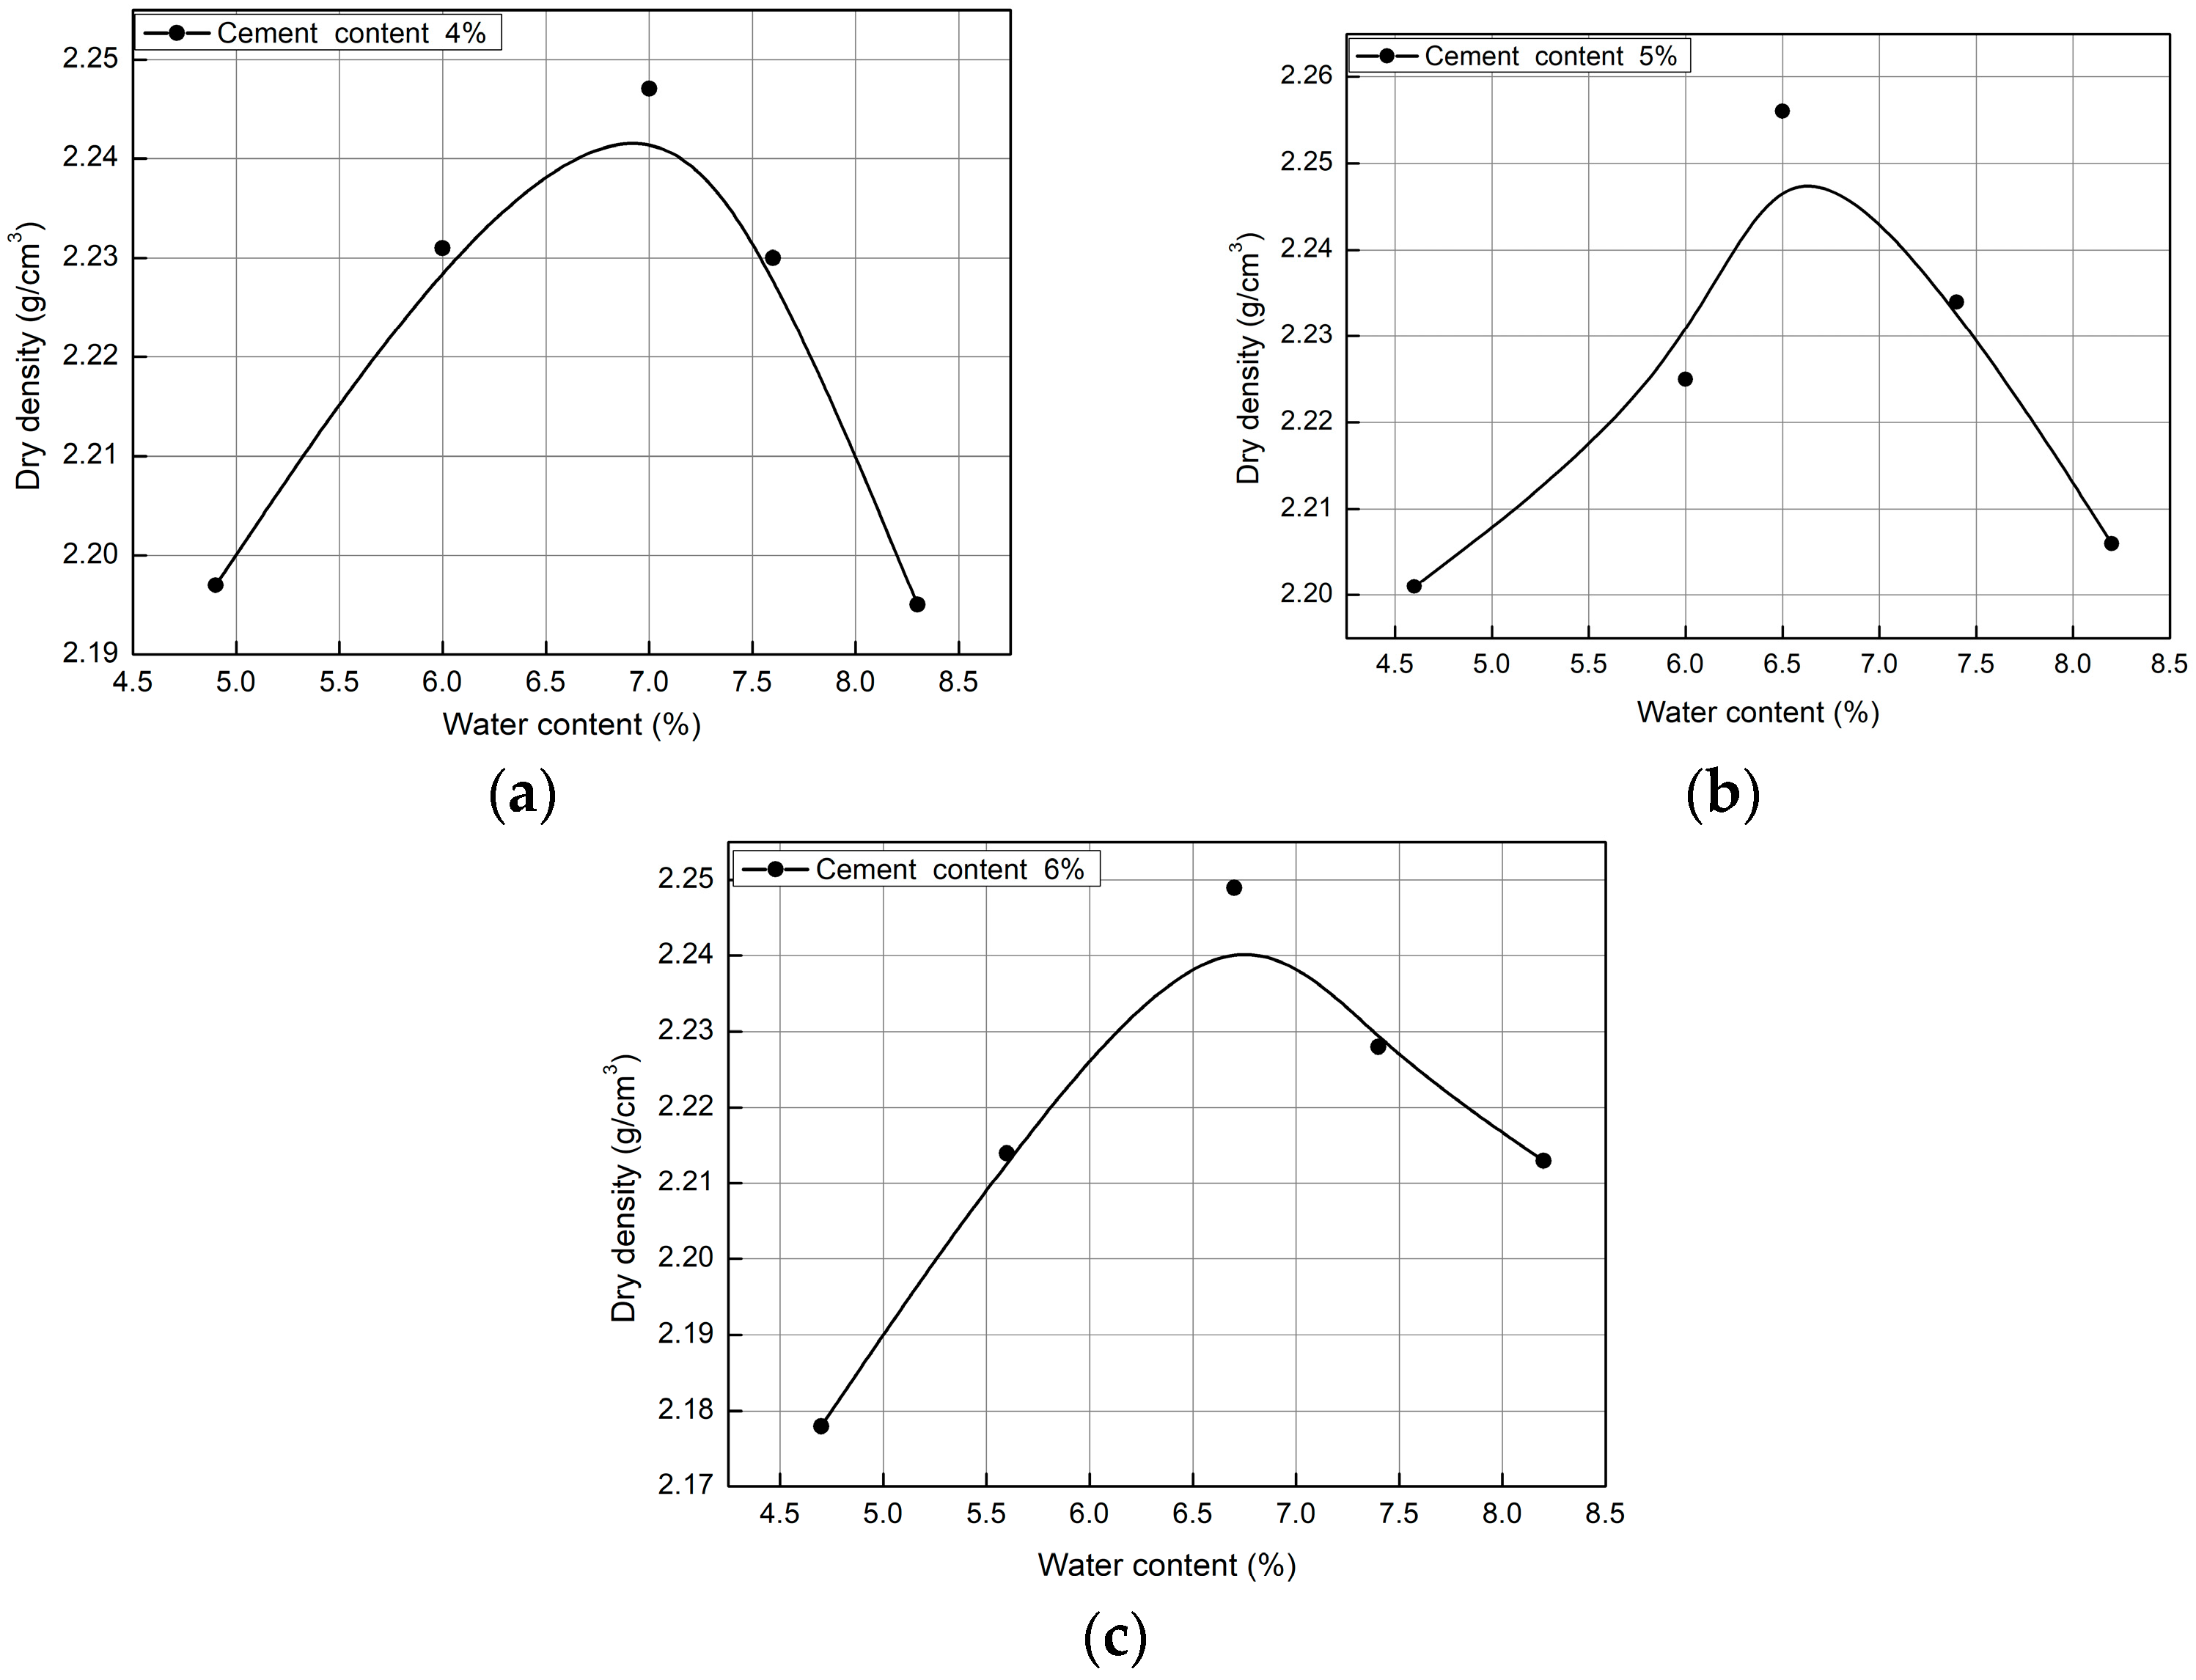
2.2. Determining the Optimum Water Content and the Maximum Dry Density

The heavy compaction test was employed to ascertain the optimal water content and the maximum dry density of FDR-PC cold recycled mixtures. The parameters and operational procedures were taken from the Chinese standard JTG E51-2009 [33].
The testing process involved the formation of 5 parallel specimens for each mixture, with each specimen being tested under varying moisture content levels. Cylinder specimens were produced by employing the static compaction method, with the size of 150 mm radius and 120 mm height. The production of a specimen’s required weight in FDR-PC was determined by the compaction degree, the optimal water content, and the maximum dry density, as specified in Equation (1). All specimens underwent curing in a standard curing room, maintaining an air temperature of 20 ± 2 °C and a relative humidity of 95%.
m 0 = V × ρ m a x × ( 1 + w o p t ) × K ,
In Equation (1), m 0 signifies the weight of an individual specimen, g ; V denotes the volume relative to a single specimen, c m 3 ; ρ m a x represents the maximum dry density, g / c m 3 ; w o p t indicates the optimum water content, %; and K denotes the compaction degree, with this paper adopting a compaction degree value of 98%.
Specimens were fabricated using cement contents of 4%, 5%, and 6% relative to the mass of the recycled mixture, resulting in distinct curves for dry density–water content, as depicted in Figure 3. The optimum water content and maximum dry density were derived from the vertex of each curve, as depicted in Table 3.

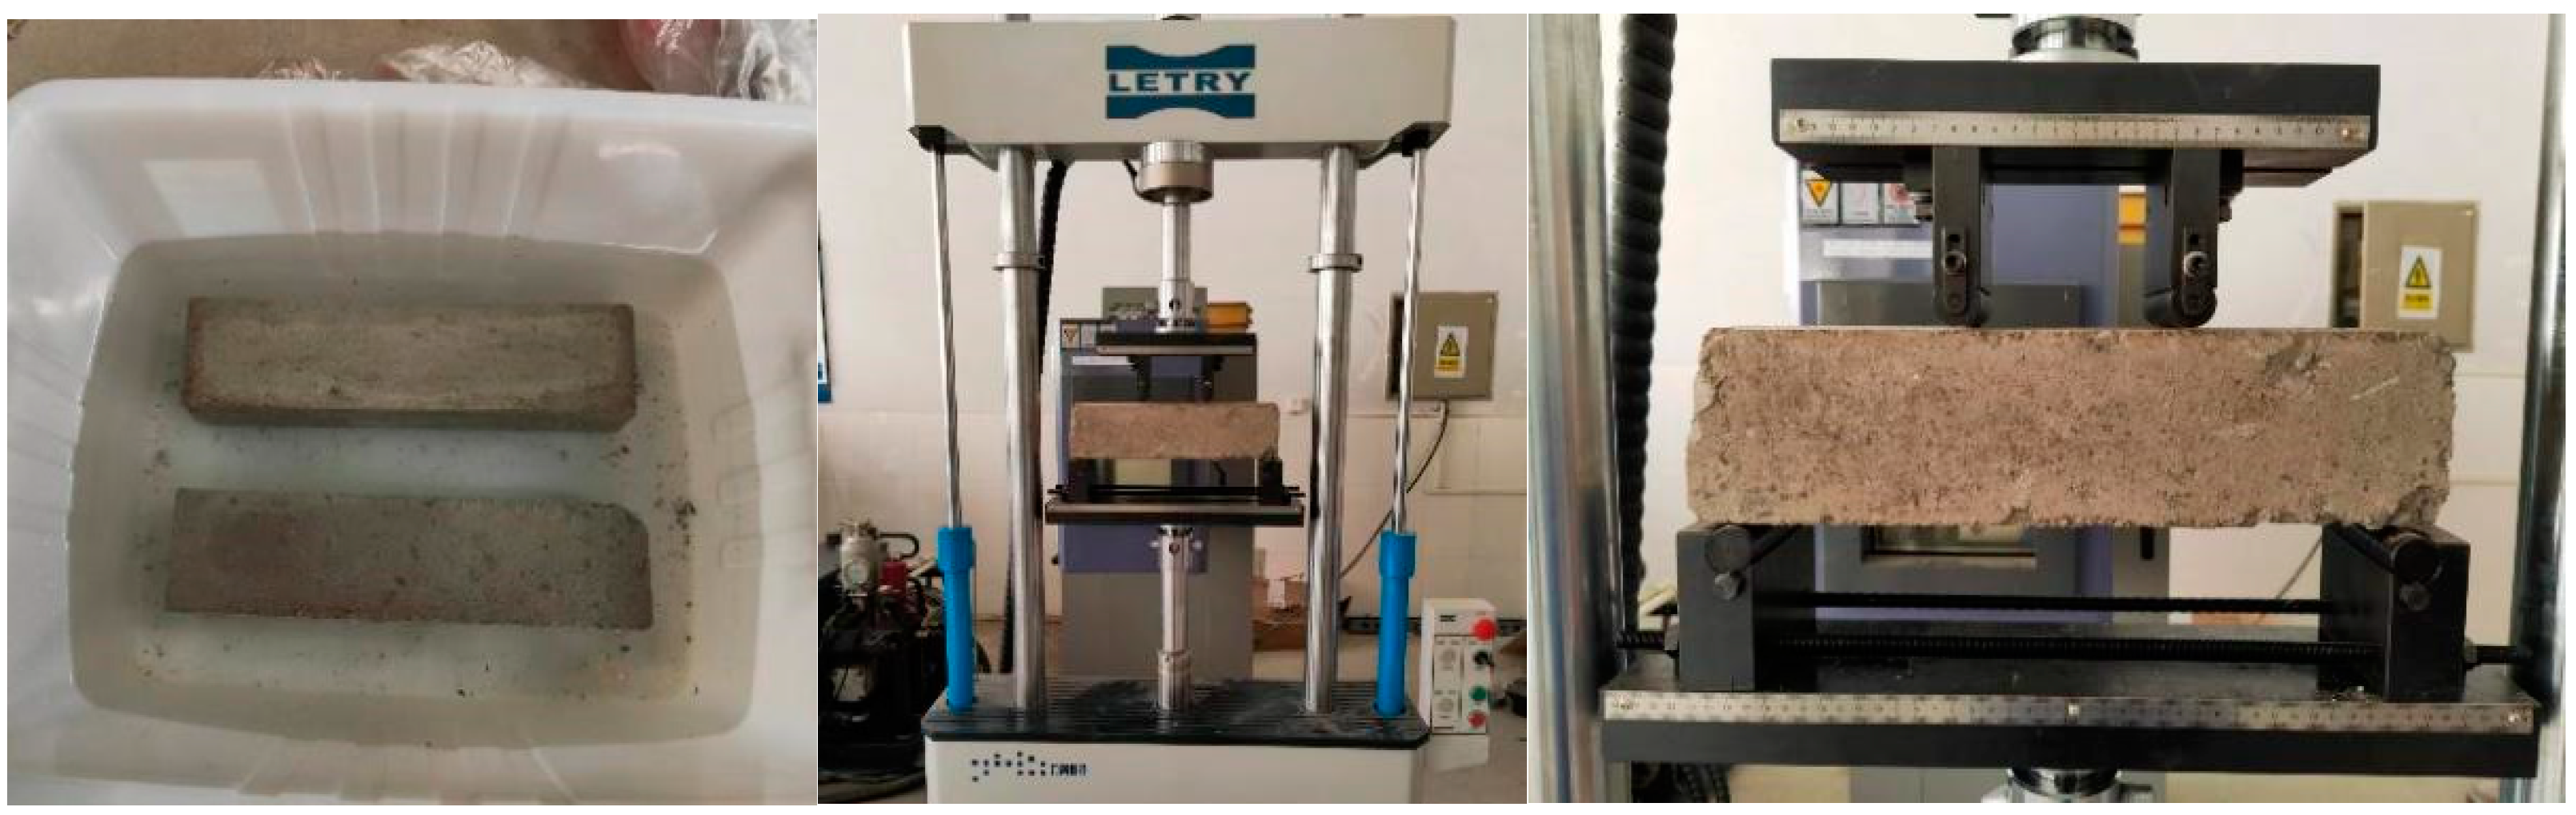
2.3. Flexural Strength Test Method

The load levels for the fatigue tests were determined based on the flexural strength. Each test group employed 12 specimens, with dimensions measuring 100 mm × 100 mm × 400 mm and a curing time of 90 days. Adhering to the Chinese specification JTG E51-2009 [33], as per T0851-2009, the specimens were positioned in fixtures, aligning the loading direction with the pressure direction during molding. The loading device and specimen utilized in the bending strength test were consistent with those employed in the fatigue test, as depicted in Figure 4. Rapid loading was applied at a rate of 50 mm/min, and the ultimate load P at the point of failure was recorded. The flexural strength was calculated using Equation (2).
f c f = P L b 2 h ,
In the formula, f c f signifies the flexural strength of the specimen, M P a ; P denotes the ultimate load at the point of failure of the specimen, N ; L represents the distance between the two supports, m m ; b  is the width of the specimen, m m ; and h signifies the height of the specimen, m m .

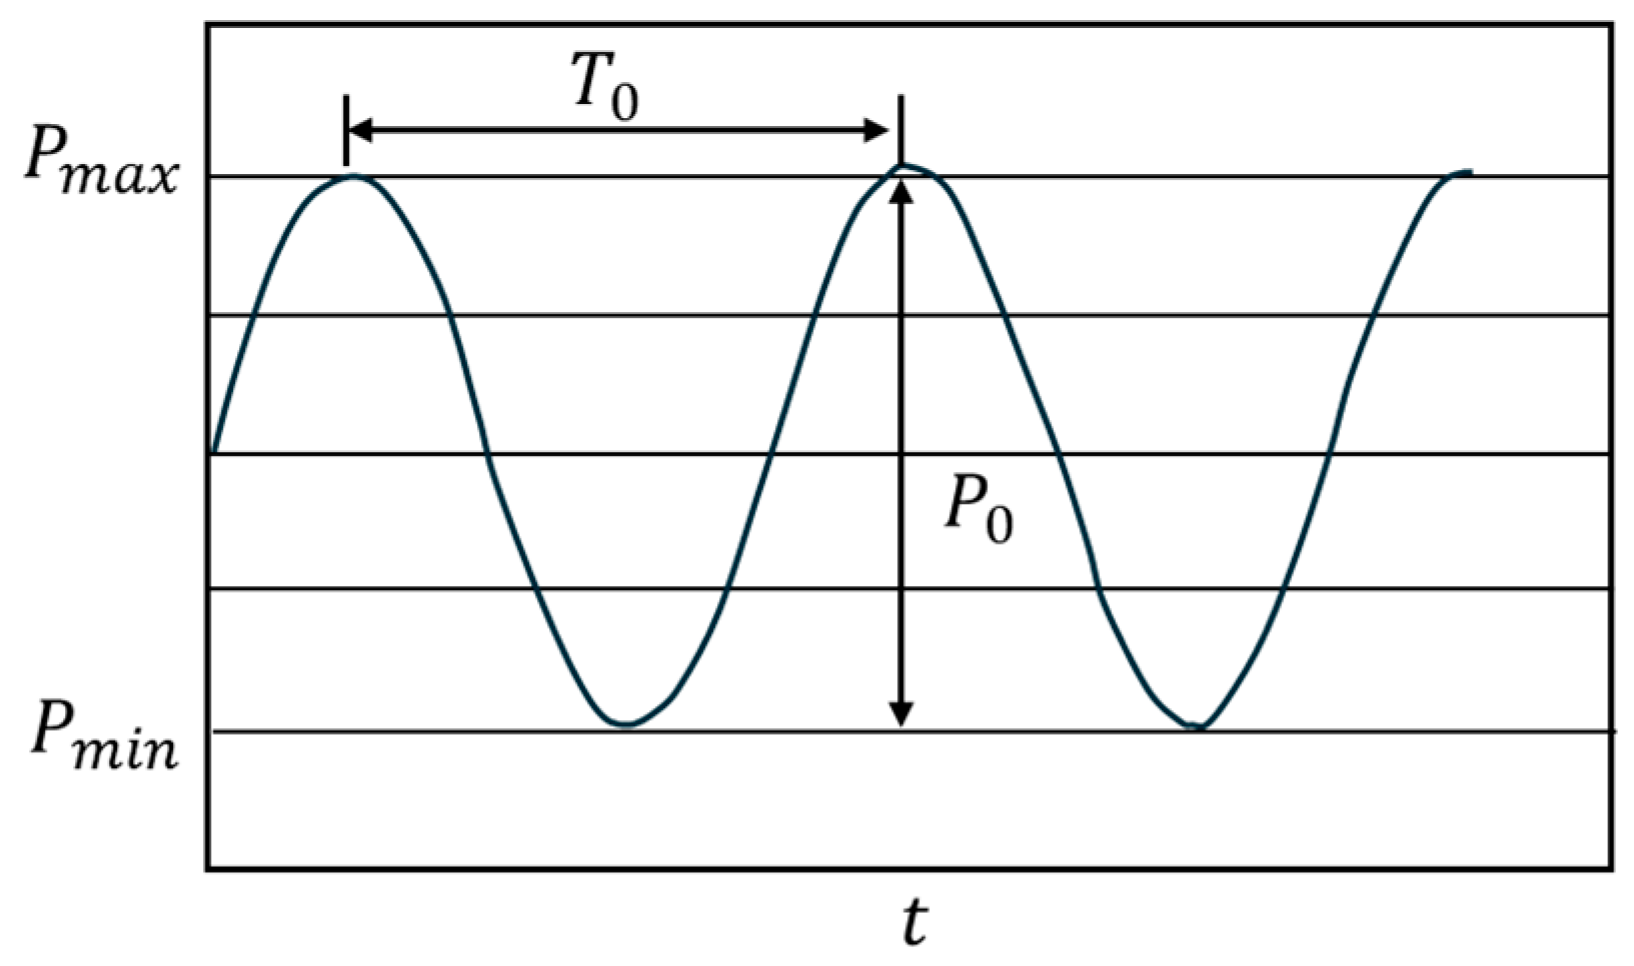
2.4. Fatigue Test Method

The fatigue performance of FDR-PC mixtures was evaluated using the experimental method specified in JTG E51-2009 [33], specifically T0856-2009, for assessing cement-stabilized materials. This ensured comparability of the experimental results and allowed for comparison with the fatigue equation parameters obtained from Chinese specifications. Each set comprised 6 specimens, undergoing standard curing for 90 days. Following the curing period, the specimens underwent 1 day of water immersion. Then, a four-point bending test was conducted using MTS, as illustrated in Figure 4. The span was set to 360 mm, with a horizontal distance of 60 mm between the two upper loading points and the beam center position, as well as a horizontal distance of 180 mm between the two lower support points and the beam center position.
The experiment was conducted in a stress-controlled mode with a loading frequency denoted by 10   H Z , utilizing a Haversine waveform as the loading pattern, as depicted in Figure 5. The stress characteristic formula was defined as
λ = P m i n P m a x = 0.1 ,
where λ represents the stress characteristic value, P m i n is the minimum stress, and P m a x is the maximum stress.
Various stress levels were applied in the experiments to derive fatigue equations for each cold recycled mixture. Based on the flexural strength test results of different FDR-PC cold recycled mixture specimens, the specific loading scheme for the fatigue tests was determined, as outlined in Table 4.
Each experiment commenced with 1 min preloading at 0.2 times the stress intensity ratio level, to prevent a rapid increase in test loads. Subsequently, the fatigue test proceeded until specimen failure, automatically recording the number of cycles at the point of failure.

2.5. Weibull Distribution

The fatigue damage of concrete is inherently a dynamic stochastic process. Consequently, even under identical test conditions and deterministic loading profiles, there is significant variability in the fatigue life of concrete specimens. In such circumstances, to obtain reliable fatigue performance data for cold recycled mixtures, the fatigue life can be treated as a random variable. The Weibull distribution has been widely employed in existing research to establish mathematical probability models for the fatigue life of civil engineering materials [34], particularly demonstrating strong adaptability to small sampling and various types of fatigue test data [35]. This study also utilized the two-parameter Weibull distribution to investigate the fatigue life of cold recycled mixtures. The probability density function f N and cumulative distribution function F ( N ) of the Weibull distribution can be expressed by Equations (4) and (5).
f N = α N a N 0 ( N N 0 N a N 0 ) α 1 · e x p N N 0 N a N 0 α ( N N 0 )
F N = N 0 N f N d N = 1 e x p N N 0 N a N 0 b
where N is the experimental fatigue life, N α is the characteristic life parameter, α is the Weibull shape parameter, and N 0 is the initial minimum life parameter.
The function F ( N ) , denoting the cumulative distribution function, signifies the probability that the fatigue life of a specimen is less than N. It can also be construed as the failure probability function for FDR-PC cold recycled mixtures. On the other hand, 1 F ( N ) presents the reliability probability function for FDR-PC cold recycled mixtures, as delineated by Equation (6), signifying the probability that the fatigue life of a specimen exceeds N.
P N = 1 F N = e x p N N 0 N a N 0 b
From a reliability perspective, considering the variability in the strength of cement-stabilized cold recycled mixtures and the variability in fatigue loads, it is assumed that the minimum fatigue life of cold recycled mixtures approaches 0 . Therefore, the probability density function and P ( N ) can be simplified to Equations (7) and (8).
f N = α N a ( N N a ) α 1 · e x p N N a α
P N = e x p N N a α
Furthermore, when taking the reciprocal of both sides of Equation (8) and subsequently applying two logarithmic transformations, the result is
l n l n 1 p = α l n N α l n N a
Let Y = l n l n 1 p , X = l n N , and β = α l n N a , and then Equation (9) can be expressed as Equation (10).
Y = α X β
Equation (10) represents a linear equation, and the parameters α and β can be fitted from experimental data. If Y and X exhibit a strong linear relationship, this indicates that the two-parameter Weibull distribution model is suitable for fatigue life distribution. According to the probability distribution theory, in small samples, the mathematical expectation of the failure rate of a certain sample can be estimated using the average rank as an estimate of the survival rate of the small sample. When arranging n fatigue test data obtained from fatigue tests at the same stress level in ascending order, the serial number is represented by i , and the reliability P corresponding to the fatigue life N is calculated according to Equation (11).
P = 1 i n + 1 ,

2.6. Fatigue Equation

The fatigue equation for concrete typically characterizes the fatigue performance of concrete under alternating loads. This equation can be formulated in the S-N curve representation, as depicted by Equation (12) [36].
lg N = a k σ / S ,
In the equation, N signifies the number of loading cycles at failure, a represents the intercept of the curve, k denotes the slope of the curve, and σ / S stands for the stress ratio. When derived from Equation (12), it becomes apparent that the intercept a and slope k of the fatigue equation serve as pivotal indicators of the fatigue performance of the mixture. A heightened k value corresponds to a more pronounced fatigue curve, signifying an increased sensitivity of fatigue life to alterations in stress levels. Conversely, a mirrors the vertical placement of the fatigue curve, and an elevated a value implies a larger fatigue life limit.

3. Results and Discussion

3.1. Fatigue Test Results

The fatigue life tests were conducted on cold recycled mixtures with cement content and base-to-surface ratio combinations of 4%–8:2, 5%–8:2, 6%–8:2, 5%–6:4, and 5%–10:0. The reliability-life results for various parameter combinations under different stress ratios are presented in Table 5. The P-N curves for the cold recycled mixture with a cement content of 5% and a base-to-surface ratio of 8:2, fitted through the Weibull distribution, are depicted in Figure 6. The correlation coefficients R 2 for the Weibull-distribution-fitted curves consistently exceed 0.88 in Table 5, indicating that the fatigue life of cold recycled mixtures conforms to the Weibull distribution.

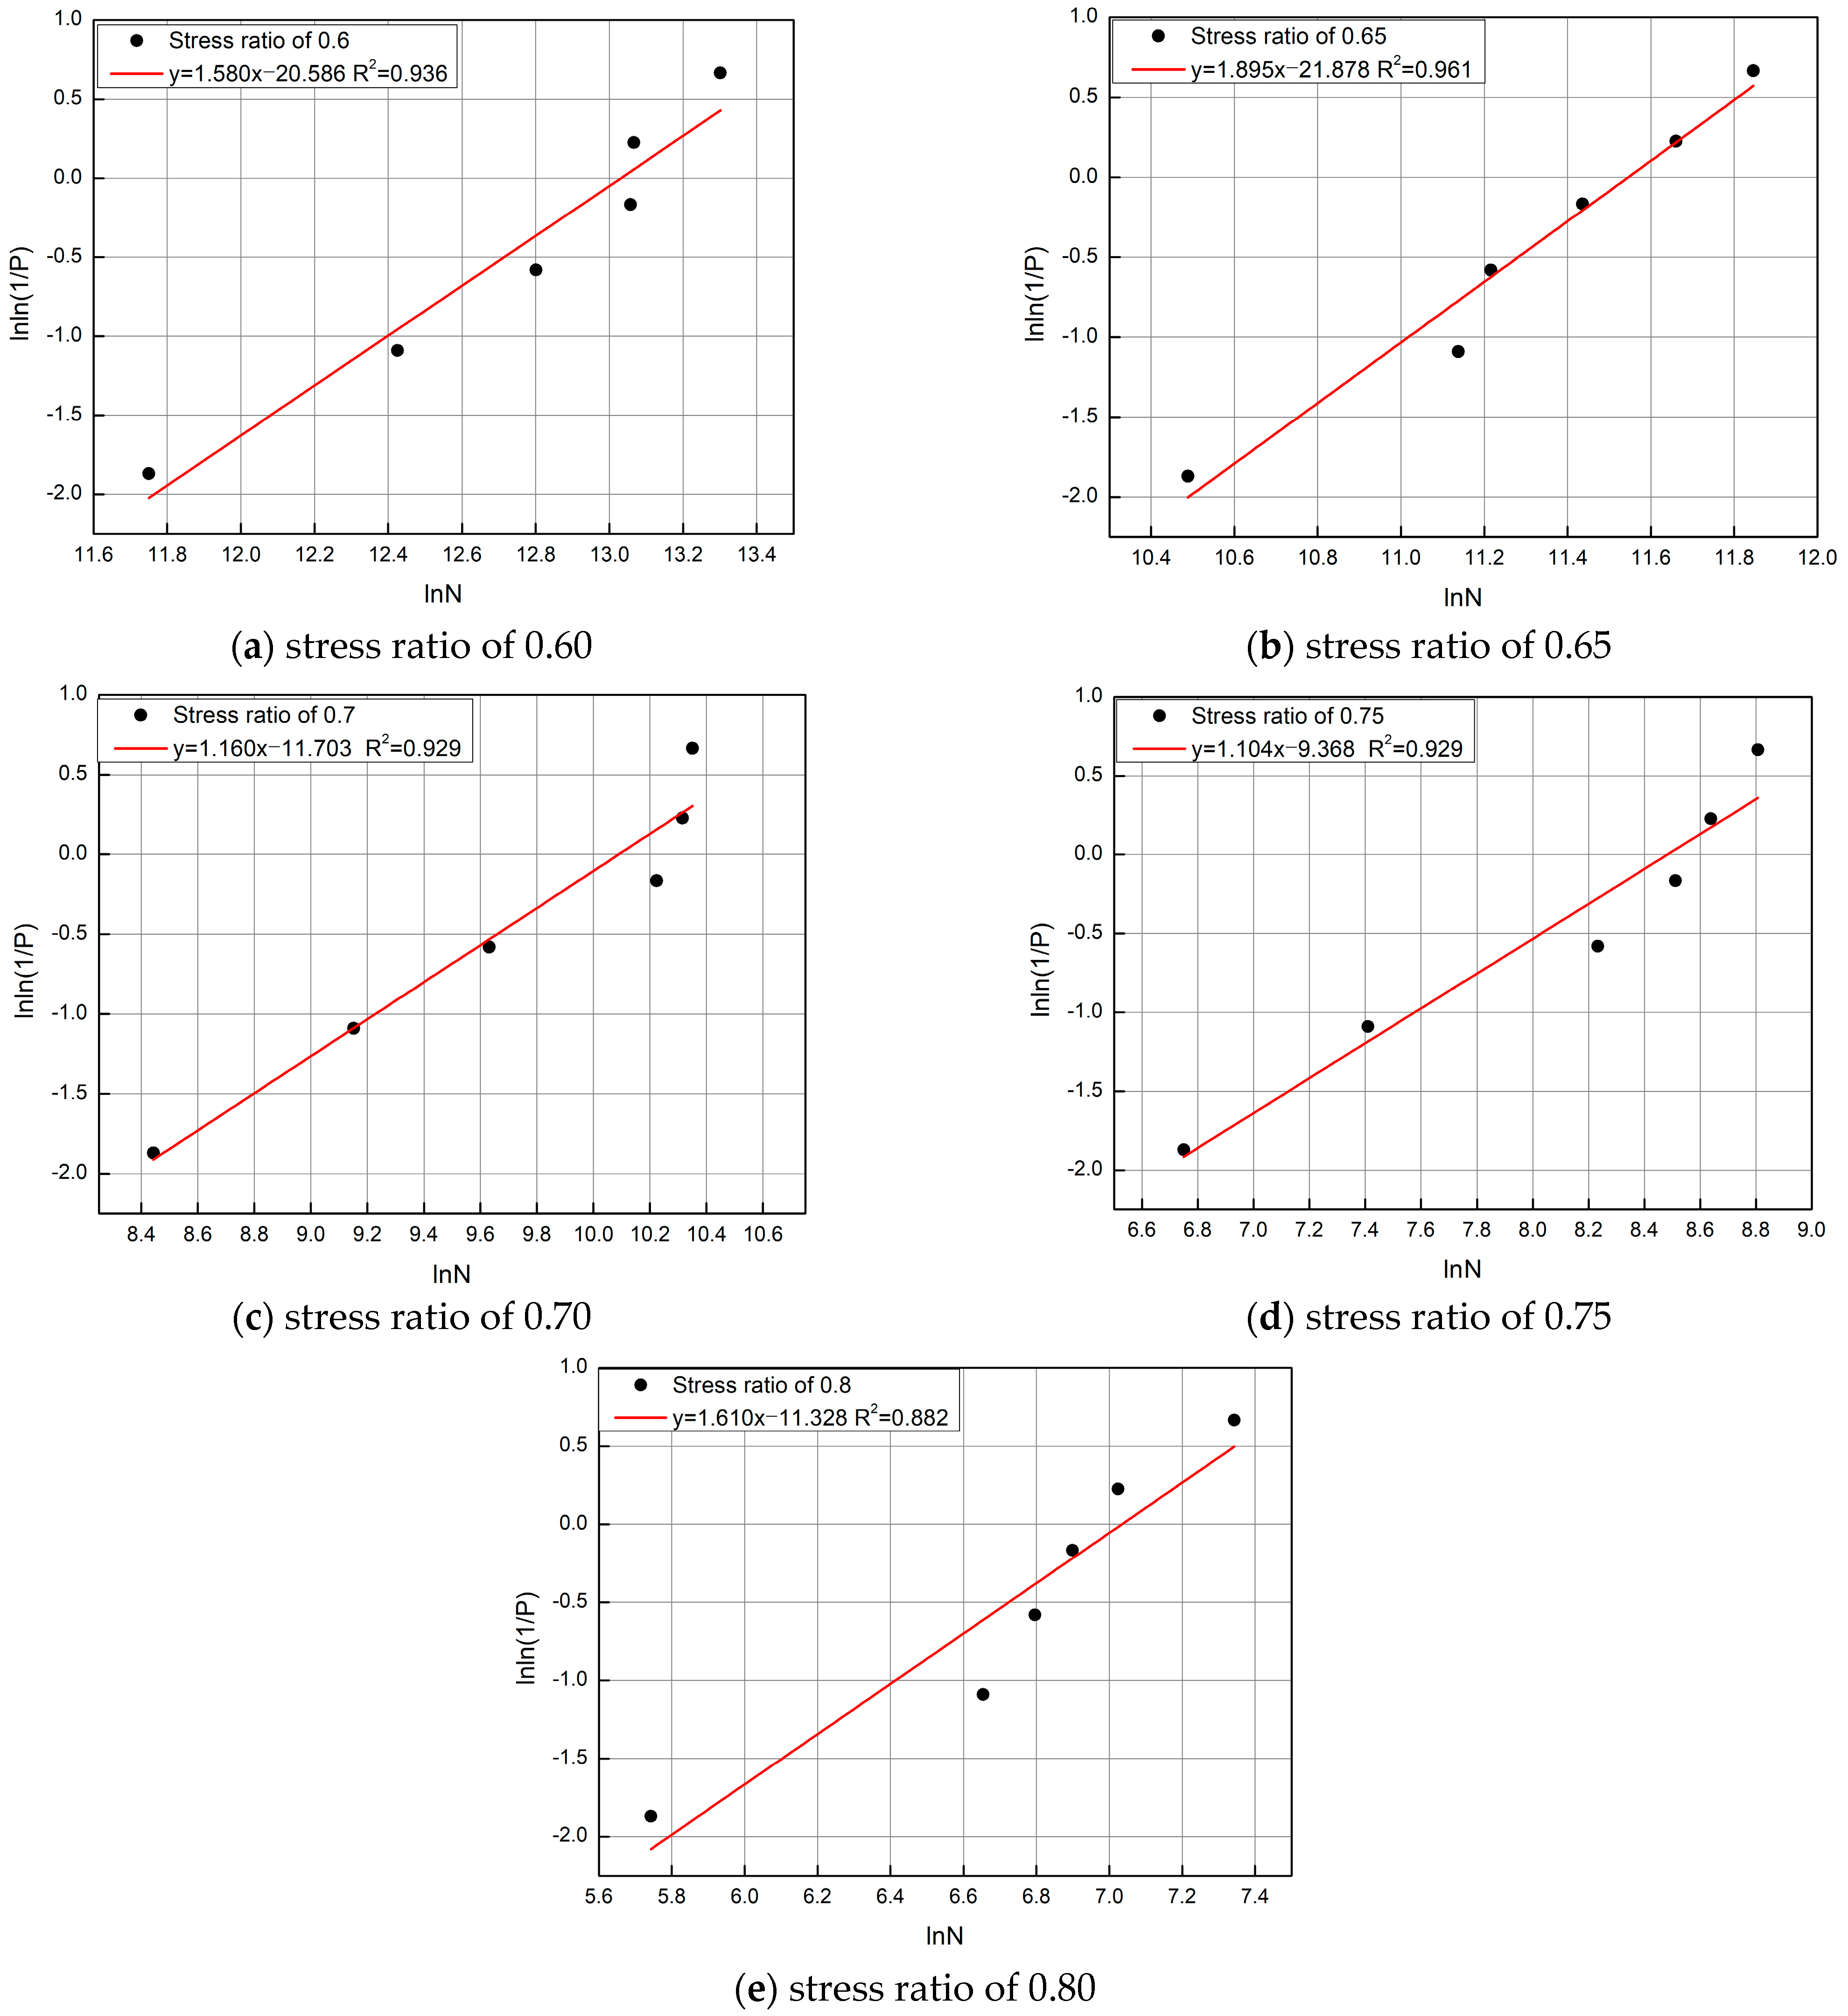
3.2. Weibull Equation

Substituting the fatigue life values from Table 5 back into Equation (9) yields the Weibull distribution equations for the fatigue lives of various cold recycled mixtures at different stress ratios, as presented in Table 6. Utilizing the fitted Weibull distribution equations allows for the calculation of the fatigue life for cold recycled mixtures at any given reliability level. The above statistical analysis was conducted using the ORIGIN2018 software program. Table 7 lists the fatigue lives of all experimentally produced FDR mixtures at the stress ratios of 0.6, 0.65, 0.7, 0.75, and 0.8, with the reliability levels set at 50%, 60%, 70%, 80%, and 90%, respectively.
Following Equation (12), we conducted a linear regression utilizing the stress ratio and fatigue life data from Table 7, which yielded the curves of the fatigue equation. Figure 7 illustrates the fatigue equation curves for cold recycled mixtures with five different cement content and base-to-surface ratio combinations at five reliability levels.

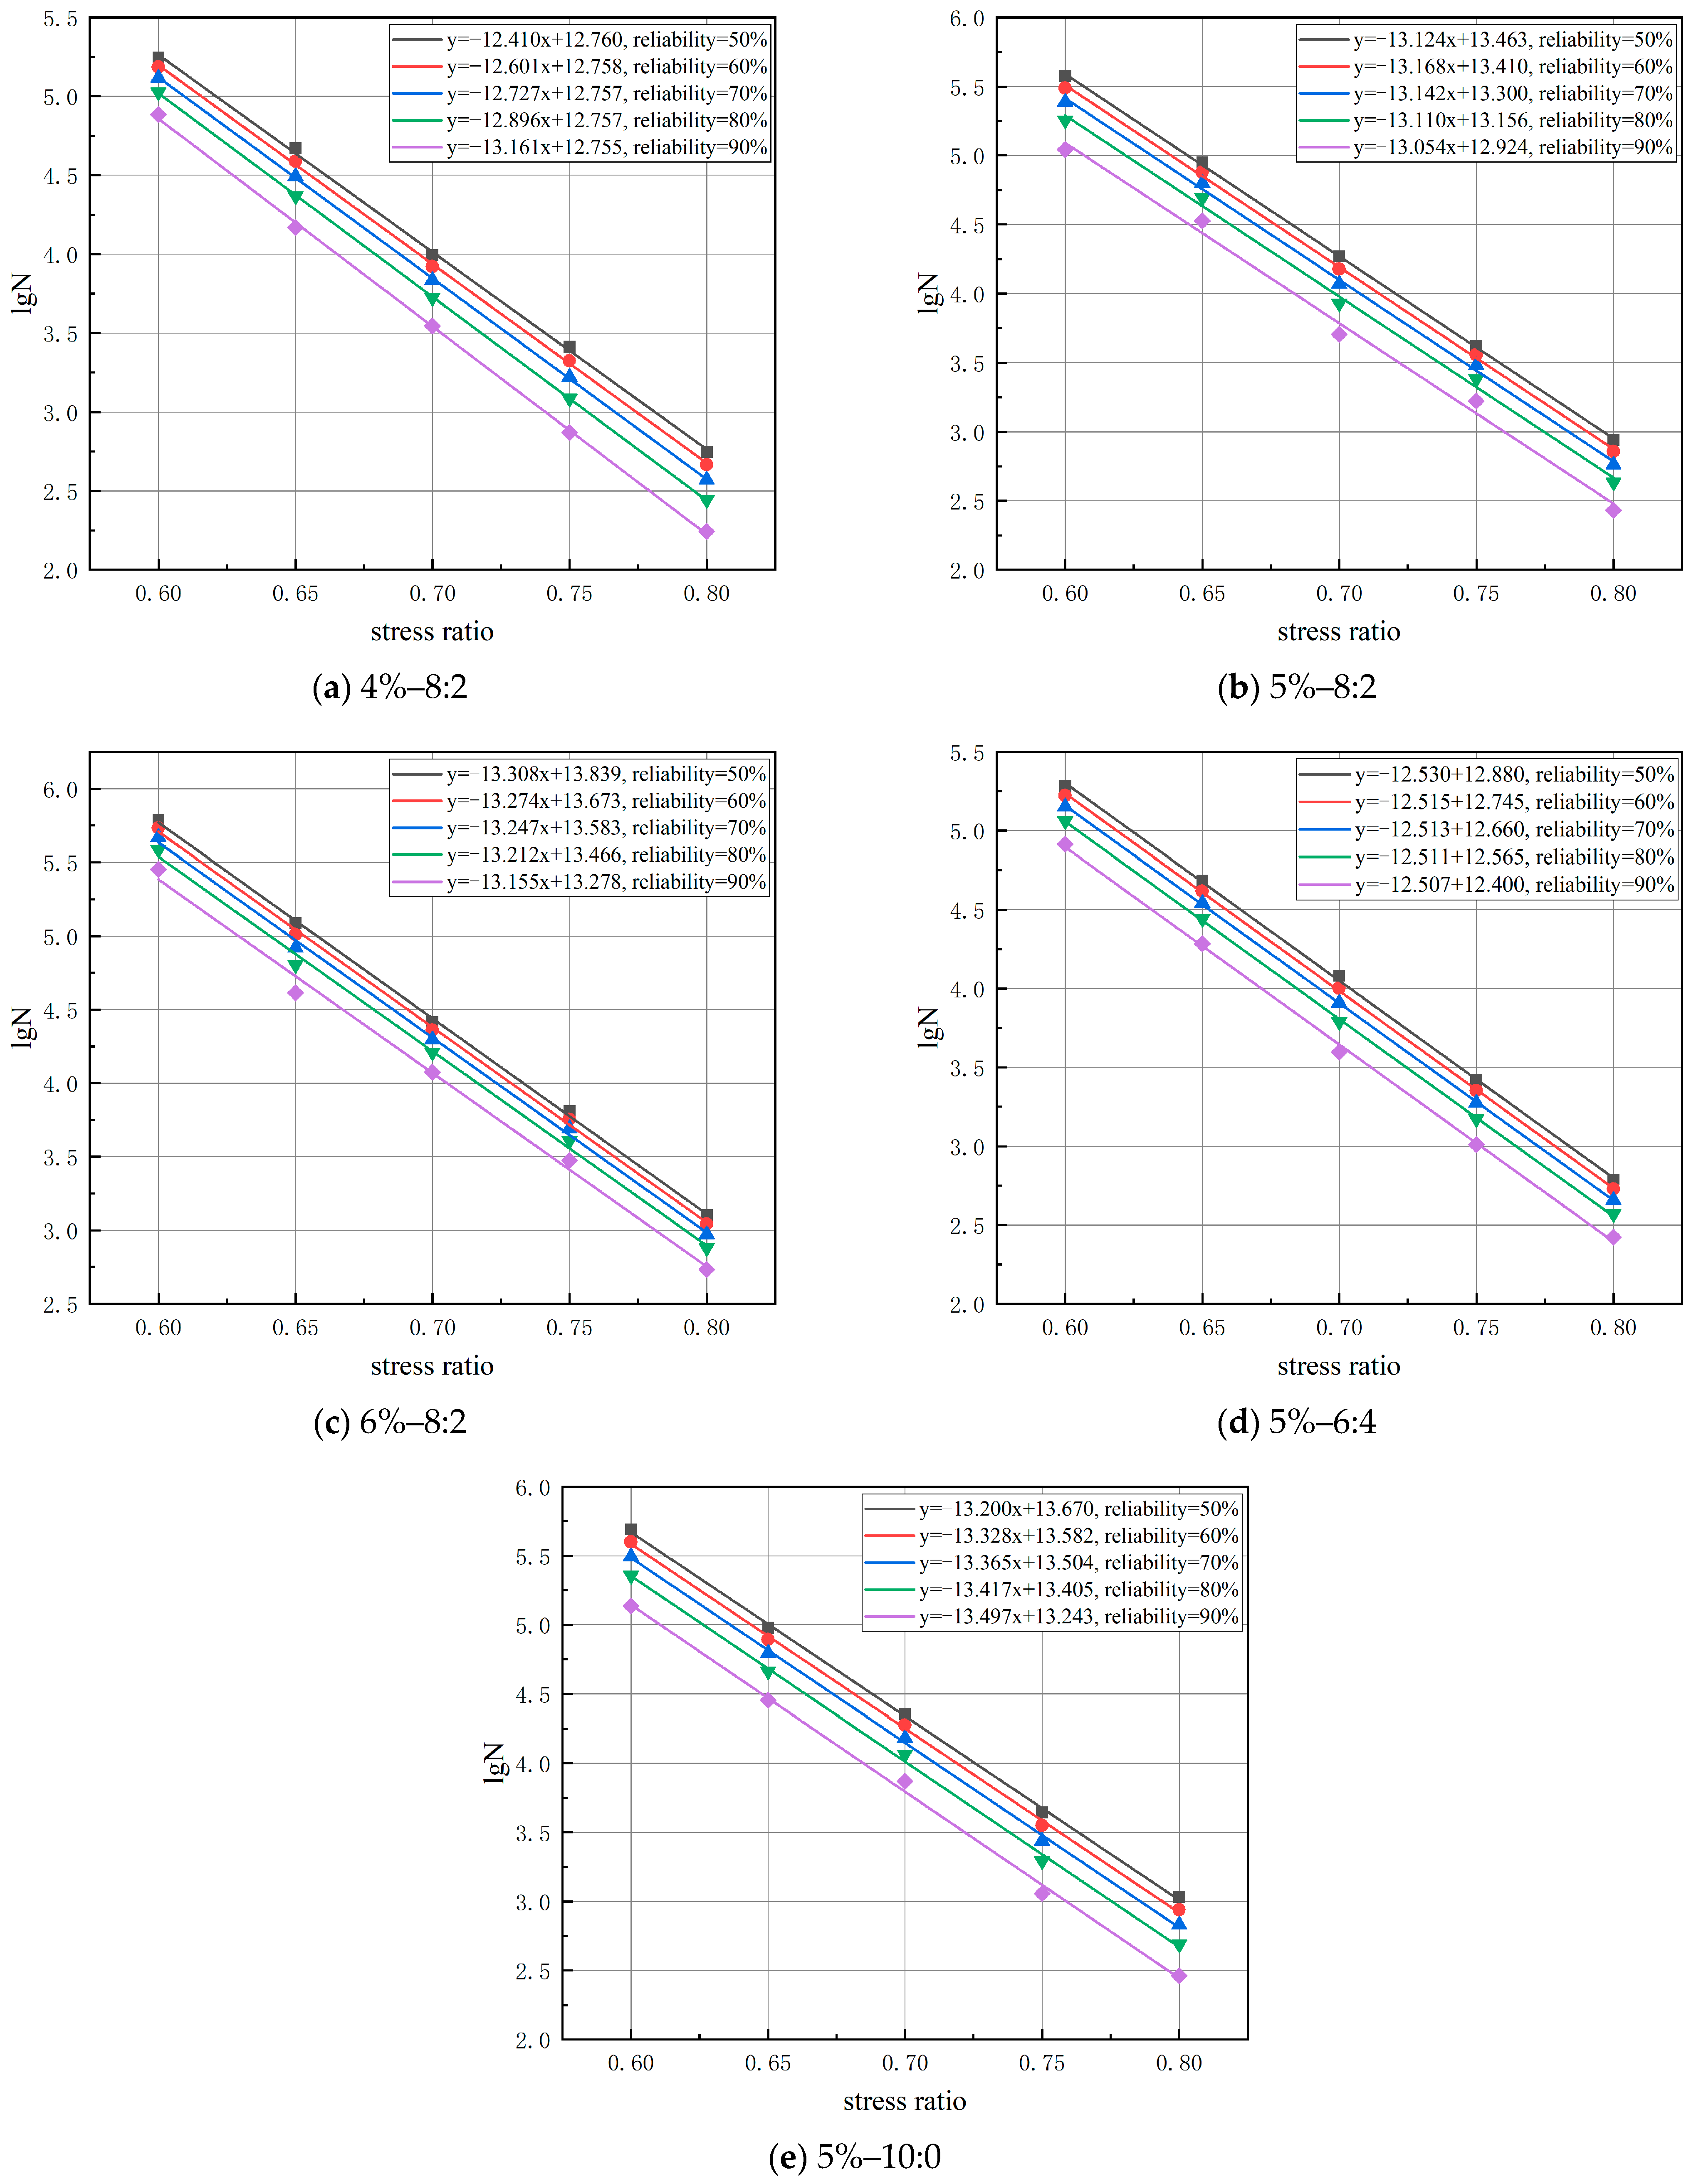
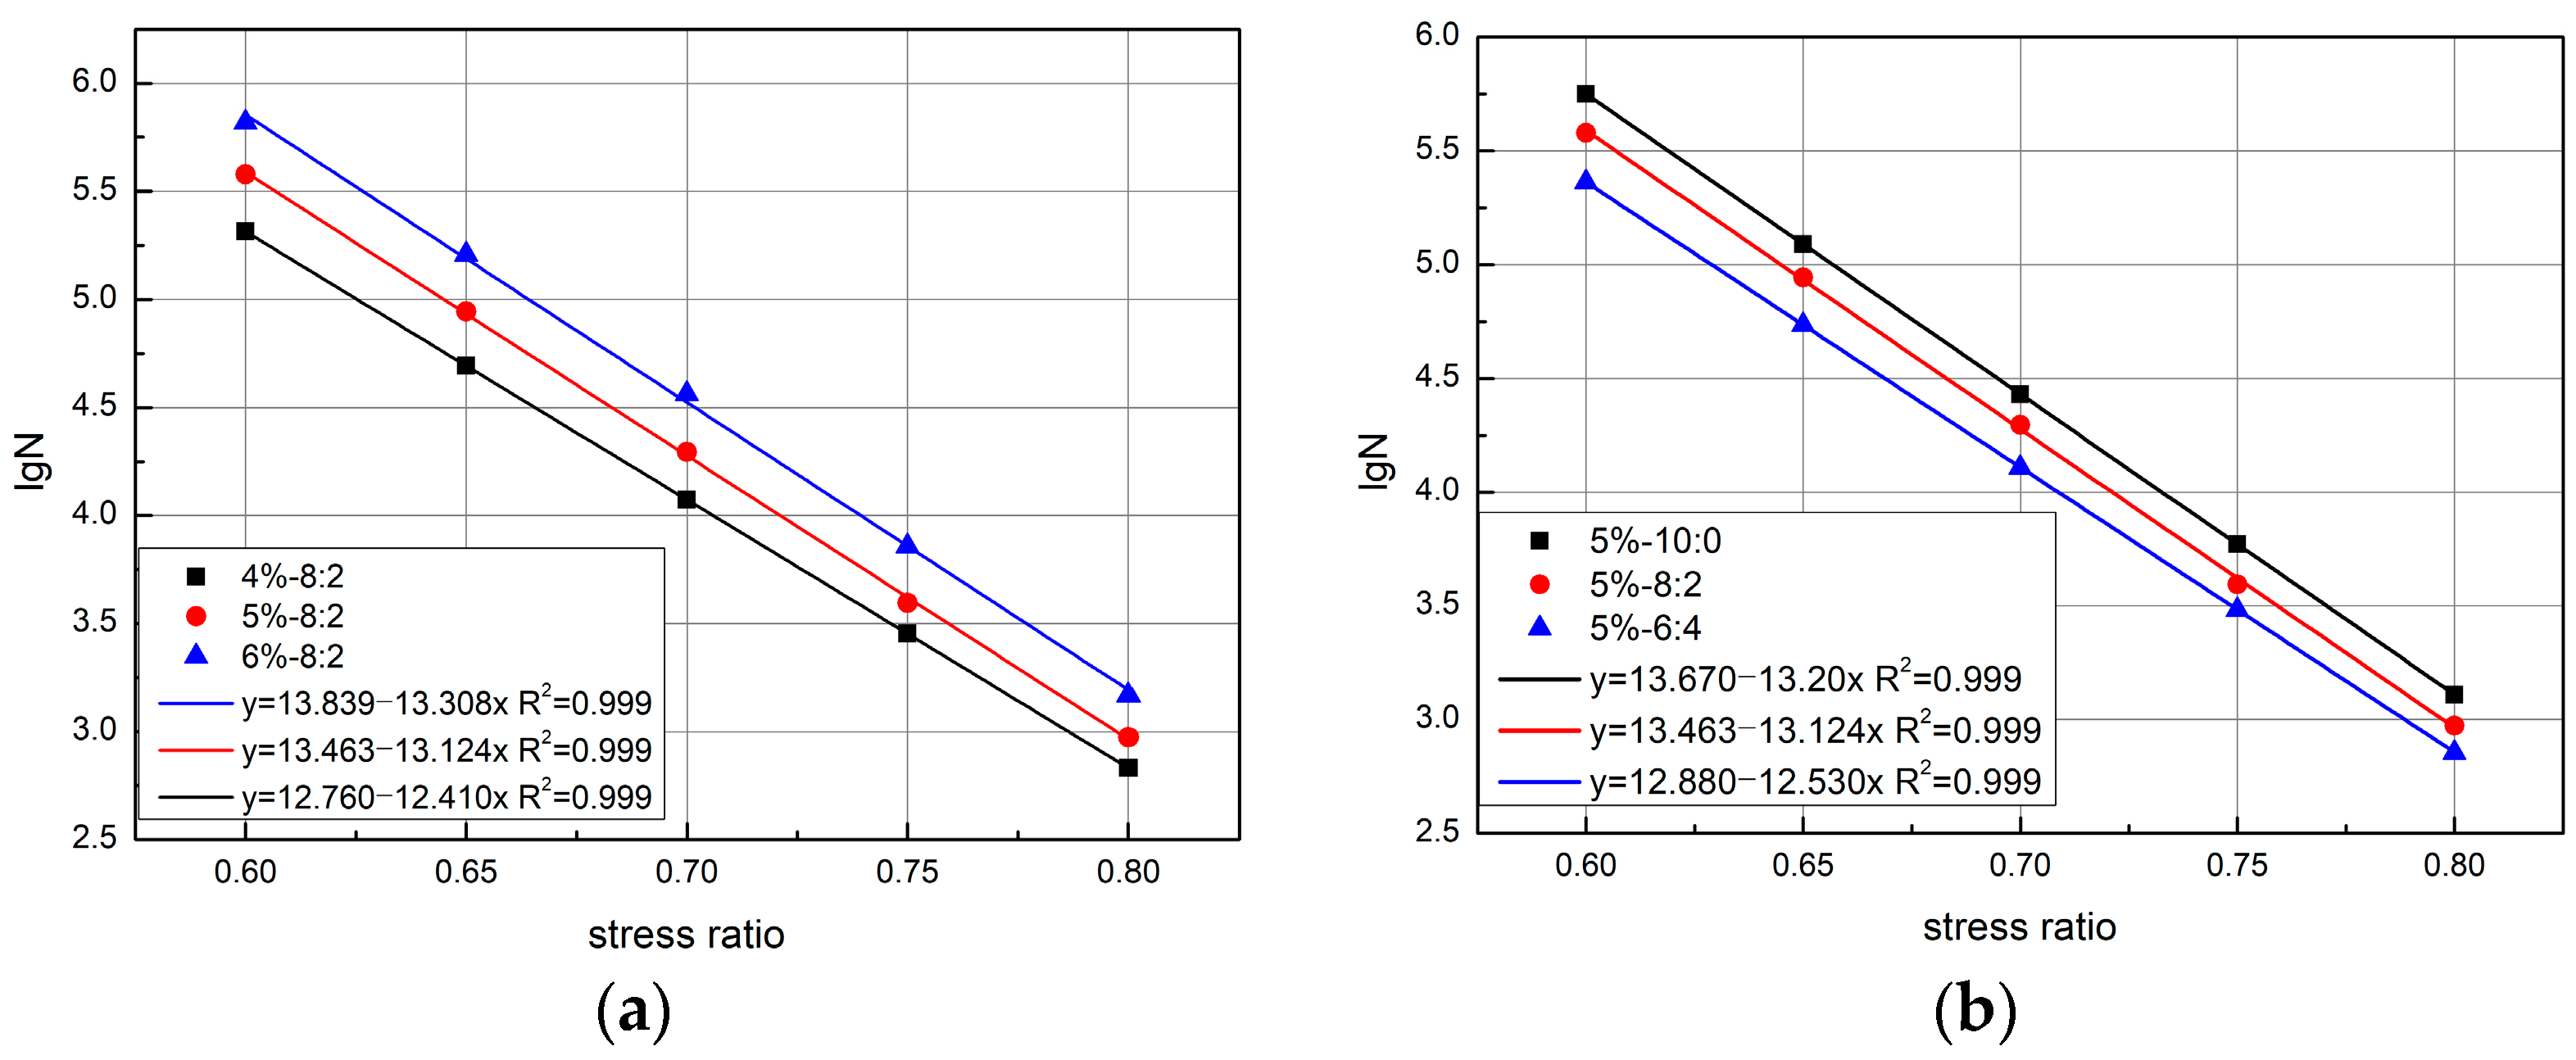
3.3. Fatigue Equation

Using the target fatigue life at a 50% reliability level for each mixture as foundational data, a logarithmic transformation of stress levels and fatigue life values was conducted following Equation (12) for linear regression analysis. This process resulted in the fitting of stress–fatigue equations, as shown in Figure 8, and the determination of equation coefficients, as detailed in Table 8.
As shown in Figure 8 and Table 8, with an escalation in cement contents and base-to-surface ratios, the stress–fatigue curves manifested higher positions, signifying an enhanced fatigue resistance of the mixtures. A greater a value corresponded to an elevated fatigue life limit for the cold recycled mixture, and a higher k value indicated heightened sensitivity to variations in stress levels. This phenomenon can be ascribed to the augmented cement content resulting in a larger volume of hydration products and a denser mixture. The increased contact surface between aggregates and hardened mortar amplified the fatigue performance of the base mixture. Nevertheless, it concurrently raised the stiffness of the mixture, rendering it more susceptible to variations in stress levels.
Furthermore, an increase in the RAP content led to a decrease in both the a and k values. This phenomenon can be attributed to the presence of numerous original microcracks and voids between RAP and the hardened mortar, which expedited the generation and propagation of cracks in the cold recycled mixture under cyclic loading. In contrast, RIA exhibited higher strength and, during the specimen molding process, to some extent, could hinder the development of internal microcracks, thereby decelerating the rate of fatigue cumulative damage and consequently extending the fatigue life of the cold recycled mixture. Simultaneously, the flexible cushioning effect of RAP reduced the sensitivity of the cold recycled mixture to stress.
We compared the fatigue equation parameters of cold recycled mixtures with the recommended fatigue failure model parameters for inorganic-binder-stabilized layers in the current Chinese specifications for the design of highway asphalt pavement. When we did sp, it was evident that, in terms of fatigue performance, the mixture with a 4% cement content, as well as the one with a 5% cement content and a low base-to-surface ratio, met the requirements for inorganic-binder-stabilized soil. Additionally, the mixture with a 5% cement content and a high base-to-surface ratio, along with the one with a 6% cement content, satisfied the requirements for inorganic-binder-stabilized granular materials.

4. Conclusions

In this study, we explored the fatigue performance of FDR-PC. Small-sample fatigue tests were conducted on FDR-PC cold recycled mixtures produced using the heavy compaction method, and a fatigue equation following the Weibull distribution was formulated. The research results lead us to draw the following conclusions:
(1)
The fatigue life of cement-stabilized cold recycled mixtures adheres to a Weibull distribution, with correlation coefficients R 2 consistently surpassing 0.88.
(2)
As the cement content and base-to-surface ratio increase, the fatigue life of the mixture extends, though with an associated increase in stress sensitivity.
(3)
Comparisons with the fatigue equation model parameters for inorganic-binder-stabilized layers in the Chinese specifications for the design of highway asphalt pavement reveal that the mixture with a 4% cement content, and that with a 5% cement content and a low base-to-surface ratio, meet the criteria for inorganic-binder-stabilized soil. Furthermore, the mixture with a 5% cement content and a high base-to-surface ratio, along with that with a 6% cement content, satisfy the specifications for inorganic-binder-stabilized granular materials.

Author Contributions

Conceptualization, J.G. and H.Z.; Data curation, J.G.; Formal analysis, Y.L.; Funding acquisition, Y.L., J.G. and H.Z.; Investigation, L.Z., Y.R. and H.Z.; Methodology, Y.L.; Project administration, J.G.; Software, Y.L. and L.Z.; Supervision, Y.R.; Writing—original draft, Y.R.; Writing—review & editing, H.Z. All authors have read and agreed to the published version of the manuscript.

Funding

This research was funded by Fundamental Research Funds for the Universities (BR230145); the Science and Technology Project of the Department of Transport of the Inner Mongolia Autonomous Region (NJ-2020-13); the Pingdingshan Major Science and Technology Project (2021ZD07); and the China Postdoctoral Science Foundation (2022M710545).

Institutional Review Board Statement

Not applicable.

Informed Consent Statement

Not applicable.

Data Availability Statement

The data presented in this study are available on request from the corresponding author.

Conflicts of Interest

The authors declare no conflicts of interest.

References

  1. Al-Khafaji, R.; Dulaimi, A.; Jafer, H.; Mashaan, N.S.; Qaidi, S.; Obaid, Z.S.; Jwaida, Z. Stabilization of Soft Soil by a Sustainable Binder Comprises Ground Granulated Blast Slag (GGBS) and Cement Kiln Dust (CKD). Recycling 2023, 8, 10. [Google Scholar] [CrossRef]
  2. Jaf, D.K.I.; Abdulrahman, P.I.; Mohammed, A.S.; Kurda, R.; Qaidi, S.M.A.; Asteris, P.G. Machine learning techniques and multi-scale models to evaluate the impact of silicon dioxide (SiO2) and calcium oxide (CaO) in fly ash on the compressive strength of green concrete. Constr. Build. Mater. 2023, 400, 132604. [Google Scholar]
  3. Fedrigo, W.; Nunez, W.P.; Visser, A.T. A review of full-depth reclamation of pavements with Portland cement: Brazil and abroad. Constr. Build. Mater. 2020, 262, 120540. [Google Scholar] [CrossRef]
  4. Jasienski, A.; Rens, L. In situ recycling with cement-the Belgian experience. In Proceedings of the Seminar on Road Pavement Recycling, Warsaw, Poland, 10–11 October 2002. [Google Scholar]
  5. Reeder, G.D.; Harrington, D.S.; Ayers, M.E.; Adaska, W. Guide to Full-Depth Reclamation (FDR) with Cement (No. SR1006P); National Concrete Pavement Technology Center: Ames, IA, USA, 2017. [Google Scholar]
  6. Jallu, M.; Arulrajah, A.; Saride, S.; Evans, R. Flexural fatigue behavior of fly ash geopolymer stabilized-geogrid reinforced RAP bases. Constr. Build. Mater. 2020, 254, 119263. [Google Scholar] [CrossRef]
  7. Saride, S.; Jallu, M. Effect of fly ash geopolymer on layer coefficients of reclaimed asphalt pavement bases. J. Transp. Eng. Part B Pavements 2020, 146, 04020033. [Google Scholar] [CrossRef]
  8. Portland Cement Association (PCA). Guide to Full Depth Reclamation (FDR) with Cement; Portland Cement Association (PCA): Skokie, IL, USA, 2005. [Google Scholar]
  9. Spanish Institute of Cement and its Applications. Pavement In Situ Recycling with Cement: Technical Guide; Spanish Institute of Cement and its Applications: Madrid, Spain, 2013. [Google Scholar]
  10. Wirtgen. Wirtgen Cold Recycling Technology; Wirtgen: Windhagen, Germany, 2012. [Google Scholar]
  11. South African National Roads Agency Limited (SANRAL). South African Pavement Engineering Manual; SANRAL: Pretoria, South Africa, 2014. [Google Scholar]
  12. Austroads. Mix Design for Stabilized Pavement Materials; Austroads Publication: Sydney, Australia, 2002. [Google Scholar]
  13. Franco, F.A.C.P. Mechanistic-Empirical Asphalt Pavement Design Method; Federal University of Rio de Janeiro: Rio de Janeiro, Brazil, 2007. [Google Scholar]
  14. Jiang, Y.; Liu, H.; Xue, J. Fatigue performance of vertical vibration compacted cement-stabilized recycled pavement materials. J. Test. Eval. 2018, 46, 2251–2264. [Google Scholar] [CrossRef]
  15. López, M.A.C.; Fedrigo, W.; Kleinert, T.R.; Matuella, M.F.; Núñez, W.P.; Ceratti, J.A.P. Flexural fatigue evaluation of cement-treated mixtures of reclaimed asphalt pavement and crushed aggregates. Constr. Build. Mater. 2018, 158, 320–325. [Google Scholar] [CrossRef]
  16. Guthrie, W.S.; Brown, A.V.; Eggett, D.L. Cement stabilization of aggregate base material blended with reclaimed asphalt pavement. Transp. Res. Rec. 2007, 2026, 47–53. [Google Scholar] [CrossRef]
  17. Yuan, D.; Nazarian, S.; Hoyos, L.R.; Puppala, A.J. Evaluation and mix design of cement-treated base materials with high content of reclaimed asphalt pavement. Transp. Res. Rec. 2011, 2212, 110–119. [Google Scholar] [CrossRef]
  18. Dixon, P.A.; Guthrie, W.S.; Eggett, D.L. Factors affecting strength of road base stabilized with cement slurry or dry cement in conjunction with full-depth reclamation. Transp. Res. Rec. 2012, 2310, 113–120. [Google Scholar] [CrossRef]
  19. Fedrigo, W.; Núñez, W.P.; Kleinert, T.R.; Matuella, M.F.; Ceratti, J.A.P. Strength, shrinkage, erodibility and capillary flow characteristics of cement-treated recycled pavement materials. Int. J. Pavement Res. Technol. 2017, 10, 393–402. [Google Scholar] [CrossRef]
  20. Syed, I.M. Full-Depth Reclamation with Portland Cement: A Study of Long-Term Performance; Portland Cement Association: Washington, DC, USA, 2007. [Google Scholar]
  21. Jiang, Y.; Cao, F.; Chen, Z.; Fang, J. Fatigue performance and application of cement stabilized macadam shaped with vertical vibration test method. J. Chang. Univ. 2014, 34, 1–6. [Google Scholar]
  22. Osgood, C.C. Fatigue Design: International Series on the Strength and Fracture of Materials and Structures; Elsevier: Amsterdam, The Netherlands, 2013. [Google Scholar]
  23. Smith, R.L. Weibull regression models for reliability data. Reliab. Eng. Syst. Saf. 1991, 34, 55–76. [Google Scholar] [CrossRef]
  24. Enkhmunkh, N.; Kim, G.W.; Hwang, K.J.; Hyun, S.H. A parameter estimation of Weibull distribution for reliability assessment with limited failure data. In Proceedings of the International Forum on Strategic Technology, Ulaanbaatar, Mongolia, 3–6 October 2007; pp. 39–42. [Google Scholar]
  25. Guo, X.; Qiao, H.; Zhu, B.; Wang, P.; Wen, S. Accelerated life testing of concrete based on three-parameter Weibull stochastic approach. KSCE J. Civ. Eng. 2019, 23, 1682–1690. [Google Scholar] [CrossRef]
  26. Wang, C.; Fu, P.; Liu, Z.; Xu, Z.; Wen, T.; Zhu, Y.; Jiang, J. Study of the Durability Damage of Ultrahigh Toughness Fiber Concrete Based on Grayscale Prediction and the Weibull Model. Buildings 2022, 12, 746. [Google Scholar] [CrossRef]
  27. Murali, G.; Santhi, A.S.; Ganesh, G.M. Impact resistance and strength reliability of fiber reinforced concrete using two parameter weibull distribution. J. Eng. Appl. Sci 2014, 9, 554–559. [Google Scholar]
  28. Sun, J.; Yu, J.M.; Zhao, H.S. Two-parameter Weibull distribution theory testing analysis in fatigue life of asphalt mixture. Appl. Mech. Mater. 2011, 97, 45–48. [Google Scholar]
  29. Zhu, Z.; Zhang, C.; Meng, S.; Shi, Z.; Tao, S.; Zhu, D. A statistical damage constitutive model based on the Weibull distribution for alkali-resistant glass fiber reinforced concrete. Materials 2019, 12, 1908. [Google Scholar] [CrossRef]
  30. Research Institute of Highway Ministry of Transport of China. Technical Specifications for Highway Asphalt Pavement Recycling JTG/T 5521—2019; Ministry of Transportation: Beijing, China, 2019. [Google Scholar]
  31. China Building Materials Federation. Test Methods for Water Requirement of Normal Consistency, Setting Time and Soundness of the Portland Cement; Standardization Administration of China: Beijing, China, 2012. [Google Scholar]
  32. China Building Materials Federation. Test method of Cement Mortar Strength (ISO Method); Standardization Administration of China: Beijing, China, 2022. [Google Scholar]
  33. Research Institute of Highway Ministry of Transport of China. Test Methods of Materials Stabilized with Inorganic Binders for Highway Engineering JTG E51-2009; Ministry of Transportation: Beijing, China, 2009. [Google Scholar]
  34. You, F.; Nian, M.; Zheng, J.; Luo, S. Study on flexural fatigue performance of recycled aggregate concrete. J. Build. Struct. 2022, 43, 134. [Google Scholar]
  35. Zhu, X.; Chen, X.; Pan, F. Reliability analysis of fatigue life of self-compacting concrete subjected to freeze-thaw damage. J. Harbin Inst. Technol. 2023, 55, 118. [Google Scholar]
  36. Wang, M.; Yu, Q.; Xiao, Y. Experimental investigation of macro-and meso-scale compaction characteristics of unbound permeable base materials. Chin. J. Rock Mech. Eng. 2022, 41, 1701–1716. [Google Scholar]
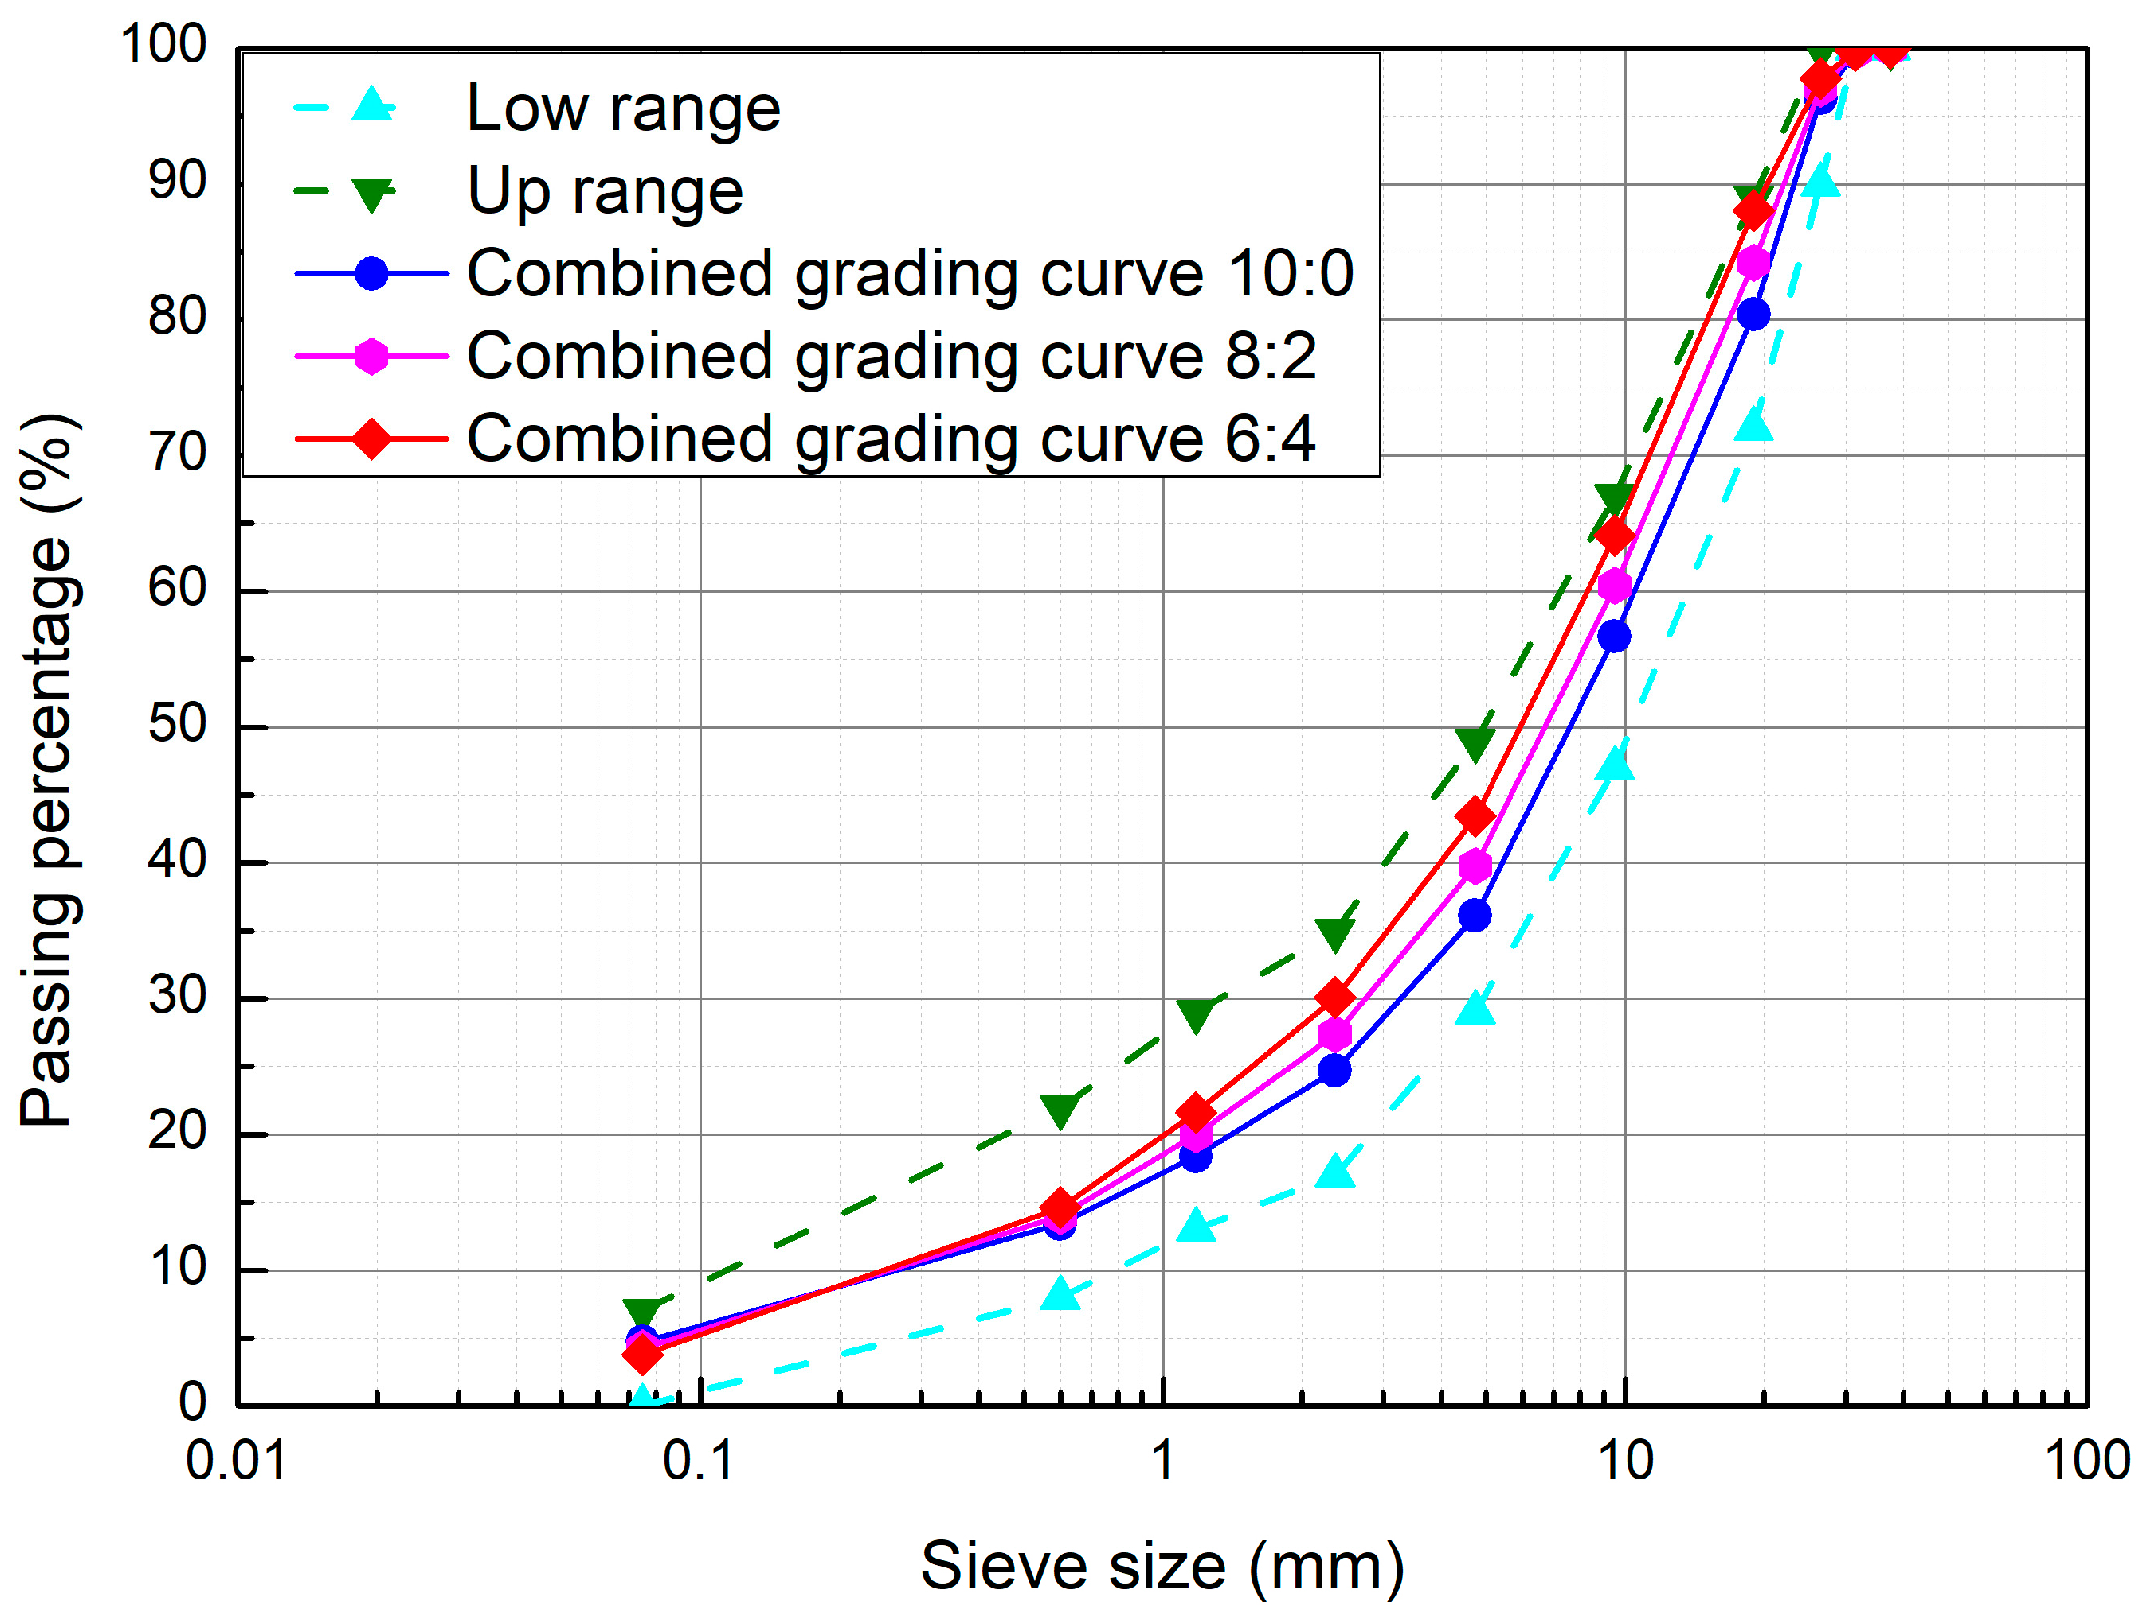
Figure 1. Reclaimed material.
Coatings 14 00437 g001
Figure 2. Synthesized gradation curve of FDR-PC cold recycled mixture, where the base-to-surface ratios are 10:0, 8:2, and 6:4.
Coatings 14 00437 g002
Figure 3. Dry density–water content curves of the full-depth cold recycled mixture. The base-to-surface ratio is 8:2. (a) 4% cement content; (b) 5% cement content; (c) 6% cement content.
Coatings 14 00437 g003
Figure 4. The four-point bending test apparatus.
Coatings 14 00437 g004
Figure 5. Haversine wave loading in fatigue tests.
Coatings 14 00437 g005
Figure 6. Weibull distribution fitting results for cold recycled mixture with 5% cement content and 8:2 base-to-surface ratio. (a) Stress ratio of 0.60; (b) stress ratio of 0.65; (c) stress ratio of 0.70; (d) stress ratio of 0.75; (e) stress ratio of 0.80.
Coatings 14 00437 g006
Figure 7. Fatigue equations for cold recycled mixtures with various cement contents and base-to-surface ratios under different reliability levels. (a) 4%–8:2; (b), 5%–8:2; (c), 6%–8:2; (d), 5%–6:4; (e), 5%–10:0.
Coatings 14 00437 g007
Figure 8. Comparison of fatigue equations for different cold recycled mixtures at a 50% reliability level. (a) Base-to-surface ratio of 8:2 and cement contents of 4%, 5%, and 6%; (b) 5% cement content and base-to-surface ratios of 10:0, 8:2, and 6:4.
Coatings 14 00437 g008
Table 1. Results of screening test.
Sieve Size (mm)37.531.526.5199.54.752.361.180.60.075
RIA Passing Percentage (%)10099.796.380.456.736.124.718.413.44.7
RAP Passing Percentage (%)10010010099.575.354.438.126.416.42.4
Table 2. Technical indicators of cement.
Testing ItemTechnical IndicatorTesting ResultTesting Method
Setting Time (min)Initial Setting≥180218GB/T 1346-2011 [31]
Final Setting≤600385
Flexural Strength (MPa)3 d≥3.53.8GB/T 17671-2021 [32]
28 d≥6.510.6
Compressive Strength (MPa)3 d≥17.019.9
28 d≥42.545.5
Table 3. The optimum water contents and the maximum dry densities of specimens fabricated with the five different cement content and base-to-surface ratio combinations.
Cement Content (%)Base-to-Surface RatioOptimal Water Content (%)Maximum Dry Density (g/cm3)
48:25.92.242
58:26.62.246
68:26.82.240
510:07.12.236
56:46.22.250
Table 4. Loading schemes for FDR-PC cold recycled mixtures in fatigue tests.
Cement Content (%)Base-to-Surface RatioFlexural Strength (MPa)Stress RatioMaximum Load (N)Minimum Load (N)
510:01.430.62850285
0.654000400
0.73350335
0.753575358
0.83800380
8:21.270.62540250
0.652750275
0.73000300
0.753175320
0.83400340
6:41.070.62150215
0.652300230
0.72500250
0.752675270
0.82850285
48:20.870.61740170
0.651885190
0.72030200
0.752175220
0.82320230
68:21.490.63000300
0.653250320
0.73500350
0.753725370
0.84000400
Table 5. The fatigue test results for various mixtures under different stress ratios.
Base-to-
Surface
Ratio
Cement
Content
(%)
Stress
Ratio
Fatigue Life ValuesSDCOV/%
1#2#3#4#5#6#
8:240.6097,095130,489145,949177,206230,677292,03326,66914.9
0.6517,47034,99338,37757,75971,10674,847839417.1
0.7044656265909911,26212,81517,716178017.3
0.759831422258731863670479453019.1
0.80243320478662839102711419.1
50.60126,789248,973362,436468,513472,845597,93163,58316.8
0.6535,89368,72574,32192,574115,932115,93211,49213.7
0.704643943115,23927,54330,18631,267427321.7
0.758541653376449715642668085421.7
0.803127768949911123154515116.1
60.60360,646446,615511,095688,262733,906994,36286,10913.8
0.6561,50887,74889,413111,783180,187241,17825,45319.8
0.7014,92118,54022,58928,54532,36642,181371614.0
0.7537974242595676248113938283112.7
0.80683919109312721695211719715.2
6:450.6093,195157,369167,242238,183224,717290,62426,05713.3
0.6524,19131,92343,58652,72571,60373,830759215.3
0.705282683811,42315,61815,96820,472217717.3
0.7514681585228227383980412342815.9
0.803434135845988299879114.6
10:050.60232,001220,989530,616520,816688,984930,967101,36719.5
0.6539,81575,56580,04077,894130,942204,82221,75521.4
0.70922314,50823,22923,13432,32440,851429118.0
0.751889247634474309623211,100126525.8
0.8041672373311731877210825521.8
Table 6. The Weibull distribution fitting equations and R 2 for all fatigue test groups under different stress ratios.
Base-to-Surface RatioCement ContentStress RatioαβR2
8:24%0.602.27227.8010.972
0.651.63317.9270.956
0.701.82917.1800.992
0.751.50412.1900.975
0.801.62410.6440.983
5%0.601.58020.5860.936
0.651.89521.8780.961
0.701.16011.7030.929
0.751.1049.3680.929
0.801.61011.3280.882
6%0.602.43732.8390.964
0.651.73120.6440.910
0.702.39124.6840.983
0.752.44521.8090.954
0.802.21516.1920.981
6:45%0.602.21127.2620.942
0.652.04222.3860.977
0.701.69416.2840.959
0.752.00716.1620.931
0.802.25114.8130.964
10:05%0.601.47719.7180.881
0.651.55918.2440.893
0.701.67917.2110.978
0.751.38812.0150.939
0.801.43310.3750.950
Table 7. The expected fatigue life was calculated based on Weibull distribution equations for all fatigue test groups.
Base-to-Surface RatioCement ContentStress RatioFatigue Life at Different Reliability Levels
50%60%70%80%90%
8:24%0.60 175,202153,180130,782106,39176,467
0.65 46,79738,81931,15423,37614,764
0.70 98448331684552963513
0.75 2594211716671221741
0.80 560464372278175
5%0.60 361,184307,807237,192179,848109,626
0.65 103,27275,93359,94049,56731,495
0.70 24,07215,092989885133459
0.75 4844360719042404631
0.80 1137721599431281
6%0.60 613,265541,064466,903385,153283,062
0.65 122,276102,51083,30063,52941,181
0.70 26,08222,95619,75416,23611,863
0.75 64435687491040522981
0.80 12661103938759541
6:45%0.60 192,173167,391142,287115,08781,960
0.65 48,28541,58034,87227,71519,190
0.70 12,02610,044812561603956
0.75 26202250188214891024
0.80 613535456370265
10:05%0.60 489,591398,191312,230227,286136,749
0.65 95,22978,30162,19146,03728,452
0.70 22,70018,92815,28311,5597394
0.75 44223549273919531137
0.80 1078871678488289
Table 8. Fatigue equations for cold recycled mixtures with varying base-to-surface ratios and cement contents under a 50% reliability level.
Cement ContentBase-to-Surface Ratiolg N = a/S
akR2
5%10:013.67013.2000.999
8:213.46313.1240.999
6:412.88012.5300.999
4%8:212.76012.4100.999
6%8:213.83913.3080.999
Recommended by RegulationsInorganic-Binder-Stabilized Granular Material13.2412.52/
Inorganic-Binder-Stabilized Soil12.1812.79/
Disclaimer/Publisher’s Note: The statements, opinions and data contained in all publications are solely those of the individual author(s) and contributor(s) and not of MDPI and/or the editor(s). MDPI and/or the editor(s) disclaim responsibility for any injury to people or property resulting from any ideas, methods, instructions or products referred to in the content.

