

Simulation of TiN/Ti Multilayer Coating under the Impact of Multiple Particles Based on Cohesive Element


Abstract
1. Introduction
2. Finite Element Model
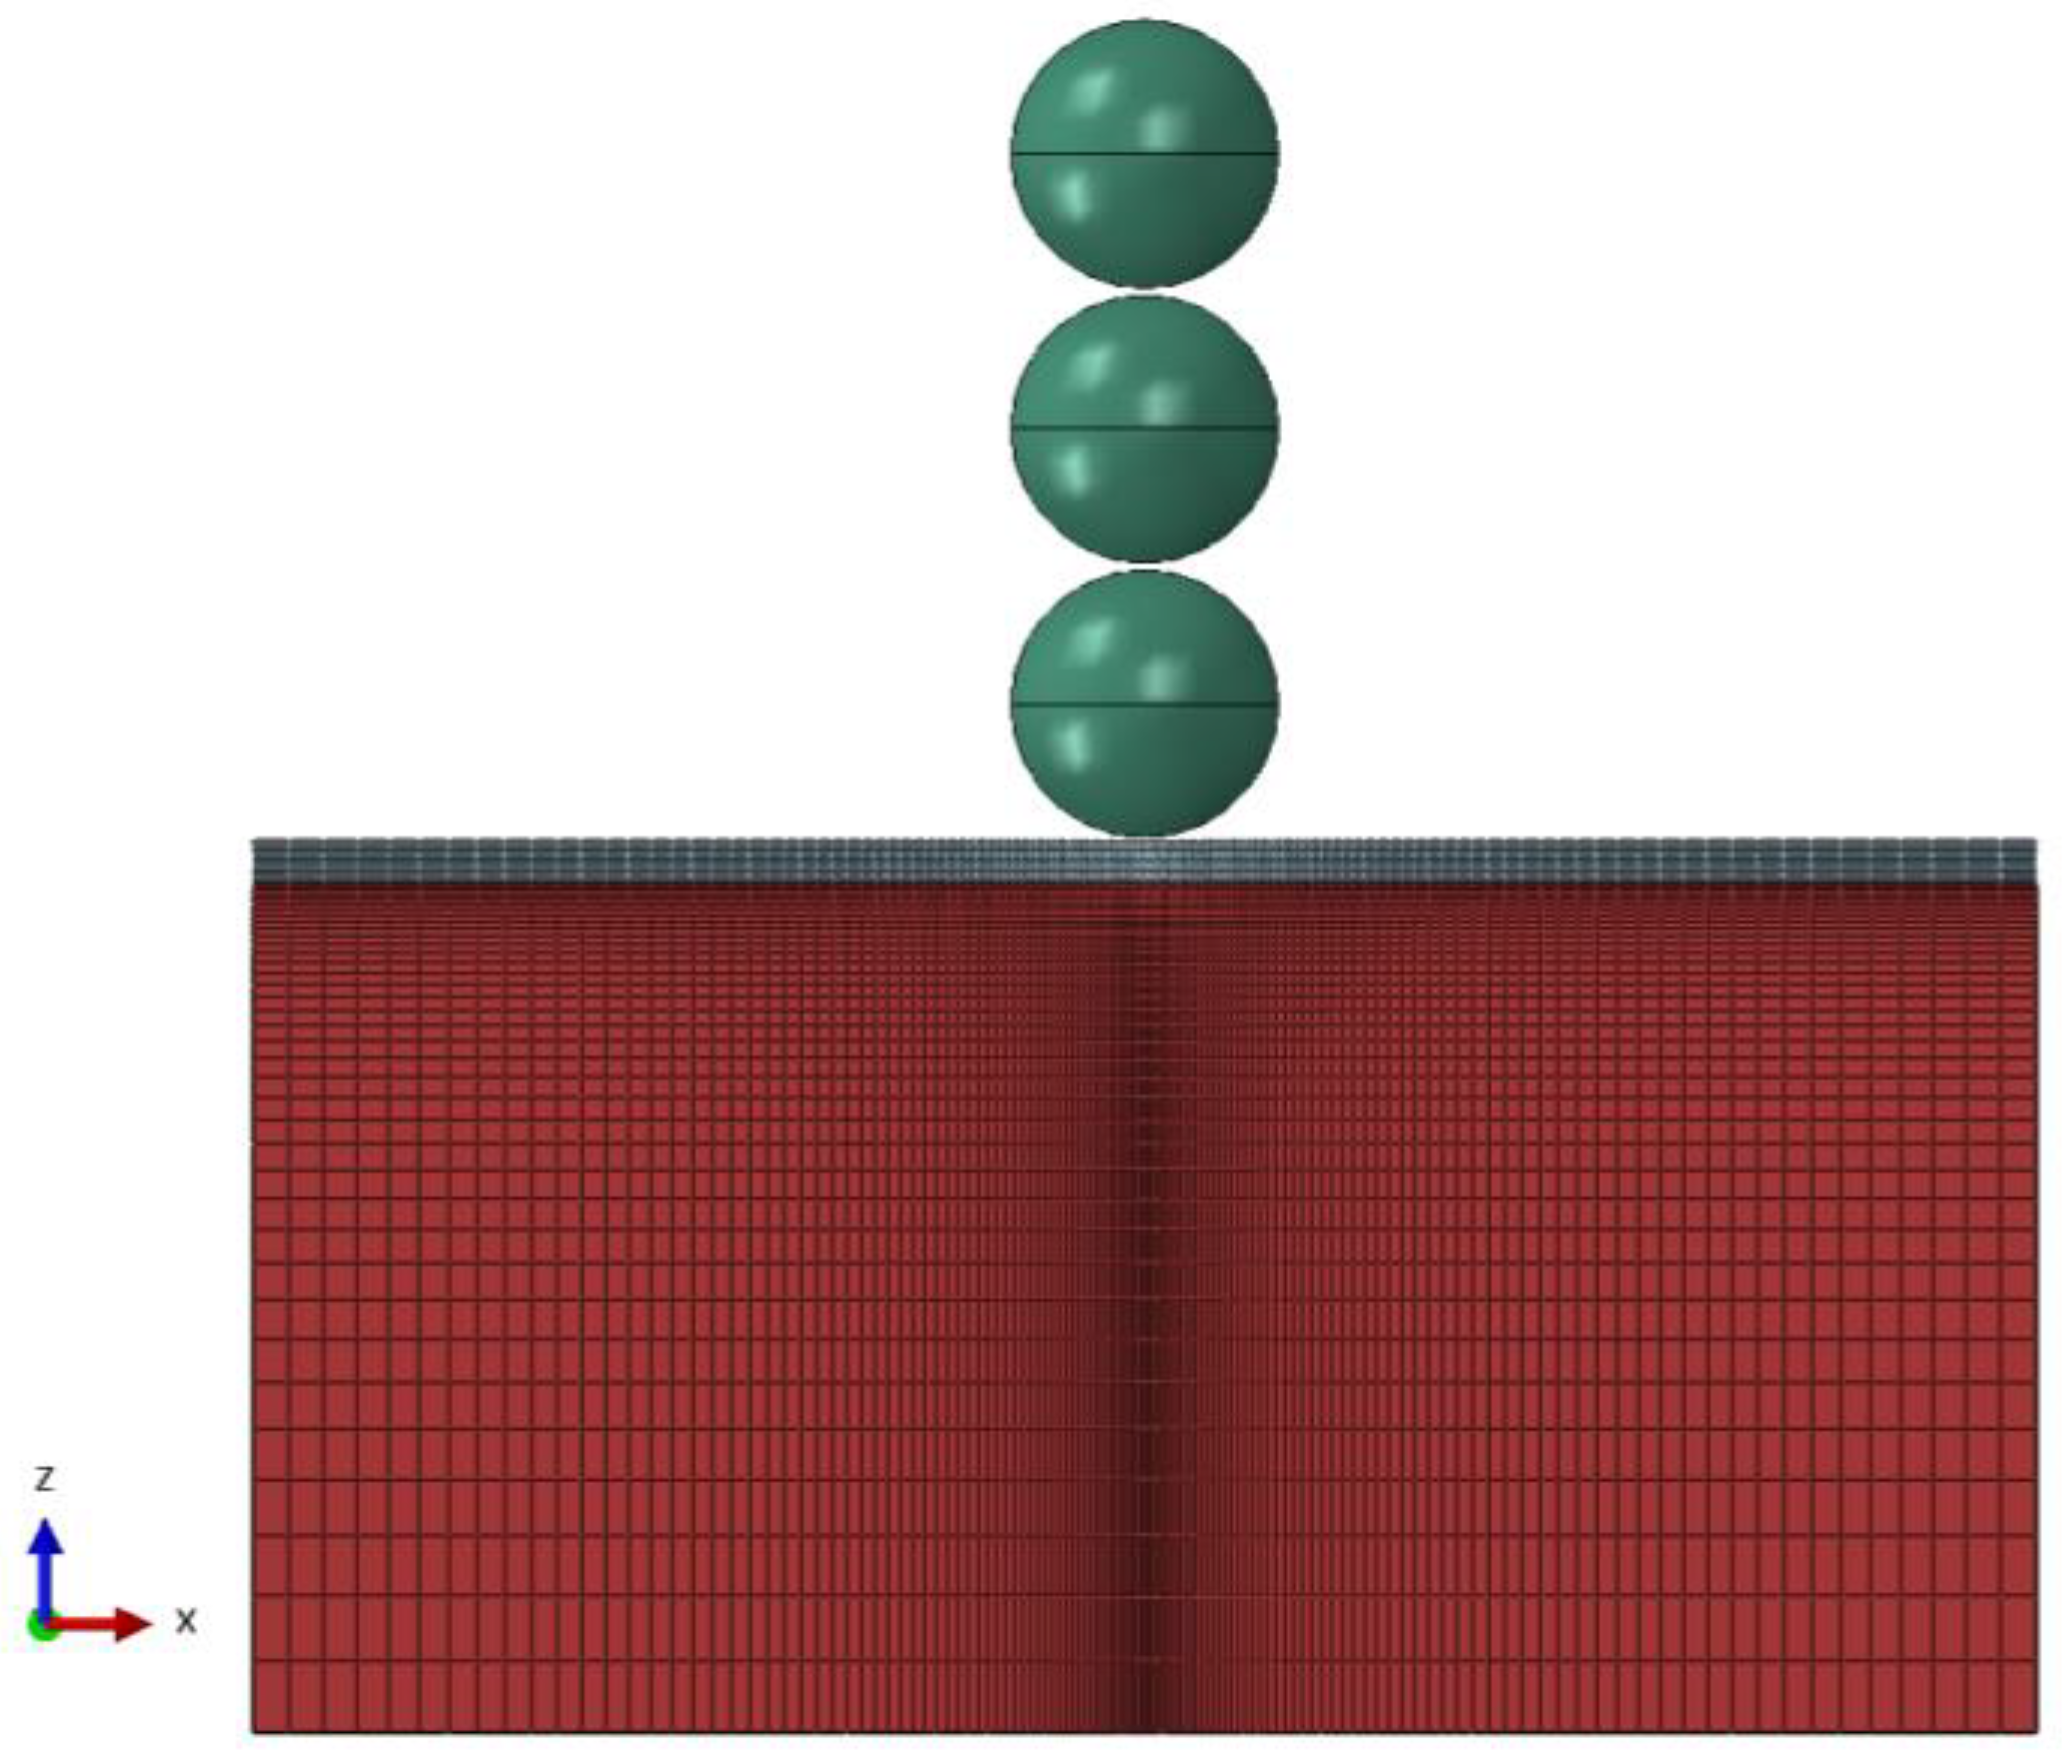
2.1. Establishment of Geometric Models
2.2. Material Property Settings
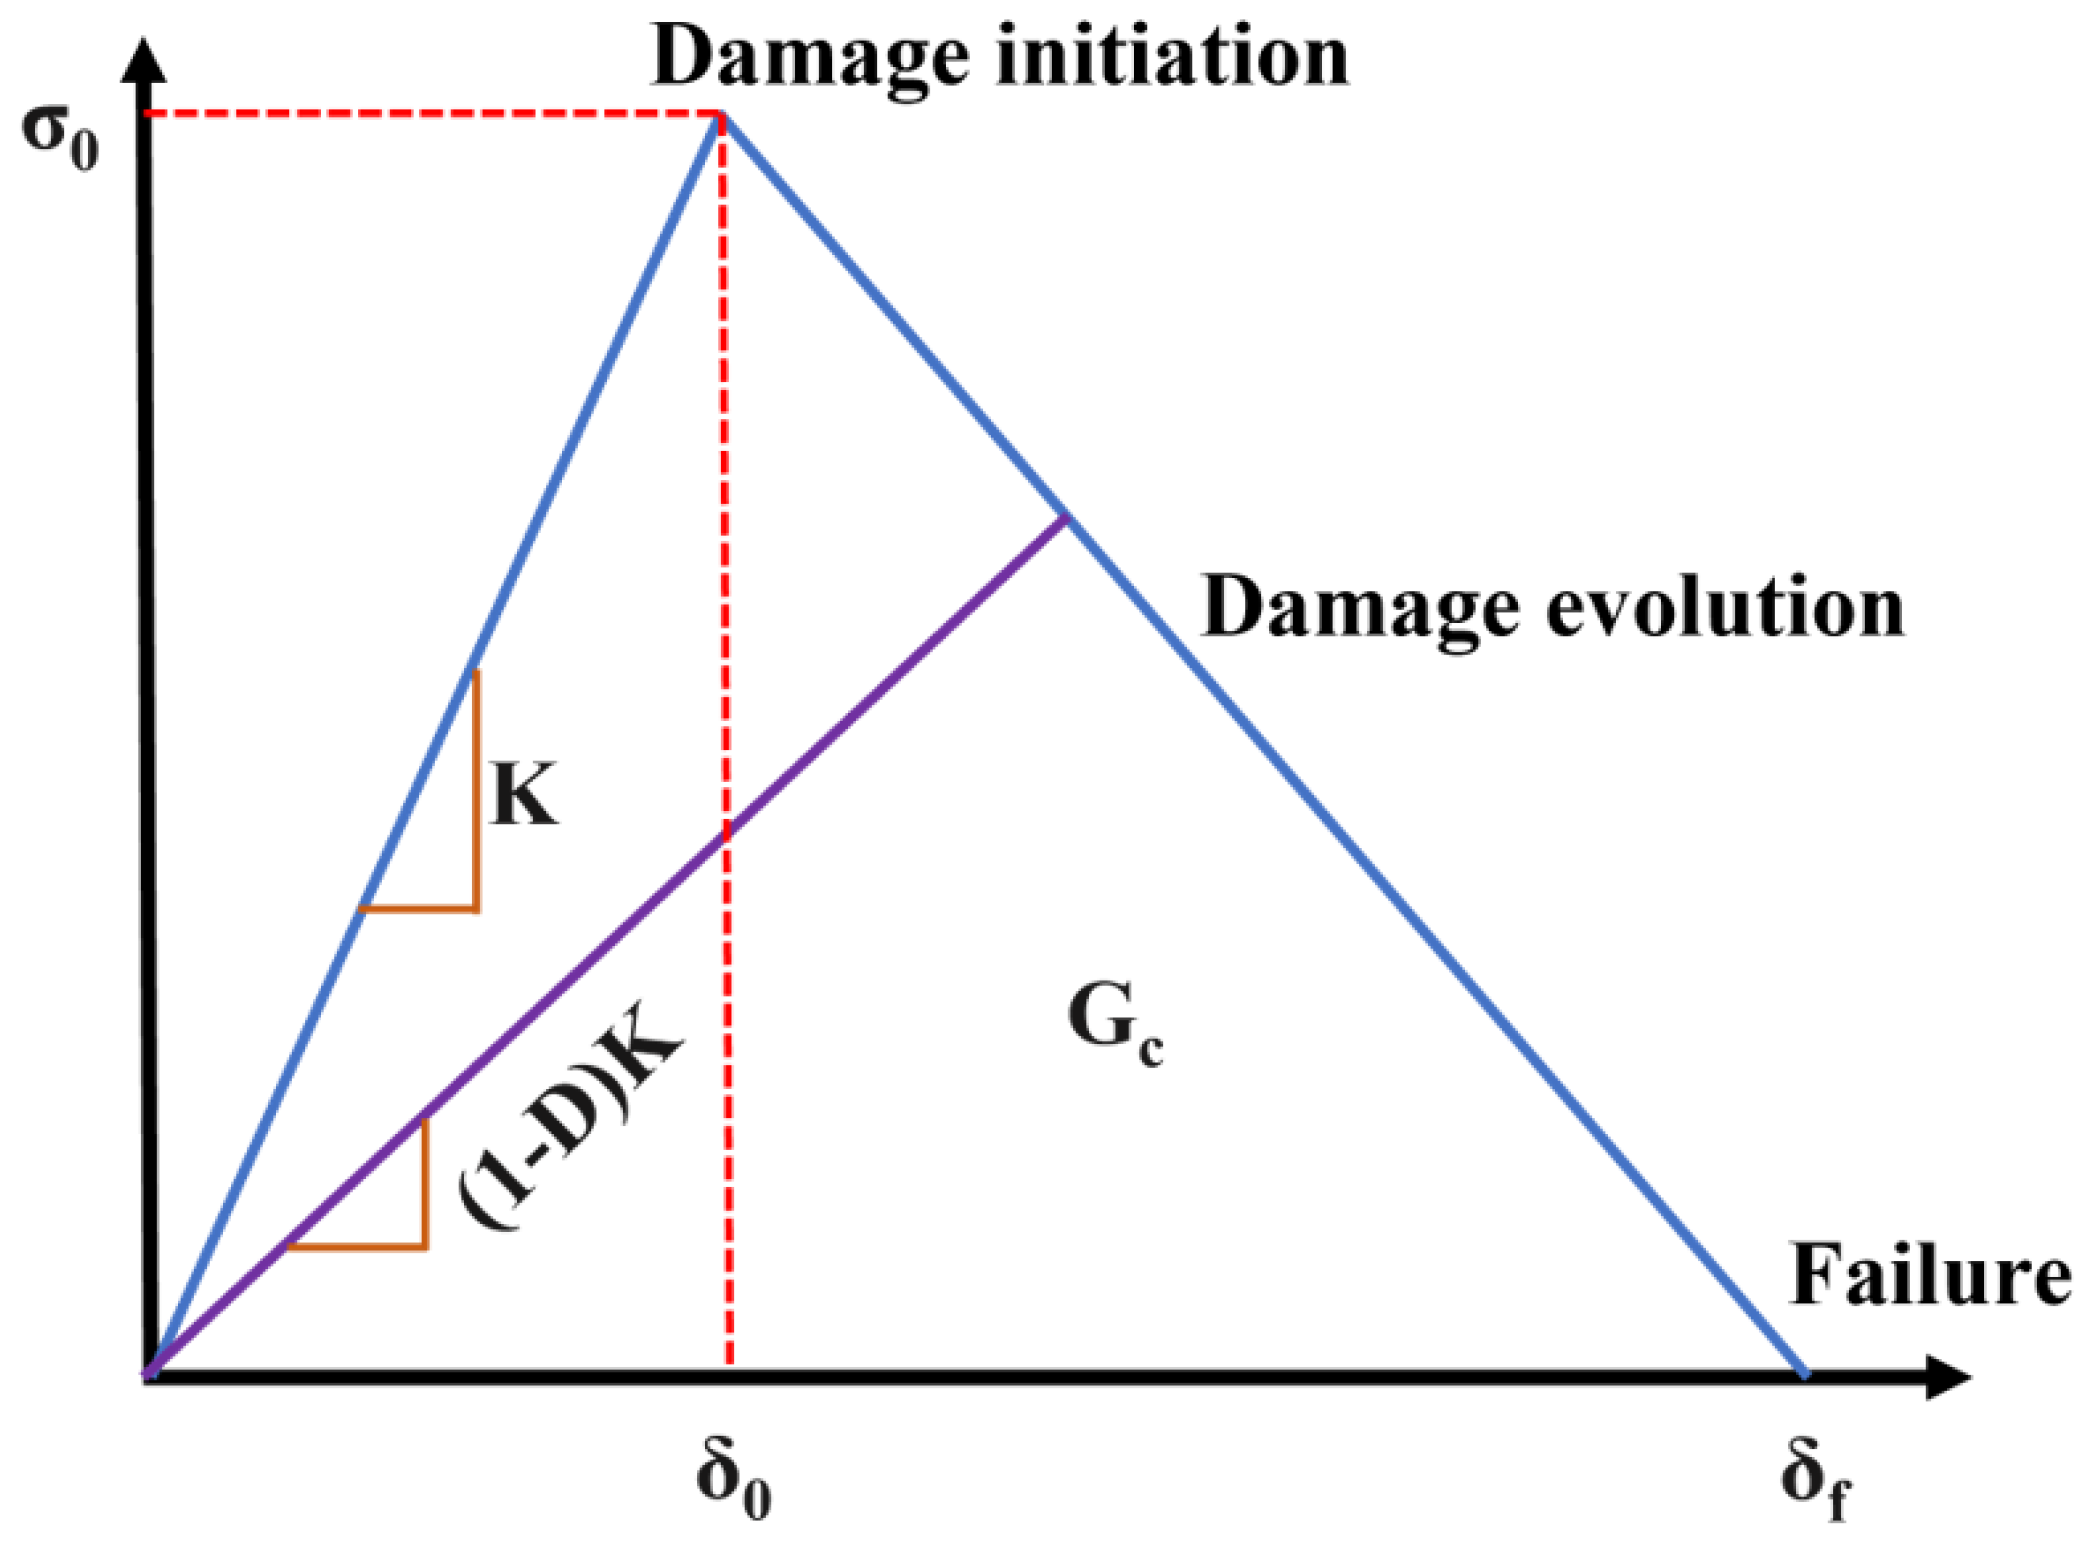
2.3. Cohesive Zone Model
3. Results and Discussion
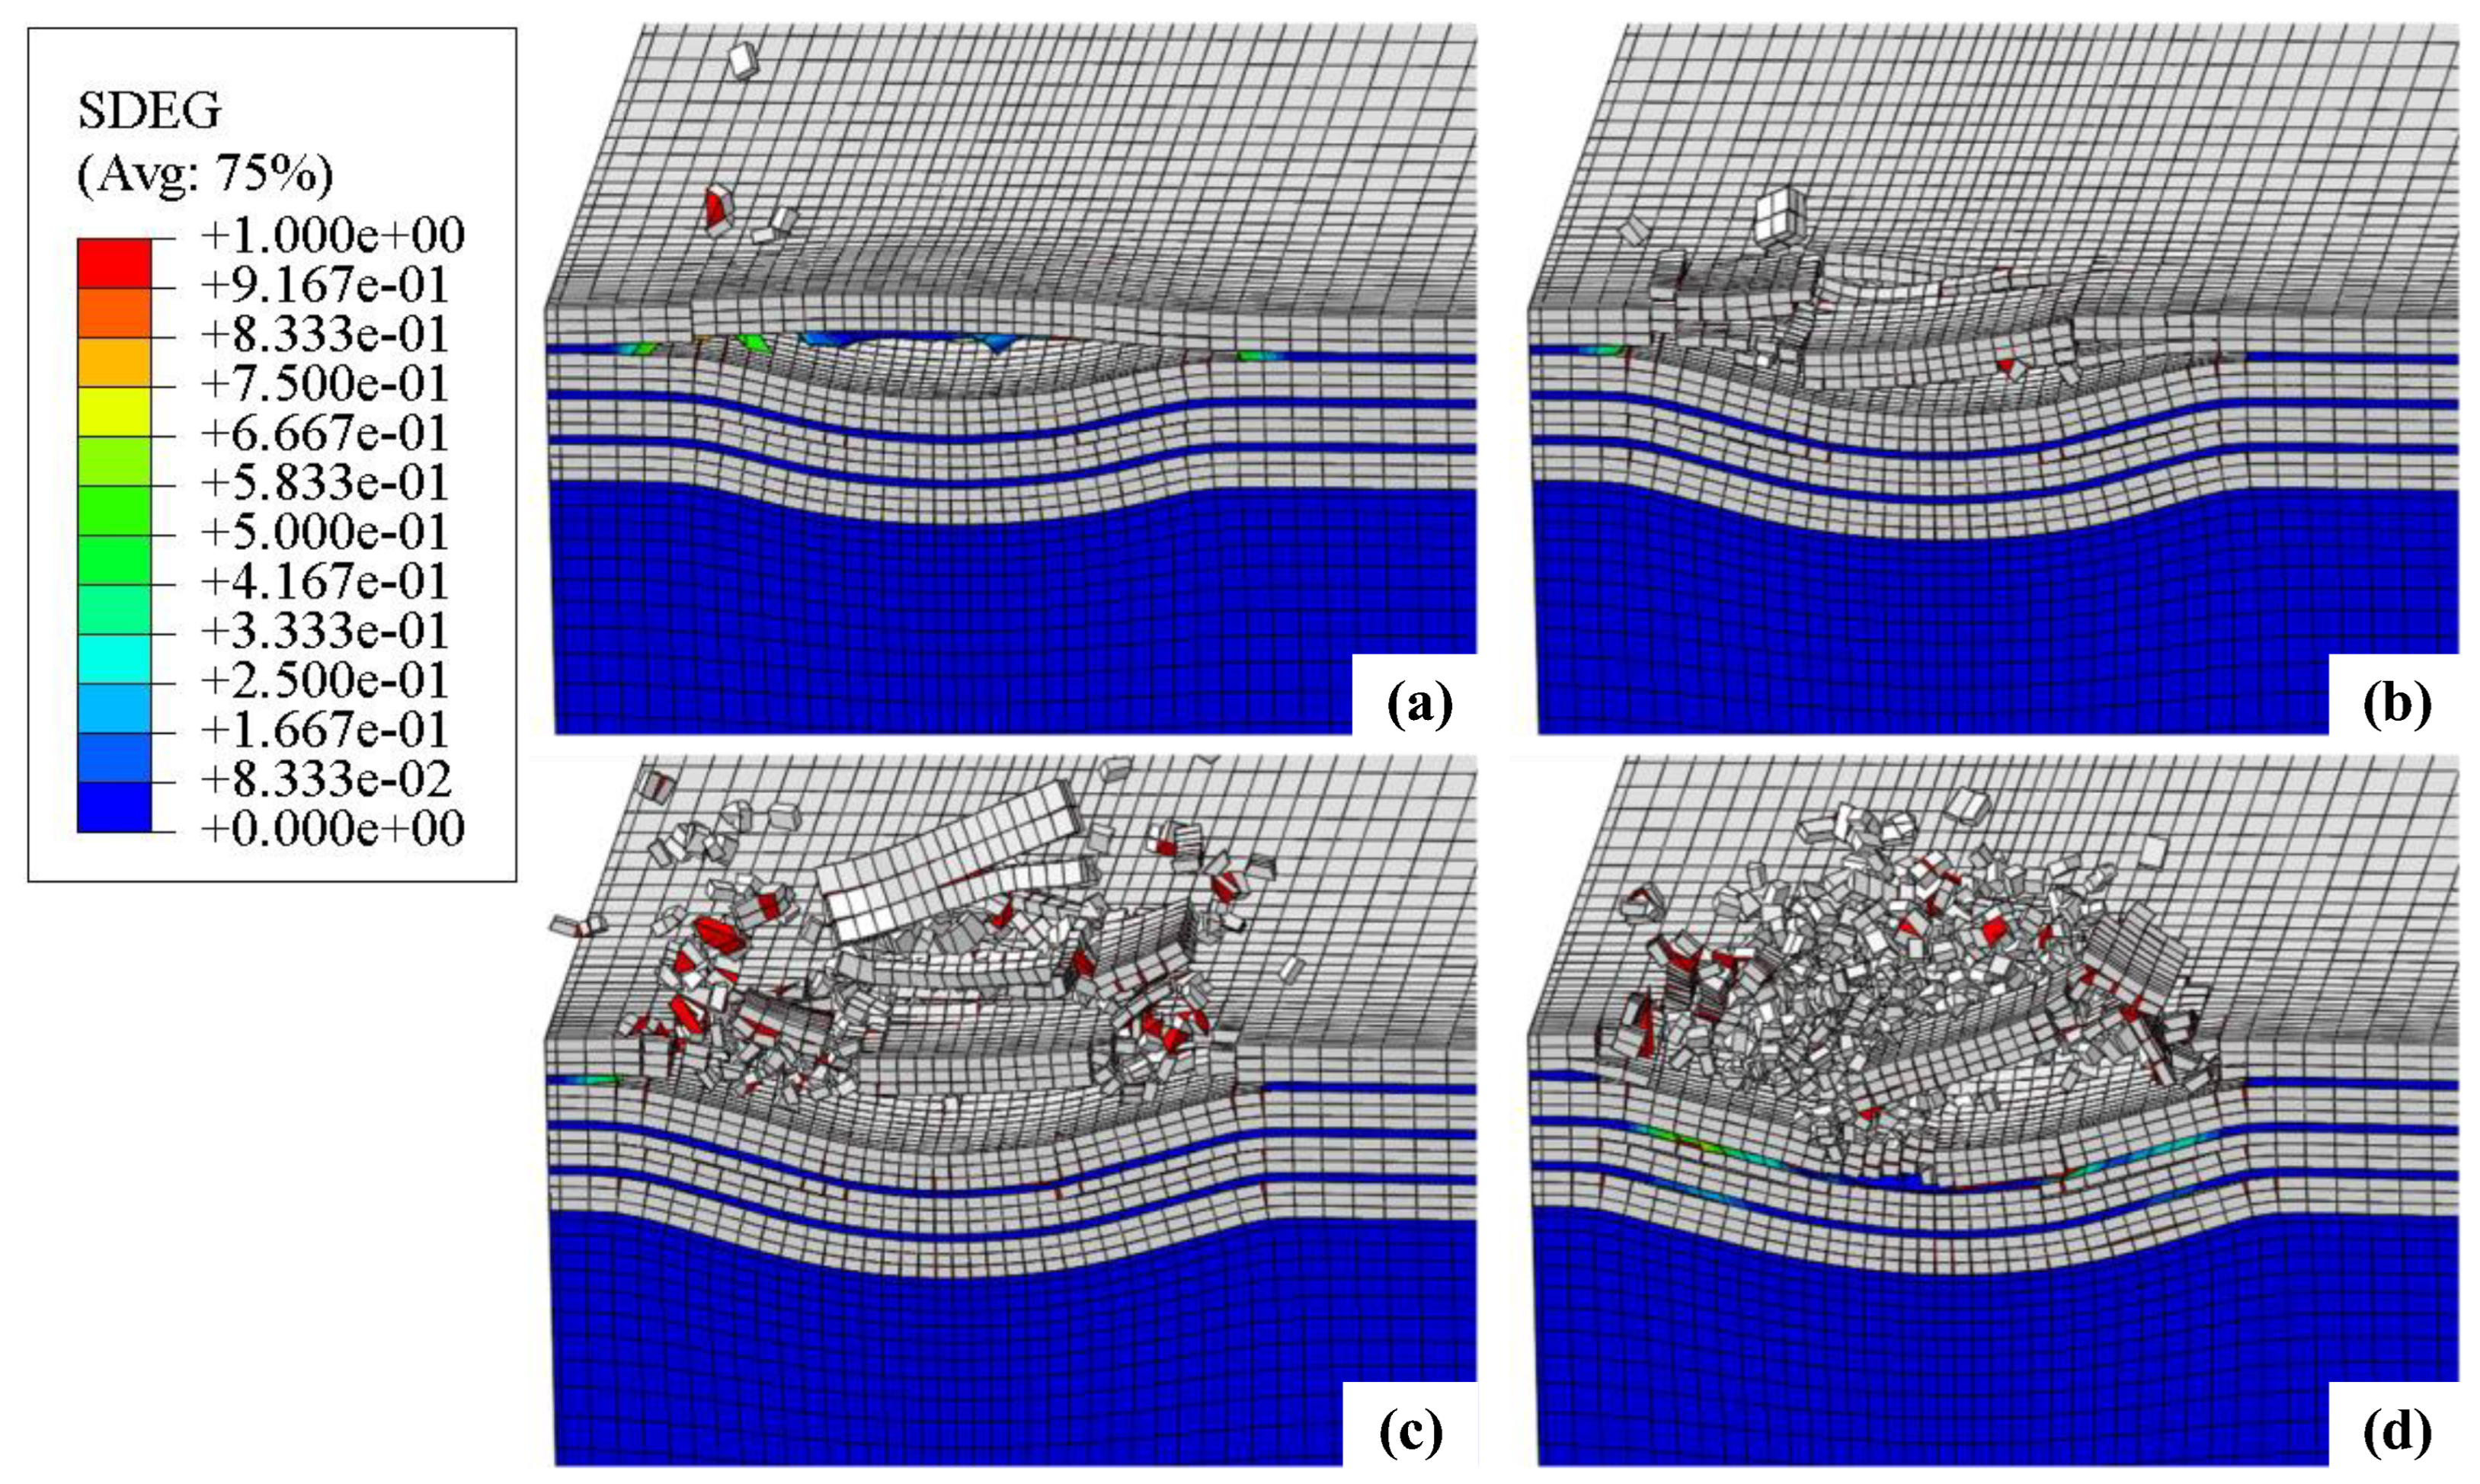
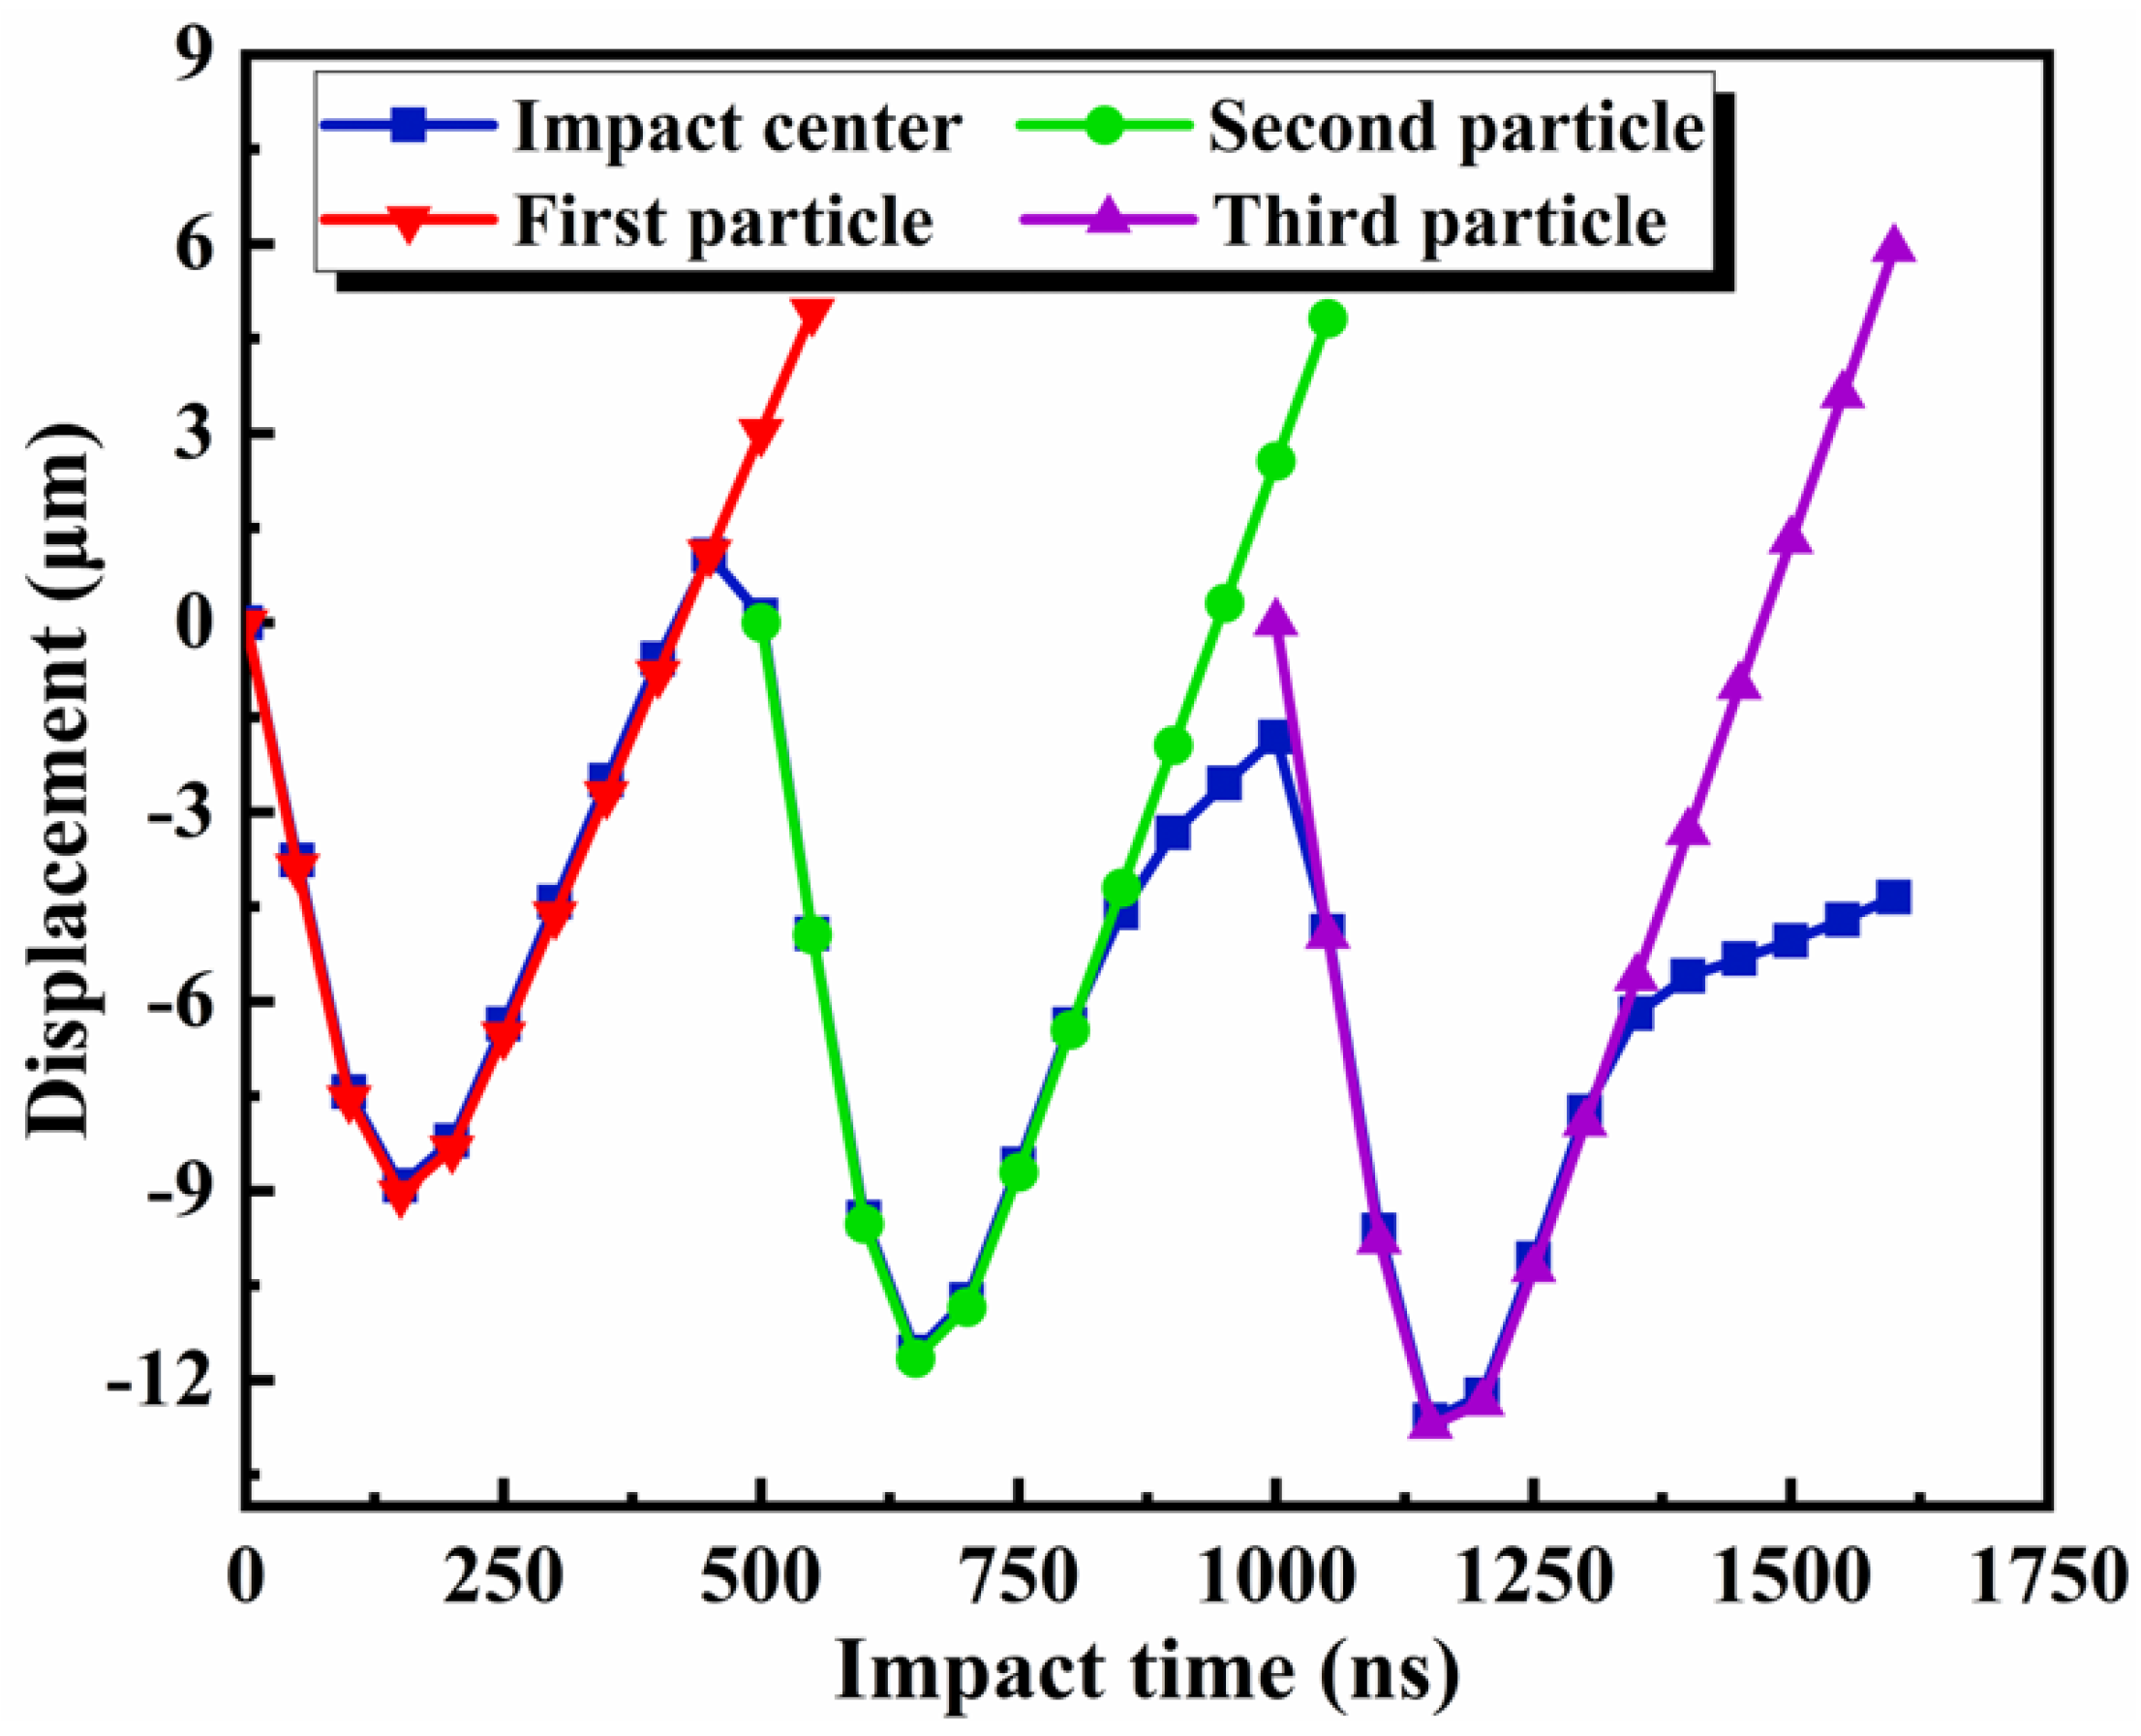
3.1. Damage Evolution during Multi-Particle Impact Process
3.2. The Influence of Impact Angle on Erosion Resistance Performance
4. Conclusion
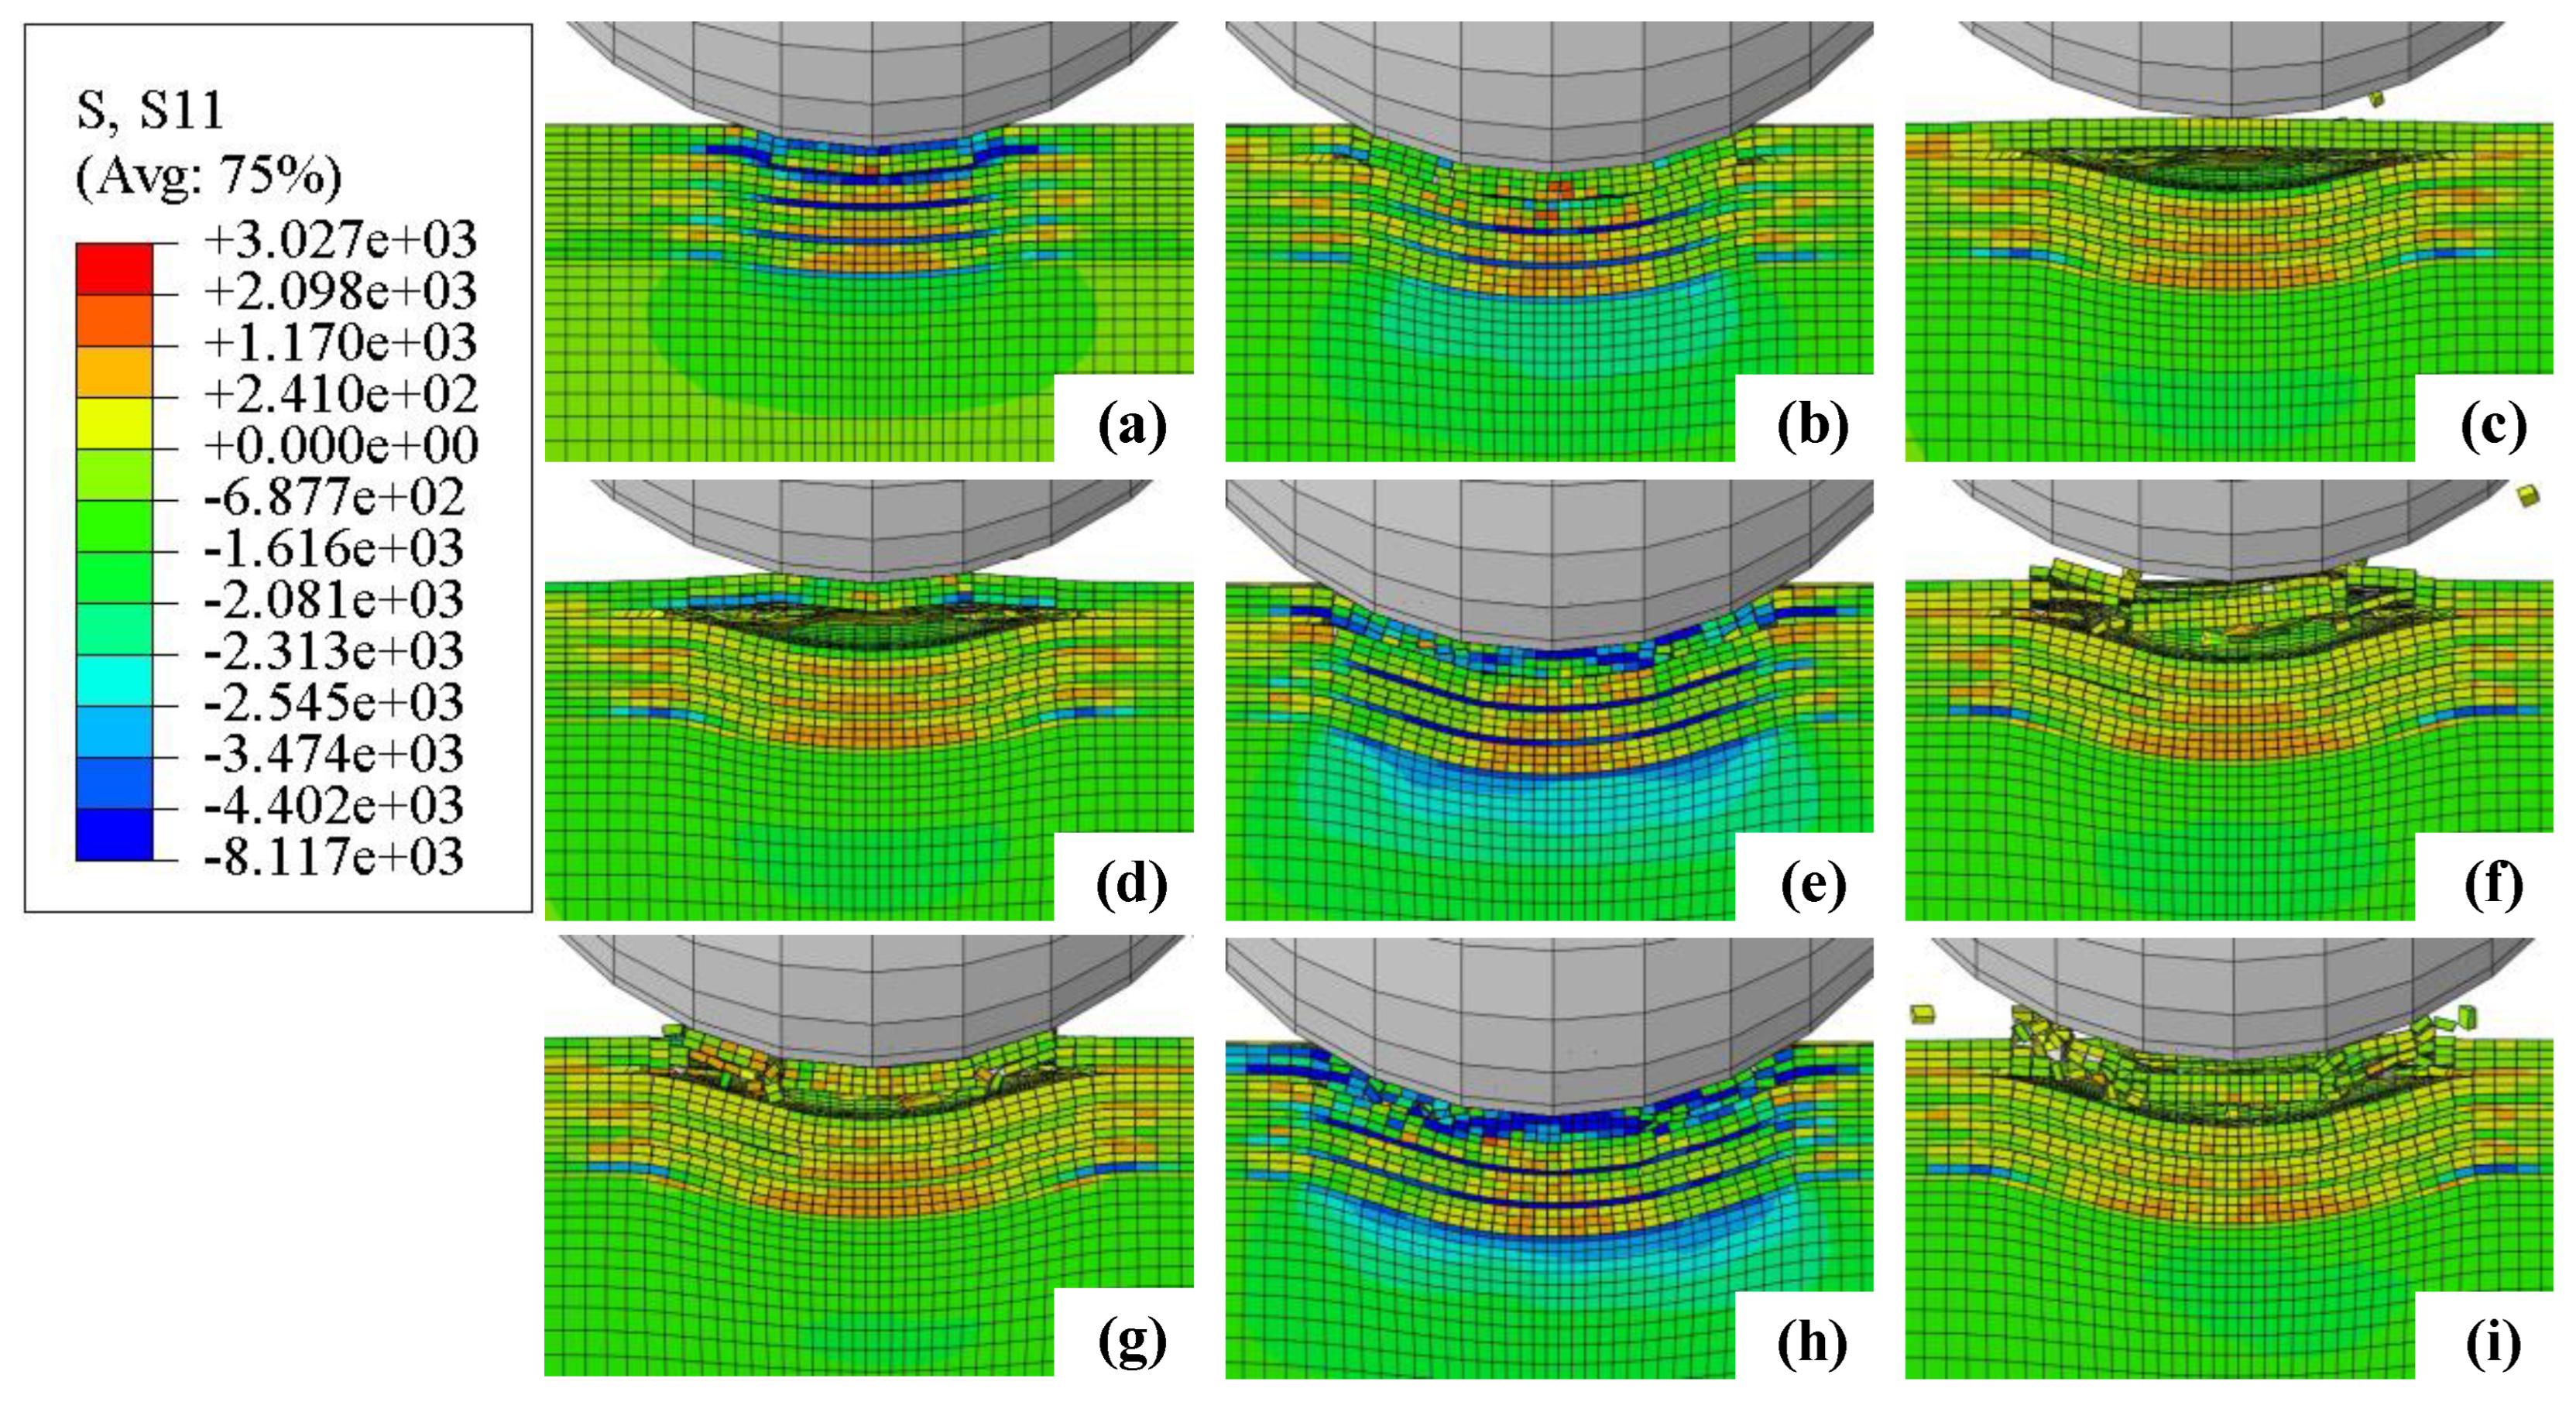
- (1)
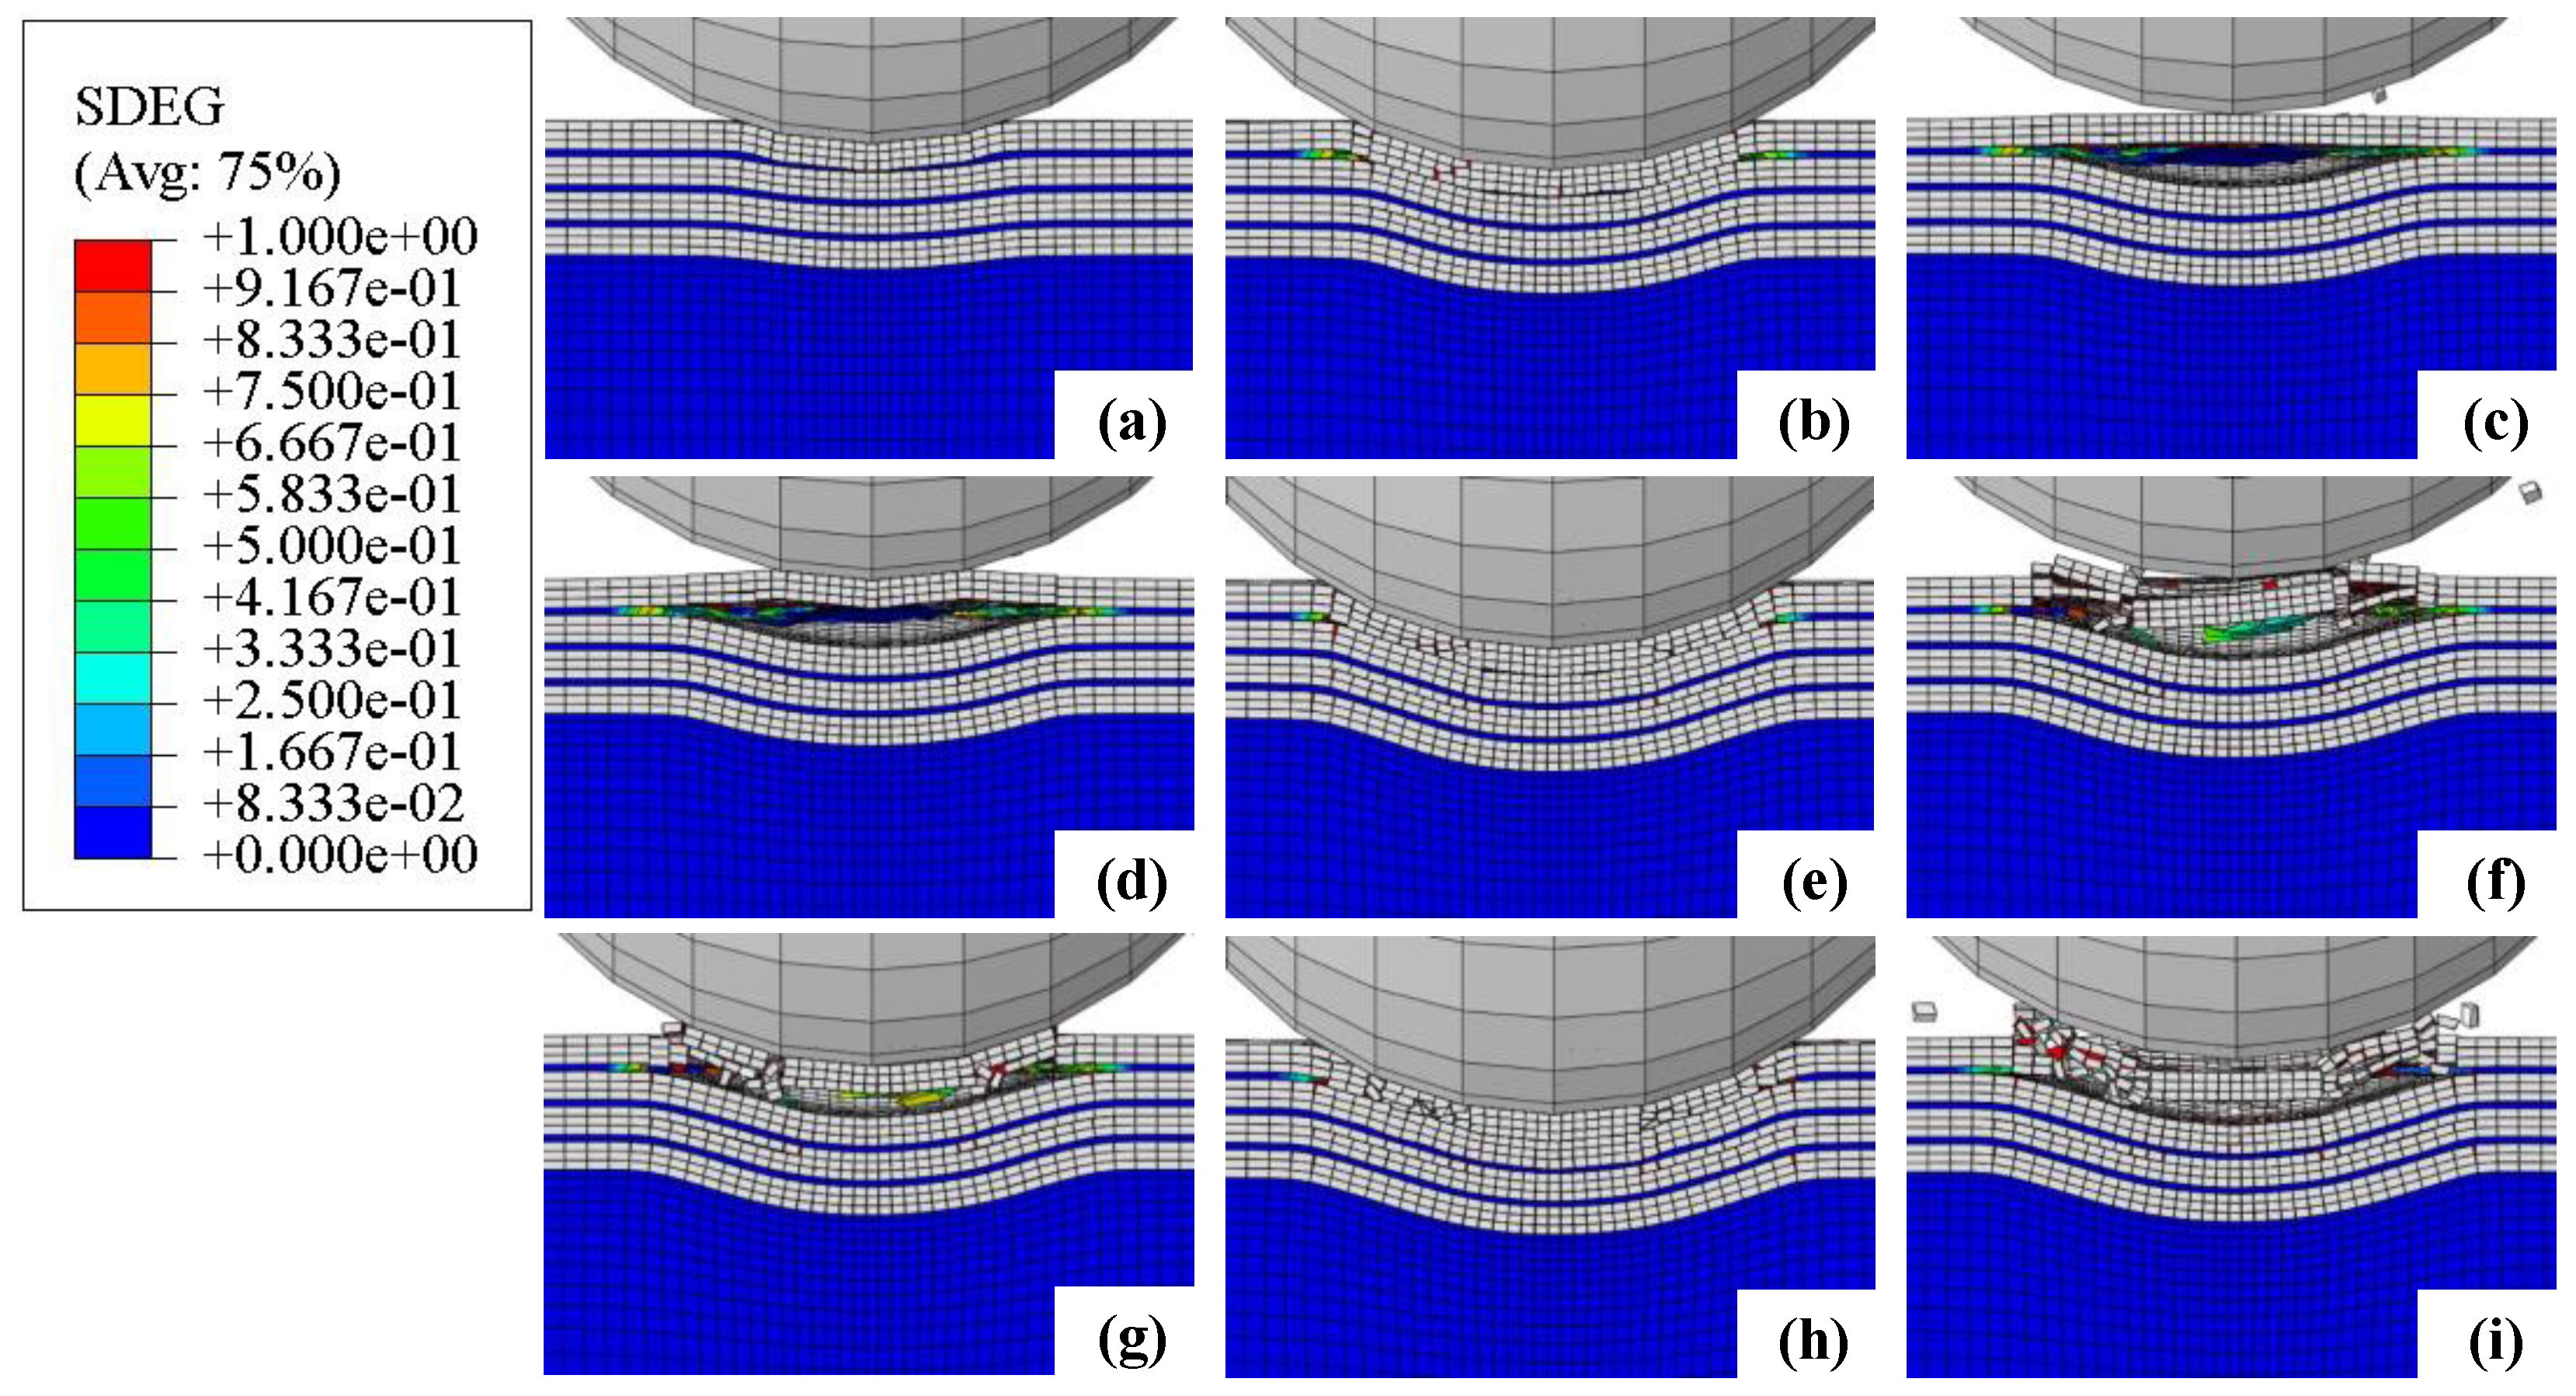
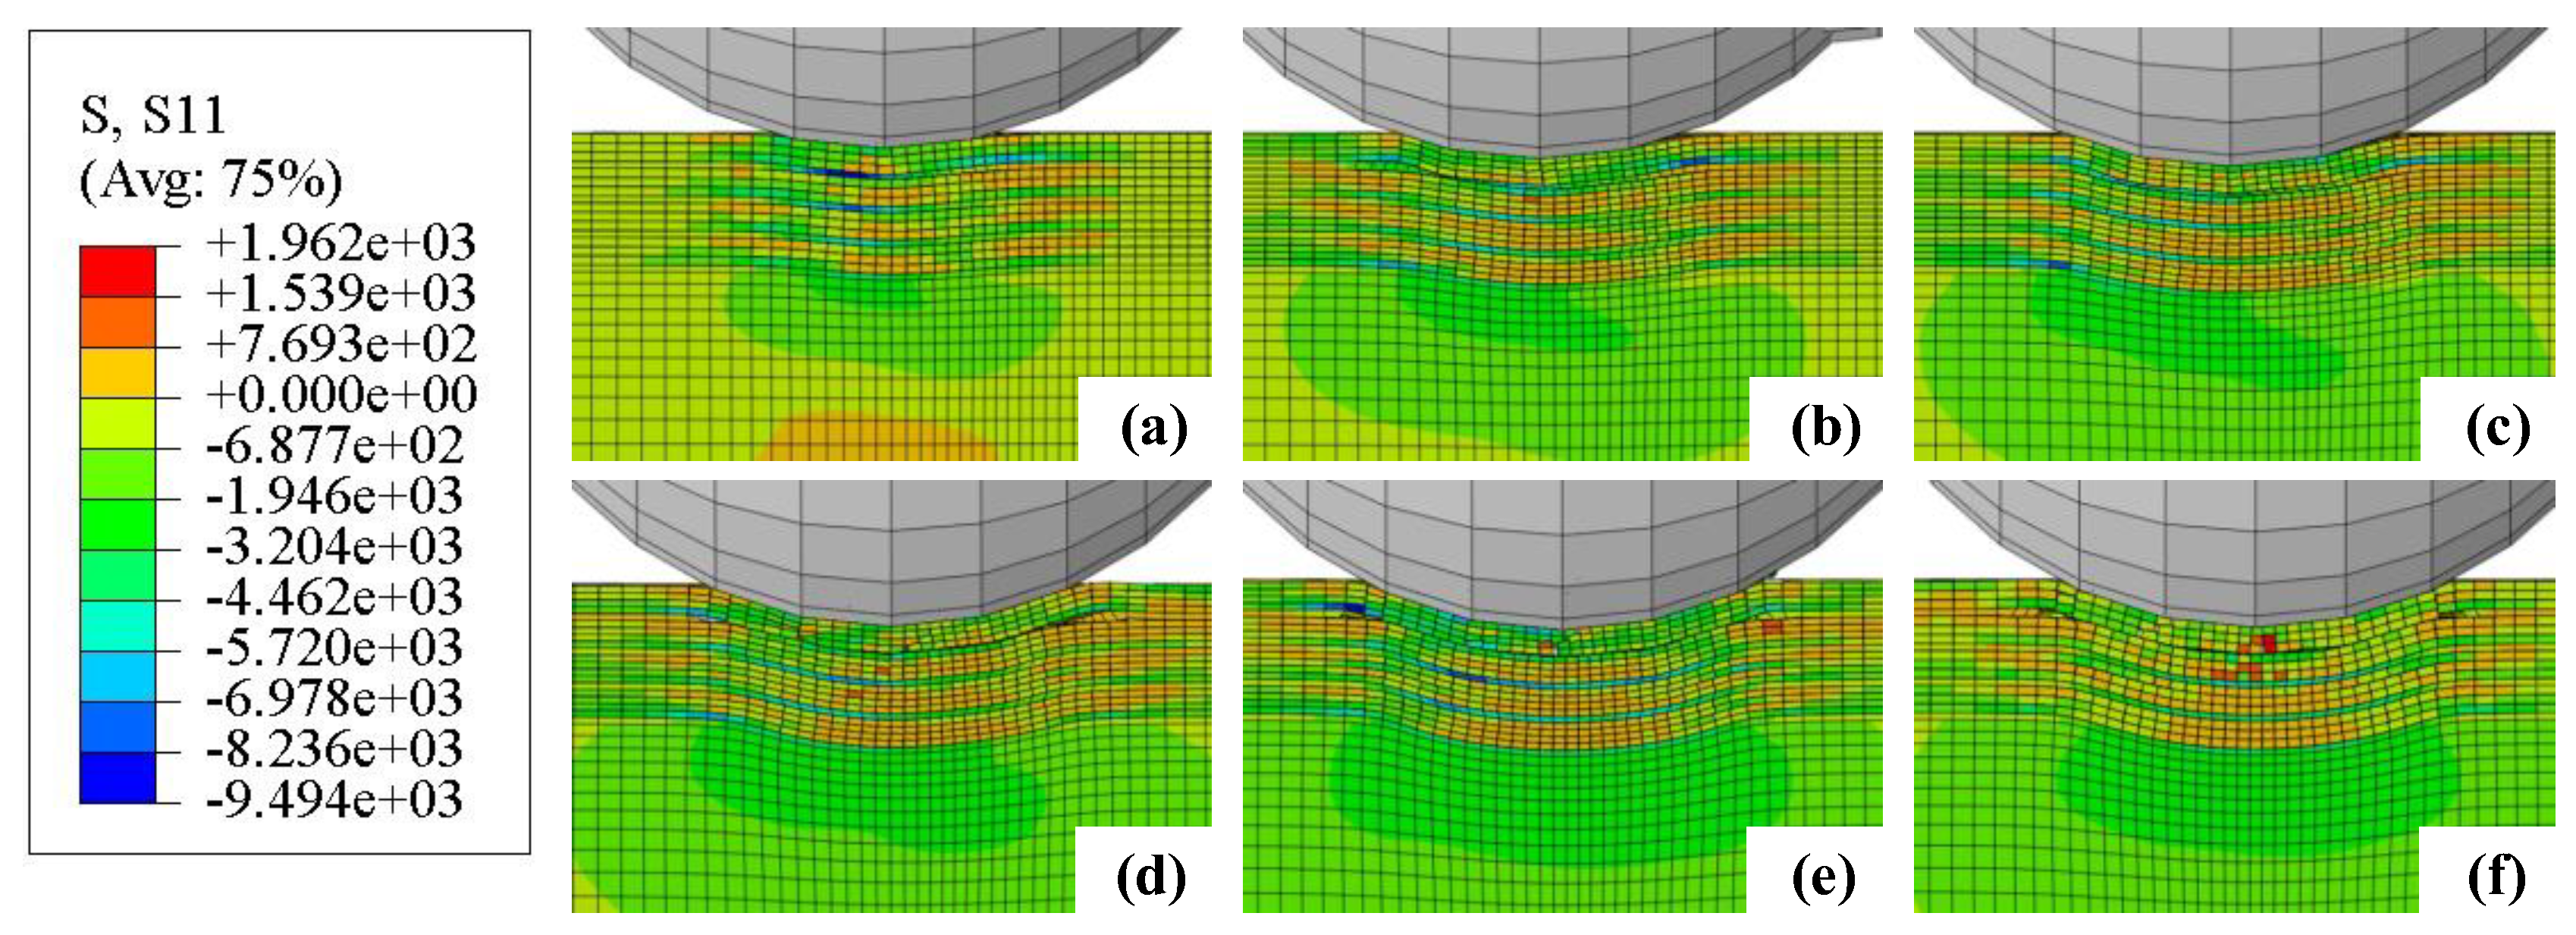
- During the impact process, the stress in the coating will first increase and then decrease, and subsequent impacts will increase the stress in the coating. During the impact process, compressive stress appears on the upper surface of the TiN layer directly below the impact center, while tensile stress appears on the lower surface of the TiN layer. At the impact contact edge, tensile stress appears on the upper surface of the TiN layer, while compressive stress appears on the lower surface of the TiN layer.
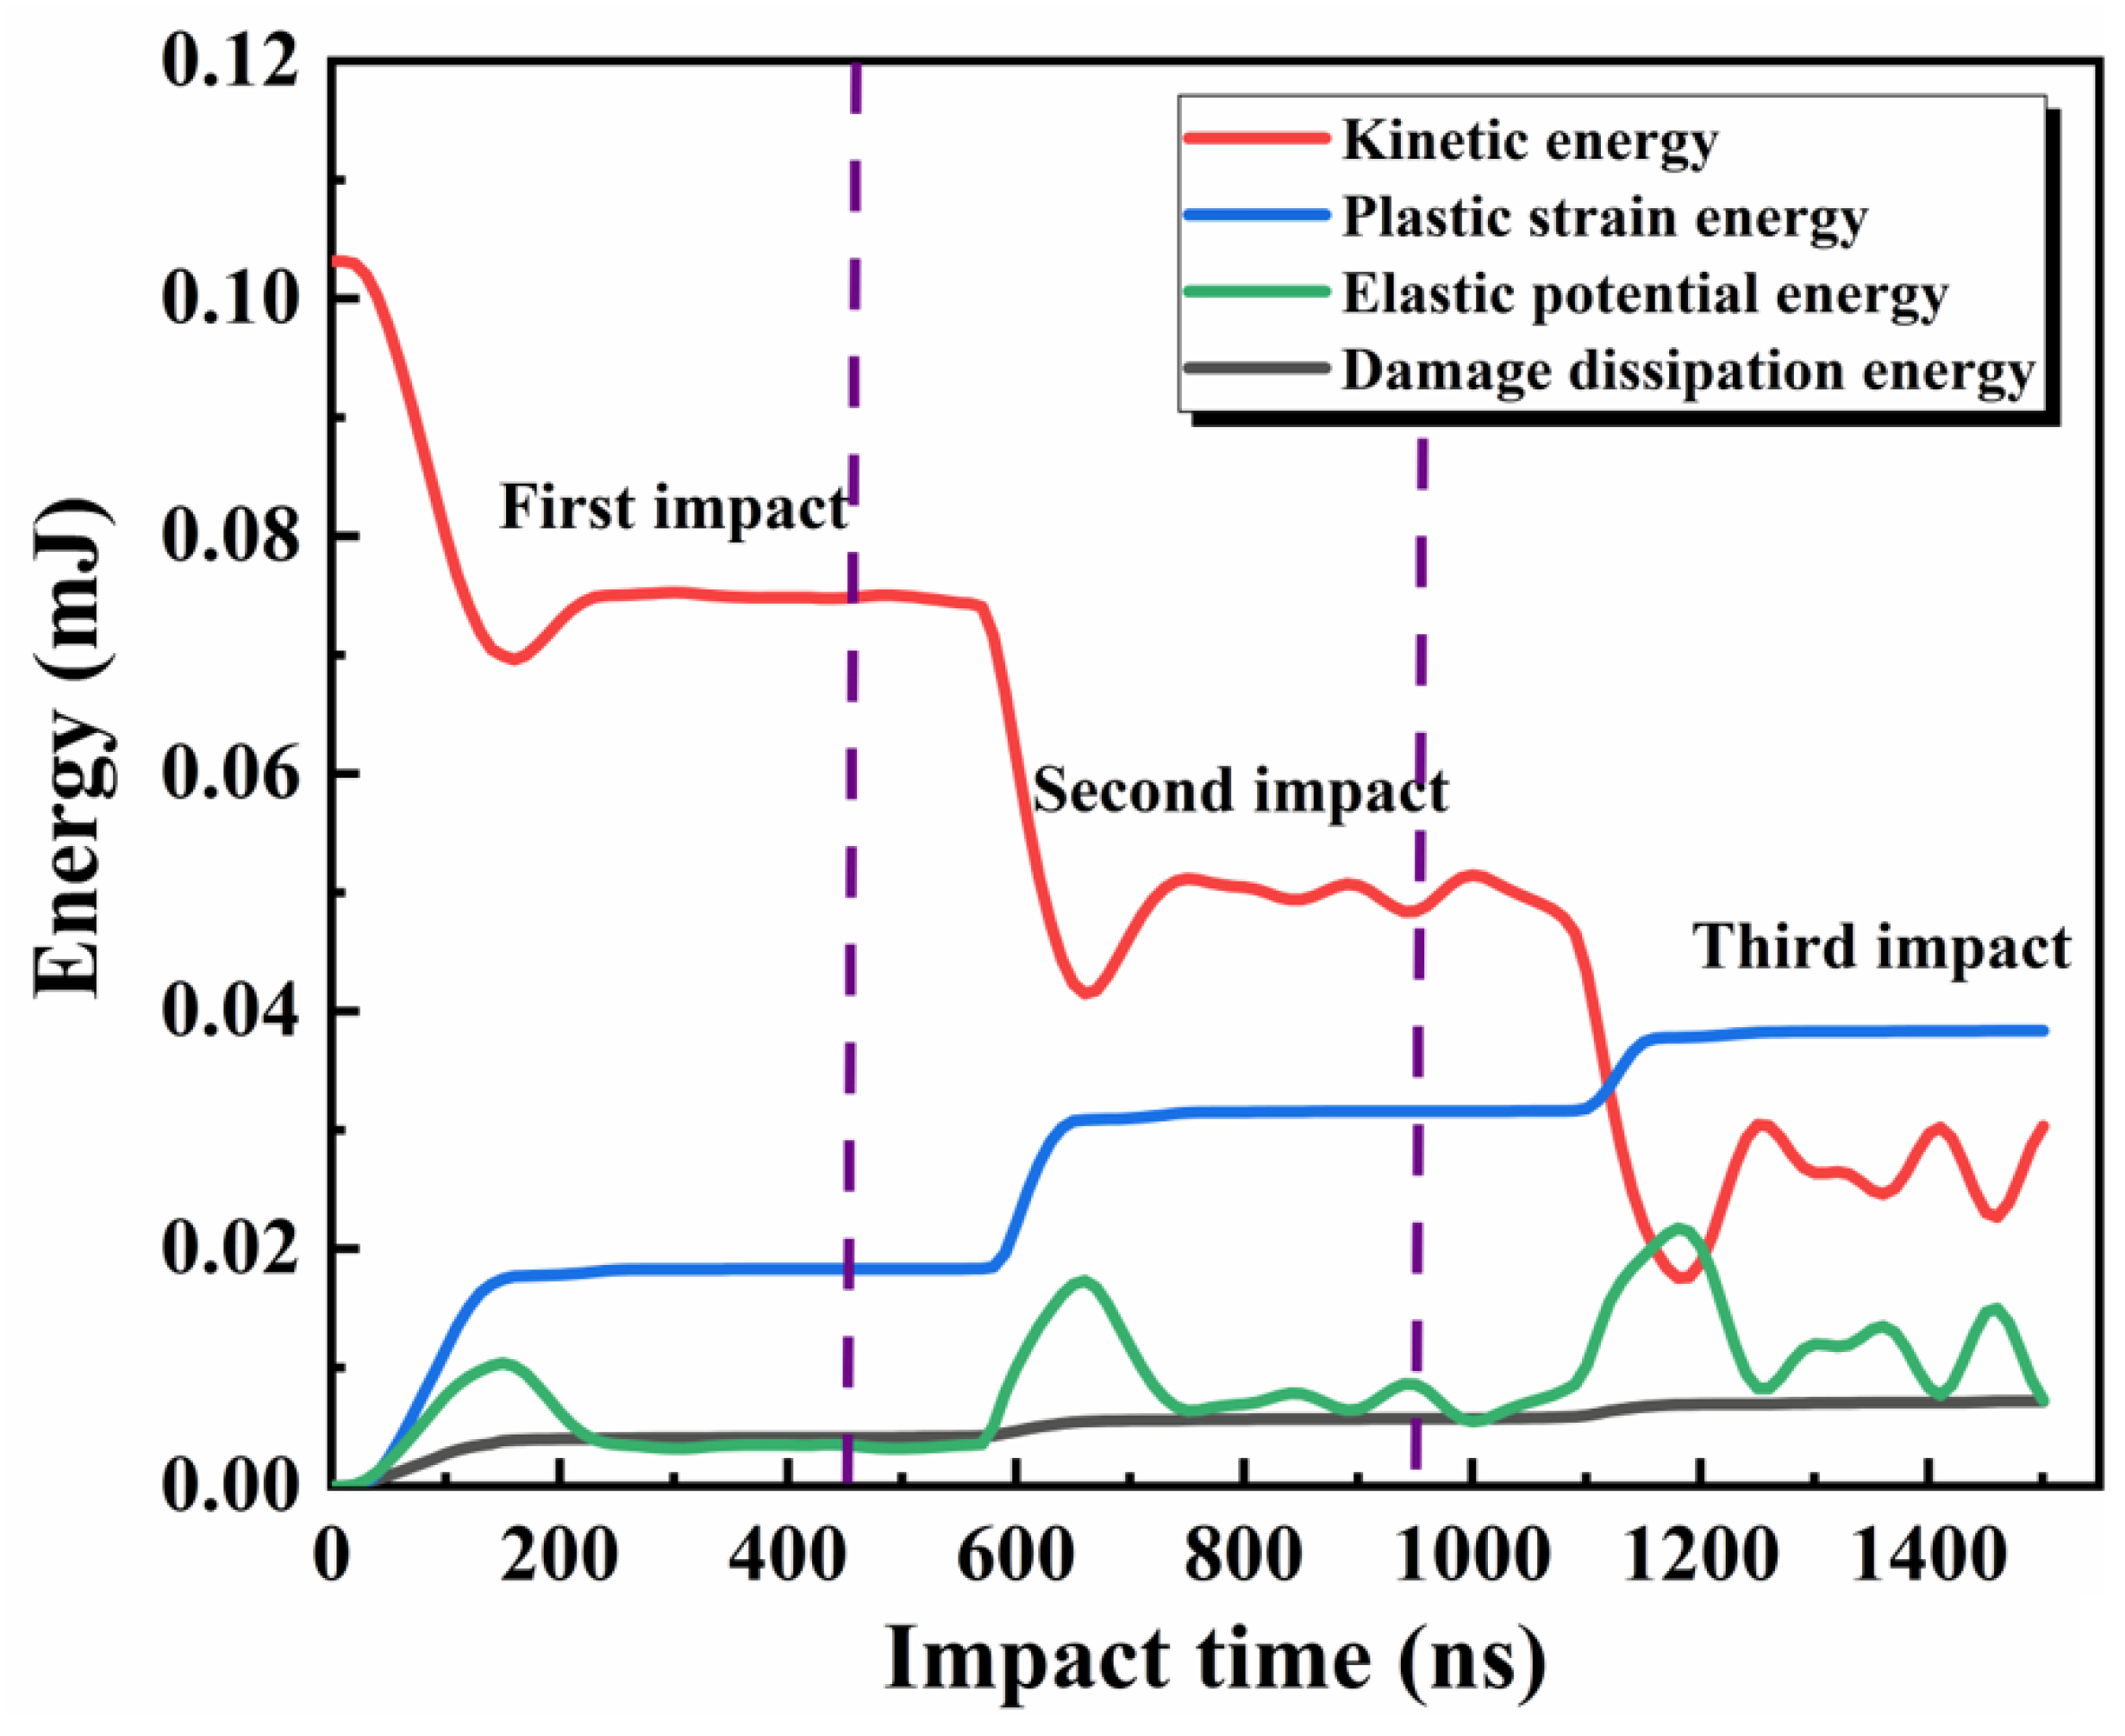
- (2)
- During the impact process, the kinetic energy first decreases and then increases, while the elastic potential energy first increases and then decreases. The plastic strain energy and crack damage dissipation energy first increase and then remain stable. And the plastic strain energy accounts for 58.9% of the kinetic energy consumed after the first impact.
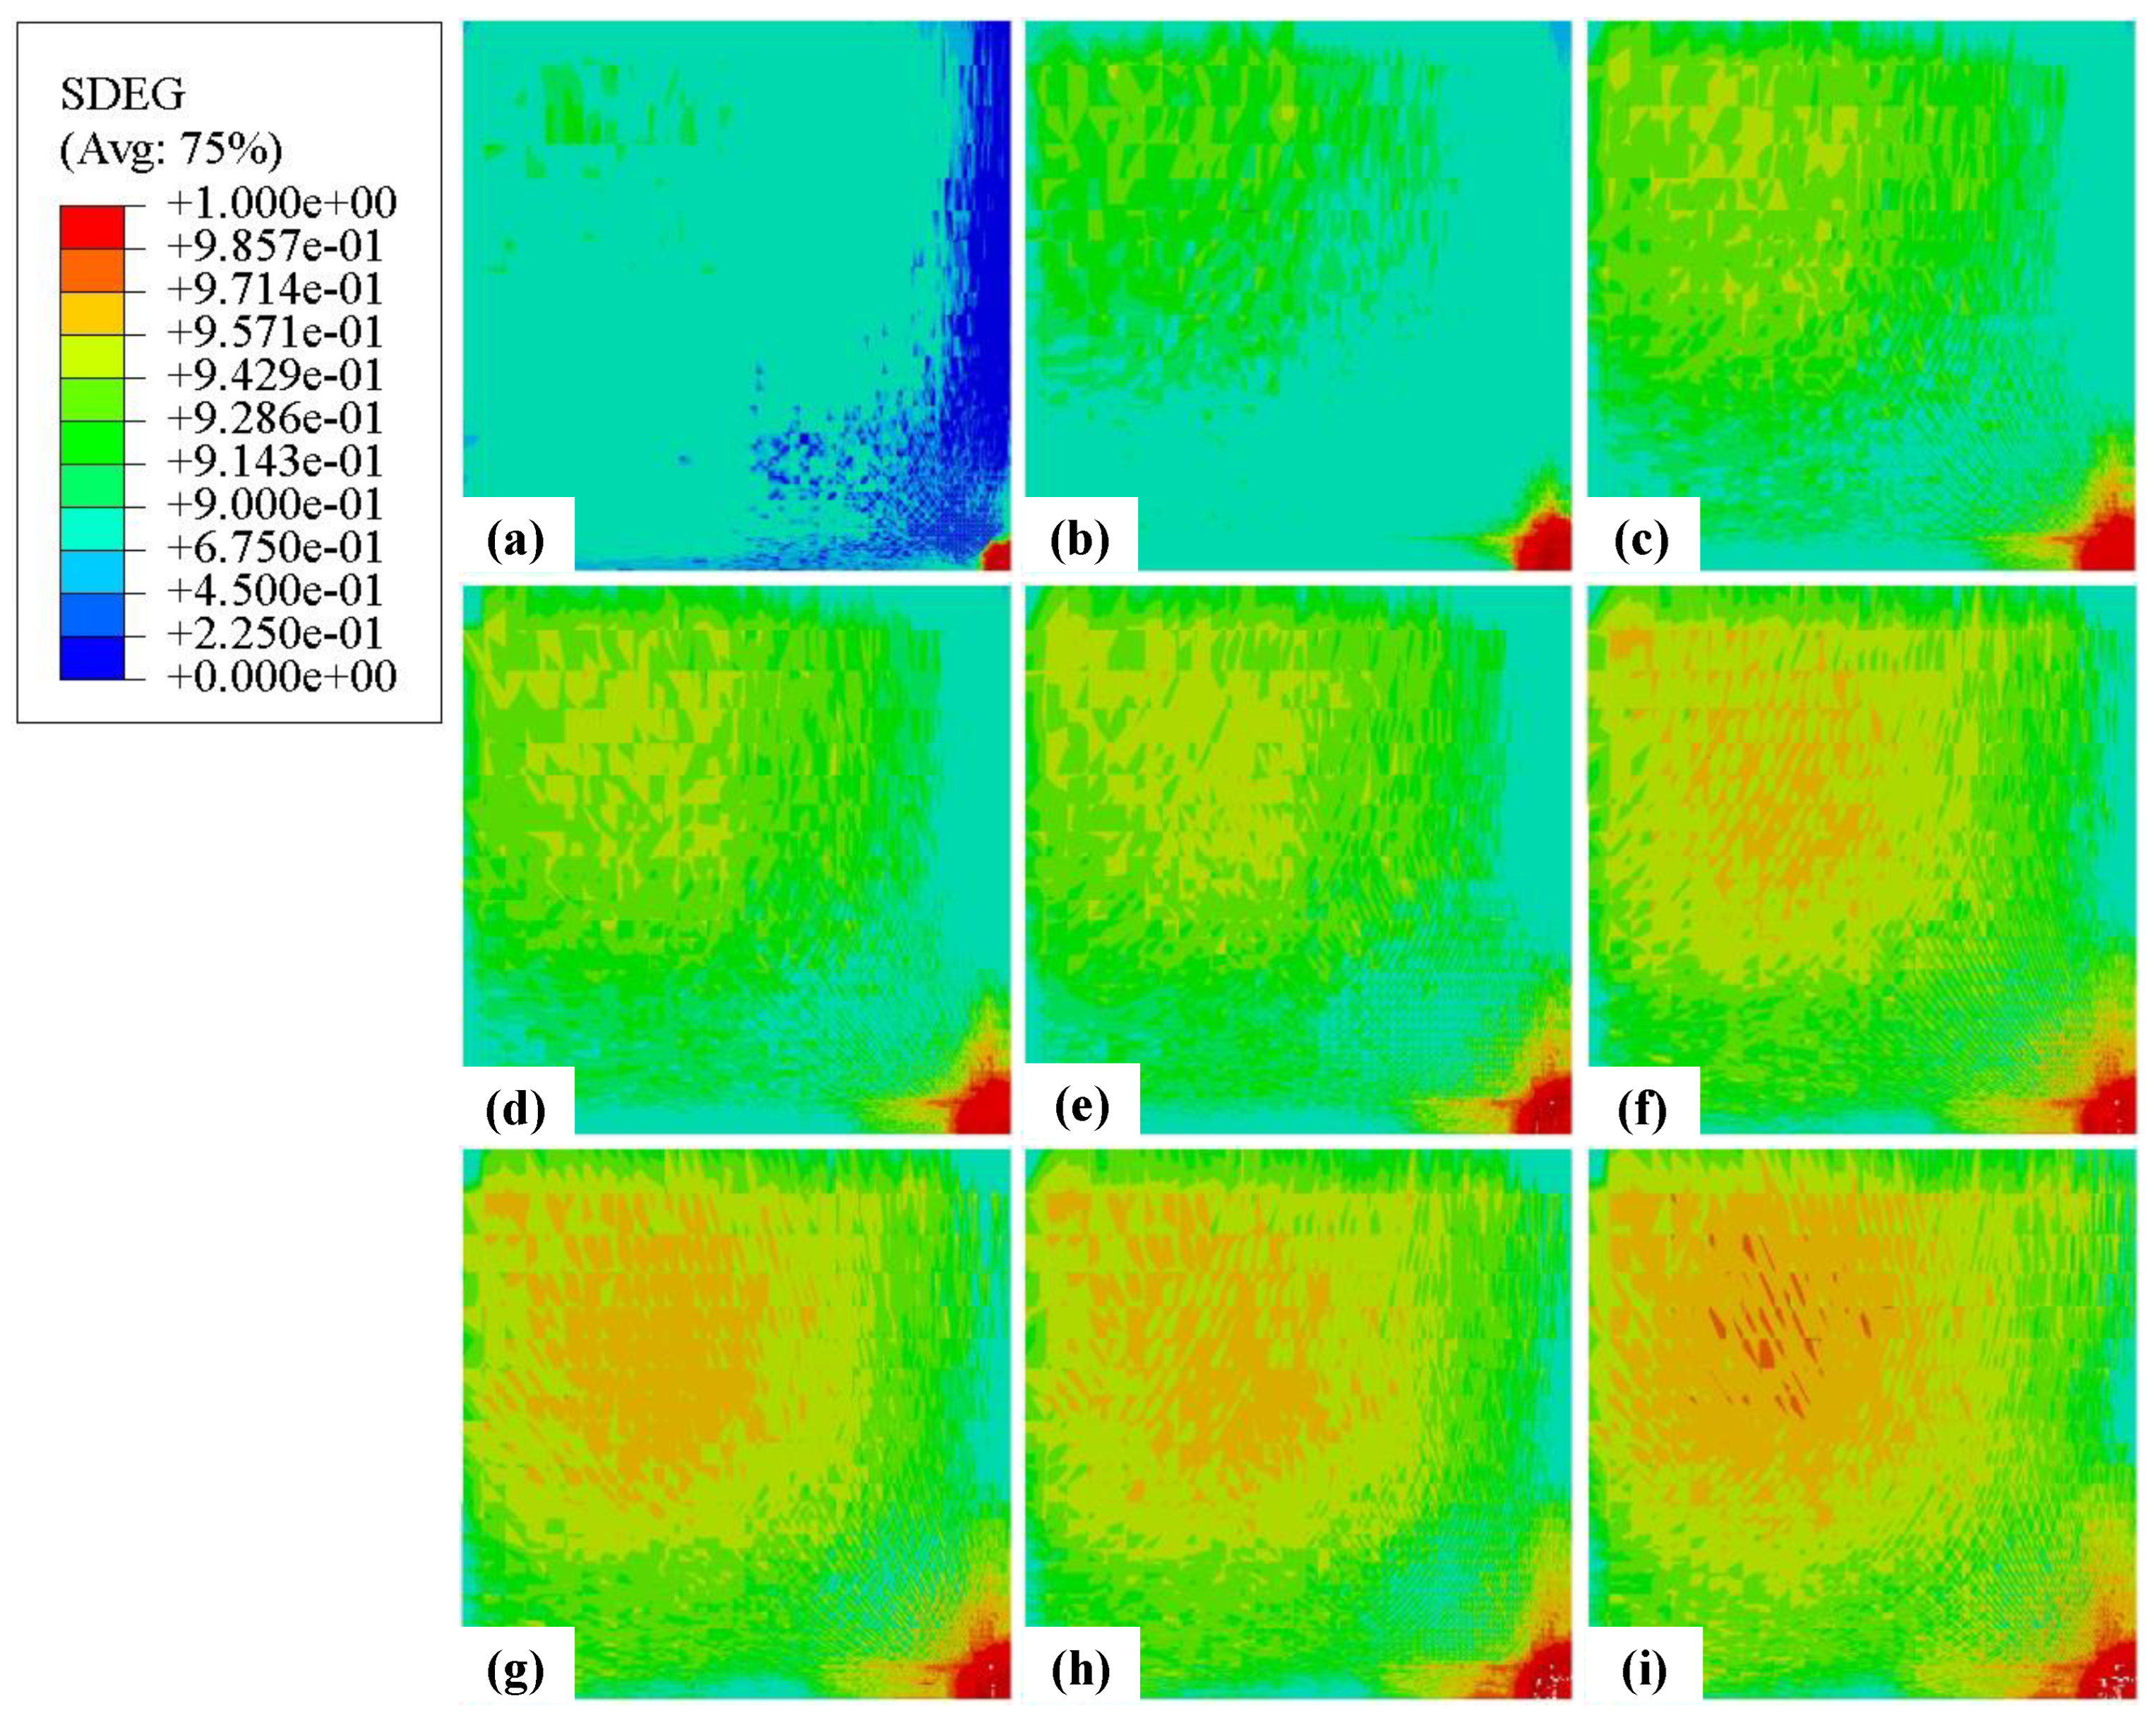
- (3)
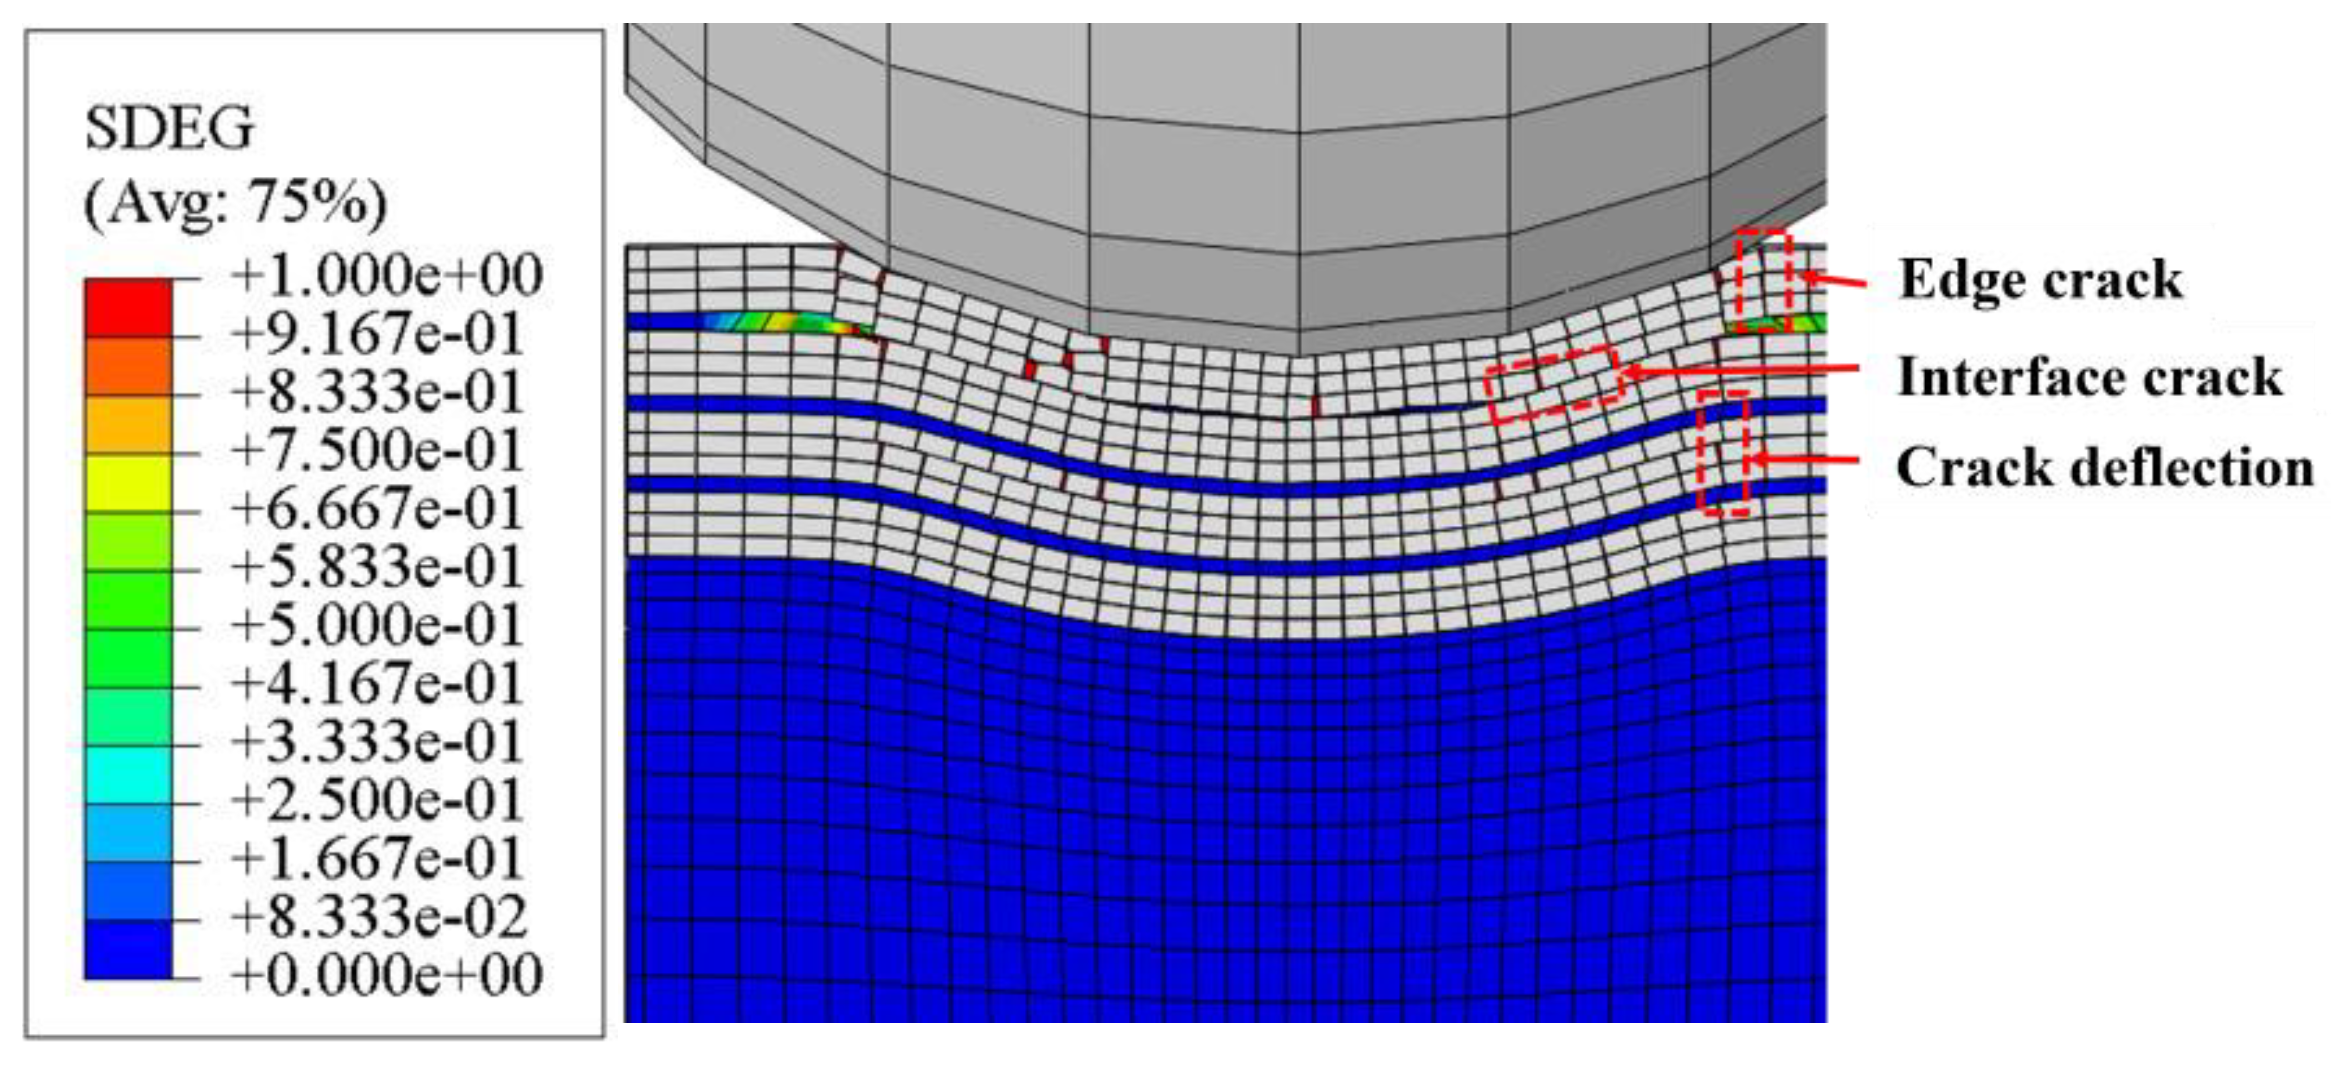
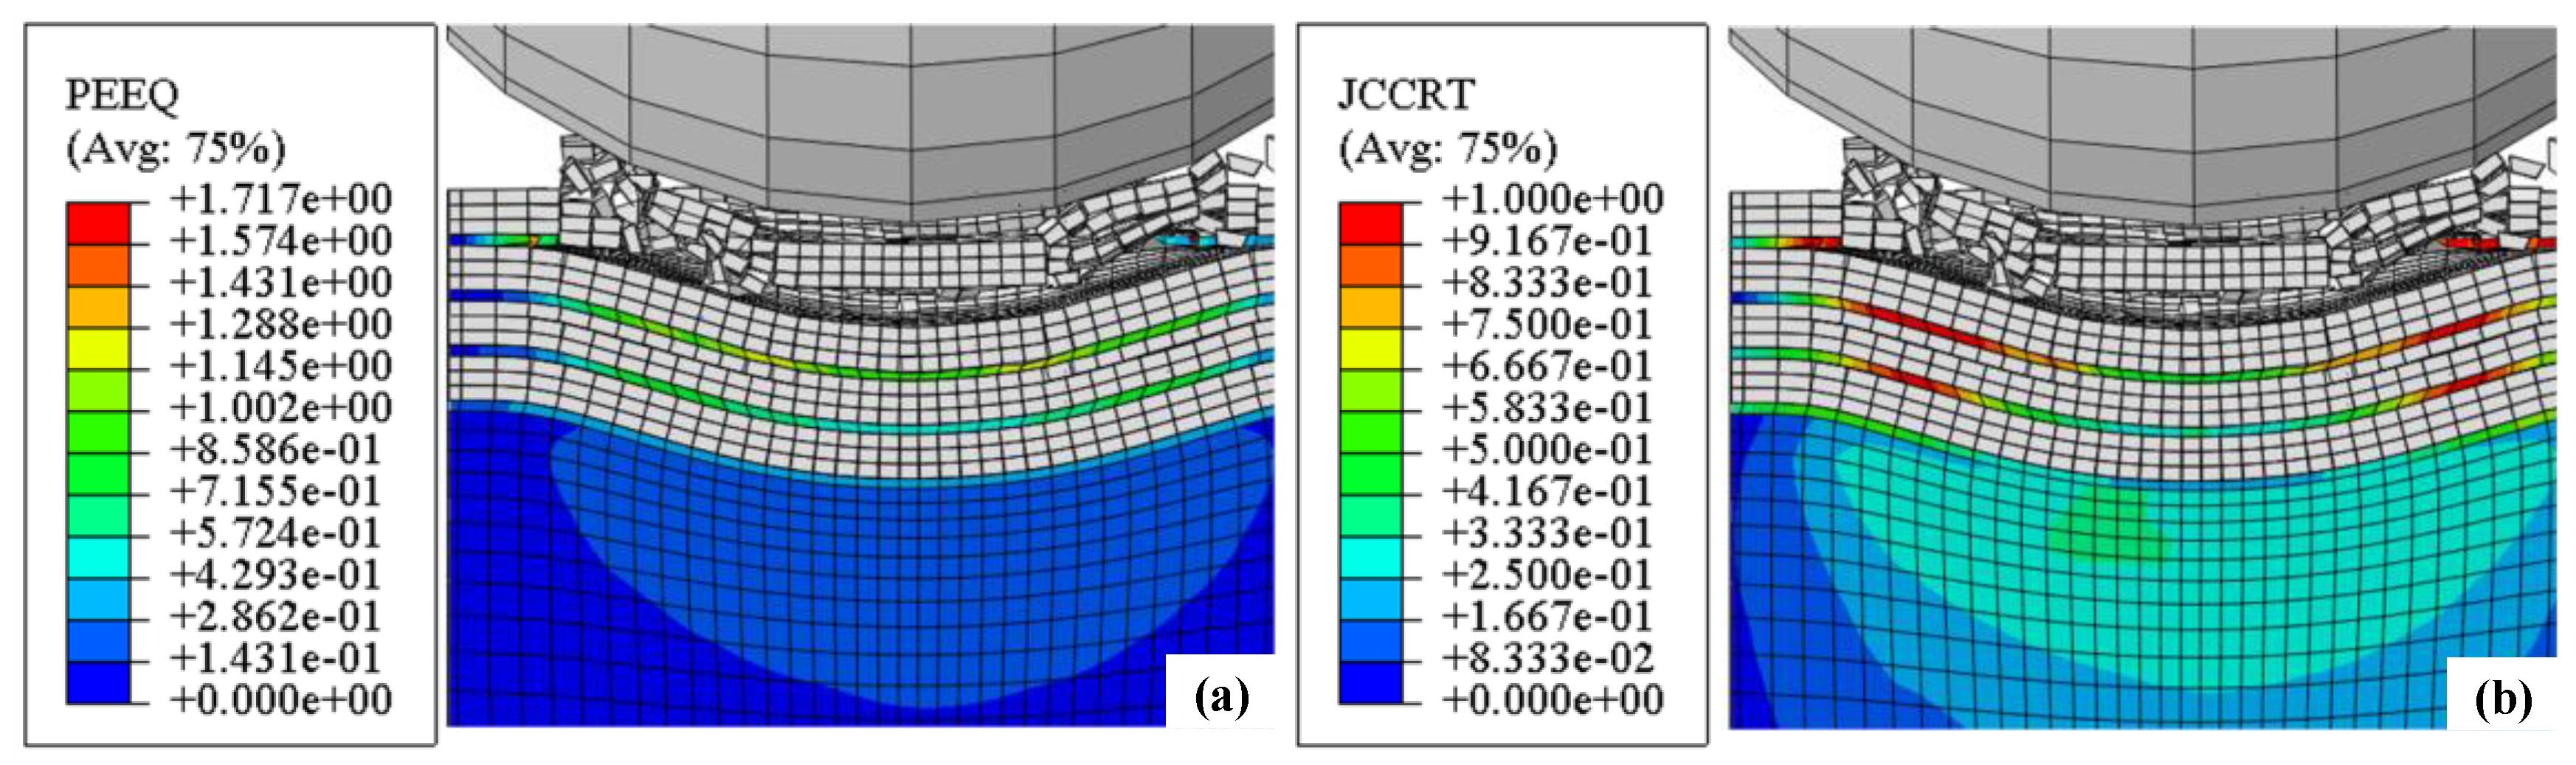
- In the same Ti layer, plastic strain and ductile metal damage are mainly concentrated at the midpoint between the impact center and the contact edge. The damage to the top layer TiN and interface is relatively severe.
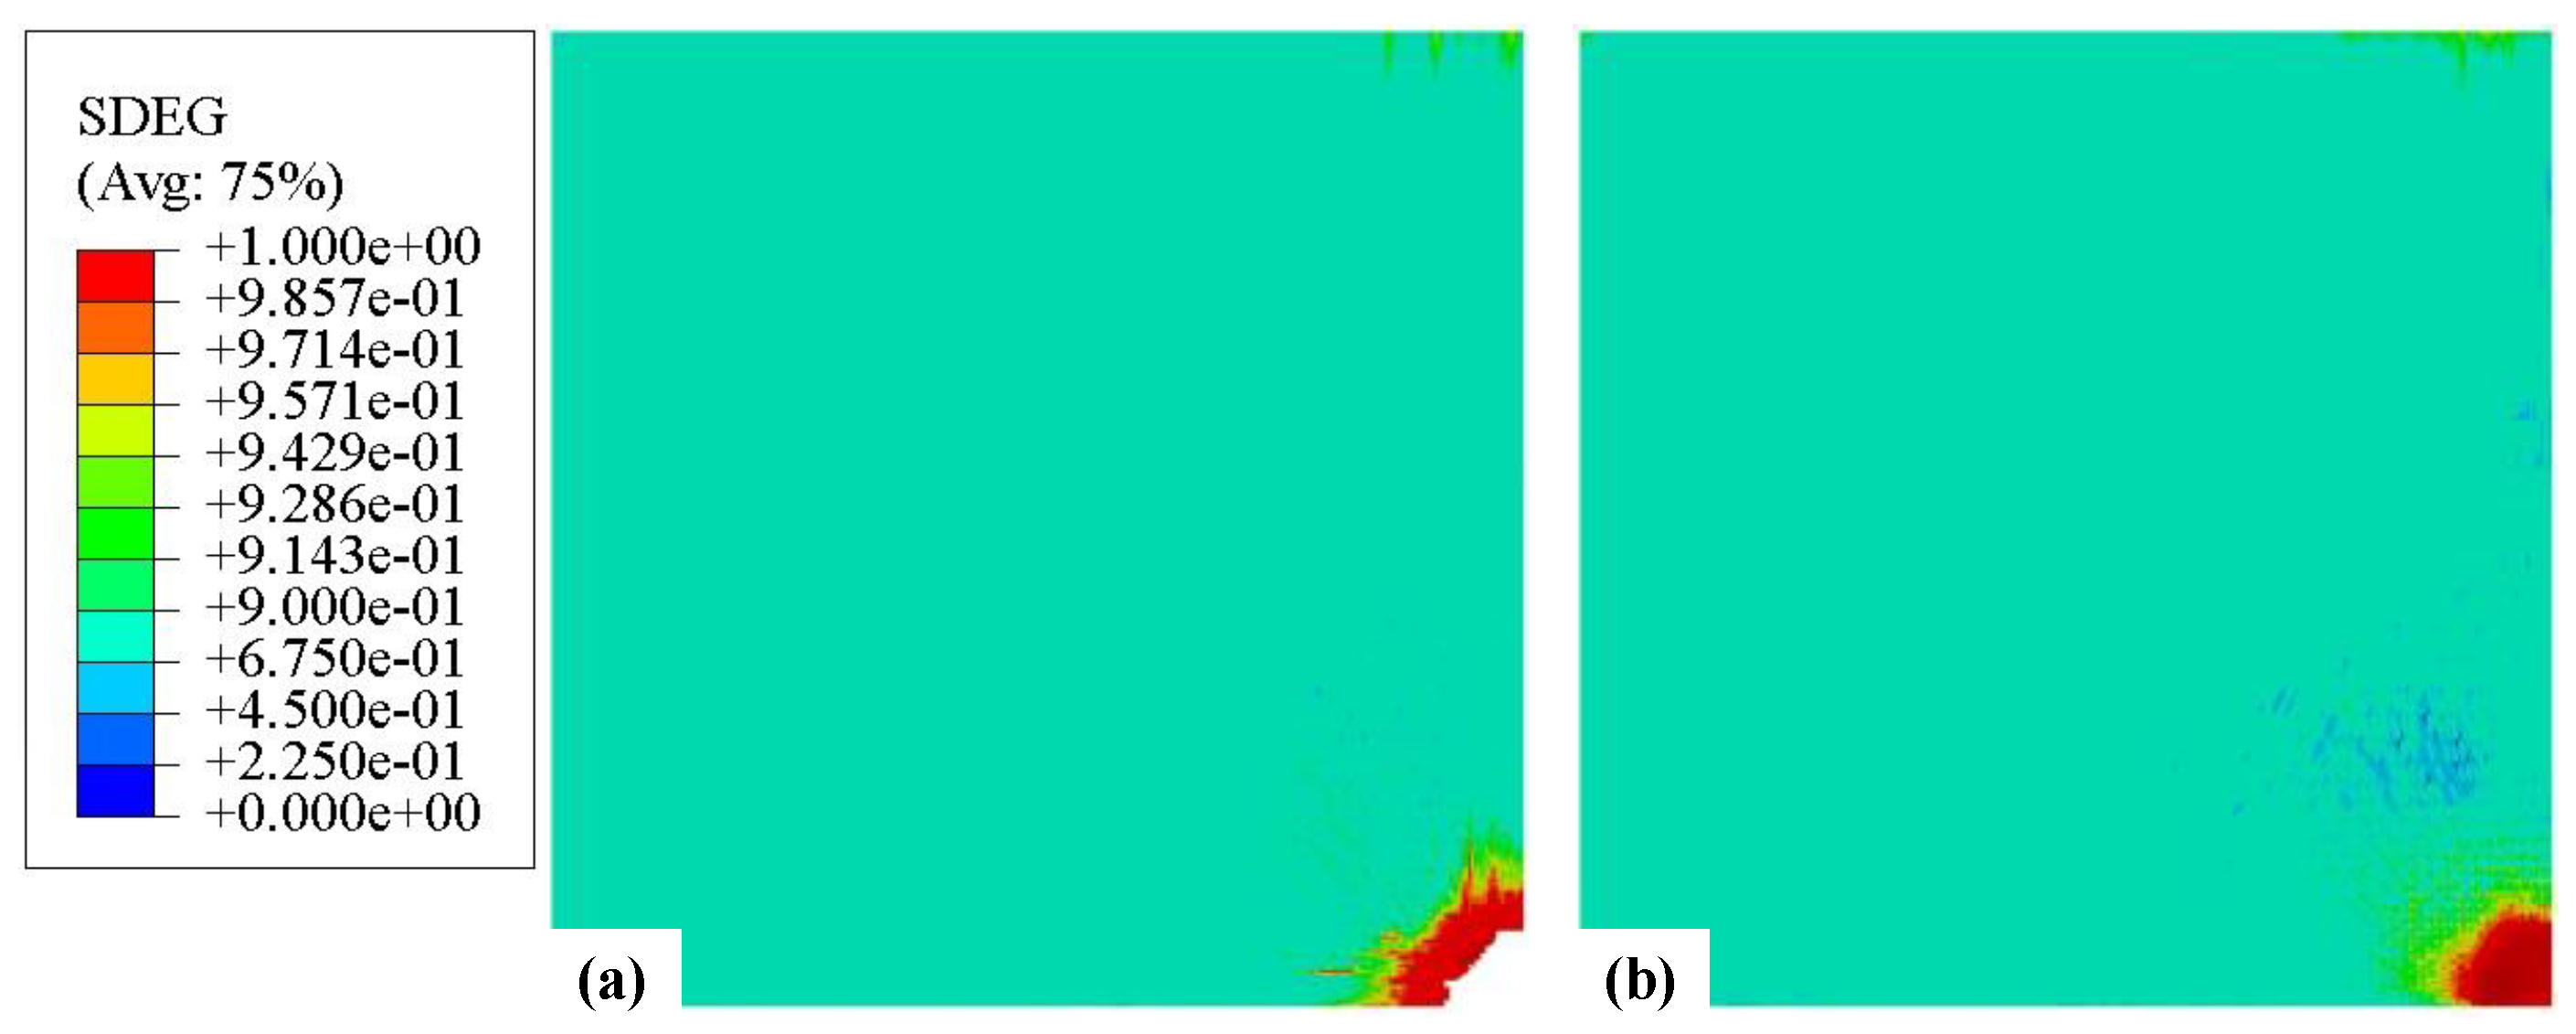
- (4)
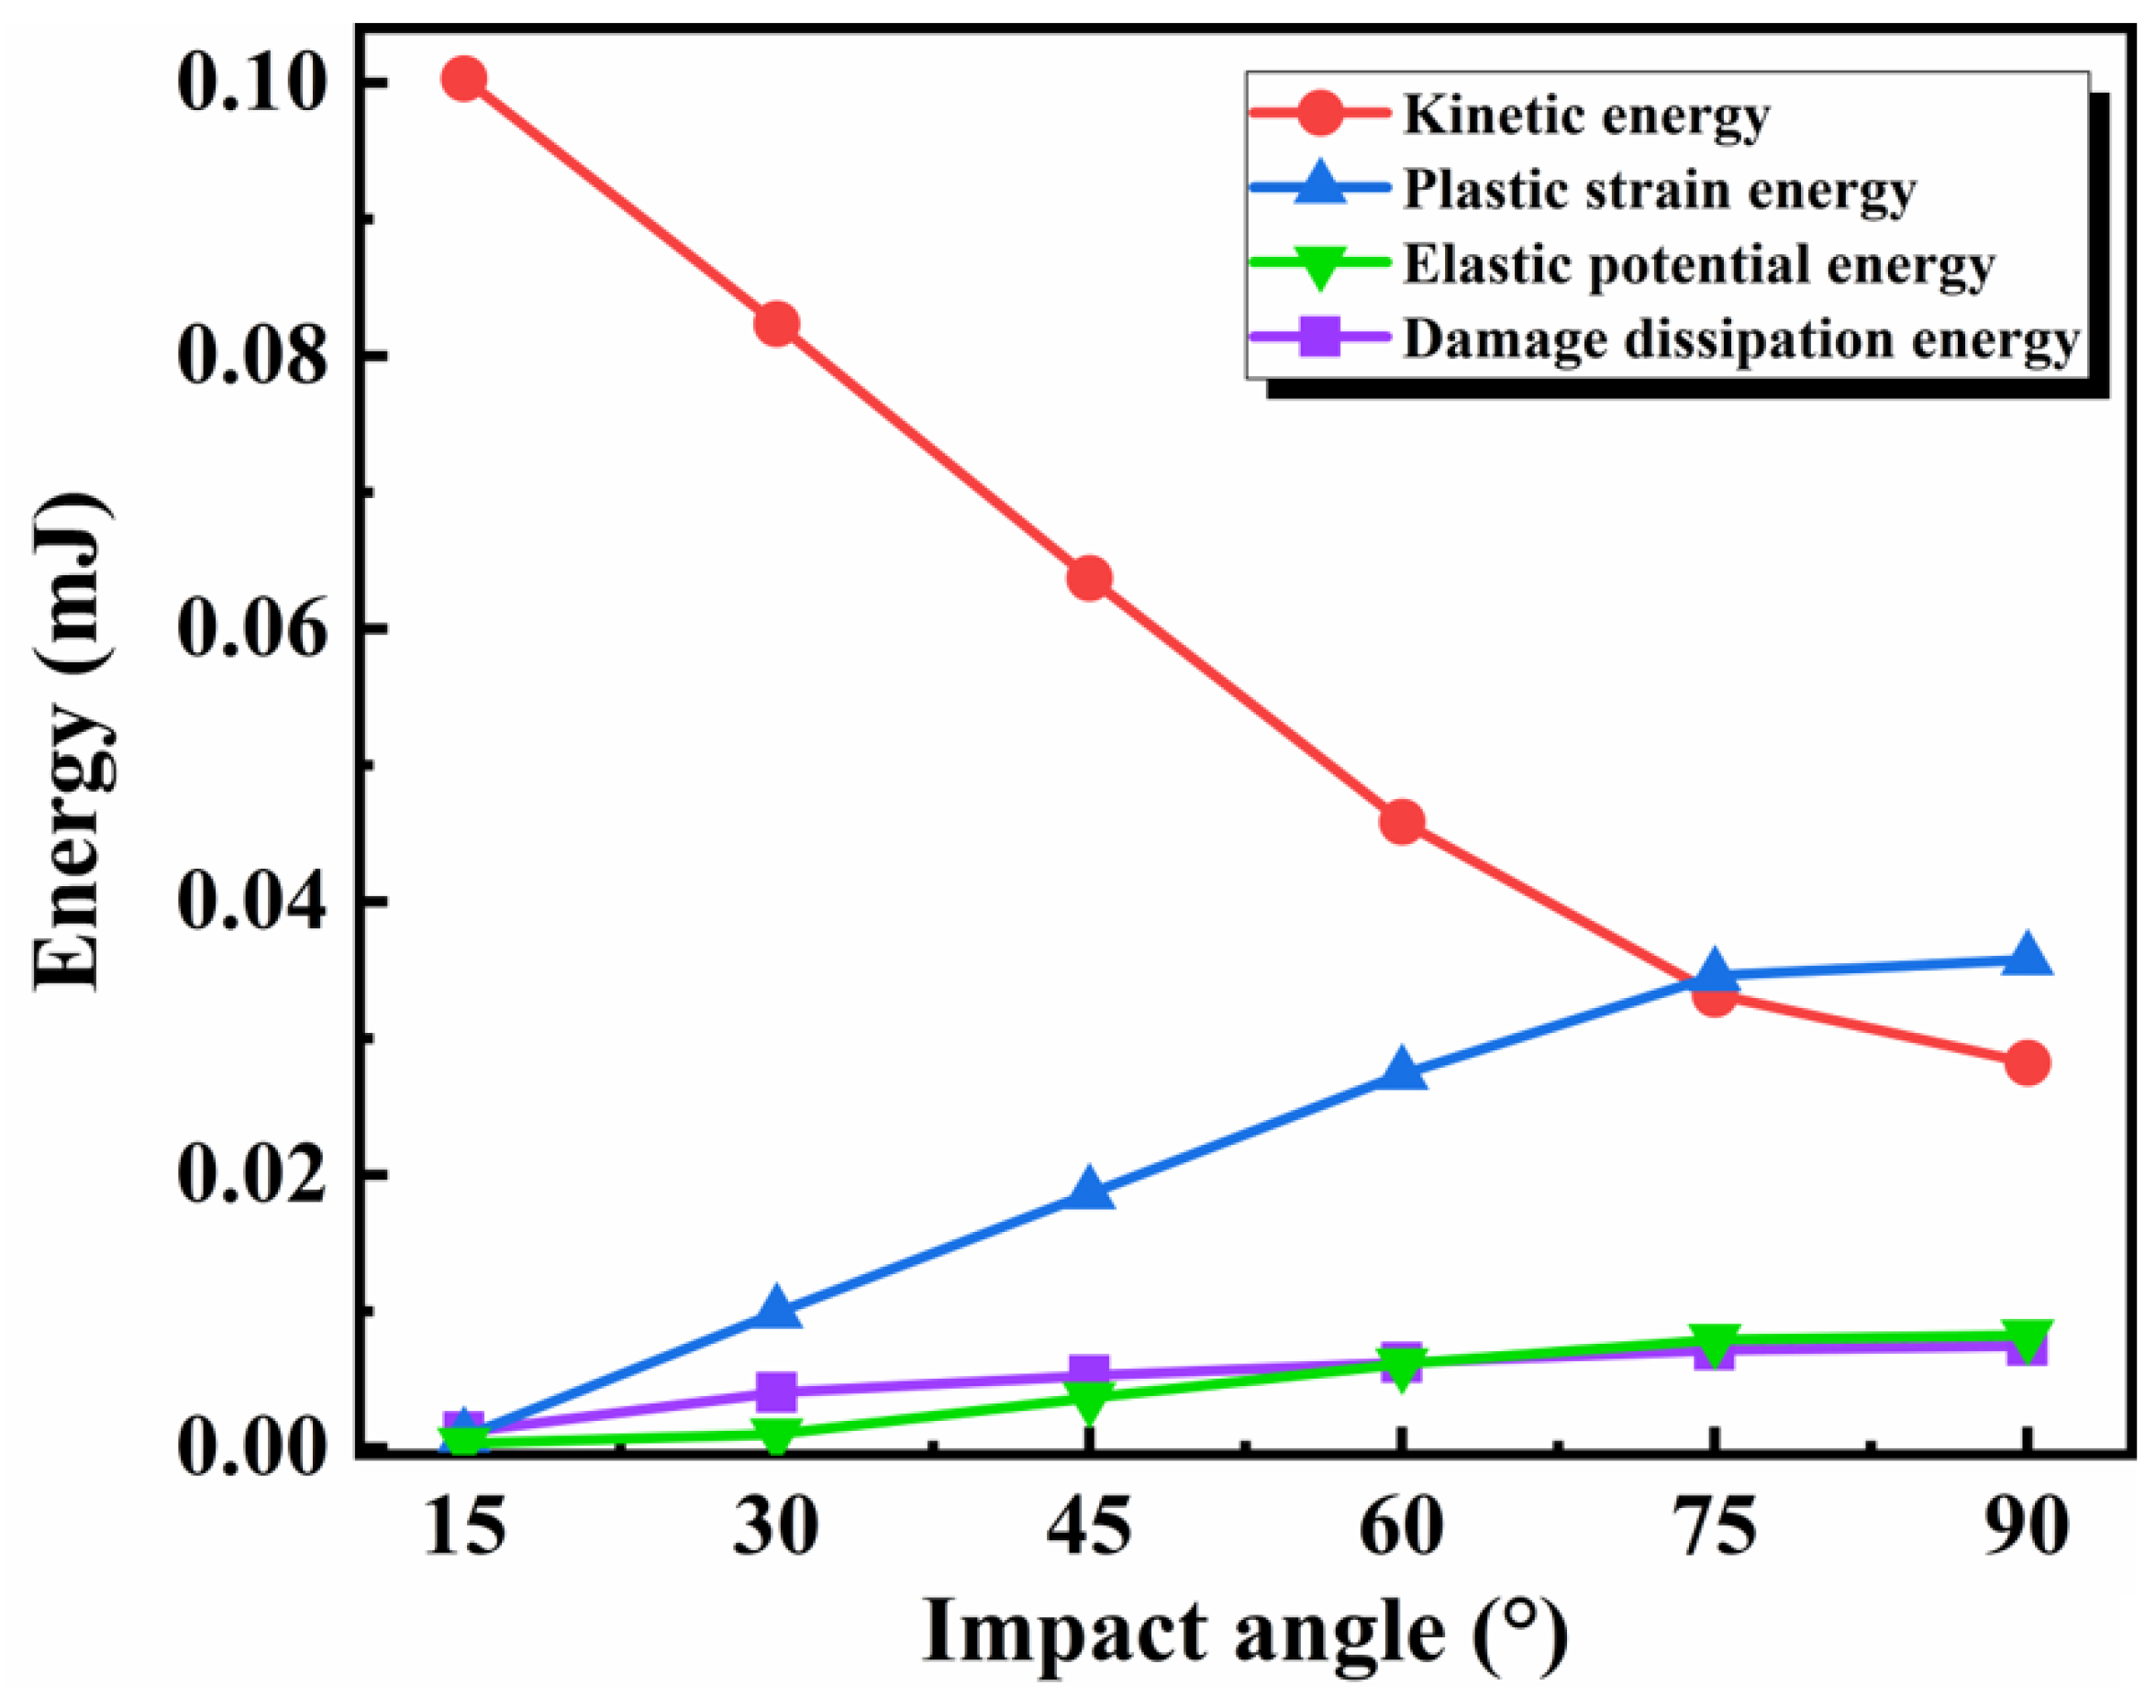
- The maximum S11 stress and plastic strain energy in the coating increases with the increase in impact angle. The increase in impact angle aggravates the damage to the coating, and the degree of coating cracks and material delamination intensify.
Author Contributions
Funding
Institutional Review Board Statement
Informed Consent Statement
Data Availability Statement
Conflicts of Interest
References
- Cao, X.; He, W.; He, G.; Liao, B.; Zhang, H.H.; Li, Y.H. Effects of DLC and TiN coatings on sand erosion resistance of TC4 titanium alloy. China Surf. Eng. 2016, 29, 60–67. [Google Scholar]
- Li, D.; Liang, E.; Li, Y.; Zhao, Y.; Xu, M.; Yu, M. Wind tunnel experimental study on erosion and wear characteristics of wind turbine blade coating. Acta Energiae Solaris Sin. 2022, 43, 196–203. [Google Scholar]
- Liu, S.; Cen, H.; Liu, G. Numerical simulation of blade coating eroded by random Aeolian sand. Mech. Sci. Technol. Aerosp. Eng. 2023, 42, 808–813. [Google Scholar]
- He, G.; Li, Y.; Chai, Y.; Zhang, Y.F.; Wang, G. Review of key issues on coating against sand erosion of aero-engine compressor blade. Acta Aeronaut. Astronaut. Sin. 2015, 36, 1733–1743. [Google Scholar]
- Marc, P.; Richard, S.; Lynne, P. Solid particle erosion testing of helicopter rotor blade materials. J. Fail. Anal. Prev. 2012, 12, 96–108. [Google Scholar]
- Wan, D.; Chen, S.; Zhang, B.; Li, D.; Zhen, Q. Design of experimental device for erosion and wear of wind turbine blade coating. Mach. Tool Hydraulic 2023, 51, 94–98. [Google Scholar]
- Yang, W.; Dong, C.; Qi, Y.; Heng, W. Corrosion characteristics of titanium alloy seawater pipeline system materials. Equip. Environ. Eng. 2019, 16, 36–39. [Google Scholar]
- Wu, X.; Li, W.; Lu, F. Research of protective coating to the titanium alloy blade. Equip. Environ. Eng. 2006, 3, 116–129. [Google Scholar]
- Gao, J.; Zhang, Y.; Wang, J.; Su, L.; Wu, G.; Qi, G. Study on coatings erosion of wind turbine blades under sand-carrying wind. Acta Energiae Solaris Sin. 2020, 41, 367–371. [Google Scholar]
- Hao, F.; Xing, Y.; Yang, S. Erosion-wear behavior of steel structure coating subject to sandstorm. Tribology 2010, 30, 26–31. [Google Scholar]
- Hao, F.; Xing, Y.; Yang, S.; Duan, G.; Ren, Y. The erosion-wear mechanical properties of the coating of steel structure subject to sandstorm. Chin. J. Appl. Mech. 2013, 30, 350–355. [Google Scholar]
- Feuerstein, A.; Kleyman, A. Ti-N multilayer systems for compressor airfoil sand erosion protection. Surf. Coat. Technol. 2009, 204, 1092–1096. [Google Scholar] [CrossRef]
- Laguna, J.R.; Cruz, L.A.; Anzelmetti, J.C.; Marquina, A.; Vite, M.; Martinez, J. Solid particle erosion on coatings employed to protect die casting molds. Prog. Org. Coat. 2012, 74, 750–757. [Google Scholar] [CrossRef]
- Reedy, M.W.; Eden, T.J.; Potter, J.K.; Wolfe, D.E. Erosion performance and characterization of nanolayer (Ti, Cr) N hard coatings for gas turbine engine compressor blade applications. Surf. Coat. Technol. 2011, 206, 464–472. [Google Scholar] [CrossRef]
- Zhang, H.; Li, Z.; Ma, C.; He, W.; Cao, X.; Li, Y. The anti-sand erosion performance of TiN films fabricated by filtered cathodic vacuum arc technique at different nitrogen flow rates. Ceram. Int. 2019, 45, 10819–10825. [Google Scholar] [CrossRef]
- Kiryukhantsev, P.V.; Phiri, J.; Gladkov, V.I.; Ratnikov, S.N. Levashov, E.A. Erosion and abrasion resistance, mechanical properties, and structure of the TiN, Ti-Cr-Al-N and Cr-Al-Ti-N coatings deposited by CFUBMS. Prot. Met. Phys. Chem. Surf. 2019, 55, 913–923. [Google Scholar] [CrossRef]
- Borawski, B.; Todd, J.A.; Singh, J.; Wolfe, D.E. The influence of ductile interlayer material on the particle erosion resistance of multilayered TiN based coatings. Wear 2011, 271, 2890–2898. [Google Scholar] [CrossRef]
- Pei, C.; Sun, D.; Zhang, S. Toughening and toughness evaluation of hard ceramic coatings: A critical review. China Surf. Eng. 2016. [Google Scholar]
- Xu, W.; He, G.; Cai, Z.; Liao, B.; Cao, X.; He, W. Damage analysis of TiN/Ti coatings under cycling impact with hard particles. China Surf. Eng. 2017, 30, 28–35. [Google Scholar]
- Bousser, E.; Martinu, L.; Klemberg-Sapieha, J.E. Solid particle erosion mechanisms of protective coatings for aerospace applications. Surf. Coat. Technol. 2014, 257, 165–181. [Google Scholar] [CrossRef]
- Khoddami, A.; Salimi-Majd, D.; Mohammadi, B. Finite element and experimental investigation of multiple solid particle erosion on Ti-6Al-4V titanium alloy coated by multilayer wear-resistant coating. Surf. Coat. Technol. 2019, 372, 173–189. [Google Scholar] [CrossRef]
- Di, J.; Wang, S.; Zhang, L.; Cai, L.-X.; Xie, Y.-H. Study on the erosion characteristics of boride coatings by finite element analysis. Surf. Coat. Technol. 2018, 333, 115–124. [Google Scholar] [CrossRef]
- Guo, L.; Chen, Z.; Luo, J.; Chen, G. A review of the extended finite element method and its applications. Chin. Q. Mech. 2011, 32, 612–625. [Google Scholar]
- Fang, X.; Jin, F. Extended finite element method based on ABAQUS. Eng. Mech. 2007, 24, 6–10. [Google Scholar]
- Liu, Y.; Li, C.; Mou, Y. Finite difference numerical modeling of any even-order accuracy. Oil Geophys. Prospect. 1998, 33, 1–10. [Google Scholar]
- Pei, Z. Simulation of elastic wave equations in three-dimensional isotropic media using staggered high-order finite difference method. Geophys. Prospect. Pet. 2005, 44, 308–315. [Google Scholar]
- Xu, Y.; Sun, Q.; Zhang, L.; Huang, W. Advances in discrete element methods for particulate materials. Adv. Mech. 2003, 33, 251–260. [Google Scholar]
- Kieckhefen, P.; Pietsch, S.; Dosta, M.; Heinrich, S. Possibilities and limits of computational fluid dynamics–discrete element method simulations in process engineering: A review of recent advancements and future trends. Annu. Rev. Chem. Biomol. Eng. 2020, 11, 397–422. [Google Scholar] [CrossRef] [PubMed]
- Zhang, Y.; He, G.; Wang, X.; He, W.; Chai, Y. Numerical Simulation on the erosion behavior of aeroengine blade substrate with TiN/Ti Coating. Surf. Technol. 2015, 44, 81–85. [Google Scholar]
- Zhang, J.; Zhang, M.; Zhai, P.; Liu, L.; Shi, H. Numerical simulation on the impact resistance of functionally graded materials. Int. J. Mater. Prod. Technol. 2011, 42, 87–97. [Google Scholar] [CrossRef]
- Ma, Q.; Lai, F. Grain Size Characteristics of Populus Euphratica Sandpile on the West Side of Hotan River in the Taklimakan Desert. Desert Oasis Meteorol. 2020, 14, 114–120. [Google Scholar]
- Wang, X.; Shi, J. Validation of Johnson-Cook plasticity and damage model using impact experiment. Int. J. Impact Eng. 2013, 60, 67–75. [Google Scholar] [CrossRef]
- Naveed, M.; Obrosov, A.; Weiss, S. Investigation of the wear resistance properties of Cr/CrN multilayer coatings against sand erosion. In European Symposium on Friction, Wear, and Wear Protection; Under the auspices of the German Materials Research Society DGM: Mahdia, Tunisia, 2015; p. 873543. [Google Scholar]
- Chen, W.; Li, Z.; Zhao, Z. Failure mechanism of TiN/Ti strength and tough coating under high-speed sand-dust erosion. J. Aerosp. Power 2019, 34, 1866–1872. [Google Scholar]


| Material Name | Ti-6Al-4V | TiN | Ti | Al2O3 |
|---|---|---|---|---|
| Density (kg·m−3) | 4428 | 5400 | 4500 | 3970 |
| Elastic modulus (GPa) | 113.8 | 480 | 110 | 344 |
| Poisson’s ratio | 0.34 | 0.27 | 0.33 | 0.2 |
| Material Property | Symbol | Ti-6Al-4V | Ti |
|---|---|---|---|
| J-C yield strength | A (MPa) | 1098 | 277 |
| J-C hardening coefficient | B (MPa) | 1092 | 894 |
| J-C strain hardening exponent | n | 0.93 | 0.57 |
| J-C strain rate constant | C | 0.014 | 0.06 |
| J-C reference strain rate | 1 | 1 |
Disclaimer/Publisher’s Note: The statements, opinions and data contained in all publications are solely those of the individual author(s) and contributor(s) and not of MDPI and/or the editor(s). MDPI and/or the editor(s) disclaim responsibility for any injury to people or property resulting from any ideas, methods, instructions or products referred to in the content. |
© 2024 by the authors. Licensee MDPI, Basel, Switzerland. This article is an open access article distributed under the terms and conditions of the Creative Commons Attribution (CC BY) license (https://creativecommons.org/licenses/by/4.0/).
Share and Cite
Yuan, Z.; Shi, W.; He, G.; Chai, Y.; Yang, Z.; Guo, M. Simulation of TiN/Ti Multilayer Coating under the Impact of Multiple Particles Based on Cohesive Element. Coatings 2024, 14, 470. https://doi.org/10.3390/coatings14040470
Yuan Z, Shi W, He G, Chai Y, Yang Z, Guo M. Simulation of TiN/Ti Multilayer Coating under the Impact of Multiple Particles Based on Cohesive Element. Coatings. 2024; 14(4):470. https://doi.org/10.3390/coatings14040470
Chicago/Turabian StyleYuan, Zhanwei, Wenlong Shi, Guangyu He, Yan Chai, Zhufang Yang, and Min Guo. 2024. "Simulation of TiN/Ti Multilayer Coating under the Impact of Multiple Particles Based on Cohesive Element" Coatings 14, no. 4: 470. https://doi.org/10.3390/coatings14040470
APA StyleYuan, Z., Shi, W., He, G., Chai, Y., Yang, Z., & Guo, M. (2024). Simulation of TiN/Ti Multilayer Coating under the Impact of Multiple Particles Based on Cohesive Element. Coatings, 14(4), 470. https://doi.org/10.3390/coatings14040470