Article

Development of pH Indicator Composite Films Based on Anthocyanins and Neutral Red for Monitoring Minced Meat and Fish in Modified Gas Atmosphere (MAP)

1
Department of Plant and Environmental Sciences, University of Copenhagen, DK-1871 Frederiksberg C, Denmark
2
Danish Technological Institute, Danish Meat Research Institute (DMRI), Taastrup, Gregersensvej 1, DK-2630 Taastrup, Denmark
3
Niels Bohr Institute, Universitetsparken 5, DK-2100 København Ø, Denmark
4
Department of Food Science, University of Copenhagen, DK-1958 Frederiksberg C, Denmark
*
Author to whom correspondence should be addressed.
Coatings 2024, 14(6), 725; https://doi.org/10.3390/coatings14060725
Submission received: 27 March 2024 / Revised: 27 May 2024 / Accepted: 28 May 2024 / Published: 6 June 2024
(This article belongs to the Special Issue Novel Advances in Food Contact Materials)

Abstract

:
Fresh meat and fish are widely consumed foods with short and very short shelf lives, respectively. Efficient supply chains and the judicious use of food packaging are the most effective means of extending shelf life and thus reducing food waste and improving food safety. Food packaging that allows for the use of a modified atmosphere (MAP) is effective in extending the period where the food is both palatable and safe. However, monitoring the state of aging and the onset of spoilage of the product poses challenges. Microbial counts, pH measurements, and sensory evaluations are all informative but destructive and are therefore only useful for monitoring quality via sampling. More attractive would be a technology that can follow the progress of ageing in an individual product while leaving the food packaging intact. Here, we present a pH indicator to be placed inside each package that may be read by the naked eye. It is a colorimetric indicator with a matrix made of pure amylose (AM; 99% linear α-glucans) and cellulose nanofibers (CNFs). Suitable mechanical properties of films cast of the two polysaccharides were achieved via the optimization of the blending ratio. The films were loaded with either of two pH indicators: anthocyanin extracts from red cabbage (RCA) and the synthetic dye neutral red (NR). Mechanical, thermal, permeability, microstructural, and physical properties were tested for all composite films. Films with 35% CNF (35AC-RCA) and (35AC-NR) were selected for further study. Minced meat was packaged under MAP conditions (70% O2 + 30% CO2), while minced fish was packaged under MAP (70% N2 + 30% CO2) and stored at 5 °C for 20 days. Microbial growth, pH, and sensory scores of the minced meat systems differentiated between fresh (0–6 days) and medium-fresh (7–10 days), and minced fish between fresh (0–10 days) and medium-fresh (11–20 days). The total color difference showed that the RCA indicator was able to differentiate between fresh (red) and medium-fresh (pink-red) minced meat, while for minced fish, this indicator discriminated between three stages: fresh (red), medium-fresh (pink-red), and spoiled (pink-blue). The NR indicator failed to discriminate the freshness of either meat or fish under the effect of MAP. Pearson correlation statistical models showed a correlation between color change of the indicator, pH, content of gases, and gas content. In summary, RCA immobilized in an AM + 35% CNF nanocomposite film can monitor the freshness of packaged minced meat/fish under the effect of MAP via color change that may be evaluated with the naked eye.

1. Introduction

Fresh meat and fish age quickly due to endogenous biochemical reactions and spoil easily due to microbial contamination. Spoilage is a complex process, and only a subset of the changes (color and flavor) present as external features. Most methods for monitoring these changes are complicated to implement and time-consuming [1,2].
Intelligent packaging is a system that creates an optimal environment for the food product and, in the best-case scenario, also monitors this environment while providing a suitable read-out by which to alert the user to the onset of spoilage. Known indicators comprise freshness gas indicators and time–temperature indicators [3]. Previous studies on meat and fish freshness have been based on volatile compounds released by microbial spoilage, typically resulting in increasing pH inside package headspace. For example, a colorimetric indicator with polyvinyl alcohol/chitosan matrix nanoparticles loaded with mulberry extract as the pH-sensitive component was effective in monitoring pH variations in spoiled fish. The color of the film changed from red to green as the fish spoiled [4].
There is a growing interest in colorimetric films produced using natural dyes and biopolymers due to their general safety and biodegradability. Anthocyanins are natural water-soluble pigments found in colored plants that change color with pH over wide ranges. Several biodegradable biopolymers loaded with a variety of anthocyanins have been reported to be useful for the fabrication of pH-sensing films. For example, corn starch/glycerol containing anthocyanin extracted from blueberry agro–industrial waste has been used [5]. Visual pH-sensing films based on starch–polyvinyl alcohol (SPVA) containing Roselle anthocyanin were demonstrated to be suitable for monitoring the freshness of silver carp during storage [6]. An on-package sticker sensor based on methyl red was developed to successfully monitor beef and fish freshness, respectively [7,8].
An additional study showed that the incorporation of artificial dyes such as neutral red (NR) in a gelatin matrix reduced the moisture content and water solubility (WS) compared to methyl orange (MO) and bromocresol green (BBG) [9]. Moreover, NR incorporation did not affect water vapor permeability (WVP) and improved the mechanical properties as it significantly increased the tensile properties and Young’s modulus and reduced the elongation at break. This may be attributed to NR crosslinking with the gelation network. BBG did not interfere with the gelatin matrix.
Most packaging films are produced from plastic polymers. Recently, biopolymer-based materials derived from natural sources have been considered potential substitutes for conventional plastics due to their abundance, biodegradability, and low price. Starch and cellulose are two abundant plant-derived polysaccharides. These resources provide promising raw materials for the development of biodegradable materials. Starch and cellulose are both composed of D-glucose. Cellulose is semi-crystalline, featuring only β-1,4-glycosidic linkages; starch consists of two types of molecules: amylose (AM) and amylopectin (AP) [10,11]. AM is a mainly linear molecule linked with α-1,4 linkages and is only sparsely α-1,6 branched. Until recently, AM has not been attainable in large quantities at a reasonable price. However, the production of pure AM in a transgenic barley grain system has permitted the bulk production of this high-value polysaccharide [12]. Due to its mainly linear structure, AM is considered to be an optimal raw material for bioplastic purposes, and our previous work has demonstrated that AM can afford significantly higher mechanical strength compared to normal starch due to its high gelatinization temperature, showing high thermal stability comparable to semi-natural bioplastics such as MaterBi® [13,14].
Colorimetric pH indicator films based on AM (99%) and RCA have been studied, showing higher compatibility due to the interaction between the double helices and RCA compared to normal starch [14]. Blending AM with other natural biopolymers has the potential to enhance the mechanical, thermal, and barrier properties [15], such as in the case of cellulose, which is a linear homo-polysaccharides linked via β-1,4 glycosidic bonds. Cellulose nanofibers (CNFs) have the advantage of a high specific surface area, which is favorable for composite materials. The development of composites and polymer blends with the aim of achieving enhanced functionality has been shown to be one of the most cost-effective methods of modifying the bulk properties of individual polymers [10,16,17]. Another intelligent pH indicator based on starch and cellulose was developed via the incorporation of alizarin to monitor the freshness of rainbow trout fish [18]. This eco-friendly renewable biopolymer showed higher color sensitivity to ammonia and stability at 4 and 25 °C.
In this study, we evaluate pH indicators placed on meat and fish sealed under MAP. The amount of data in the literature on indicators of minced meat and fish freshness in MAP is limited; hence, more studies designing simple methods to provide information about freshness status are required [19]. The purpose of this study was to improve and assess colorimetric food package labels for the shelf-life assessment of packaged minced meat and minced fish under MAP conditions under cold storage. The composite indicators loaded with RCA and compared to the synthetic dye NR provided prototypes of pure AM and AM-CNF composites with the two dyes. AM with RCA (AM-RCA), AM and neutral red (AM-NR), and equivalent CNF systems (AC-RCA and AC-NR) were compared, as were the AM:CNF blend films. They were tested for their mechanical properties, gas and water permeability, and thermal properties. The films were structurally evaluated via Fourier transform infrared (FT-IR) spectroscopy and wide-angle X-ray scattering (WAXS). The physical and optical properties and surface morphology of the films were also recorded.

2. Materials and Methods

2.1. Materials and Reagents

AM was extracted from barely and purified from a genetically modified AM-producing line produced by RNA interference suppressing all three starch branching enzymes derived from Golden Promise d [12]. Chr. Hansen A/S (Hørsholm, Denmark) provided anthocyanins (water-soluble) from red cabbage. Merck (Darmstadt, Germany) provided all other chemicals used. Neutral red (NR, 2, 8-Phenazinediamine, N8, N8, 3-trimethyl-, monohydrochloride) was purchased from Carbosynth, USA. Sugar beet pulp was obtained as an agro-industrial side stream by Nordic Sugar A/S and CNF extracted as described [20].

2.2. Preparation of pH Indicator Films

The films were prepared by casting [15]. For this process, 2% AM and 1% CNF solutions were prepared. The varying percentages of CNF (1%) were loaded with the solution (5%, 10%, 15%, 25%, and 35%) of AM (2%). Glycerol 30% wt. was added, and all the constituents were heated at 140 °C using a high-pressure glass reactor. The solutions were cooled to approximately 70 °C, and 50 mg of RCA and 5 mg of NR were added to each solution, respectively. The films were dried at 50 °C in a ventilated oven.
All of the samples were named to indicate the percentage of CNF loaded; two groups of films were denoted as control samples: AM-RCA, where AM 2% solution contained 50 mg of RCA, and the AM-NR sample, containing AM 2% and 5 mg of NR. Nano-composite films were denoted as 5AC-RCA for a sample containing 5% CNF, 95% AM, and 50 mg of RCA. Additionally, the 5AC-NR sample contained 5% CNF, 95% AM, and 5 mg of NR. All films were placed in a sealed desiccator containing saturated sodium bromide (RH 50%, 20 °C) to equilibrate the moisture before analysis.

2.3. Characterization of Indicator Films

2.3.1. Moisture Content

The water content of the films was determined using a gravimetric protocol [21,22]. Film samples (2 × 2 cm) and their initial mass was measured (Mi), then dried in an oven at 105 °C for 24 h, and the mass was recorded (Mf). The moisture content of the films was calculated accordingly (Equation (1)):
MC % = Mi Mf Mi × 100

2.3.2. Solubility in Water

The total soluble matter was analyzed as described in [23]. Films (2 cm × 2 cm) were immersed in MilliQ water (50 mL) and placed in a shaking incubator (ES20-Benchtop shaking incubator. BIOSAN, Riga, Latvia) at 120 rpm at room temperature (25 ± 2 °C) for 24 h (W1). The samples were removed from the solution and dried in an oven at 105 °C for 24 h before the mass calculation (W2). Finally, the solubility of the films in water was calculated using Equation (2):
S o l u b i l i t y   % = W 1 W 2 W 1 × 100  

2.3.3. Fourier Transform Infra-Red (FT-IR) Spectroscopy

The FT-IR spectra of the film samples were recorded on a Bomem MB100 FTIR spectrometer (ABB-Bomem, Québec, QC, Canada) using an attenuated total reflectance (ATR) single reflectance cell with a diamond crystal. The samples were scanned 64 times over the range of 4000–600 cm1 at a resolution of 4 cm−1 against air as the background. The FTIR spectra were used to identify the chemical interactions between the matrices and natural fillers. Each sample was scanned twice to observe acceptable reproducibility [24].

2.3.4. Wide-Angle X-ray Scattering (WAXS)

WAXS analysis of the film was conducted using a Nano-inXider instrument from Xenocs (Grenoble, France) using a Cu Kα source with a 1.54 Å wavelength and a 2D 300 K Pilatus detector (Dectris Ltd., Baden, Switzerland). The samples were placed between mica windows, and the background was subtracted from the measured spectra. The total relative crystallinity was calculated as the ratio of the crystalline peak area to the total diffraction area using Peak Fit software (Version 4.0. Systat Software Inc., San Jose, CA, USA) [25].

2.3.5. Thermogravimetric Analysis (TGA)

Thermogravimetric analysis coupled with Fourier Transform Infrared Spectroscopy was used to characterize the thermal stability of the different films. All of the samples were tested using TG 209 F1 Libra PERSEUS from the NETZSCH Experiment, which was carried under a N2 atmosphere (20 mL/min) with a heating rate of 10 K/min. The measurements were obtained between 28 °C and 600 °C in a standard Al2O3 crucible using an automatic sample changer. An empty crucible was also measured for instrument correction. The data were analyzed using the software provided by NETZSCH, Proteus 8 software [26].

2.3.6. Permeability

The barrier properties of water vapor, O2, and CO2 were evaluated as described in [15,24]. The films were analyzed using a MultiPerm apparatus (Extra Solution s.r.l, Pisa, Italy) following standard protocols (ASTM D3985-05, 2010; ASTM F-2476-13, 2013). Each sample was placed into the instrument, creating a separate septum between two semi-chambers. A permeant gas stream streamed through the upper chamber, permeated through the sample, and was then detected by the carrier gas and detected using a sensor. This process occurred at 25 °C, with continuous monitoring of relative humidity (50%), flow rate, and other variables affecting sample permeation. Masks made of aluminum were used to decrease the film test area to 2 cm2, and the films were measured in duplicates [24].

2.3.7. Mechanical Measurements

The thickness of each film was determined in five replicates using a handheld digital micrometer (148–121 Zhongtian Experimental Instrument Co., Ltd., Shanghai, China). Tensile tests of the starch films were achieved using a TA-XT plus texture analyzer (TTC Company, Surry, UK) with a grip accessory and a 50 kg load cell. Starch and starch indicator films were cut into 10 cm × 1 cm strips and equilibrated at 60% relative humidity at 22 °C for 5 days. The measured parameters (Young’s modulus, tensile strength, toughness, and strain to failure) were calculated from the obtained stress–strain curves. Data for each material were based on 3–5 replicates [17].

2.3.8. Field Emission Scanning Electron Microscopy (FE-SEM)

FE-SEM images were assimilated with a Quanta 3D FEG (FEI Company, Eindhoven, The Netherlands). The films were censored into 1 × 1 cm, located on a metal plate, and sputtered with a 2 nm colloidal gold layer before analysis. The cross-section and morphology of the film specimens were cryo-fractured via immersion in liquid nitrogen and then attached on aluminum stubs perpendicularly to their surface and then sputtered with gold prior to analysis [14,15].

2.3.9. Opacity and Light Barrier Properties

The barrier to UV/Vis light was tested according to [27]. The films (3 mm × 3 mm) were fixed in the UV-Vis spectrophotometer (BioTeK Synergy H1, Santa Clara, CA, USA) so that the light beam passed through the film surfaces. Transmittance measurements were recorded at wavelengths between 200 and 800 nm. The analyses were performed in triplicate.

2.4. Monitoring Minced Meat and Minced Fish Films

2.4.1. Sample Preparation

A frozen Pengasius fish filet was purchased from a local Danish market, thawed and chopped. The beef was freshly purchased and chopped. Samples of minced fish or minced meat (200 g) were packed in the tray sealer in a polypropylene box. The composite indicator films of 35AC-RCA and 35AC-NR were selected and placed in a weighing boat placed on top of the minced fish. The trays were sealed using modified atmosphere packaging (MAP) with a gas mixture of (30% CO2 + 70% N2) (Figure 1). The packages were incubated at 5 °C for up to 3 weeks. The meat packages were sealed with a gas mixture of (30% of CO2 + 70% of O2). Five samples for each package with meat/fish samples were prepared for each sampling day over 3 weeks. The ID of the films for the meat samples are denoted as follows: RCA-meat and NR-meat, respectively. For fish samples, they are RCA-fish and NR-fish [28,29].
Control group samples were used to examine the effect of MAP on the indicators; sterile cotton (20 g) and sterile water (140 g) were used instead of meat and fish. The indicator was placed in a weighing boat and sealed with the gas mixtures (30% CO2 + 70% O2) and (30% CO2 and 70% N2) (Figure 2). Three replicate packages contained indicators of sterilized cotton and water with low-O2 and high-O2 atmospheres withdrawn randomly from the packages incubated at 5 °C. Sampling continued for three weeks.

2.4.2. Microbial Analysis

Here, 25 g of each sample was collected aseptically, placed in sterile stomacher bags, and homogenized for 2 min in 225 mL of peptone water (0.1%). A series of 10-fold dilutions was prepared and spread over an agar plate medium (Brain Heart Infusion agar, BHI, Metrohom, Denmark). Psychotropic counts were conducted after incubation for 10 days at 6.5 °C. Experiments were conducted for 5 samples of meat and fish, and microbial data were recorded as colony-forming units (CFUs) and expressed as log10 CFU/g.

2.4.3. pH Measurements

During the time intervals, the pH values of the samples were determined using a handheld pH meter (Radiometer PHM93, Metrohom, Denmark) equipped with a penetrating electrode.

2.4.4. Color Response of Indicator Films during Meat/Fish Packaging

The color of the indicator films (35AC-RCA and 35AC-NR) in the packaged samples and control samples were measured using a handheld colorimeter reader CR-20 (Konica Minolta, Tokyo, Japan), which was used to monitor the freshness indicator’s chromatic changes. The color difference ∆E was measured according to Equation (3):
∆E = ((L* − L) + (a* − a) + (b* − b))1/2
where L*, a*, and b* are the initial values of the lightness, redness, and yellowness films before immersion in the packaging, whereas L, a, and b are the values after packaging [23].

2.4.5. Gas Measurement

The gas composition of the packages was measured using a PBI Dansensor (ChekMate 9900). The measurement uncertainty was ±2%. A membrane was adhered to the package before penetration for cannula sampling. The measurement range of the instrument was set to 0–100% by volume (vol) for oxygen (O2) and carbon dioxide (CO2). The nitrogen content was calculated as a difference from 100% after the measured concentrations of O2 and CO2 were deducted. The accuracy of the device was ±2% for both gases.

2.4.6. Sensory Evaluation

A sensory evaluation was performed to evaluate the off–edible properties of the meat and fish samples (approx. 25 g) at different storage periods. The off–edible properties in this work refer to appearance and off-odor. A panel of 6 trained judges was used for the sensory tests. Each panelist received 10 series of samples (5 samples of meat + 5 samples of fish) and 2 samples hidden as a control (frost-stored) were placed in a stack per panelist. Each panelist evaluated 2 qualities, the appearance and the odor, using a 4-point scale: 1 = fresh no change; 2 = slightly diverging but acceptable; 3 = distinct changes (unacceptable); and 4 = very distinct changes (spoiled). The samples were served once, and the order of evaluation was randomized. The sensory data are based on the average of the separable scores for the four sub-samples [30].

2.4.7. Statistical Analysis

All of the tests were statistically evaluated using analysis of variance (ANOVA) and Tukey’s test HSD post hoc test of IBM SPSS Statistics at a 95% significance level. Correlation trends between pH, color parameters, sensory analysis, gas composition, and microbial count data were processed using SPSS. Significant correlation coefficients were classified as weak, moderate, and strong, corresponding to r < 0.5, r > 0.5 < 0.7, and r > 0.7, respectively.

3. Results and Discussion

3.1. Moisture Content (MC) and Water Solubility (WS)
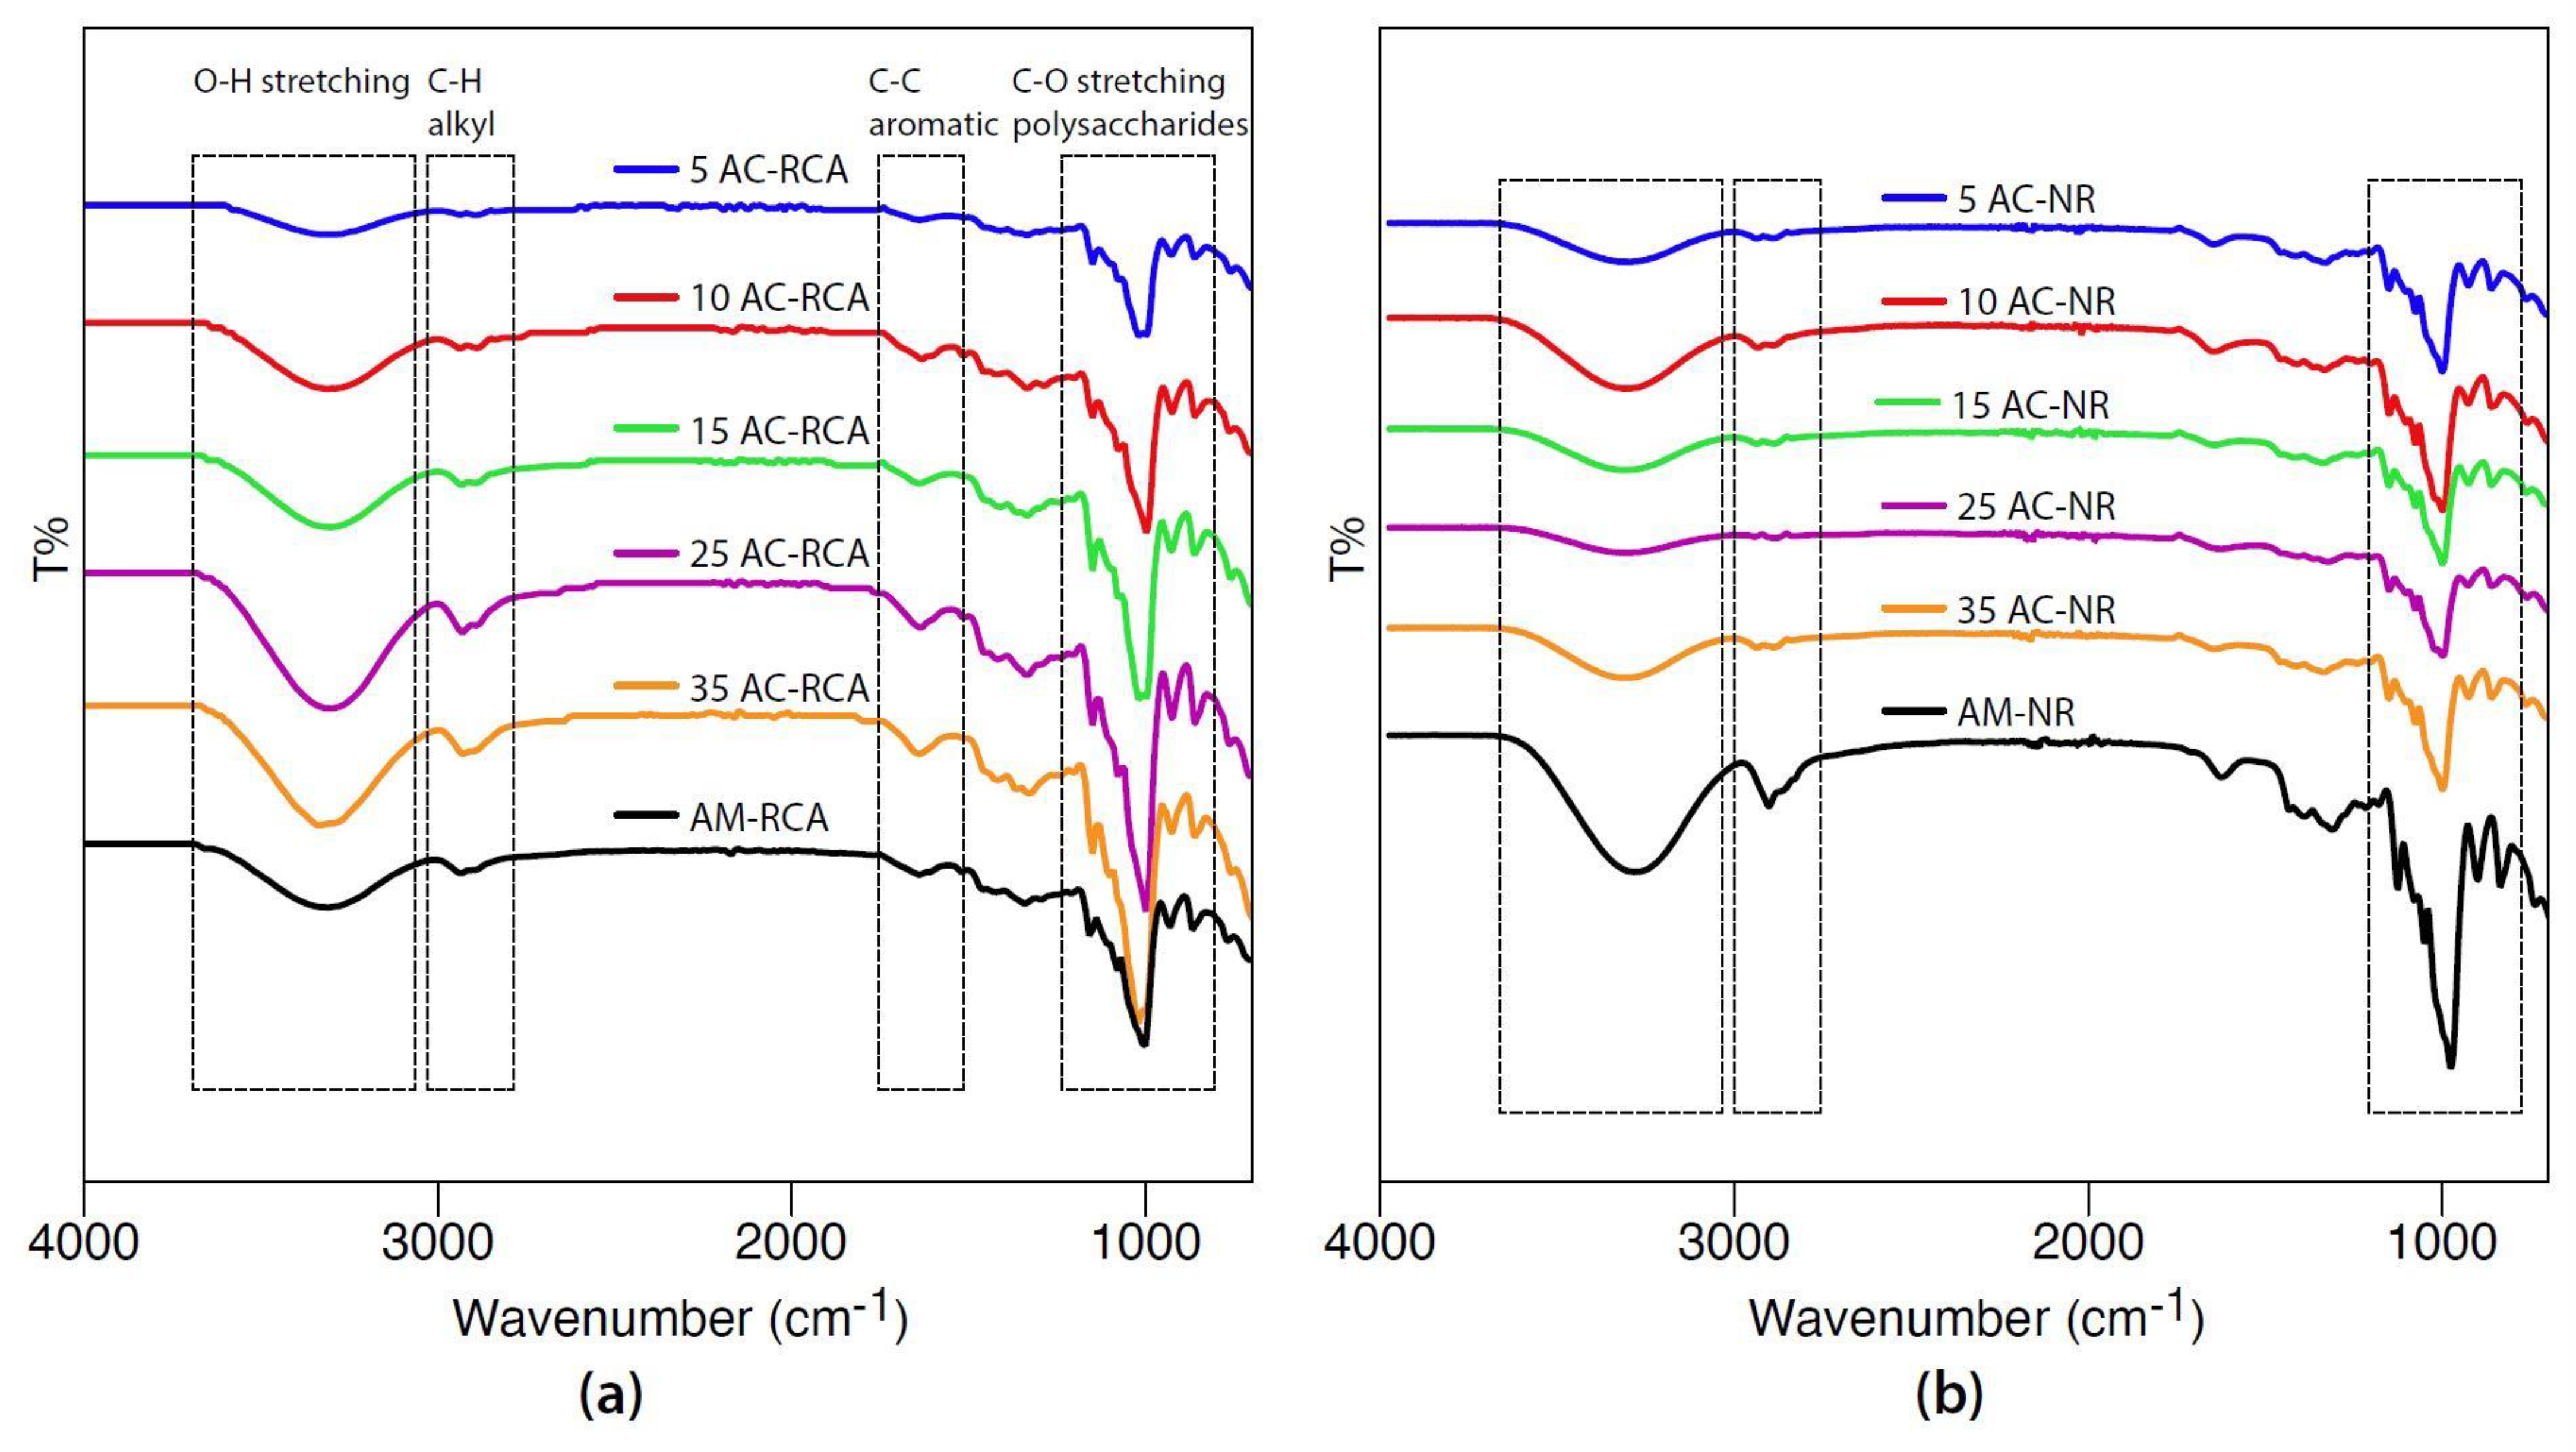
Moisture absorption is one of the most important sensing properties of an indicator film. When an indicator is placed in meat/fish packaging, high humidity in the package may have a negative effect on the color change of a pH indicator. This can lead to incorrect results. Further, after absorbing the moisture, indicators become breakable and fragile. Therefore, a lower MC is a preferable factor. The MC % of the AM-RCA and AM-NR film indicators increased after adding CNF due to the small size of the fibers (Table 1). Adding CNF to the AM should reduce the moisture content because AM is more hydrophilic than CNF, and the presence of RCA and NR lowers the interaction between AM and CNF chains.
WS was used to determine the water sensitivity towards AM-RCA/AM-NR in relation to CNF composite films (Table 1). Potential applications may require lower WS to improve product integrity. The films were unable to keep their integrity when dispersed in water. The addition of CNF increased the WS % due to the hydrophilic molecules of RCA being triggered, reducing the intermolecular interactions in the AM-CNF composite film [31]. Therefore, the free side groups of CNF molecules might interact with water and interrupt the network’s hydrogen bonds, decreasing the cohesiveness of the AM-CNF matrix and increasing water moisture absorbance. RCA and NR showed no significant difference in the composite films [32].

3.2. FT-IR

FTIR analysis was employed to detect the presence of possible new compounds or physical interactions that were formed during the process. The ATR FTIR spectra (Figure 3) of the AM-RCA films showed O-H stretching corresponding to a broad band of 3600–3200 cm1 due to the extensive H-bonding network among the OH of AM glycerol and CNF. C-H stretching was observed at 2900 cm1. An absorption band at 1650 cm1 was assigned to the water adsorbed due to the hygroscopic nature of polysaccharides. The peaks at 1050 to 950 cm−1, assigned to C-O-C stretching, showed a slight shift towards a higher wavenumber for the 35AC-RCA composite film from 1000 cm1 to 1030 cm1; this could be attributed to the hydrogen bond between the hydroxyl group of AM, RCA, and cellulose. No new covalent bonds formed between the AM and CNF composite films. In RCA composite films, the peak at 1514 cm1 was attributed to the phenolic groups of anthocyanins (Figure 3a). AM-NR composite films revealed no new peaks or shifts related to NR or CNF (Figure 3b) [15].

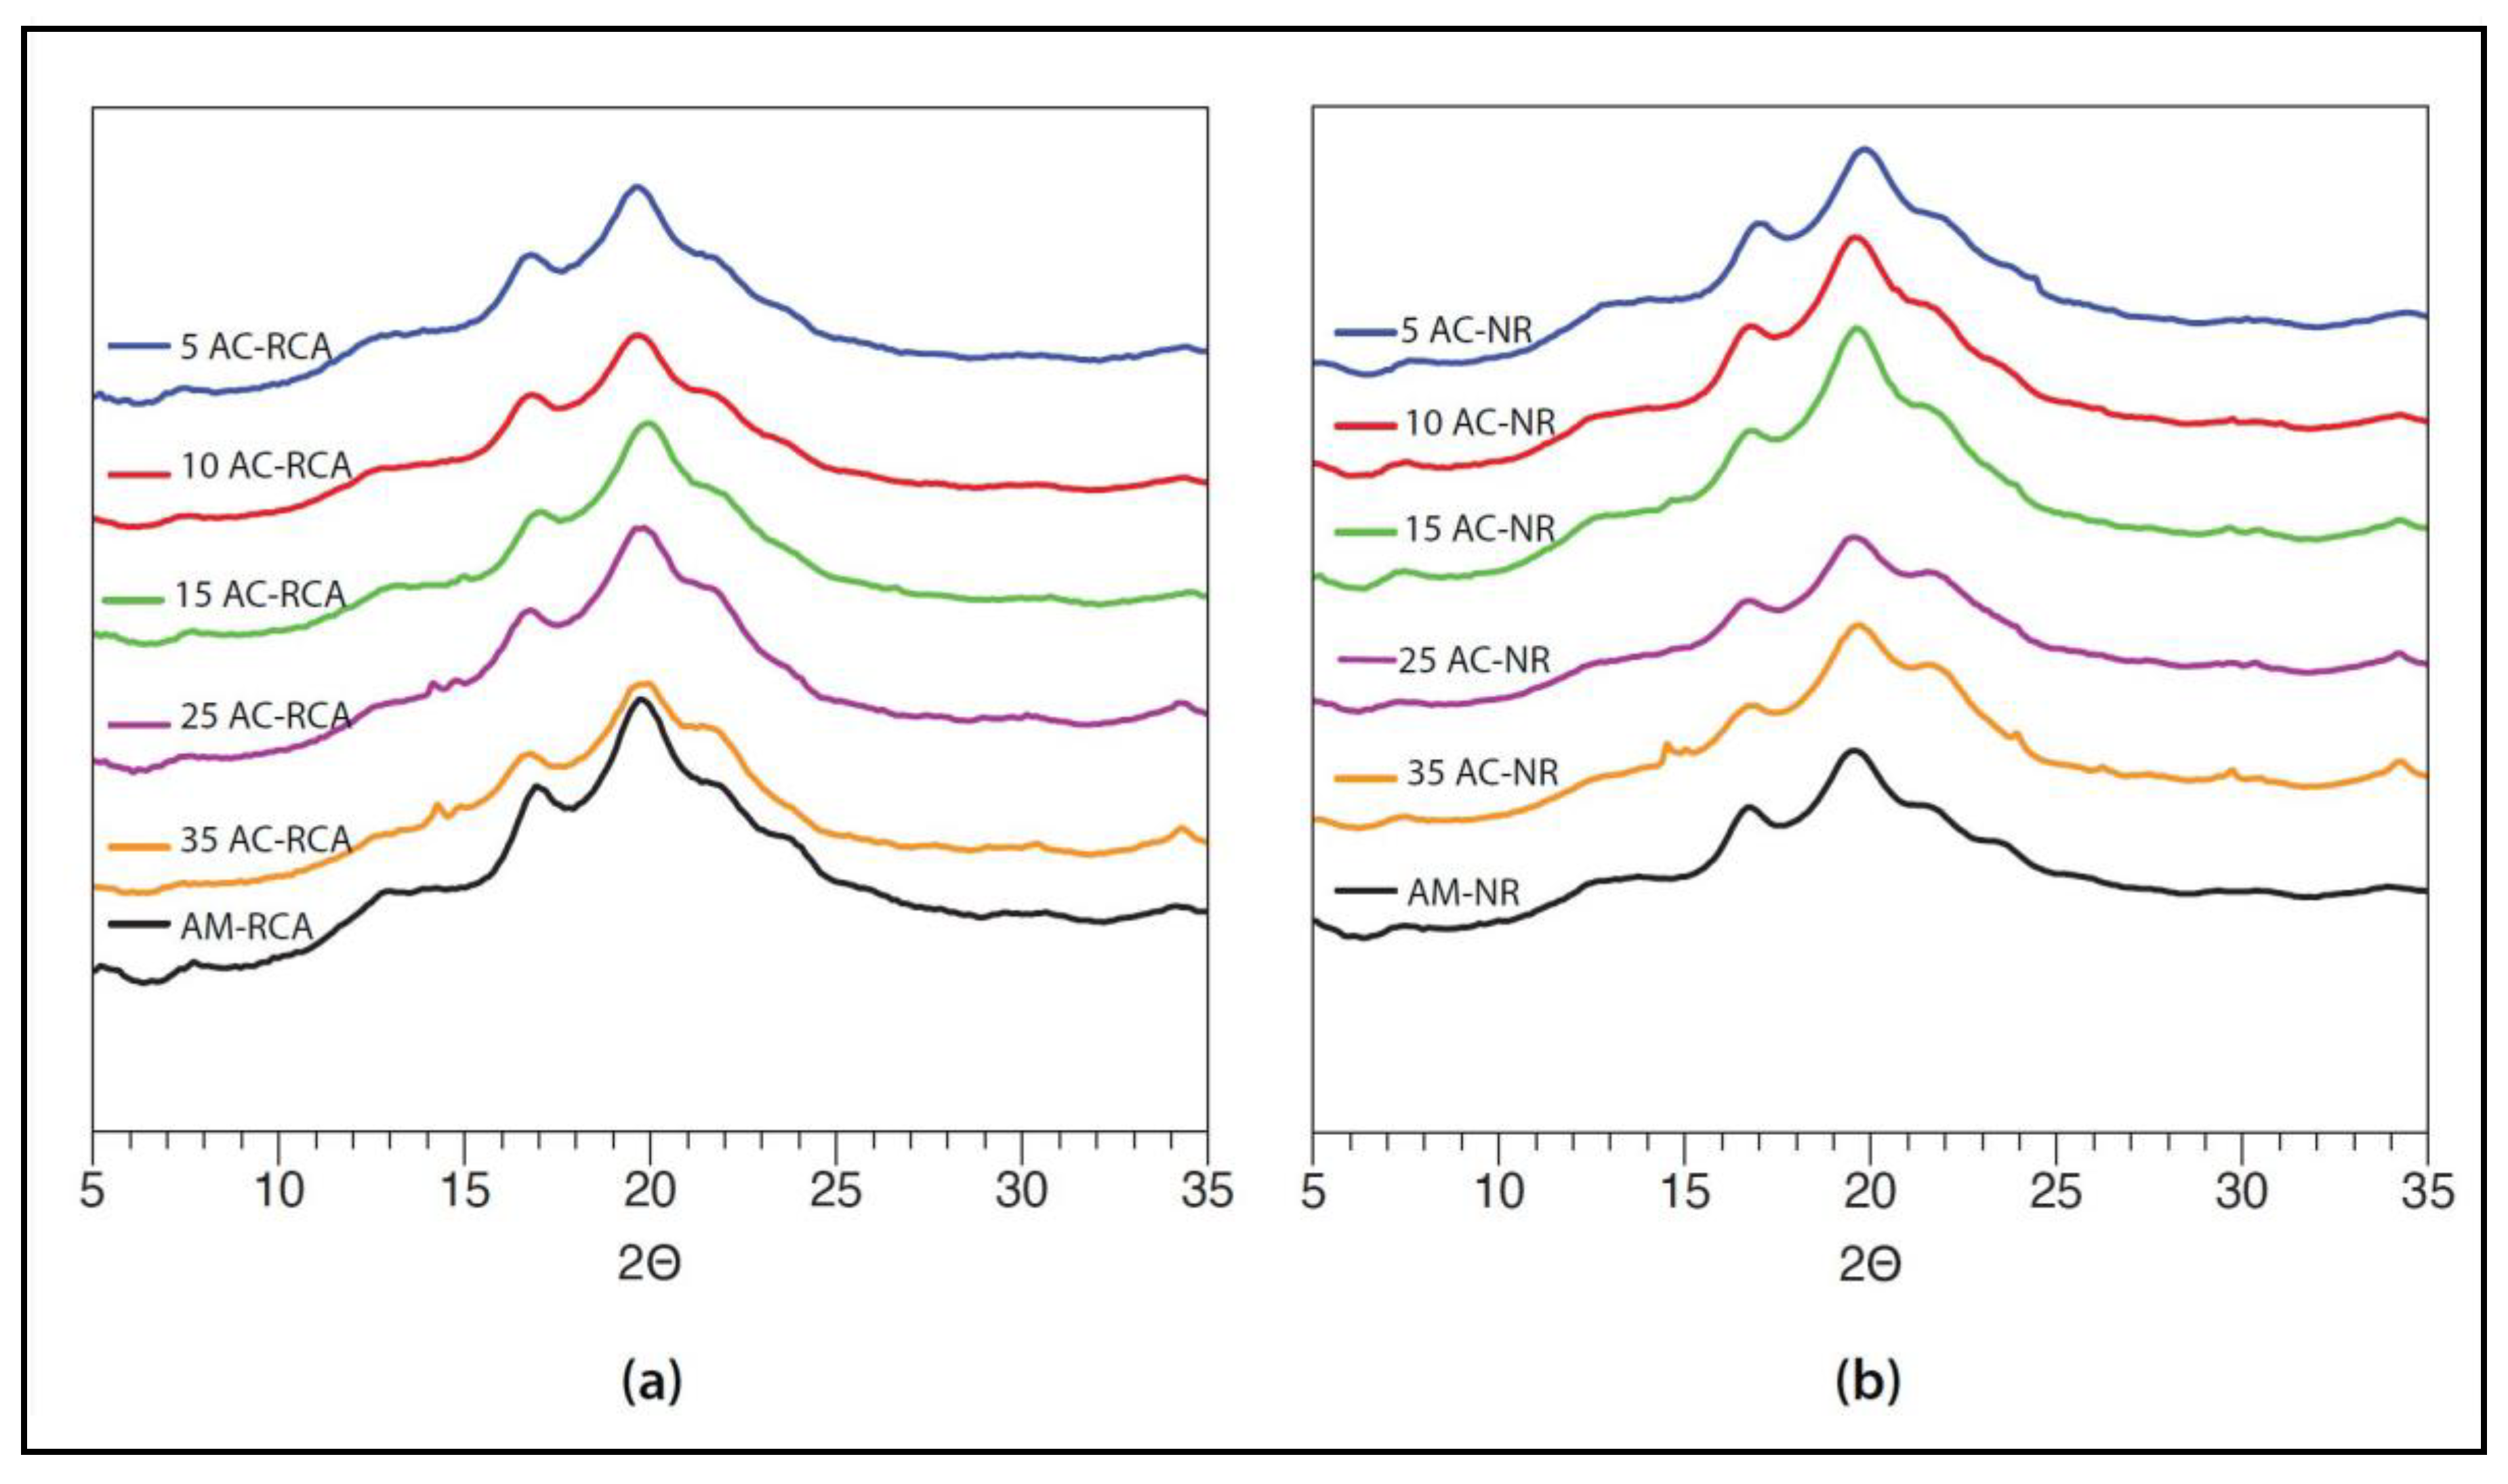
3.3. Wide-Angle X-ray Scattering (WAXS)

WAXS of the composite films was conducted to determine the effect of fiber size and concentration on the crystallinity of the films (Figure 4). The WAXS spectra of the control matrix AM+RCA and AM-NR demonstrated the same diffraction peaks at 2Ɵ~5.5°, 16°, 17°, and 19°, which were assigned to the V and B type of AM. No characteristic peaks for RCA and NR were found, indicating that RCA and NR are miscible with AM [33], which is in agreement with our previous work. Loading RCA in AM did not show any characteristic peak in the WAXS pattern of AM [14]. The composite films showed a similar profile to the control, except for an additional peak around 2Ɵ~34° at 25AC-RCA, 35AC-RCA, 25AC-NR, and 35AC-NR (Figure 4a,b), which was assigned to CNF crystalline plane 040 [15]. Therefore, an increasing amount of CNF is expected to enhance the relative crystallinity (RC %) of AM-RCA and AM-NR composites [34].
However, the RC % of the composite films started to decline at lower ratios of CNF (e.g., 5%, 10%, and 15%) and started to increase again at higher ratios (25% and 35%), which indicates a slight phase separation between the CNF and AM. This suggests that the interior structure of the films became more ordered when the CNF concentration increased. Natural fibers are oriented materials and, therefore, their crystallinity is likely to be higher than AM [35].
When greater CNF fillings were used, the crystallinity increased, which is probably because the high CNF content exhibited a higher surface area ratio. The relative crystallinity of the AM-RCA control film was 19.2%, and it increased to 20.7% after the addition of 35% CNF (Table 1). Therefore, the relative crystallinity of AM-RCA- and AM-NR-based composites is expected to increase with a high fiber content.

3.4. Thickness and Gas Permeability

No significant difference was found in the thickness among the different composite films (Table 2). For the RCA composite films, thickness decreased after the incorporation of CNF. Most likely, the thickness was influenced by the size and content of the fiber. For the NR films, the thickness of the composite films increased with increased fiber content up to 10%, after which its thickness decreased. This might be attributed to the presence of large-size fibers within the polymer matrix, which led to a less homogenous material and could have promoted structural defects [36]. Films with high concentrations of fibers (35AC-RCA and 35AC-NR) showed decreased thickness due to the smaller-sized CNFs.
For the RCA composite films, water vapor permeability (WVP) increased significantly at a higher ratio (35AC-RCA) compared to the control (AM-RCA) (Table 2). The WVP of a material depends on three main mechanisms: surface defects, the tortuosity of the pathway, and crystallinity. Moreover, the presence of CNFs increases the tortuosity of the pathway for water molecules, and large filler promotes voids that facilitate the transport of water molecules. However, for the NR composite films, the WVP increased at a ratio of 25AC-NR and then decreased significantly (p < 0.05) at 35AC-NR (Table 2). According to [37], WVP decreased in more homogenous structures with compact films. Thus, our WVP results agree with RC % and SEM observations, which are associated with the crystallinity and the heterogeneous structure of the reinforced matrixes).
The same effect relating to CNFs was seen for O2 and CO2 permeability, especially for O2 permeability, which showed a significant reduction (p < 0.05) in RCA composite films and a reducing trend for the NR composite films (Table 2). Reduced O2 permeability can be advantageous for packaging [38].

3.5. Thermogravimetric Analysis (TGA)

The thermographs of the composite indicators (Figure 5) showed that the behavior of the mass loss curves was similar in all films, irrespective of fiber concentration. The mass loss below 100 °C was mainly ascribed to water loss (Figure 5a,b), whereas the second mass loss from 100 °C to 230 °C was related to the volatilization of water and plasticizer. The third stage of mass loss was observed between 245 °C and 378 °C for the AM-RCA systems (Figure 5a), with a maximum weight loss at 307 °C due to the decomposition of starch and RCA compounds. In the AM-NR matrix, a third stage of mass loss occurred between 235 °C and 390 °C, which was related to AM decomposition and the NR of the dye (Figure 5b). In the RCA composite indicators, the degradation temperature was slightly increased, with small variations compared to the control matrix (AM-RCA). It has been reported that the addition of fibers to a starch matrix can improve its thermal stability since there is good adhesion between the fiber and the matrix [39].
In the NR composite indicators, the DTG decreased significantly (p < 0.05) due to the addition of CNFs when compared to the control matrix (AM-NR) (Figure 3b).

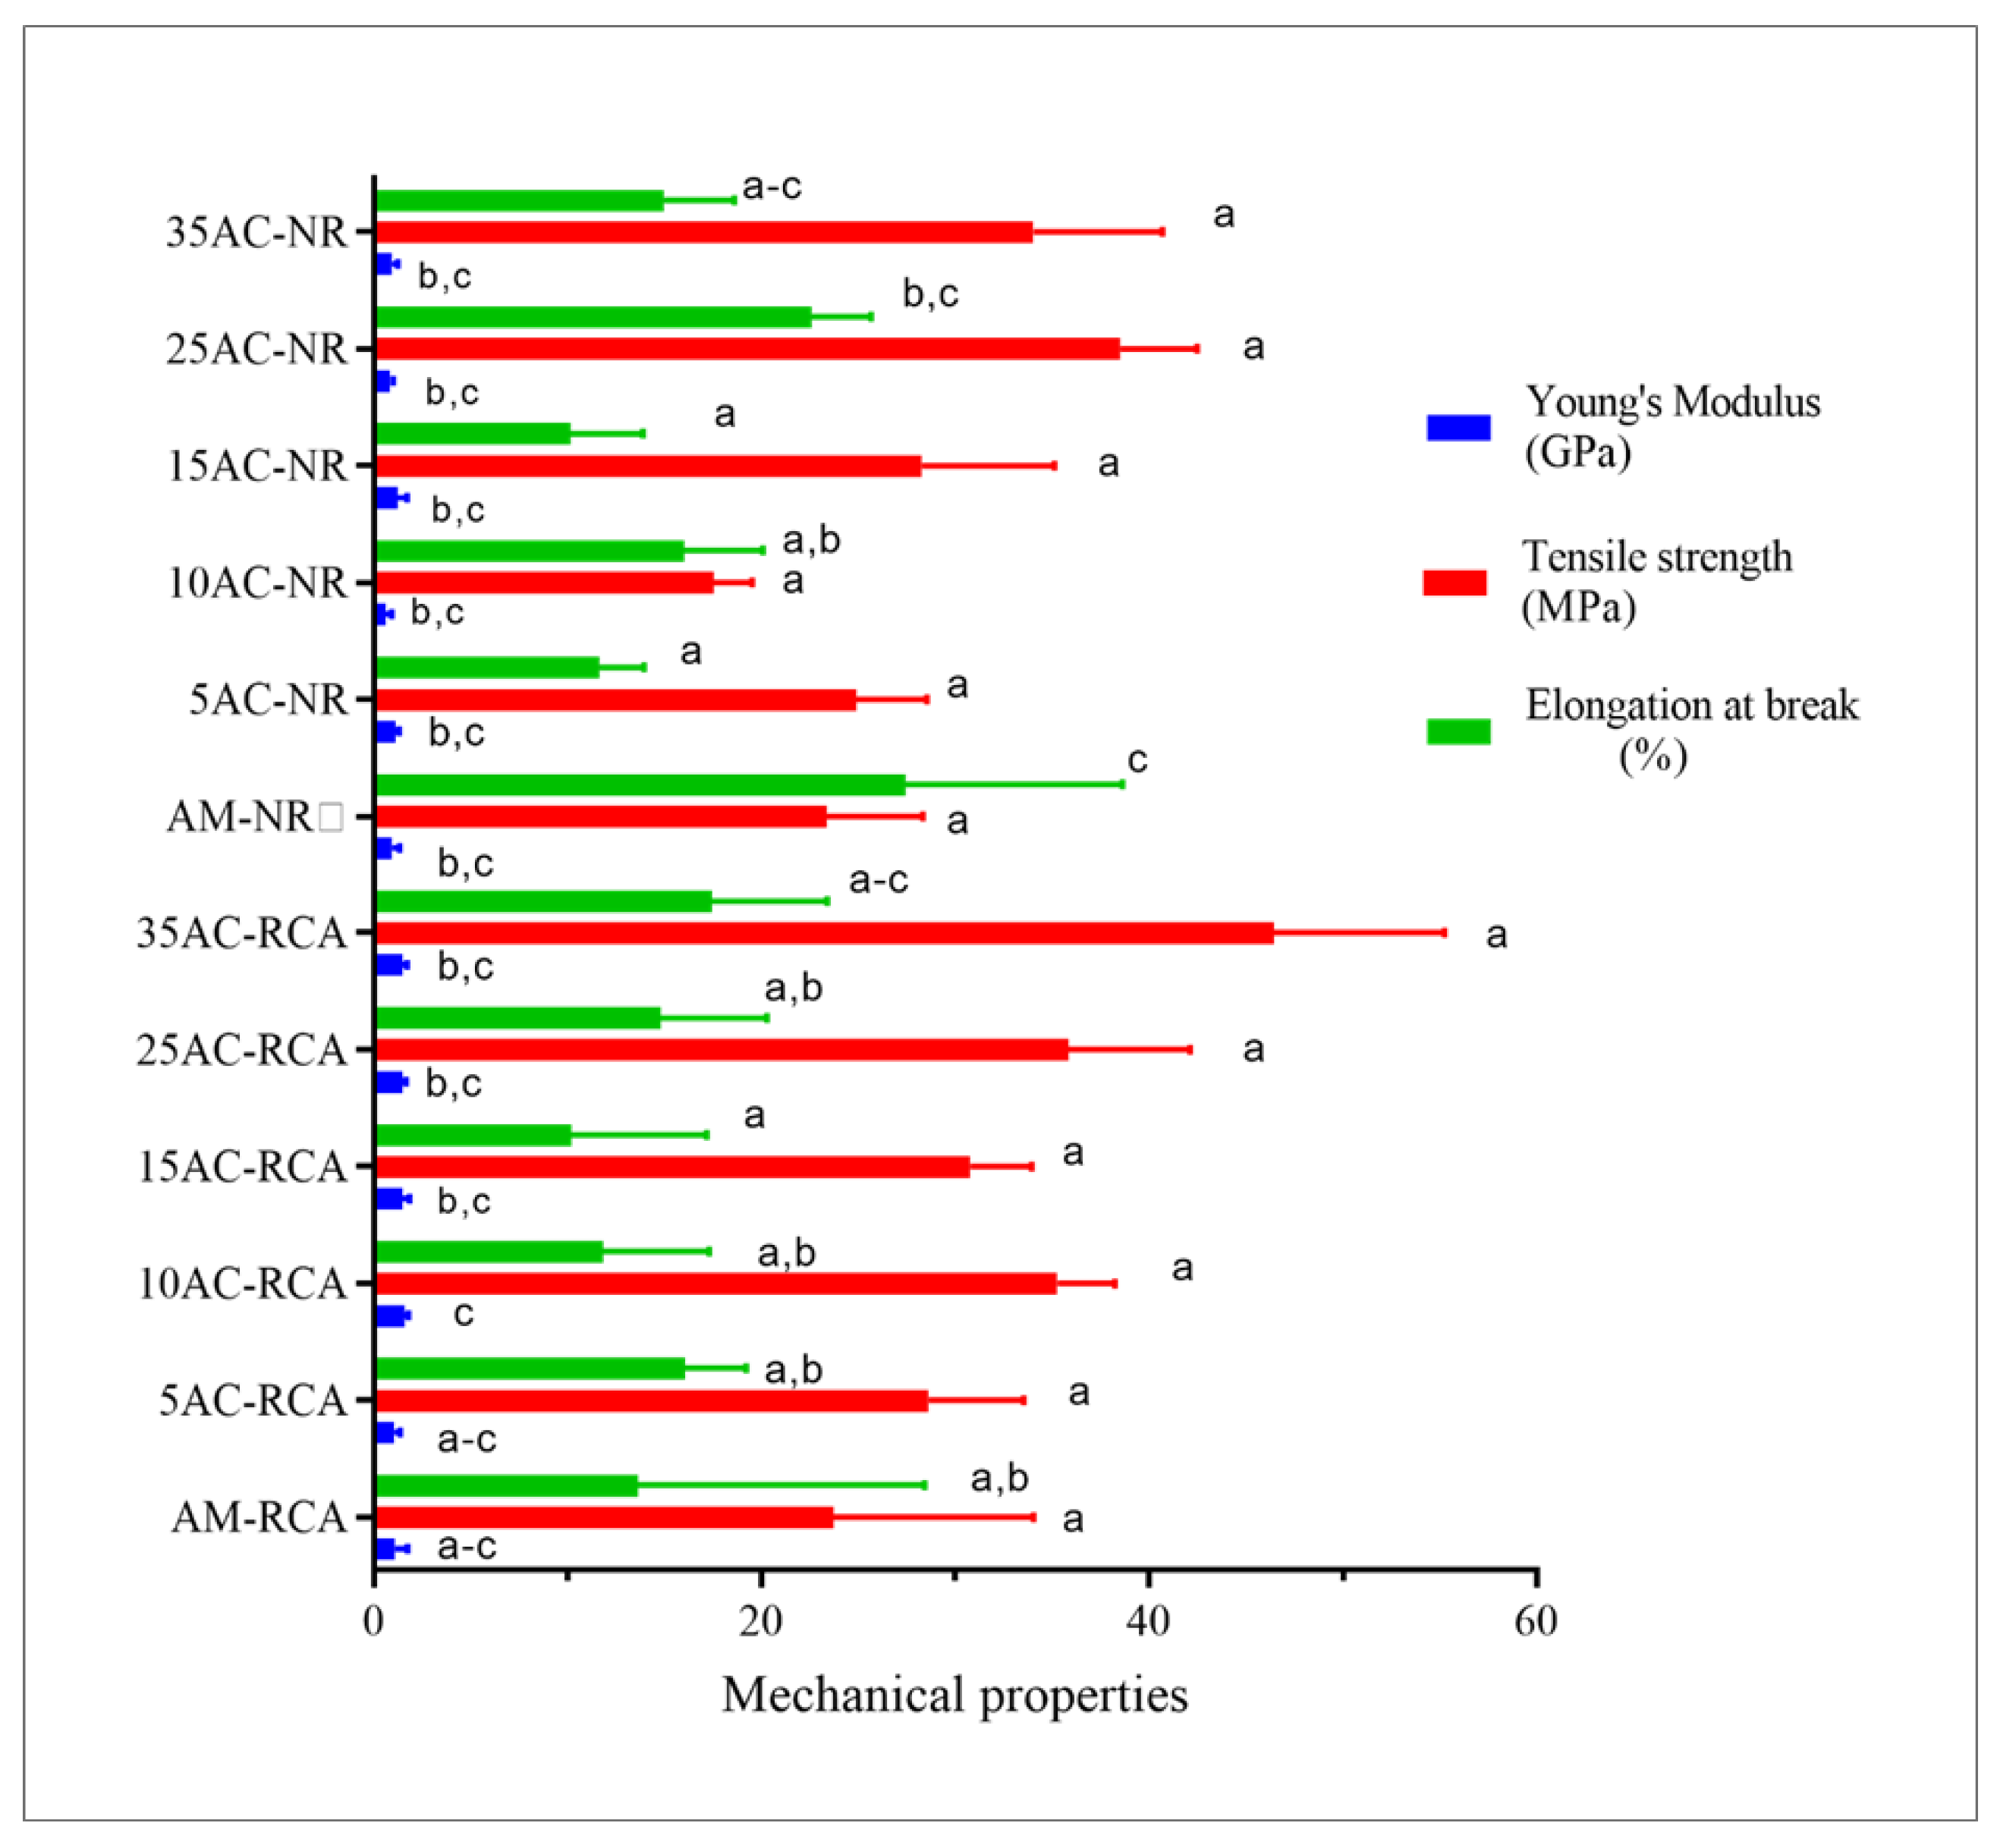
3.6. Mechanical Properties

The mechanical properties of the composite films (Figure 6) showed significant effects relating to the addition of pigments. The presence of RCA can weaken intermolecular interactions and thus affect the mechanical properties of the films [40]. Moreover, the plasticizing effect of water and RCA can contribute to low tensile strength and high elongation at break.
The elongation at break of AM-RCA showed greater differences than AM-NR, suggesting differential effects of RCA and NR on the mechanical properties (Figure 6). It has been reported that the incorporation of NR in gelatin-based films enhances the mechanical properties of the films developed compared to methyl orange and bromocresol green due to the favor of NR crosslinking with the protein network [9].
The addition of CNFs increased the tensile strength, confirming the reinforcement of the material indicated by the dye (Figure 6). The tensile strength of AM-RCA increased from 23.4 MPa to 43.0 MPa with the addition of 35% of CNFs, and it increased from 24 MPa in the AM-NR film to 36 MPa with the addition of 35% CNFs. This is a well-known behavior of polymeric composites reinforced with natural fibers, as described elsewhere [12,13]. However, the mechanical properties of the composite films did not differ significantly from the AM-RCA and AM-NR matrices. This suggests that there are increased interfacial interactions between AM and CNFs [41].

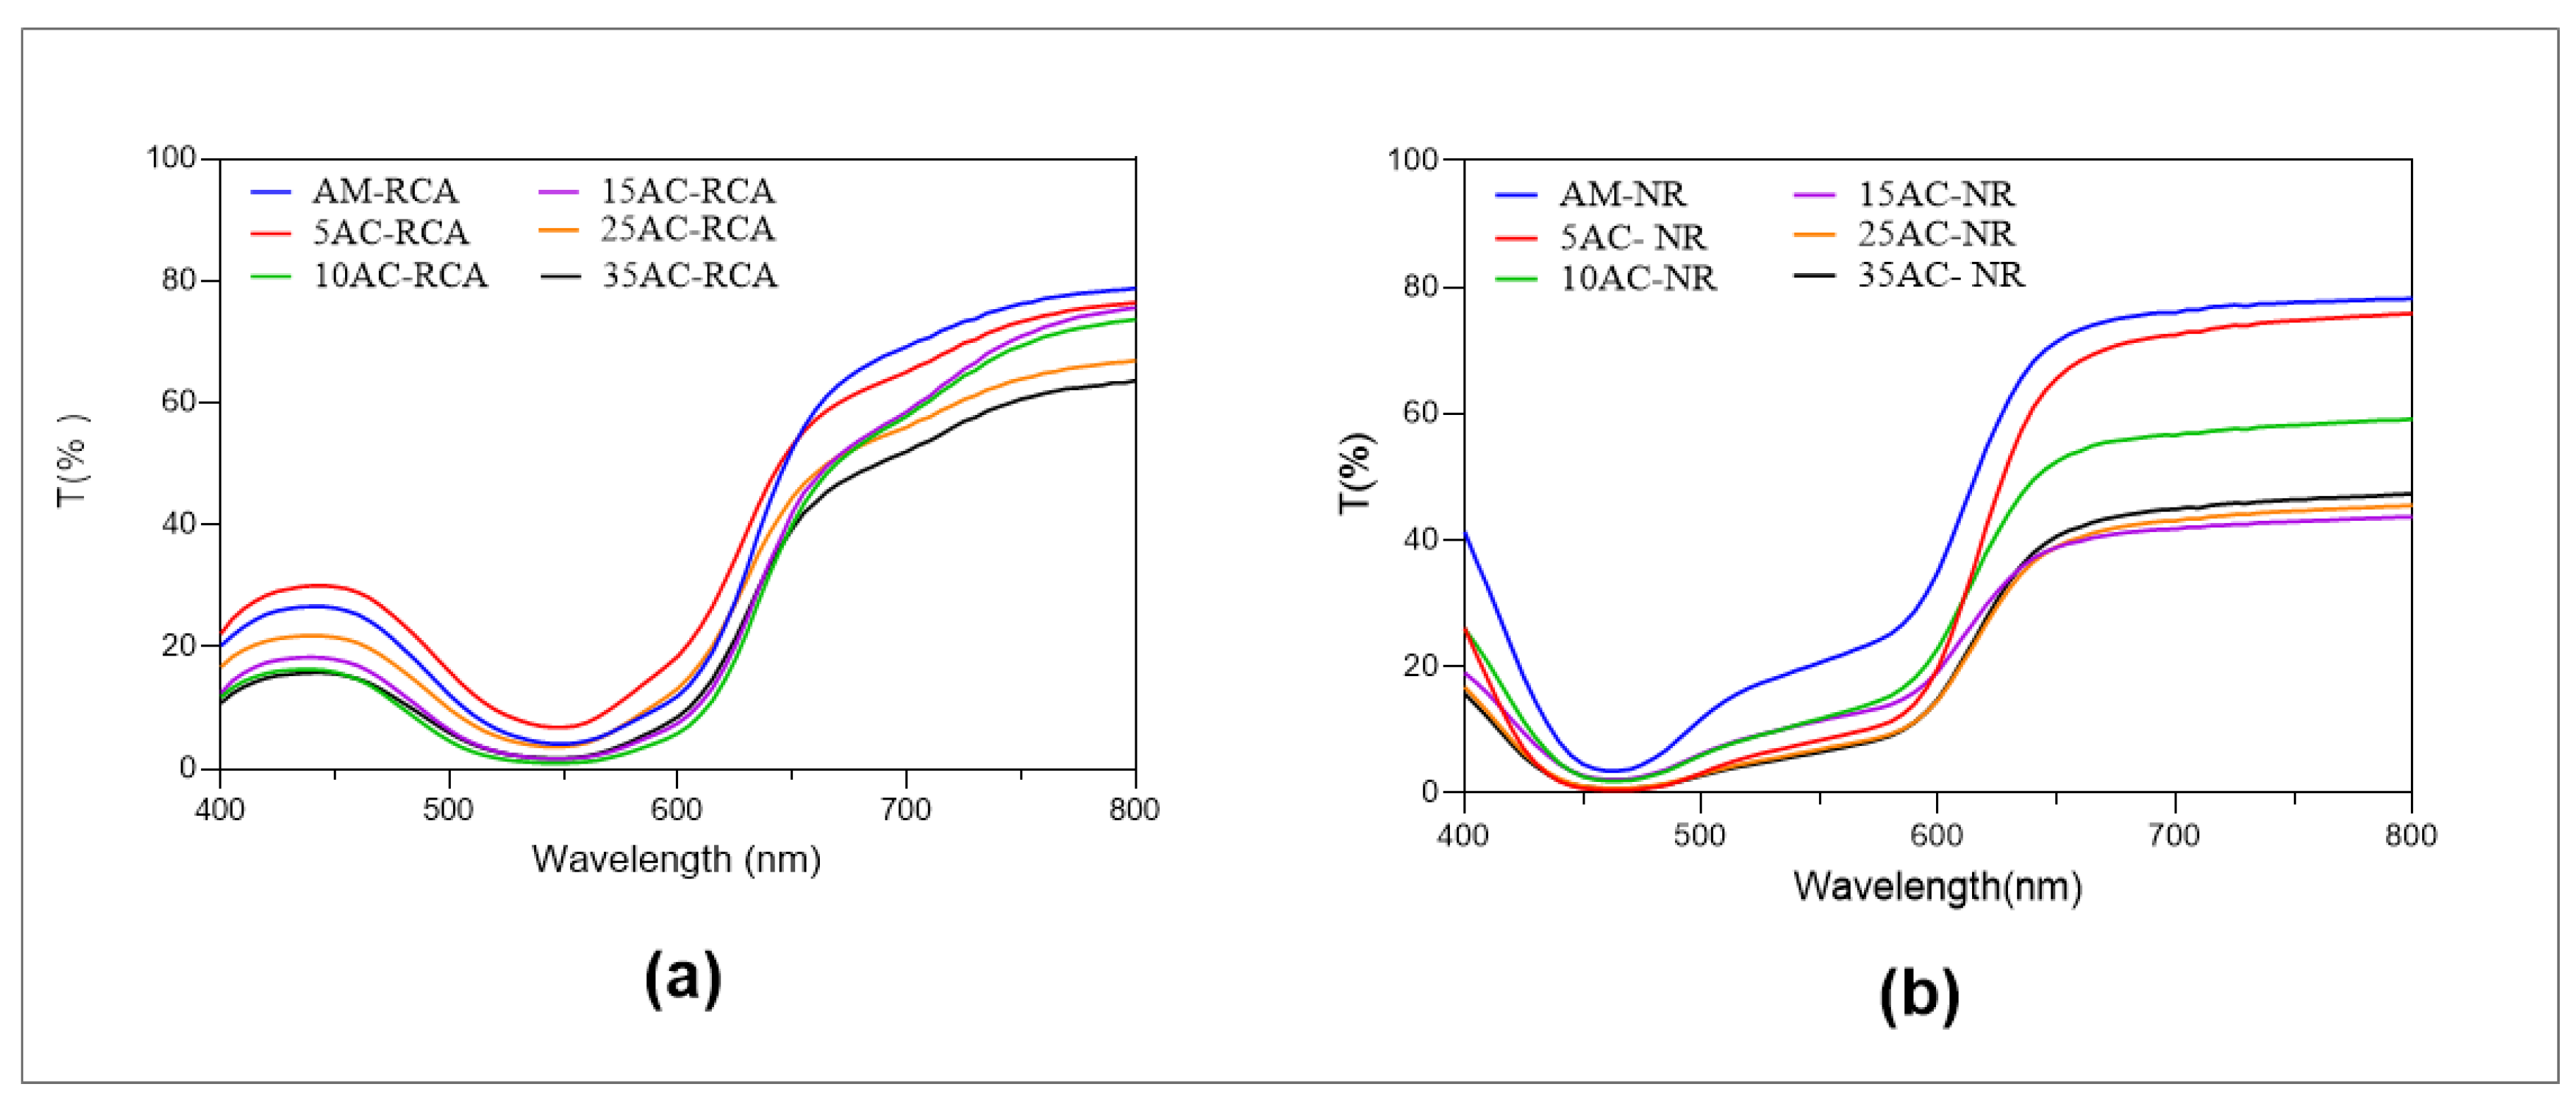
3.7. Optical and Barrier Properties

As film packaging is exposed to UV-vis light, it can be subject to oxidation, resulting in discoloration, off-flavors, and nutrient loss. The transparency of the films was further characterized by using their UV-vis spectra (Figure 7). Indicators containing RCA, synthetic dyes, or betacyanins effectively reduce light transmittance due to the presence of chromophores (e.g., C=C, C=O, and C=N) [42,43]. AM-RCA and 5AC-RCA had the highest light transmittance, after which it was reduced at increased amounts of CNFs, which can be likely attributed to the direct effect of fiber light scattering (Figure 7a). The same trend was observed with the NR films (Figure 7b). However, in the UV region, the NR composite films had lower transmittance than the RCA composite films in the UV region.

3.8. Microstructural Analysis

Microstructural analysis conducted via SEM indicated the generally high homogeneity of the films and the different CNF distributions throughout the AM matrix for different composites (Figure 8). The SEM images of AM-RCA and AM-NR showed homogenous cross-sections with no pores or cracks and a compact structure (Figure 8a,g). In both composite films, the cross-sections and surface morphologies became rough by increasing the CNF concentration, i.e., for the 35AC-RCA sample, a rough surface morphology was observed (Figure S4f) due to the agglomeration of CNFs. However, 35AC-NR presented a smooth and homogenous surface. Composite 25AC-NR showed a heterogeneous surface accompanied by cracks (Figure S4). The same results were reported by [44], where the surface morphology of the nanocomposites became rough by increasing the cellulose nanocrystals CNC concentration in a chitosan matrix.

3.9. Microbial Counts and pH Measurements

To extend shelf life during the refrigeration of packaged minced meat, psychrotrophic and anaerobic microbes like lactic acid bacteria (LAB) are commonly grown (Table 3). According to (ICMSF 1986) [45], 6 log10 CFU/g and 7 log10 CFU/g are the marginal standard limit and tolerance limit of viable count, respectively. The plate count of the meat samples in the present study delivered this acceptable limit on day 6 at 5 °C (7.4 log10 CFU/g ± 0.18) [46], while the minced fish reached the usual (7 log10 CFU/g) limit of acceptability on day 10 (Table 3). The minced meat/fish stored under the MAP exhibited an initial slow increase in pH. This was due to CO2 dissolving in the liquid phase of the meat/fish, leading to non-dissociated carbonic acid [47].
In addition, storage temperature is an important factor affecting bacterial growth. The used storage temperature of 5 °C led to an increase in the solubility of CO2 and augmented antimicrobial activity due to the increased CO2 sensitivity of the bacterial cells. In this study, the CO2 concentration was 30% at the beginning of the experiment and decreased during the first four days of storage for the meat samples and after seven days for the fish samples. This may be assigned to the CO2 absorption of the meat and fish samples, and it increased continuously until its end of storage [29,48]. The increase in CO2 and the decrease in O2 observed for the meat samples q43 due to the growth of aerobic bacteria and microbial respiration. The pH of both the meat and fish samples increased gradually during the first 10 days due to proteolysis and the production of amines (Figure 9).

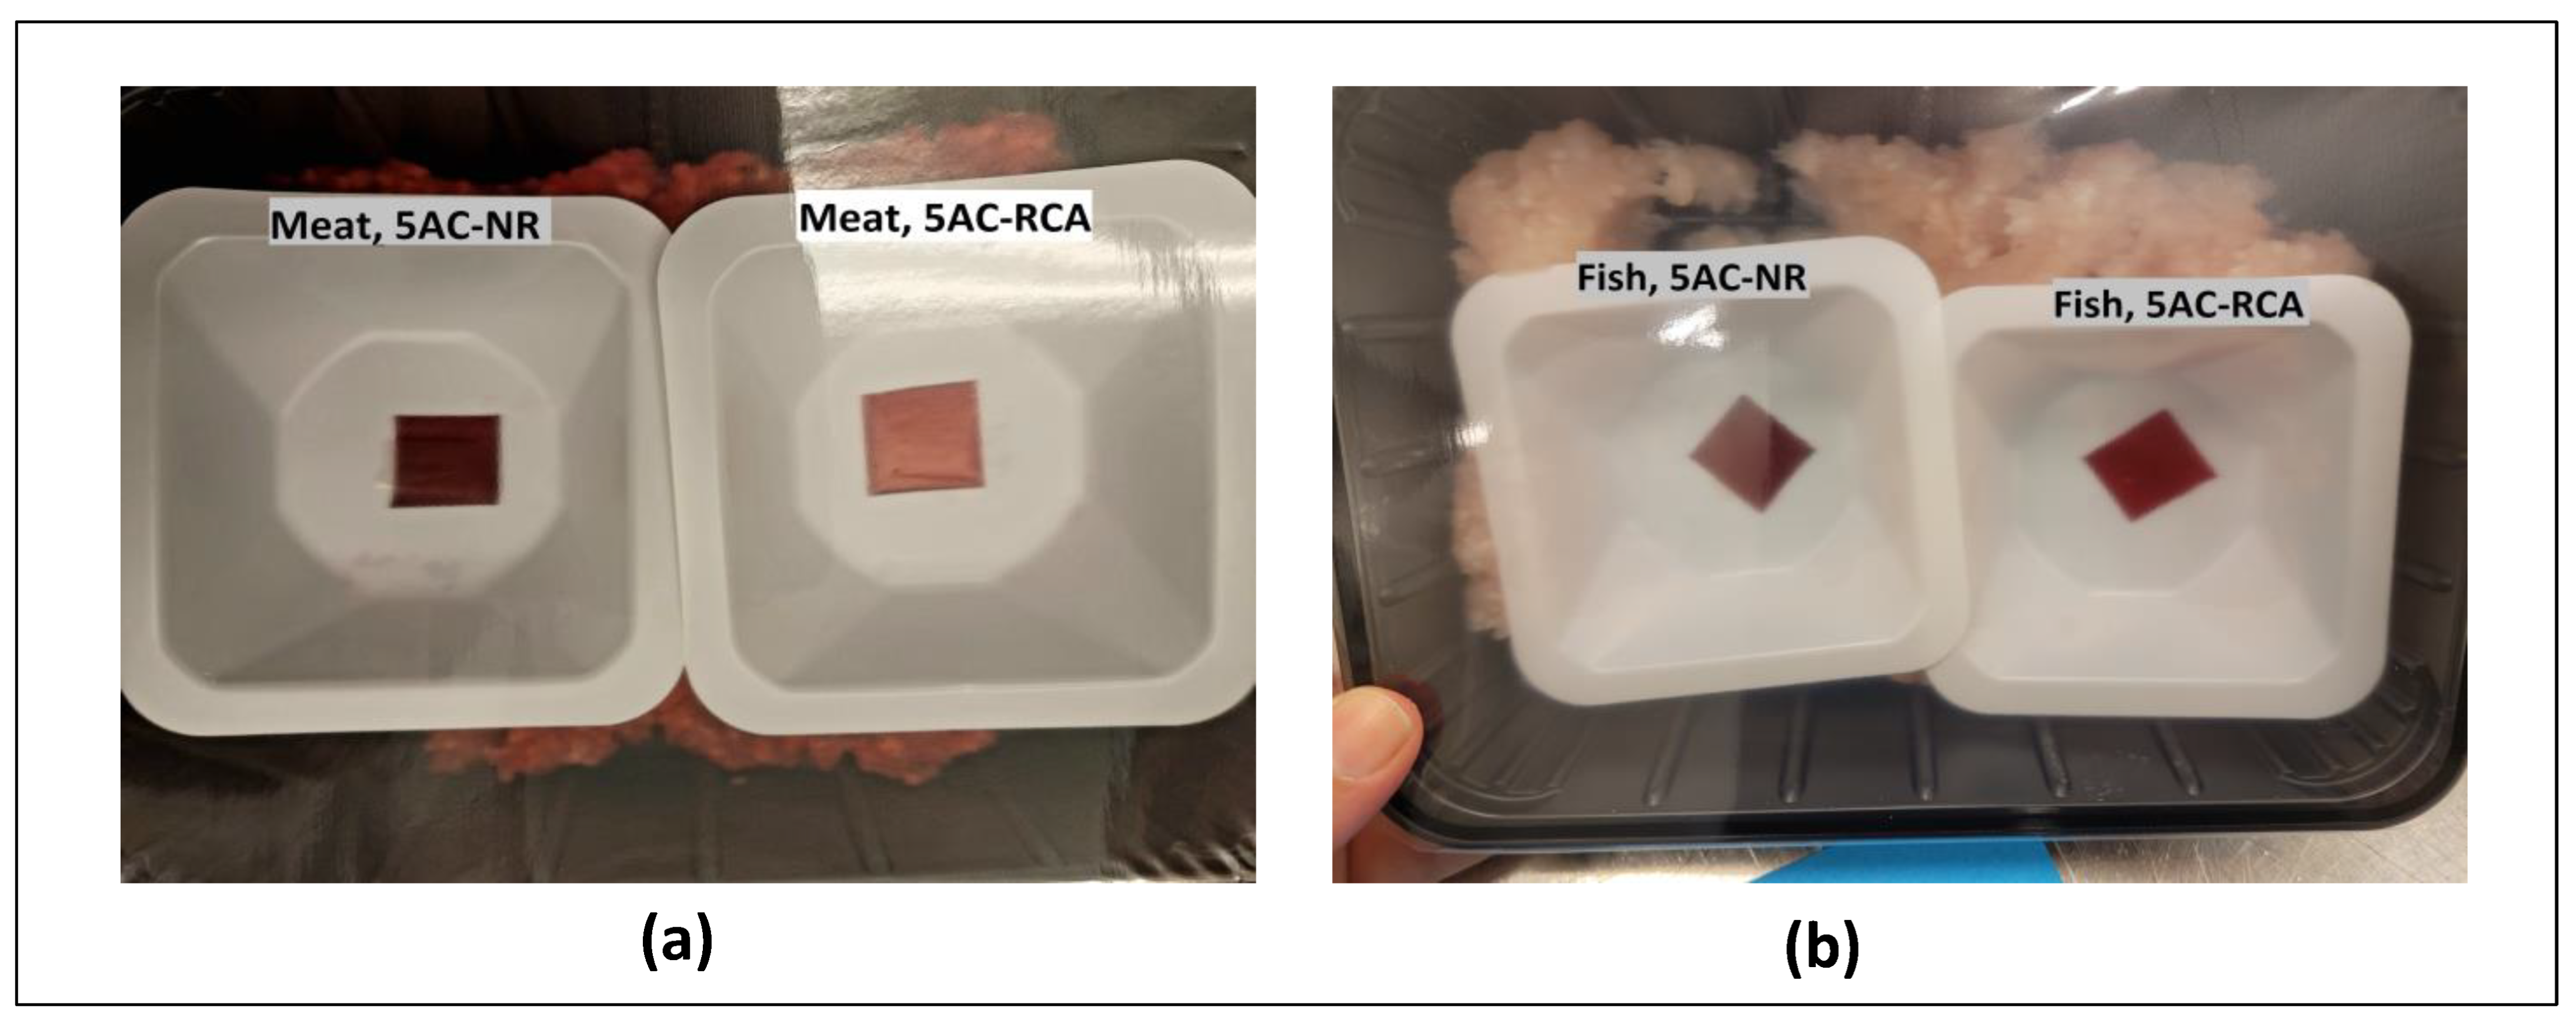
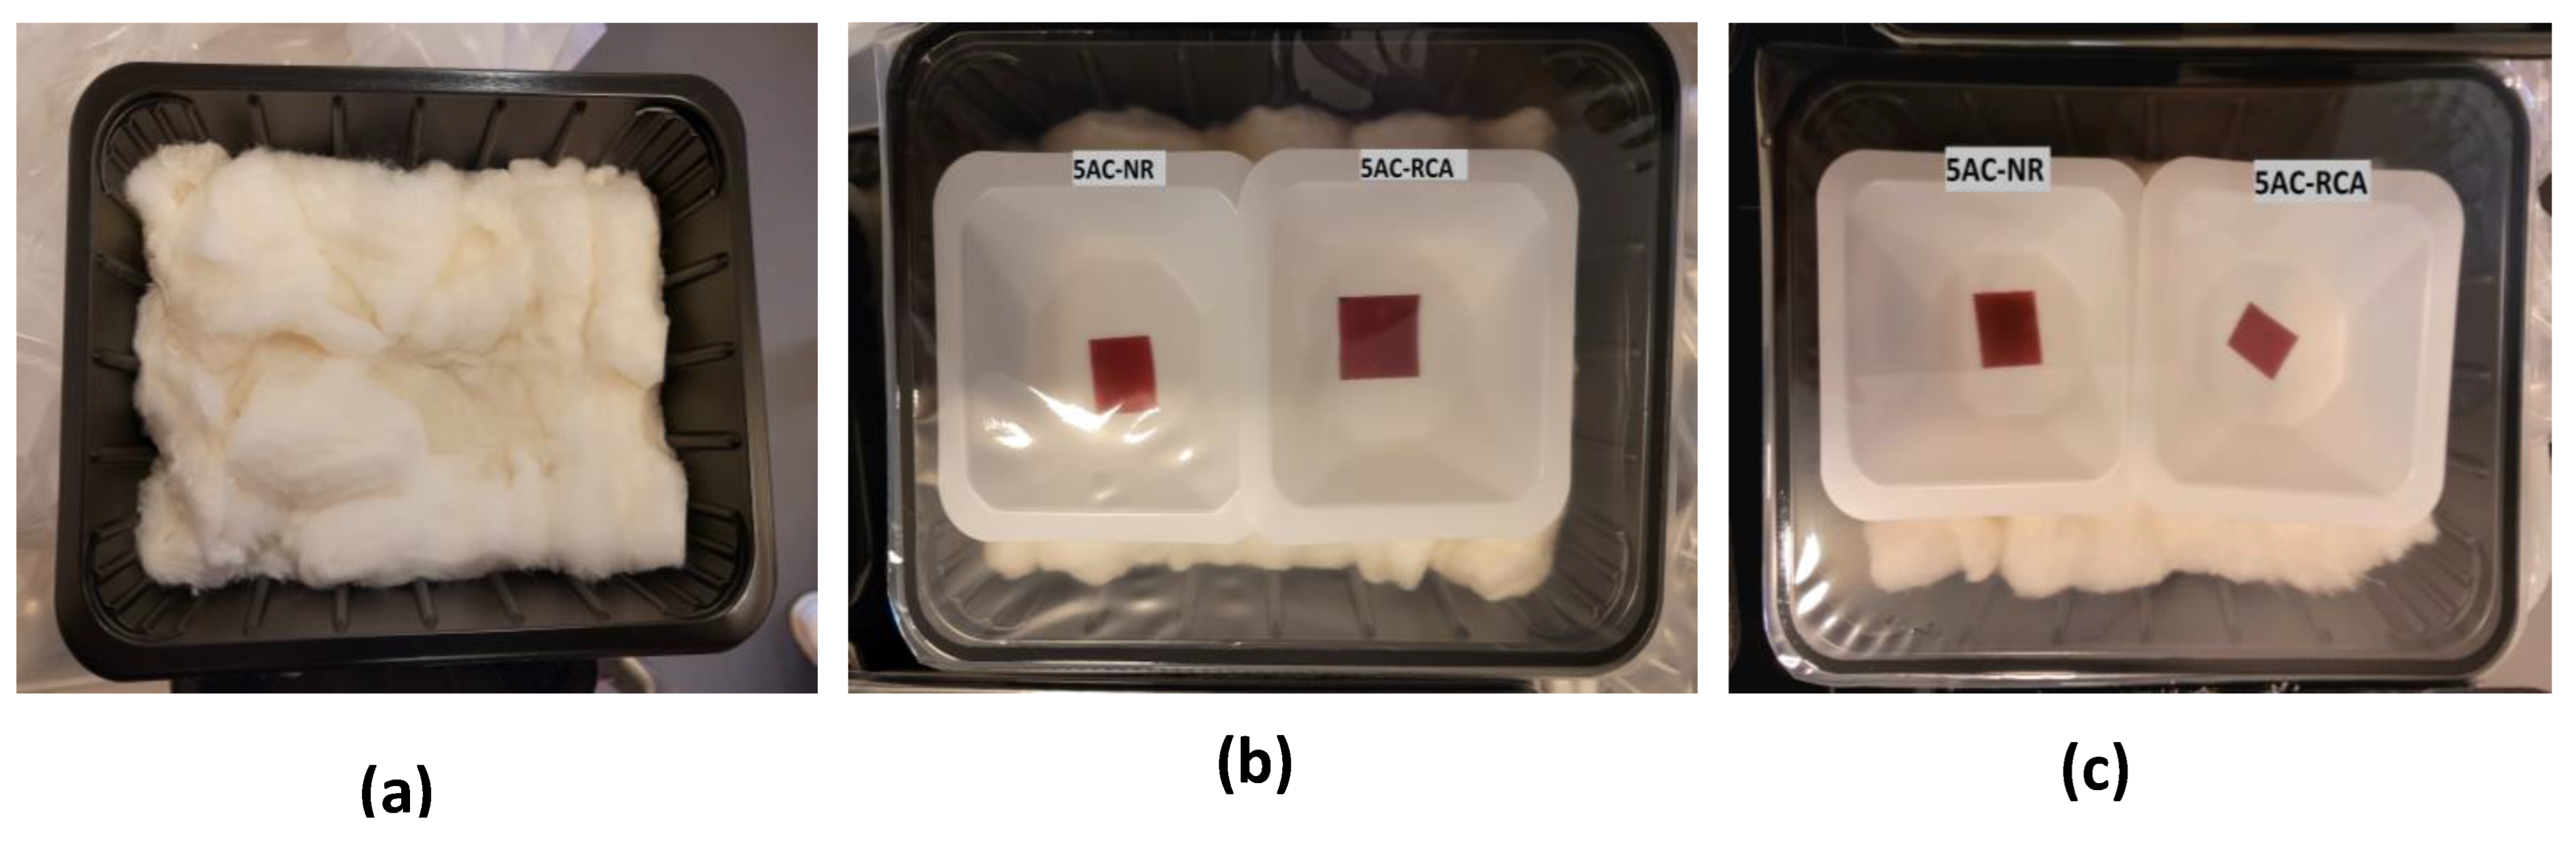
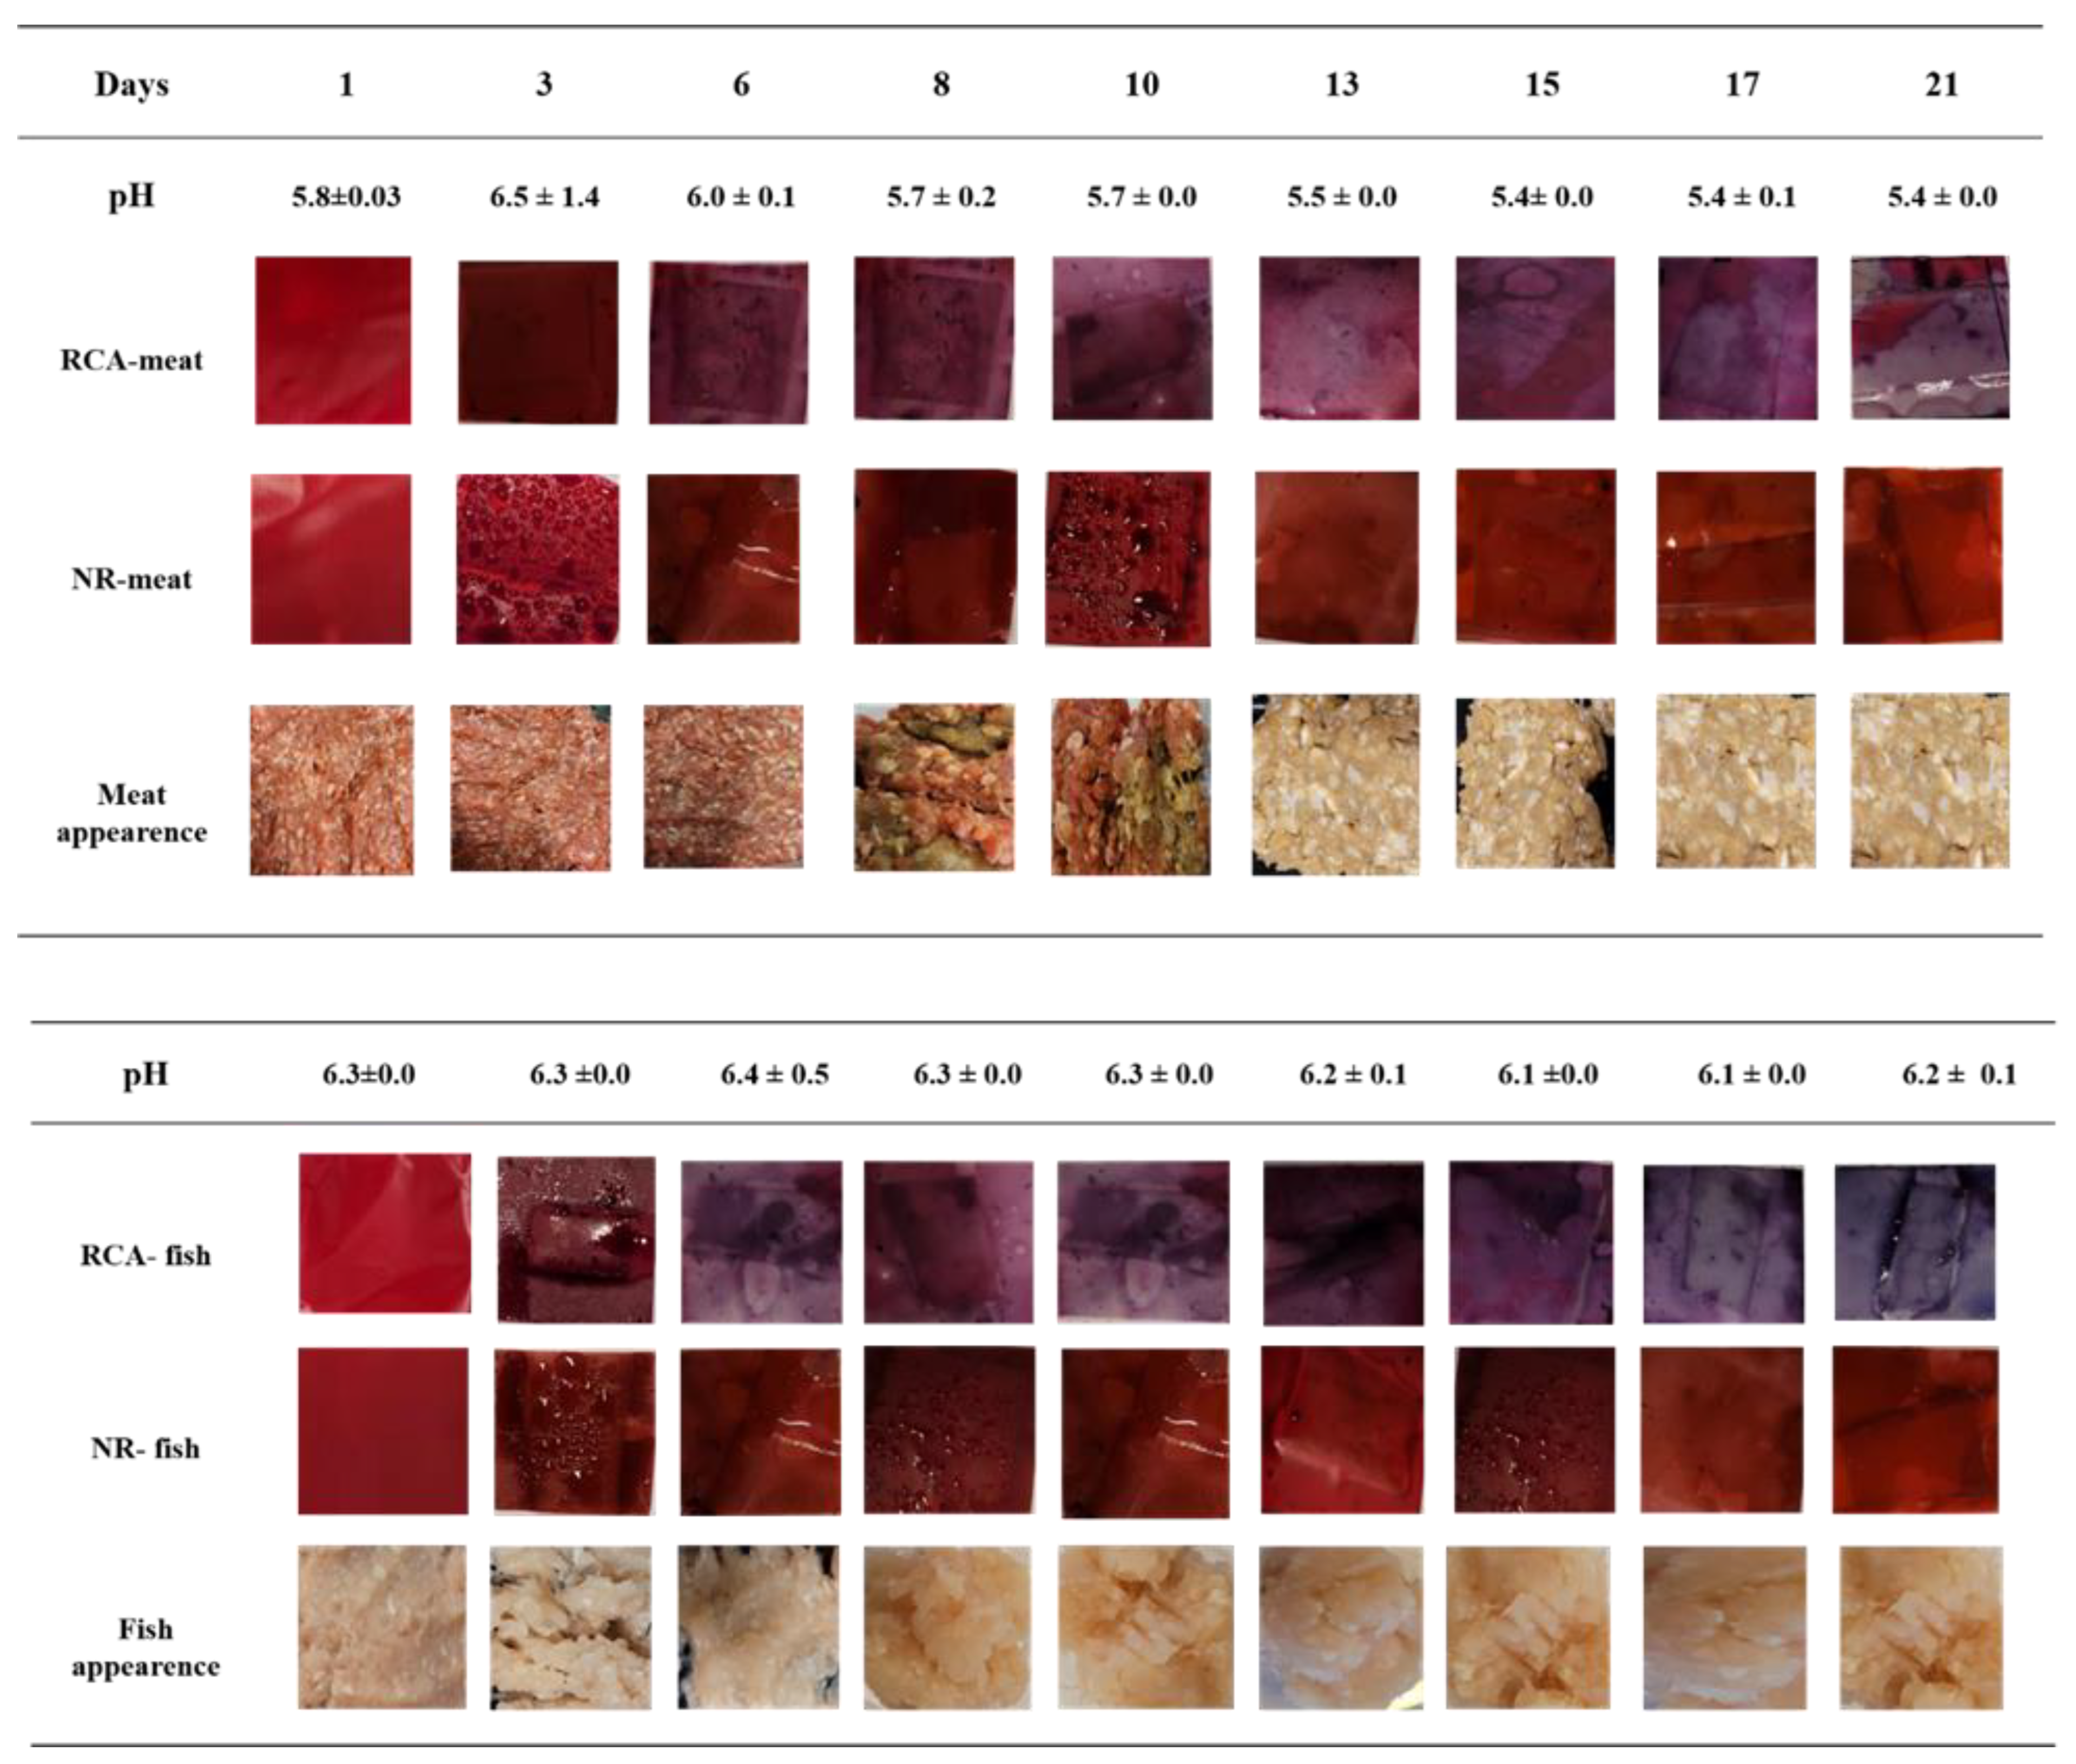
3.10. Color Changes of Indicator Films of Minced Meat and Minced Fish

Significant color changes in relation to the indicator films were observed during storage (Figure 9). As bacterial growth commences, volatile organic bases are produced from protein degradation, resulting in the increased pH of the headspace gas. However, the samples in the sealed packaging also produce moisture, affecting the indicator films. Thus, the color of the films will change due to meat/fish spoilage based on a pH increase as the alkaline volatile amines are gradually produced in the headspace. For the RCA-meat films, the color was red for 3 days (fresh period), and then it changed from red to reddish pink on day 6, which was correlated to the spoilage of meat, as deduced from inspection. This shift, however, was not sufficient to be detected by a potential customer due to the minor difference in hue between medium-fresh and spoiled food.
The NR-meat indicator films did not provide any warning information between freshness and medium fresh as the red color of the indicator did not change during the change of these pH values. However, the RCA-fish indicator film exhibited significant changes in color during storage. The color differed between days 3 (fresh), 6 (acceptable), and 17 (unacceptable), where it changed from red to reddish-purple over to blue-purple. The NR-fish indicator films showed a change on day 17; the color changed from red to red-orange as the pH changed significantly to 6.24.
Neither the NR-meat nor the NR-fish films showed any difference between fresh, medium fresh (acceptable), and spoilage stages, which could confuse consumers when assessing the freshness. This may be ascribed to the narrow range of NR color change from red (pH < 6) to yellow (pH > 8).
As the ∆E of an indicator film exceeds 12, the color difference is regarded as being easily observed by the unassisted eye [49]. For the meat and fish samples, the ∆E of the NR film values was not strictly associated with freshness throughout storage. Therefore, the ∆E of the RCA films was most suitable for discriminating fresh fish, medium fresh fish, and spoiled fish close to the threshold of fish spoilage (Figure 10). Pigment leakage due to moisture and inhomogeneous color change (Figure S1) were problems associated with the indicators in the case of MAP.
In the control samples (Figure S2), the indictor films in the MAP samples of 70% O2 + 30% CO2 and 70% N2 + 30% CO2 were not significantly affected by pH or storage time. The CO2 decreased significantly from day 7 due to its dissolution in the moist cotton, and the relative amount of O2 and N2 significantly increased from day 7 due to the low amount of CO2 (Figure S3).

3.11. Sensory Scores

Sensory scores of the meat and fish during the 9 day storage at 5 °C demonstrated a gradual decrease during storage, indicating a moderate increase in the off-edible properties of the samples (Table 4). The sensory scores of the meats were 2.67 (acceptable) on day 8 and 3.26 (unacceptable) on day 10. Meat sensory analysis was concluded after 10 days due to the unacceptable off-odors concomitant with meat spoilage; furthermore, the appearance became dull and brownish in color with a firmer texture, in accordance with the changes in microbial counts. In the case of the minced fish samples, the sensory scores were scored as having fresh quality 1.03–1.97 (acceptable) for 10 days. The freshness scores started to decrease significantly on day 15 and were thought to be unacceptable on days 17 and 21 (mean scores: 2.7 ± 1.0 in appearance; 3.13 ± 1.01 in odor), respectively, as the color became lighter and changed from pinkish to yellow. Furthermore, considering the microbial count and sensory scores, the threshold of spoilage was defined as day 6 and day 15 for meat and fish samples, respectively.

3.12. Correlation between Quality Indices

Correlation analysis clarified the relationships between the NR and RCA indicators and pH, microbial analysis, color analysis, the effect of MAP gas, meat appearance, and meat odor. The strength of the correlations was expressed using Pearson correlation coefficients (Table S1). Specifically, the ∆E of the indicator films in meat and fish showed a significance level of 0.01, indicating a highly significant correlation with pH and microbial activity. The correlation coefficients of meat appearance and meat odor were all higher than 0.9 and showed significance at the level of 0.01 with microbial activity, pH, and the MAP effect of gases, such as CO2 and N2. Hence, a positive correlation was established, demonstrating that increased microbial activity during the storage decreased pH, leading to a change in the indicator signal, demonstrating that protein decomposition and/or lipid oxidation of the meat/fish was detected by the monitor. Only a weak correlation was found with ∆E and pH for the control samples (Table S2).

4. Conclusions

Our data reveal fast and sensitive integrated packaging detection of spoilage compounds in meat and fish, which can be monitored in a MAP system via a non-invasive colorimetric method. RCA and NR blended into an AM matrix with CNF added as a reinforcement showed that a nanocomposite film with a content of 35% CNF had the highest mechanical strength, thermal stability, and barrier properties. The effect of MAP was significantly influenced by the storage time, temperature, and packaging conditions. The appearance of the meat and fish and RCA indicator color response were strongly correlated to the microbial counts, enabling the real-time monitoring of fish and meat. However, the RCA films provided two assorted colors in the meat samples, while for the fish samples, it provided three different colors, showing freshness, medium freshness, and complete spoilage. However, the color of the NR indicator composite films was only weakly correlated to the microbial counts. In conclusion, the RCA indicator film successfully revealed the quality of the meat under the storage conditions at 5 °C under the influence of MAP. Further studies on freshness assessments with other different pH indicators at different MAP concentrations should be conducted.

Supplementary Materials

The following supporting information can be downloaded at: https://www.mdpi.com/article/10.3390/coatings14060725/s1.

Author Contributions

Conceptualization, M.F., T.J., L.M., P.V. and A.B.; methodology, M.F., T.J., L.M., P.V., H.N.B. and J.J.K.K.; software, M.F., T.J., L.M. and P.V.; validation, M.F., T.J., L.M., P.V., P.U. and A.B.; formal analysis, M.F., T.J., L.M., P.V., H.N.B., J.J.K.K. and A.B.; investigation, M.F. and J.J.K.K.; resources, A.B. and T.J.; data curation, M.F., A.B. and L.M.; writing—original draft preparation, M.F.; writing—review and editing, A.B., M.F., H.N.B. and J.J.K.K.; visualization, M.F., H.N.B. and J.J.K.K.; supervision, A.B., L.M. and P.U.; project administration, A.B.; funding acquisition, A.B., P.U., H.N.B. and J.J.K.K. All authors have read and agreed to the published version of the manuscript.

Funding

This study was mainly supported by the Danish council for independent research (grant number 8022-00095B) and the Innomission 4 Program of Innovation Fund Denmark. The thermoanalysis instrument was financed by Carlsberg Fondet (grants 2013_01_0589, CF14-0230, and CF20-0130). XRD data were generated using the research infrastructure at the University of Copenhagen, partly funded by FOODHAY (Food and Health Open Innovation Laboratory, Danish Roadmap for Research Infrastructure). Plant Carb ApS is acknowledged for providing amylose to the project.

Institutional Review Board Statement

Not applicable.

Informed Consent Statement

Not applicable.

Data Availability Statement

Data are contained within the article and Supplementary Materials.

Conflicts of Interest

The authors declare no conflicts of interest. The funders had no role in the design of the study; in the collection, analyses, or interpretation of data; in the writing of the manuscript, or in the decision to publish the results.

References

  1. Ahmed, M.; Bose, I.; Nousheen; Roy, S. Development of Intelligent Indicators Based on Cellulose and Prunus Domestica Extracted Anthocyanins for Monitoring the Freshness of Packaged Chicken. Int. J. Biomater. 2024, 2024, 7949258. [Google Scholar] [CrossRef] [PubMed]
  2. Ajaykumar, V.J.; Mandal, P.K. Modern Concept and Detection of Spoilage in Meat and Meat Products; Elsevier Inc.: Amsterdam, The Netherlands, 2019; ISBN 9780128192337. [Google Scholar]
  3. Akhila, K.; Ramakanth, D. Plant Phytochemicals as Bio-Responsive Compounds in Smart Packaging for Food Spoilage Detection: A Comprehensive Review. Sustain. Food Technol. 2024. [Google Scholar] [CrossRef]
  4. Ma, Q.; Liang, T.; Cao, L.; Wang, L. Intelligent Poly (Vinyl Alcohol)-Chitosan Nanoparticles-Mulberry Extracts Films Capable of Monitoring PH Variations. Int. J. Biol. Macromol. 2018, 108, 576–584. [Google Scholar] [CrossRef] [PubMed]
  5. Luchese, C.L.; Sperotto, N.; Spada, J.C.; Tessaro, I.C. Effect of Blueberry Agro-Industrial Waste Addition to Corn Starch-Based Films for the Production of a PH-Indicator Film. Int. J. Biol. Macromol. 2017, 104, 11–18. [Google Scholar] [CrossRef] [PubMed]
  6. Zhai, X.; Shi, J.; Zou, X.; Wang, S.; Jiang, C.; Zhang, J.; Huang, X.; Zhang, W.; Holmes, M. Novel Colorimetric Films Based on Starch/Polyvinyl Alcohol Incorporated with Roselle Anthocyanins for Fish Freshness Monitoring. Food Hydrocoll. 2017, 69, 308–317. [Google Scholar] [CrossRef]
  7. Lee, E.J.; Shin, H.S. Development of a Freshness Indicator for Monitoring the Quality of Beef during Storage. Food Sci. Biotechnol. 2019, 28, 1899–1906. [Google Scholar] [CrossRef] [PubMed]
  8. Sobhan, A.; Muthukumarappan, K.; Wei, L. A Biopolymer-Based PH Indicator Film for Visually Monitoring Beef and Fish Spoilage. Food Biosci. 2022, 46, 101523. [Google Scholar] [CrossRef]
  9. Musso, Y.S.; Salgado, P.R.; Mauri, A.N. Gelatin Based Films Capable of Modifying Its Color against Environmental PH Changes. Food Hydrocoll. 2016, 61, 523–530. [Google Scholar] [CrossRef]
  10. Păușescu, I.; Dreavă, D.M.; Bîtcan, I.; Argetoianu, R.; Dăescu, D.; Medeleanu, M. Bio-Based PH Indicator Films for Intelligent Food Packaging Applications. Polymers 2022, 14, 3622. [Google Scholar] [CrossRef]
  11. Mishra, R.K.; Sabu, A.; Tiwari, S.K. Materials Chemistry and the Futurist Eco-Friendly Applications of Nanocellulose: Status and Prospect. J. Saudi Chem. Soc. 2018, 22, 949–978. [Google Scholar] [CrossRef]
  12. Carciofi, M.; Blennow, A.; Jensen, S.L.; Shaik, S.S.; Henriksen, A.; Buléon, A.; Holm, P.B.; Hebelstrup, K.H. Concerted Suppression of All Starch Branching Enzyme Genes in Barley Produces Amylose-Only Starch Granules. BMC Plant Biol. 2012, 12, 223. [Google Scholar] [CrossRef] [PubMed]
  13. Sagnelli, D.; Hooshmand, K.; Kemmer, G.C.; Kirkensgaard, J.J.K.; Mortensen, K.; Giosafatto, C.V.L.; Holse, M.; Hebelstrup, K.H.; Bao, J.; Stelte, W.; et al. Cross-Linked Amylose Bio-Plastic: A Transgenic-Based Compostable Plastic Alternative. Int. J. Mol. Sci. 2017, 18, 2075. [Google Scholar] [CrossRef] [PubMed]
  14. Faisal, M.; Bevilacqua, M.; Bro, R.; Bordallo, H.N.; Judas, J.; Kirkensgaard, K.; Hebelstrup, K.H.; Blennow, A. International Journal of Biological Macromolecules Colorimetric PH Indicators Based on Well-Defined Amylose and Amylopectin Matrices Enriched with Anthocyanins from Red Cabbage. Int. J. Biol. Macromol. 2023, 250, 126250. [Google Scholar] [CrossRef] [PubMed]
  15. Xu, J.; Sagnelli, D.; Faisal, M.; Perzon, A.; Taresco, V.; Mais, M.; Giosafatto, C.V.L.; Hebelstrup, K.H.; Ulvskov, P.; Jørgensen, B.; et al. Amylose/Cellulose Nanofiber Composites for All-Natural, Fully Biodegradable and Flexible Bioplastics. Carbohydr. Polym. 2021, 253, 117277. [Google Scholar] [CrossRef] [PubMed]
  16. Klemm, D.; Cranston, E.D.; Fischer, D.; Gama, M.; Kedzior, S.A.; Kralisch, D.; Kramer, F.; Kondo, T.; Lindström, T.; Nietzsche, S.; et al. Nanocellulose as a Natural Source for Groundbreaking Applications in Materials Science: Today’s State. Mater. Today 2018, 21, 720–748. [Google Scholar] [CrossRef]
  17. Holland, C.; Perzon, A.; Cassland, P.R.C.; Jensen, J.P.; Langebeck, B.; Sørensen, O.B.; Whale, E.; Hepworth, D.; Plaice-Inglis, R.; Moestrup, Ø.; et al. Nanofibers Produced from Agro-Industrial Plant Waste Using Entirely Enzymatic Pretreatments. Biomacromolecules 2019, 20, 443–453. [Google Scholar] [CrossRef] [PubMed]
  18. Ezati, P.; Tajik, H.; Moradi, M.; Molaei, R. Intelligent PH-Sensitive Indicator Based on Starch-Cellulose and Alizarin Dye to Track Freshness of Rainbow Trout Fillet. Int. J. Biol. Macromol. 2019, 132, 157–165. [Google Scholar] [CrossRef] [PubMed]
  19. Swain, S.; Mohanty, B. Modified Atmosphere Packaging of Fish and Fishery Products: A Review. J. Entomol. Zool. Stud. 2020, 8, 651–659. [Google Scholar]
  20. Perzon, A.; Jørgensen, B.; Ulvskov, P. Sustainable Production of Cellulose Nanofiber Gels and Paper from Sugar Beet Waste Using Enzymatic Pre-Treatment. Carbohydr. Polym. 2020, 230, 115581. [Google Scholar] [CrossRef] [PubMed]
  21. Sharma, R.; Dhamodharan, R. Tannic Acid Crosslinked Chitosan-Guar Gum Composite Films for Packaging Application. Int. J. Biol. Macromol. 2024, 260, 129317. [Google Scholar] [CrossRef]
  22. Rambabu, K.; Bharath, G.; Banat, F.; Show, P.L.; Cocoletzi, H.H. Mango Leaf Extract Incorporated Chitosan Antioxidant Film for Active Food Packaging. Int. J. Biol. Macromol. 2019, 126, 1234–1243. [Google Scholar] [CrossRef] [PubMed]
  23. Elhadef, K.; Chaari, M.; Akermi, S.; Ben Hlima, H.; Ennouri, M.; Abdelkafi, S.; Agriopoulou, S.; Ali, D.S.; Boulekbache-Makhlouf, L.; Mellouli, L.; et al. PH-Sensitive Films Based on Carboxymethyl Cellulose/Date Pits Anthocyanins: A Convenient Colorimetric Indicator for Beef Meat Freshness Tracking. Food Biosci. 2024, 57, 103508. [Google Scholar] [CrossRef]
  24. Faisal, M.; Žmirić, M.; Kim, N.; Bruun, S.; Mariniello, L.; Famiglietti, M.; Bordallo, H.; Kirkensgaard, J.; Jørgensen, B.; Ulvskov, P.; et al. A Comparison of Cellulose Nanocrystals and Nanofibers as Reinforcements to Amylose-Based Composite Bioplastics. Coatings 2023, 13, 1573. [Google Scholar] [CrossRef]
  25. Tian, Y.; Petersen, B.L.; Liu, X.; Li, H.; Kirkensgaard, J.J.K.; Enemark-Rasmussen, K.; Khakimov, B.; Hebelstrup, K.H.; Zhong, Y.; Blennow, A. Characterization of Different High Amylose Starch Granules. Part Ⅱ: Structure Evolution during Digestion and Distinct Digestion Mechanisms. Food Hydrocoll. 2024, 149, 109593. [Google Scholar] [CrossRef]
  26. Jessen, C.H.; Bendix, J.; Nannestad, T.B.; Bordallo, H.N.; Pedersen, M.J.; Pedersen, C.M.; Bols, M. Methane Capture with α-Cyclodextrins. New J. Chem. 2023, 47, 14624–14629. [Google Scholar] [CrossRef]
  27. Liu, J.; Meng, C.; Liu, S.; Kan, J.; Jin, C. hai Preparation and Characterization of Protocatechuic Acid Grafted Chitosan Films with Antioxidant Activity. Food Hydrocoll. 2017, 63, 457–466. [Google Scholar] [CrossRef]
  28. Babic Milijasevic, J.; Milijasevic, M.; Djordjevic, V. Modified Atmosphere Packaging of Fish-An Impact on Shelf Life. IOP Conf. Ser. Earth Environ. Sci. 2019, 333, 012028. [Google Scholar] [CrossRef]
  29. Heir, E.; Solberg, L.E.; Jensen, M.R.; Skaret, J.; Grøvlen, M.S.; Holck, A.L. Improved Microbial and Sensory Quality of Chicken Meat by Treatment with Lactic Acid, Organic Acid Salts and Modified Atmosphere Packaging. Int. J. Food Microbiol. 2022, 362, 109498. [Google Scholar] [CrossRef] [PubMed]
  30. Zhang, X.; Wang, H.; Li, N.; Li, M.; Xu, X. High CO2-Modified Atmosphere Packaging for Extension of Shelf-Life of Chilled Yellow-Feather Broiler Meat: A Special Breed in Asia. LWT 2015, 64, 1123–1129. [Google Scholar] [CrossRef]
  31. Liu, D.; Cui, Z.; Shang, M.; Zhong, Y. A Colorimetric Film Based on Polyvinyl Alcohol/Sodium Carboxymethyl Cellulose Incorporated with Red Cabbage Anthocyanin for Monitoring Pork Freshness. Food Packag. Shelf Life 2021, 28, 100641. [Google Scholar] [CrossRef]
  32. Pourjavaher, S.; Almasi, H.; Meshkini, S.; Pirsa, S.; Parandi, E. Development of a Colorimetric PH Indicator Based on Bacterial Cellulose Nanofibers and Red Cabbage (Brassica oleraceae) Extract. Carbohydr. Polym. 2017, 156, 193–201. [Google Scholar] [CrossRef] [PubMed]
  33. Gillgren, T.; Blennow, A.; Pettersson, A.J.; Stading, M. Modulating Rheo-Kinetics of Native Starch Films towards Improved Wet-Strength. Carbohydr. Polym. 2011, 83, 383–391. [Google Scholar] [CrossRef]
  34. Ma, X.; Yu, J.; Kennedy, J.F. Studies on the Properties of Natural Fibers-Reinforced Thermoplastic Starch Composites. Carbohydr. Polym. 2005, 62, 19–24. [Google Scholar] [CrossRef]
  35. Qin, Y.; Liu, Y.; Yong, H.; Liu, J.; Zhang, X.; Liu, J. Preparation and Characterization of Active and Intelligent Packaging Films Based on Cassava Starch and Anthocyanins from Lycium Ruthenicum Murr. Int. J. Biol. Macromol. 2019, 134, 80–90. [Google Scholar] [CrossRef] [PubMed]
  36. Versino, F.; García, M.A. Cassava (Manihot esculenta) Starch Films Reinforced with Natural Fibrous Filler. Ind. Crops Prod. 2014, 58, 305–314. [Google Scholar] [CrossRef]
  37. Garcia, P.S.; Grossmann, M.V.E.; Shirai, M.A.; Lazaretti, M.M.; Yamashita, F.; Muller, C.M.O.; Mali, S. Improving Action of Citric Acid as Compatibiliser in Starch/Polyester Blown Films. Ind. Crops Prod. 2014, 52, 305–312. [Google Scholar] [CrossRef]
  38. Ge, Y.; Li, Y.; Bai, Y.; Yuan, C.; Wu, C.; Hu, Y. Intelligent Gelatin/Oxidized Chitin Nanocrystals Nanocomposite Films Containing Black Rice Bran Anthocyanins for Fish Freshness Monitorings. Int. J. Biol. Macromol. 2020, 155, 1296–1306. [Google Scholar] [CrossRef] [PubMed]
  39. Prachayawarakorn, J.; Ruttanabus, P.; Boonsom, P. Effect of Cotton Fiber Contents and Lengths on Properties of Thermoplastic Starch Composites Prepared from Rice and Waxy Rice Starches. J. Polym. Environ. 2011, 19, 274–282. [Google Scholar] [CrossRef]
  40. Prietto, L.; Correa, T.; Fernanda, J.; Levien, N.; Lim, L.; Renato, A.; Dias, G.; Zavareze, R. PH-Sensitive Fi Lms Containing Anthocyanins Extracted from Black Bean Seed Coat and Red Cabbage. LWT 2017, 80, 492–500. [Google Scholar] [CrossRef]
  41. Shalwan, A.; Yousif, B.F. In State of Art: Mechanical and Tribological Behaviour of Polymeric Composites Based on Natural Fibres. Mater. Des. 2013, 48, 14–24. [Google Scholar] [CrossRef]
  42. Mikołajczyk-Bator, K.; Pawlak, S. The Effect of Thermal Treatment on Antioxidant Capacity and Pigment Contents in Separated Betalain Fractions. Acta Sci. Pol. Technol. Aliment. 2016, 15, 257–265. [Google Scholar] [CrossRef] [PubMed]
  43. Wang, W.; Liu, X.; Guo, F.; Yu, Y.; Lu, J.; Li, Y.; Cheng, Q.; Peng, J.; Yu, G. Biodegradable Cellulose/Curcumin Films with Janus Structure for Food Packaging and Freshness Monitoring. Carbohydr. Polym. 2024, 324, 121516. [Google Scholar] [CrossRef] [PubMed]
  44. Mujtaba, M.; Salaberria, A.M.; Andres, M.A.; Kaya, M.; Gunyakti, A.; Labidi, J. International Journal of Biological Macromolecules Utilization of Flax (Linum usitatissimum) Cellulose Nanocrystals as Reinforcing Material for Chitosan Films. Int. J. Biol. Macromol. 2017, 104, 944–952. [Google Scholar] [CrossRef] [PubMed]
  45. Gram, L. How to Meet an FSO: Control of Listeria Monocytogenes in the Smoked Fish Industry. Mitteilungen Leb. Hyg. 2004, 95, 59–67. [Google Scholar]
  46. Chen, M.; Yan, T.; Huang, J.; Zhou, Y.; Hu, Y. Fabrication of Halochromic Smart Films by Immobilizing Red Cabbage Anthocyanins into Chitosan/Oxidized-Chitin Nanocrystals Composites for Real-Time Hairtail and Shrimp Freshness Monitoring. Int. J. Biol. Macromol. 2021, 179, 90–100. [Google Scholar] [CrossRef] [PubMed]
  47. Opara, U.L.; Fadiji, T.; Caleb, O.J.; Oluwole, A.O. Effects of Modified Atmosphere Packaging, Storage Temperature, and Absorbent Pads on the Quality of Fresh Cape Hake Fish Fillets. Coatings 2022, 12, 310. [Google Scholar] [CrossRef]
  48. Chen, S.H.; Fegan, N.; Kocharunchitt, C.; Bowman, J.P.; Duffy, L.L. Changes of the Bacterial Community Diversity on Chicken Carcasses through an Australian Poultry Processing Line. Food Microbiol. 2020, 86, 103350. [Google Scholar] [CrossRef] [PubMed]
  49. Zou, Y.; Yuan, C.; Cui, B.; Sha, H.; Liu, P.; Lu, L.; Wu, Z.; Yuan, C. High-Amylose Corn Starch/Konjac Glucomannan Composite Film: Reinforced by Incorporating β-Cyclodextrin. J. Agric. Food Chem. 2021, 69, 2493–2500. [Google Scholar] [CrossRef]
Figure 1. (a) Minced fish samples with gas mixture (30% CO2 and 70% N2); (b) minced meat samples with gas mixture (30% CO2 + 70% O2).
Coatings 14 00725 g001
Figure 2. Control samples preparation. (a) sterilized wet cotton samples; indicator films added and packaged under MAP gas mixtures of, (b) 30% CO2 and 70% N2, (c) 30% CO2 + 70% O2.
Coatings 14 00725 g002
Figure 3. FTIR curves of (a) AM-RCA composite films and (b) AM-NR composite films.
Coatings 14 00725 g003
Figure 4. WAXS curves of composite indicators. (a) AM-RCA with different CNF compositions; (b) AM-NR with different CNF compositions.
Coatings 14 00725 g004
Figure 5. Thermograms: (a) TGA and DTG curves of AM-RCA matrix and its composite films with CNFs; (b) TGA and DTG curves of AM-NR matrix and its composites with CNFs.
Coatings 14 00725 g005
Figure 6. The mechanical properties of AM-RCA, AM-NR, and the composite films. Different letters represent statistical differences (p ≤ 0.05) n = 3.
Coatings 14 00725 g006
Figure 7. Light transmittance curves: (a) RCA composite films; (b) NR composite films.
Coatings 14 00725 g007
Figure 8. SEM of cross-sections of (a) AM-RCA, (b) 5AC-RCA, (c) 10AC-RCA, (d) 15AC-RCA, (e) 25AC-RCA, (f) 35AC-RCA, (g) AM-NR, (h) 5AC-NR, (i) 10AC-NR, (j) 15AC-NR, (k) 25AC-NR, and (l) 35AC-NR.
Coatings 14 00725 g008
Figure 9. RCA and NR indicator film color changes in MAP samples.
Coatings 14 00725 g009
Figure 10. ∆E and pH of RCA and NR indicator film color changes in MAP samples.
Coatings 14 00725 g010
Table 1. Physical properties of AM-RCA/AM-NR nanocomposite indicator films, n = 3; same letters in the same column are significantly different (p < 0.05).
FilmsMC%WS%Relative Crystallinity
(RC)%
TGA
(°C)
AM-RCA8.7 ± 2.9 a16.7 ± 6.9 a19.2 ± 0.1 a309.5 ± 3.5 d
5AC-RCA18.4 ± 7.0 a,b14.5 ± 9.5 a15.8 ± 0.1 a309.0 ± 1.4 c,d
10AC-RCA12.9 ± 1.7 a,b24.6 ± 17.3 a14.8 ± 0.1 a306.0 ± 1.4 b–d
15AC-RCA19.5 ± 6.2 a,b16.8 ± 3.0 a15.0 ± 0.1 a307.0 ± 2.1 b–d
25AC-RCA16.9 ± 7.4 a,b21.4 ± 6.3 a14.1 ± 0.1 a308.0 ± 2.8 c,d
35AM-RCA18.5 ± 2.9 a,b11.3 ± 3.8 a20.7 ± 0.1 a311.0 ± 2.8 d
AM-NR19.4 ± 1.9 a,b24.2 ± 7.1 a21.2 ± 0.1 a310.5 ± 0.7 d
5AC-NR23.4 ± 2.0 b15.9 ± 0.8 a20.1 ± 0.1 a310.8 ± 3.5 d
10AC-NR19.3 ± 2.7 a,b19.5 ± 5.1 a18.7 ± 0.1 a301.5 ± 2.8 a–c
15AC-NR17.2 ± 2.0 a,b14.6 ± 2.0 a18.0 ± 0.1 a299.5 ± 0.7 a,b
25AC-NR18.2 ± 2.7 a,b14.6 ± 6.3 a14.9 ± 0.1 a298.3 ± 0.3 a
35AC-NR20.8 ± 3.9 b16.1 ± 5.1 a19.6 ± 0.1 a299.3 ± 1.4 a,b
Table 2. Thickness and barrier properties of AM and composite indicators. Different letters in a row indicate significant differences (p < 0.05). n = 4 for thickness; n = 2 for WVP.
FilmsThickness
(mm)
Permeability
(cm3 × mm/(m2 × h × kPa))
O2CO2H2O
AM-RCA0.07 ± 0.01 c4.28 ± 1.04 b0.14 ± 0.00 a4.48 ± 0.64 a
5AC-RCA0.06 ± 0.01 b-cNDNDND
10AC-RCA0.04 ± 0.01 a–c6.57 ± 0.96 c0.12 ± 0.00 a4.45 ±0.38 a
15AC-RCA0.06 ± 0.01 b,cNDNDND
25AC-RCA0.05 ± 0.01 a–cNDNDND
35AC-RCA0.04 ± 0.01 a–c0.03 ± 0.00 a0.52 ± 0.11 c8.99 ± 0.28 c
AM-NR0.05 ± 0.01 a-cNDNDND
5AC-NR0.05 ± 0.01 b,cNDNDND
10AC-NR0.06 ± 0.01 b,cNDNDND
15AC-NR0.07 ± 0.01 b,c0.86 ± 0.11 a0.23 ± 0.01 a6.91 ± 0.55 b
25AC-NR0.06 ± 0.01 b,c0.01 ±0.00 a0.55 ±0.00 c11.11 ± 0.32 d
35AC-NR0.05 ± 0.01 a–c0.05 ± 0.01 a0.36 ± 0.018.73 ± 0.44 c
Table 3. Microbial counts and pH of MAP samples of minced meat and fish (mean ± SD); n = 5. Different letters within columns indicate significant differences p < 0.05, n = 5 between different storage days.
DaysMicrobial Count
(Meat)
pH
(Meat)
Microbial Count
(Fish)
pH
(Fish)
14.46 ± 0.17 a5.81 ± 0.03 a,b2.35 ± 0.07 a6.16 ± 0.02 a–c
35.42 ± 0.10 b6.49 ± 1.35 b2.28 ± 0.32 a6.26 ± 0.03 c,d
67.40 ± 0.18 c5.96 ± 0.06 a,b4.56 ± 0.30 b6.44 ± 0.05 e
88.02 ± 0.05 d5.72 ± 0.15 a,b5.85 ± 0.36 c6.26 ± 0.04 b,c
108.2 ± 0.2 d,e6.00 ± 0.03 a6.99 ± 0.36 d6.32 ± 0.04 d
138.22 ± 0.02 d,e5.45 ± 0.02 a8.23 ± 0.20 e6.15 ± 0.09 a,b
158.16 ± 0.05 d,e5.44 ± 0.02 a8.23 ± 0.05 e6.11 ± 0.04 a
178.26 ± 0.13 e5.39 ± 0.12 a8.37 ± 0.07 e6.07 ± 0.04 a
208.13 ± 0.04 d,e5.48 ± 0.04 a8.45 ± 0.06 e6.24 ± 0.09 b–d
Table 4. Sensory analysis of meat and fish (mean ± SD); n = 5; different letters within columns indicate significant differences p < 0.05 between different storage days.
DaysMeat AppearanceMeat OdorFish AppearanceFish Odor
01 ± 0.0 a1 ± 0.0 a1 ± 0.0 a1.0 ± 0.1 a
31.3 ± 0.1 a,b1.4 ± 0.3 a,b1.4 ± 0.2 a,b1.2 ± 0.3 a,b
61.5 ± 0.4 b2.1 ± 0.6 b1.7 ± 0.4 a–c1.7 ± 0. 3 a–c
82.7 ± 0.9 c3.2 ± 1.1 c1.8 ± 0. 5 a–c1.8 ± 0.6 b,c
103.3 ± 1.1 d3.2 ± 1.1 c1.7 ± 0. 3 a–c2.0 ± 0.6 c,d
13NDND2.3 ± 0.7 c,d2.5 ± 1.0 d,e
15NDND2.4 ± 0.7 d2.7 ± 0.9 e
17NDND2.9 ± 1.0 d3.1 ± 1.1 e
20NDND2.6 ± 0. 8 d3.2 ± 1.17 e
ND: not determined.
Disclaimer/Publisher’s Note: The statements, opinions and data contained in all publications are solely those of the individual author(s) and contributor(s) and not of MDPI and/or the editor(s). MDPI and/or the editor(s) disclaim responsibility for any injury to people or property resulting from any ideas, methods, instructions or products referred to in the content.

