Article

Study on the Multi-Physical Field Simulation of the Double-Glow Plasma Alloying Process Parameters

1
Institute of Advanced Materials and Flexible Electronics (IAMFE), School of Chemistry and Materials Science, Nanjing University of Information Science and Technology, Nanjing 210044, China
2
School of Physics, South China Normal University, Guangzhou 510006, China
3
Shougang Zhixin Electromagnetic Material R&D (Beijing) Co., Ltd., Beijing 100043, China
4
College of Mechanical and Electrical Engineering, Nanjing University of aeronautics and astronautics, Nanjing 210044, China
*
Author to whom correspondence should be addressed.
Coatings 2024, 14(9), 1175; https://doi.org/10.3390/coatings14091175
Submission received: 1 August 2024 / Revised: 3 September 2024 / Accepted: 9 September 2024 / Published: 11 September 2024
(This article belongs to the Special Issue Recent and Future Applications of Coatings for Semiconductors)

Abstract

:
In order to study the coupling mechanism of the process parameters during the double-glow discharge process, and thus to enhance the theoretical study of double-glow plasma surface metallurgical technology, in this paper, a two-dimensional fluid model is established using COMSOL simulation software. The effects of key processing factors on the distribution of electrons and excited argon ions, potential and electron temperature in the coupling process of double-glow discharge were investigated. The results indicated that the electron density between the two electrode plates increases as the voltage difference increases. The optimal working pressure was kept between 0.14 Torr and 0.29 Torr. The optimal electrode spacing was between 15 mm and 30 mm and decreased with the increase in pressure. Compared with the actual plasma surface alloying process experiment, the simulation results were consistent with the experiments. The research can guide experiments by combining simulation and theory, and the predictability and accuracy of double-glow surface metallurgy technology have been improved.

1. Introduction

Glow discharge plays an important role in environmental remediation, material processing and other fields [1,2,3,4]. The double-glow plasma surface alloying (DGPSA) technology can form an alloy layer with special functions on the cathode workpiece. It has received widespread attention in the fields of preparation of new materials and material surface treatment modification [5,6,7,8].
The DGPSA technology is to assemble the source composed of anode, cathode and target material in a vacuum container. A voltage-adjustable DC power supply is connected between the anode, the cathode and the source, respectively. After the power is turned on, glow discharge occurs at the source under vacuum conditions. The argon gas is ionized to produce argon ions. Under the action of the electric field, the high-energy argon ions bombard the source target, forming modifications of the elements to be infiltrated on the surface of the workpiece with wear resistance, corrosion resistance, high-temperature oxidation resistance and other modified layers. When the distance between the cathode and the source is reduced to a certain value, the negative glow areas on the surfaces of the two electrodes overlap each other, the ionization and excitation efficiency is greatly improved and the plasma density increases. This phenomenon is called the “hollow cathode discharge (HCD)” [9]. While some researchers have undertaken experimental study on HCD [10,11,12], the precise link between several process factors, such as working pressure, electrode spacing, source and cathode voltage and the dispersion of plasma fields, has yet to be discovered. Additional discourse will aid in optimizing the plasma surface alloying procedure. Hence, conducting theoretical study on DGPSA technology holds immense importance for advancing its use in the domain of metal alloying.
Based on the double-glow plasma discharge model, relevant theoretical work can be carried out. In the past decade, plasma discharge modelling has provided effective analytical methods for plasma formation. Chu et al. [13] established a two-dimensional plasma fluid model coupled with a circuit model as a boundary condition. Using the applied voltage as a control parameter in the simulation, the spatial distribution of the plasma parameters of the bifurcation–remerging process is also examined. Bayki et al. [14] introduced a one-dimensional (1D) model for predicting the characteristics of electrical discharge machining plasma as a dielectric in air. This model can provide valuable insights into the impact of parameters on heat flux and energy consumption, thereby improving productivity and energy efficiency. Yu et al. [15] established a two-dimensional axisymmetric simulation model of a gas spark switch using COMSOL software (https://www.comsol.com/) and proposed a theoretical model for expressing the impedance of the plasma channel through a series combination of resistance and inductance. An improved pulse power switch has been designed to suppress circuit oscillations, thereby enhancing the anti-oscillation performance of the equipment. Yücel et al. [16] modeled and simulated AC-driven discharge using argon gas at atmospheric pressure (760 Torr) in a two-dimensional medium using COMSOL. This study compared the contribution of gas discharge semiconductor systems operating in direct current (DC) and alternating current (AC) modes to improving energy conversion efficiency. In the previous work, we compared the conditions under which HCD was generated in single- and double-glow hollow cathode discharges by simulation and experiment [17]. However, the coupling mechanism of the core process parameters and the distribution of the plasma field of the double-glow discharge have not been systematically investigated.
In the current proposed study, we systematically discussed the plasma field’s physical characteristics during the double-glow discharge surface modification using the method of a multiphysical simulation based on a two-dimensional fluid model. The effects of the processing parameters on the electron temperature, electron density, electric potential and density distribution of the excited argon ion number during double-glow discharge were studied. The correctness of the model is verified by comparing the numerical results with the experimental results and achieving the optimal processing parameters Therefore, the authors believe that the study of the coupling mechanism of various process parameters in the DGPSA technology will be helpful in obtaining better metal infiltration process parameters and better guide the surface treatment process.

2. Model Building

2.1. Mathematical Model

The drift–diffusion approximation is the basis of the fluid model employed in this investigation. Solving the linked continuity equation for charged matter, the energy balance equation for electrons and the Poisson equation yields the spatial and temporal distributions of the particles and the electric field [18,19].
For plasma parameters of discharge, the electron/ion continuity equation is expressed as
n k t + · Γ k = S k
where k represents the species of plasma particles, Γ k is the flux density and nk is the number density.
Γ k = D k n k + z k μ k E n k
where z k is the charge of electron/ion, S k is the plasma chemical processes given the source term, E is the electric field strength and D k and μ k represent the diffusion coefficient and mobility, respectively.
The electron energy balance equation is written as
n ε t + · Γ ε + e E · Γ k = S k ε
where k stands for electrons or ions, Γ ε is the heat flux:
Γ ε = n ε μ ε · E D ε · n ε
where the first term denotes convection due to the charged particles’ drift motion in the electric field, the second term denotes heat transfer due to the temperature gradient, n ε is the plasma energy density and Γ ε is heat flux density [20]; μ ε is energy mobility and D ε is the energy diffusion coefficient. S k ε is the energy loss resulting from collisional reactions between different particles in the plasma, and the third component on the left side of Equations (1)–(3) is the Joule heating term caused by the charged particles in the electric field. The relationship between electron mobility and D k , μ ε and D ε for a charged particle obeying a Maxwell distribution is as follows:
D k = μ k T k , μ ε = 5 3 μ k , D ε = μ ε T k
Thus, Formulas (1)–(4) can be written as
Γ ε = 5 2 D k · n k T k 5 2 μ k E n k T k
Since the gas ionization degree is so low and the ion temperature is typically near the background gas temperature, glow discharge eliminates the need to solve the equation for the conservation of ion energy and takes into account the energy lost in ion collisions. The energy conservation equation does not need to be solved for neutral gas particles since the temperature is assumed to be constant. The energy loss from elastic electron collisions with neutral gas atoms and the energy loss from inelastic electron collisions with all other heavy particles, including gas atoms, are included in the energy source term S e ε for electrons.
S e ε = 3 2 δ v e a n e ( T e T g ) + j ε j R j
where R j is the collision reaction rate, ε j is the energy gained or lost by the electron in the jth inelastic collision reaction and δ = 2 me/mi is the average energy loss rate for electron elastic collisions.
The electric field is obtained from the modified Poisson’s equation
2 φ = ρ ε ε 0
where ni and ne stand for the ion and electron number densities, respectively, φ is the potential, ε 0 is the vacuum dielectric constant and ρ = e (ni − ne) represents the net charge density.
The distributions of the plasma parameters, including the electron/ion number density, electron energy (temperature) and electric potential in time and space coordinates, are derived by jointly solving the aforementioned system of equations.
Based on the aforementioned plasma physical parameters, a model is developed to achieve a continuous glow discharge through secondary electron radiation under the conditions of argon ionization and collision with cathode ions, as well as under the influence of cathode ions. Table 1 [18] displays the seven potential collision reactions that might take place in the cavity when the discharge happens.

2.2. Double-Glow Physical Model in Simulation

The “double glow” describes the placement of a controlled DC power supply between the workpiece, anode and source electrode. A second electrode plate, known as a double cathode, has a negative potential and is part of the complete system. The vacuum pump creates two distinct types of glow discharge between the workpiece and anode and between the source electrode and anode. It also vacuums the entire furnace body and adds the proper amount of argon gas to the system. The double-glow hollow cathode discharge is created by two pairs of cathodes (the work-piece and the source) stimulated with two distinct electric potentials. Figure 1 illustrates the schematic representation of the electrode structure employed in the simulation of the double-glow plasma discharge. A hollow cathode is created by maintaining a particular spacing between the source and cathode. The upper plate functions as the source electrode, while the bottom plate serves as the workpiece cathode. The heat preservation cover has a height of 100 mm, a diameter of 110 mm and the distance between the source and the cathode is 5 to 25 mm.
When the two power sources are connected, a voltage difference will be generated, and the glow discharge will be generated along the source cathode and workpiece surfaces, respectively. At first, the negative glow regions of the two cathodes are well defined and do not intersect, as shown in Figure 1a. As shown in Figure 1b, the two cathode glow regions overlap and intersect with each other (Z2), resulting in glow crosslinking, increased glow intensity and double-glow discharge that can produce hollow cathode discharge. Since the discharge potentials of the two cathodes are not equal, we also call this phenomenon the unequal potential of hollow cathode discharge.
Simulate the effects of cathode source spacing and working pressure on plasma generation and distribution under given experimental conditions. The model mainly involves three electrodes: the grounding terminal anode (chamber), the size of which is consistent with the actual experimental furnace body, and two parallel cathodes which are placed on the top and bottom, respectively. To reduce the complexity of model calculations, the following assumptions are made to simplify the calculations:
(1)
Assuming the simplified furnace–body model is a two-dimensional axisymmetric geometric body, a cathode is set in the horizontal direction. A cylindrical rotating body is constructed with the center line as the axis; due to the axial symmetry of the discharge structure, the three-dimensional discharge structure can be simplified into a two-dimensional structure in the simulation.
(2)
Preliminary study on transient calculations of double-glow plasma and assuming local thermodynamic equilibrium.
(3)
In this simulation, the drift and transport of heavy matter in the electrode material were not considered, and only the generation of argon plasma in the furnace was considered.
(4)
The main research object is the discharge area between the two electrode plates. Therefore, when setting grid control edges, select areas close to the cathode and source plates to refine the grid of the main research area.
(5)
Glow intensity reflects the brightness and darkness of a glow, which is the most intuitive physical phenomenon. The main source of glow is excited argon ions, so the number density of excited argon ions is used to characterize glow intensity.
The Cartesian coordinate system is established, with the y-axis in the vertical direction and the x-axis in the horizontal direction. The reaction chamber is a rectangular shape with a width of 0.125 m and a height of 0.4 m, with the bottom located at y = 0. Two simulation plates are rectangular with a width of 0.075 m and a height of 0.006 m, with the center of the source plate (0, 0.273), as displayed in Figure 2. Set the reaction chamber wall as the dielectric, with the anode grounded and the cathode and source connected to the cathode power supply. The physical parameters utilized in the simulation are listed in Table 2 [21]. Fill the reaction chamber with argon gas.
Use multiphysics to simulate the physical field of plasma during the glow discharge process. The grid is divided inside the reaction chamber to calculate equations such as electron density, ion and atomic transport and boundary conditions. It is discretized in space and time, and transformed into a series of algebraic equations. The finite element method is used to solve differential algebraic equations, and Newton iteration techniques are employed at each time step to solve the nonlinear system of equations in the model. Finally, two-dimensional distribution and line graphs of electron density, cavity potential and various heavy matter densities over time and space were obtained in the two-dimensional cross-section of the cylindrical reaction chamber.
Table 2. Physical parameters used in the simulation.
Simulation ParametersSpecific Values
Anode voltage/V0
Source voltage/V−800
Cathode voltage/V−400
Initial   electron   density / ( 1 / m 3 ) 1   ×   10 13
Initial electron average energy/eV4
Absolute   pressure   P 0 /Pa20
Molar   mass   M w / ( kg · m o l 1 ) 4   ×   10 2
Approximate   electron   mobility   * μ e N n / [ 1 · ( m · V · s ) 1 ] 1   ×   10 25
Cathode secondary electron emission coefficient0.25
Source secondary electron emission coefficient0.25
Heavy matter initial temperature T/K300
*: The reduced electron mobility [22] can be calculated from the following equation, and the unit of the reduced electric field E n is Townsends (Td).
μ I o n , r e d 1 V   s   c m = 4.411 × 10 19 e x p 0.33   ln 1 + e x p 1.5   ln   7.721 × 10 3   E / n

2.3. Boundary Conditions of Plasma Field Model

In order to resolve the drift diffusion equations of electrons and heavy particles mentioned above, four different boundary conditions must be taken into account based on the plasma’s environment within the cavity [23,24]:
(1)
Anode boundary conditions: When electrons and ions touch the reaction chamber’s inner wall, they will be adsorbed. Following that
n Γ e = 0
n Γ i = 0
where n is the unit vector pointing in the direction of the anode surface, Γ e is the electron flux on the anode surface, Γ i is the ion flux on the anode surface and there is no normal charge flux at any location along this border, according to Equations (10) and (11).
(2)
Cathode boundary condition: The surface of the cathode experiences secondary emission when it is bombarded by positive ions:
n · Γ e = P γ P Γ i · n
n Γ ε = P γ P ε P Γ i · n
where γ P is the secondary electron emission coefficient of the positive ion, Γ i is the flux of positive ions on the wall (1/(m3∙s)), ε P is the average energy of the emitted electron (eV), n is the direction vector of the cathode plate pointing inside the container.
(3)
Reaction cavity wall boundary conditions: When electrons and ions move to the wall of the reaction cavity, charge builds up on it and creates an electrostatic field that reacts with the charged particles within the cavity. Therefore, the current density in the normal direction at the wall boundary should meet:
𝛛 σ 𝛛 t = n j e + n j i
n ε E = σ
where σ is the surface charge density, ε is the dielectric constant, j e is the current density formed by electrons, j i is the current density formed by ions.
External circuit boundary conditions: The voltage drop between the external circuit supply voltage and the plate voltage and the variable resistance should meet Kirchhoff’s voltage law:
V = V 0 I R
where V is the plate voltage of the cylindrical reaction cavity, V 0 is the supply voltage, R is the resistance value of the ballast resistance, I is the current in the external circuit.

3. Results and Discussion

3.1. Effect of Working Pressure on Plasma Parameters

At a cathode voltage of 400 V, a source voltage of 800 V and an electrode separation of 40 mm, the electron density distribution profiles under varying working pressures of 0.08 Torr, 0.30 Torr, 0.45 Torr and 0.75 Torr are illustrated in Figure 3a. As the working pressure increases, the electron number density increases, and the electron density distribution shows a tendency to cluster towards and surround the source. The source electrode plate functions within a low-potential range in the system, exerting a repulsive force on nearby electrons. At low pressure, there is a noticeable decrease in the density of electrons at the source electrode plate. Within the entire system, electrons primarily fulfill two distinct functions [25]. One aspect is that the electrons are displaced from the source electrode plate due to the influence of the electric field. Furthermore, due to the interplay among the electrons, they exhibit a tendency to migrate towards the source electrode plate. When subjected to low pressure, the electric field exerts a stronger influence compared to the interaction between electrons. As a result, the electrons are pushed away from the source electrode plate, leading to the formation of a region with low electron density around the plate. Nevertheless, as the work pressure intensifies, the electron interaction likewise escalates, prompting the electrons to surpass the repulsion from the source electrode and eventually move towards the source electrode plate.
Figure 3b illustrates the electron temperature distribution at the working pressures of 0.08 Torr, 0.30 Torr, 0.45 Torr and 0.75 Torr. Cold plasma discharges are characterized by an electron temperature, T e ≈ 1~10 V [26]. When the working pressure is low, the electron temperature is higher near the source electrode plate. When the working pressure increases, the electron temperature distribution of the source electrode plate gathers. Moreover, the maximum value is obtained at the edge of the source electrode plate, and it is considered that there is a violent edge effect at the edge of the plate.
The distribution of the system’s electric potential at the working pressures of 0.08 Torr, 0.30 Torr, 0.45 Torr and 0.75 Torr is depicted in Figure 3c. As work pressure increases, the potential near the electrode decreases and the low potential area shrinks.
Figure 3d illustrates the distribution of the number density of argon ions that are in an excited state at different working pressures: 0.08 Torr, 0.30 Torr, 0.45 Torr and 0.75 Torr. As the pressure rises, the number of energized argon ions also increases. At high pressure, the excited argon ions exhibit a higher degree of concentration in the vicinity of the source electrode plate, as opposed to the low-pressure state. Observing the cloud image allows us to determine that the excited argon ions in the medium-pressure area of the discharge system are primarily concentrated around the source electrode plate. When the highest value is obtained at the boundary of the source electrode plate, a distinct edge effect occurs at that boundary.
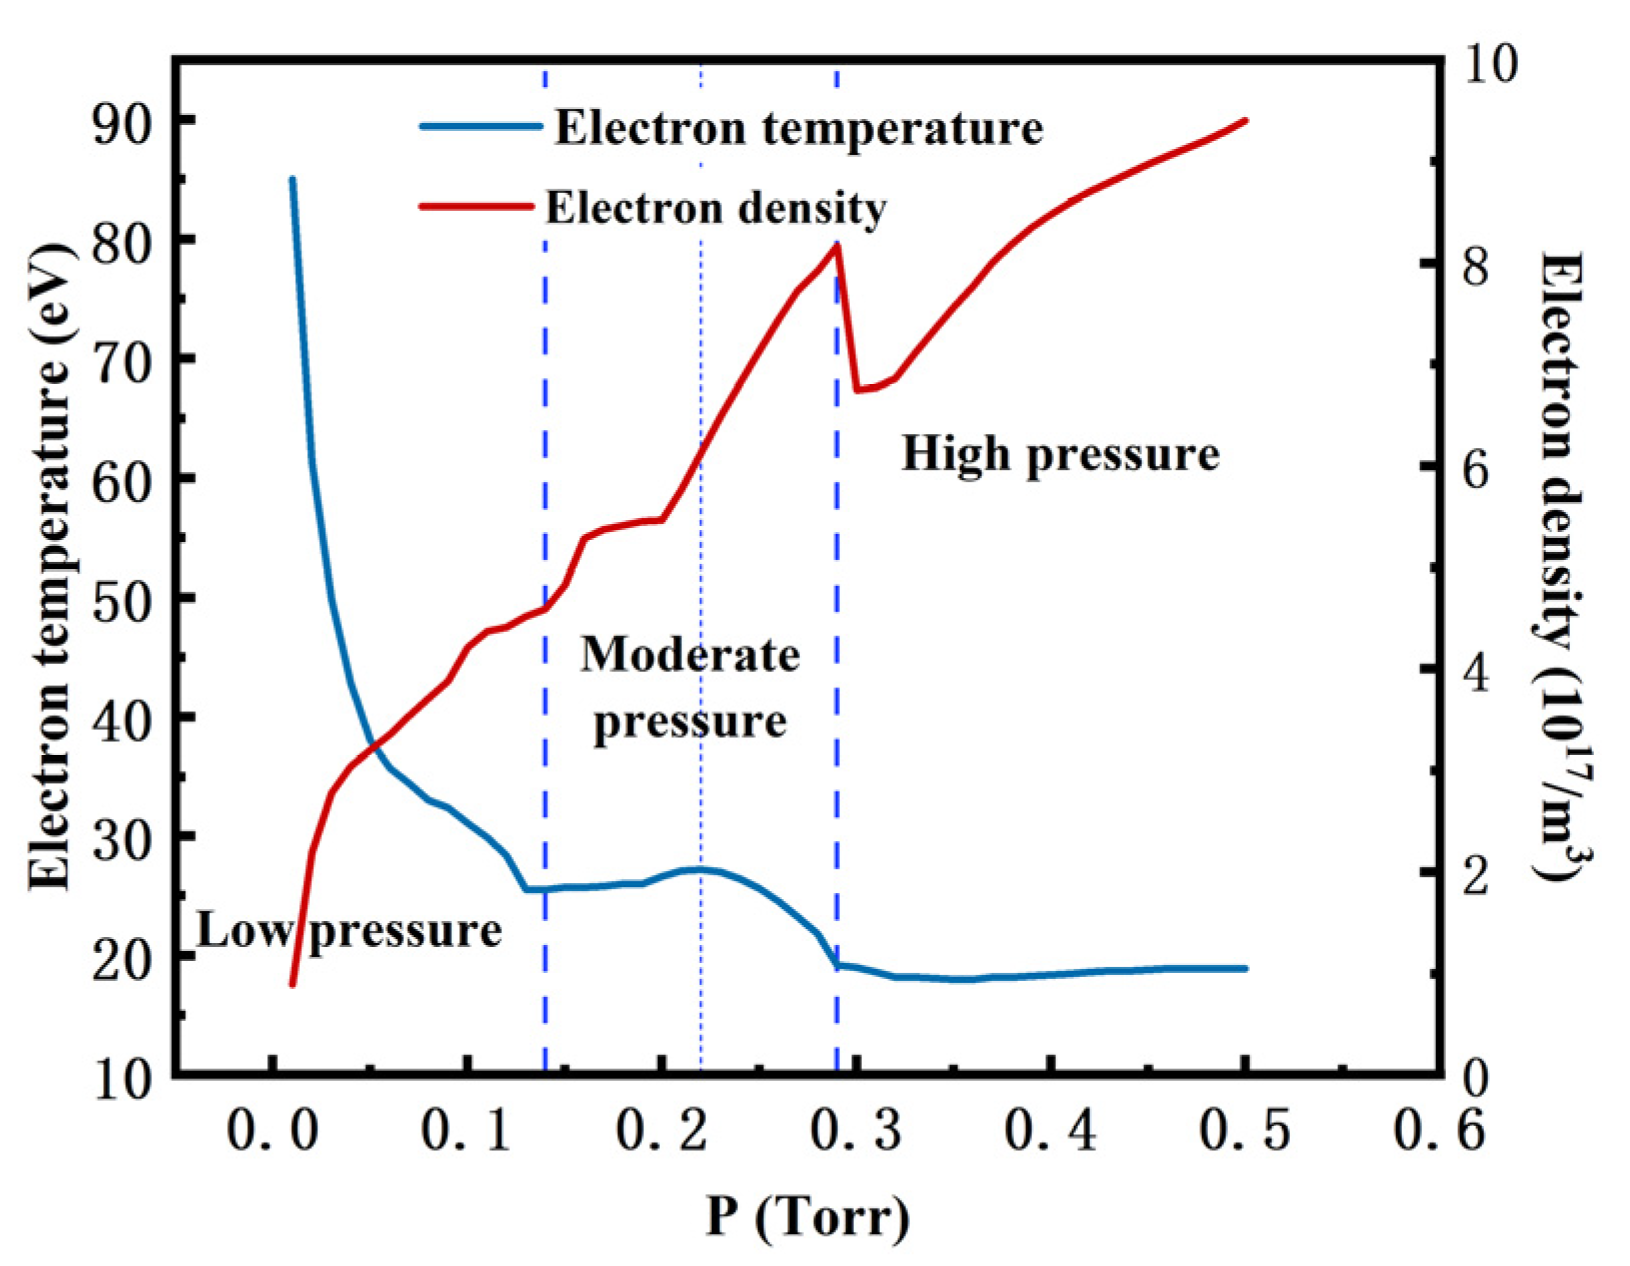
According to the results, the working pressure range of the double-glow plasma discharge alloying is generally 0.15 Torr–0.45 Torr, so the simulated range is 0.01 Torr–0.5 Torr, and the influence of pressure on the cathode electrode plate temperature and glow intensity is studied. In the simulation process, it was found that the high temperature range is distributed on the cathode electrode plate. The maximum electron temperature of the system is selected as the dependent variable, and then the influence of working pressure on the temperature of the cathode electrode plate is studied. The higher the temperature of the cathode electrode plate, the better the diffusion; the adsorption capacity and diffusion capacity of the workpiece are better. The sputtered metal elements can be better diffused onto the surface of the workpiece.
The purpose of the working pressure is to generate a specific quantity of shock waves for the target material [27]. Figure 4 illustrates a clear negative exponential relationship between electron temperature and operating pressure. However, it is important to highlight that there is a distinct peak in the center, which indicates the exceptional characteristics of the double-glow plasma. Based on this criterion, the curve will be segmented into three distinct sections: the region of low pressure (0.01 Torr–0.13 Torr), the region of moderate pressure (0.14 Torr–0.29 Torr) and the region of high pressure (0.3 Torr–0.5 Torr).
In low pressure, the maximum electron temperature of the system is high and plummets with the pressure increases. The reasons include the following two aspects [28]. On the one side, due to the large collision-free path of gas molecules when the working pressure is low, the gas molecules can accelerate to a higher speed. The higher the collision energy, the higher the corresponding electron temperature. With the increase in working pressure, the collision-free path of gas molecules begins to decrease, which is represented by the decrease in electron temperature on a macroscopic level. When the pressure increases to a certain extent, the decrease in electron temperature slows down. On the other hand, when the working pressure is low because there are too few ionized particles, the probability of ion collision with the plate is small, the plate current is small and the glow intensity is also low. Therefore, it is considered that the pressure range is not suitable for surface treatment.
The electron temperature in medium pressure exhibits a trend of initial increase followed by a subsequent decrease, reaching a peak. This observation suggests that an escalation in working pressure diminishes the collision-free path of gas molecules while elevating gas density, thereby heightening the likelihood of collisions with the electrode plate. Under the influence of these factors, the medium-pressure electron temperature first increases and then decreases, and there is a peak. The electrode plate temperature is the highest, and the peak corresponds to the optimum working pressure. With the increase of gas molecules, the collision frequency with the plate increases, and the collision frequency with ionized particles is still at a low level. The intensity change of the generated glow is not significant. As work pressure increases, part of the kinetic energy of the particles is converted into glow energy, while the other part is used for sputtering metal particles and heating the electrode plate. In terms of energy utilization, this time can serve as the optimal state for the process. In Figure 4, a drop in glow intensity occurs at a pressure of 0.29 Torr, which is the critical pressure for glow crosslinking. Below this pressure, glow crosslinking can occur, and a hollow cathode effect can occur. After this pressure, the system’s temperature essentially stops changing altogether.
In high pressure, the electron temperature changes slightly with the pressure, and the electron temperature remains stable. The glow intensity increases when the pressure increases, as shown in Figure 4. The energy of the newly added particle collision is mainly converted into glow energy, the particles colliding with the electrode plate have reached saturation and the system temperature no longer increases.
The findings indicate that while the low working pressure takes into account the temperature of the cathode electrode plate and the supply of metal elements, the middle pressure zone around the optimal alloying effect is thought to have better pressure.

3.2. Electrode Spacing’s Impact on the Plasma Parameters

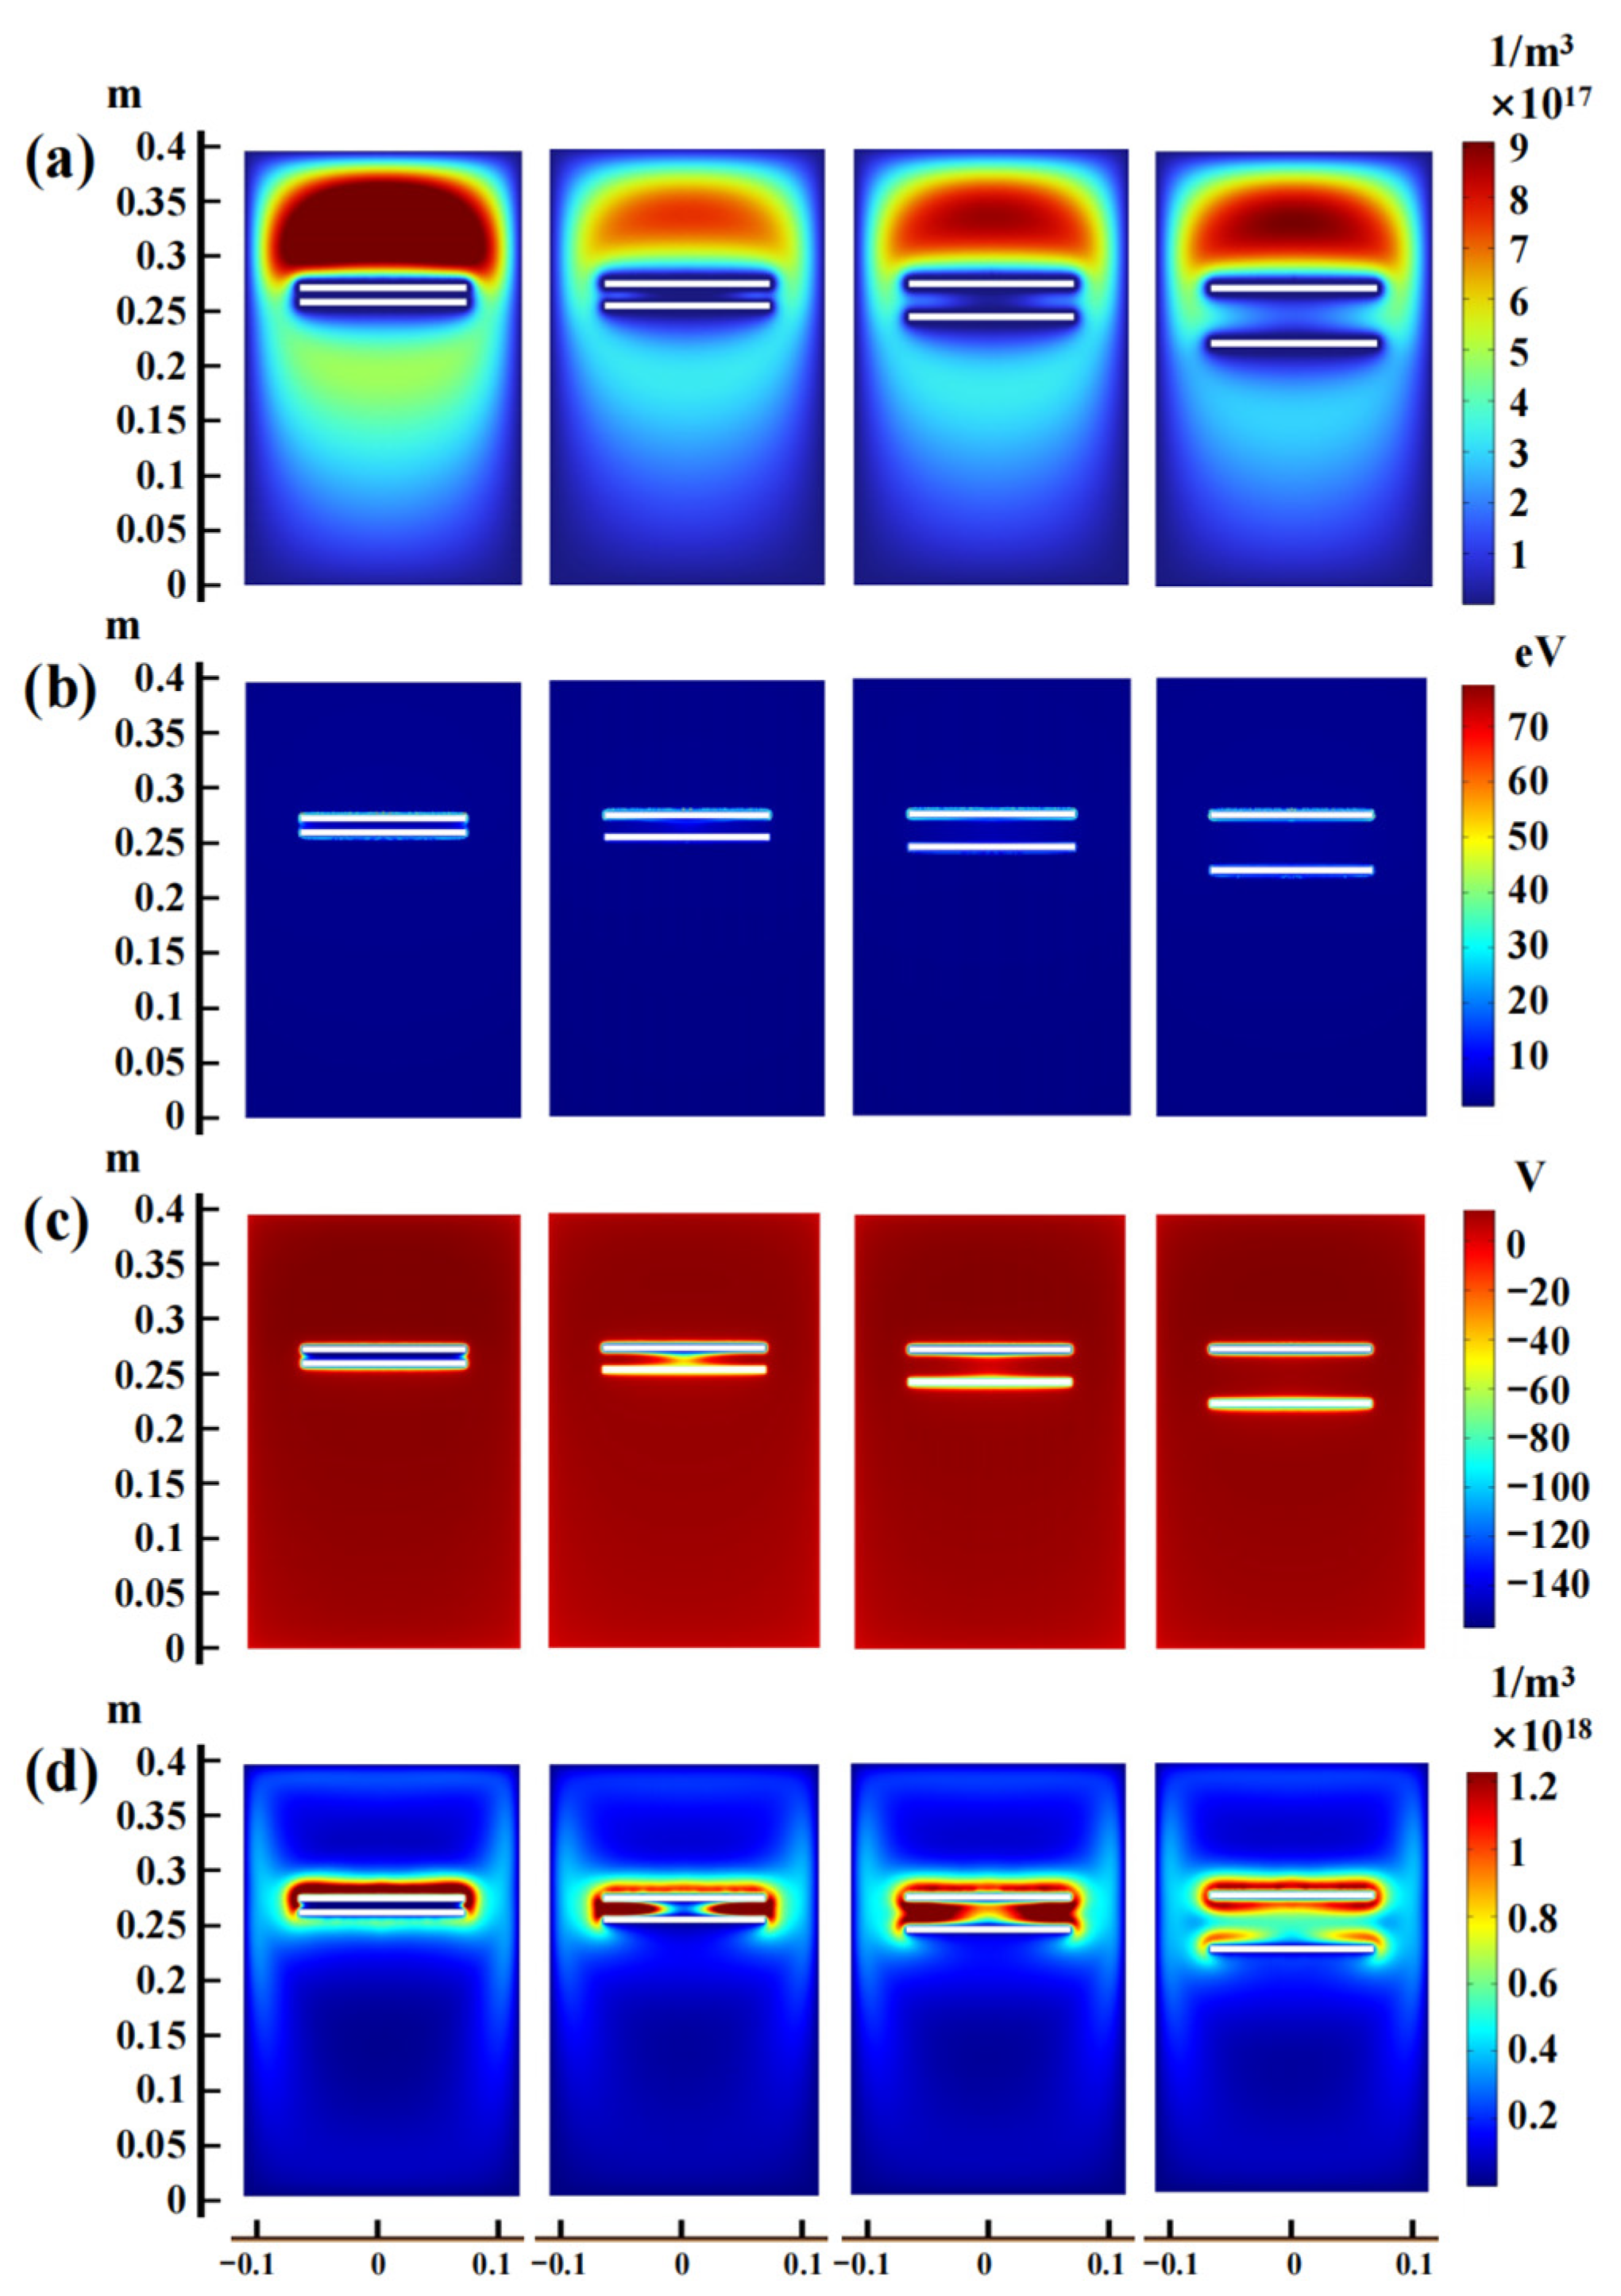
When the cathode voltage is 450 V, the source voltage is 950 V and the working pressure is 0.19 Torr, Figure 5 shows the distribution of different plasma physical fields when the electrode spacing is 3 mm, 10 mm, 20 mm and 40 mm, respectively. The electron density distribution cloud plots at the various electrode spacings are shown in Figure 5a. The findings suggest that a smaller electrode separation leads to a higher electron density at the source electrode plate. When subjected to an electric field, a narrow electrode spacing hinders the entry of electrons between the cathode and the source electrode plate. At an electrode spacing of 10 mm, there is a distinct separation between the sheath region and the negative glow zone. Currently, the electric field in the sheath region accelerates high-energy electrons, allowing them to completely oscillate within the overlapping negative glow zone. This leads to the formation of a plasma with high density. When the aperture is enlarged to 40 mm, the distance traveled by electrons passing through the sheath region and reaching the opposite sheath region increases. As a result, the electrons collide and lose energy, preventing them from reaching the opposite sheath region and generating oscillation. Consequently, the hollow cathode effect fails to occur.
Figure 5b shows the distribution of electron temperature at the different electrode spacings. The high electron temperature is distributed between the two electrode plates. As the electrode spacing increases, the maximum electron temperatures of 3 mm, 10 mm, 20 mm and 40 mm are 91.2 V, 72.6 V, 52.9 V and 78 V, respectively, showing a clear trend of first decreasing and then increasing.
Figure 5c illustrates the potential distribution under different electrode spacings, and it is found that as the electrode spacing increases, the potential between the two electrode plates increases. However, due to the change in electrode spacing, the electric field between the two electrode plates changes. As the electrode spacing in the system decreases, the electric field strength between the two electrode plates increases. Under the same pressure conditions, the smaller the distance between the electrode plates, the more difficult it is for electrons to enter between them.
Figure 5d reveals that the distribution of excited argon ions changes significantly by changing the electrode spacing. When the electrode spacing are 10 mm and 20 mm, glow crosslinking occurs between the two electrode plates. The most significant feature is that a range with a high number density appears in the upper center of the cathode electrode plate. The range does not exist at the lower and higher electrode spacings. The density enhancement is caused by the discharge of the hollow electrode at the discharge center and by the electrostatic edge effect near the radial edge of the plate. The increase of electrode spacing enhances the radial diffusion of plasma, and the radial distribution of plasma density is more significantly affected by the diffusion effect.
The electric field and the interaction between particles are the two main factors affecting the distribution and energy state of the particles in the system [29,30]. The research results indicate that under the same potential conditions, the electric field strength will increase as the electrode spacing decreases, thereby affecting the motion of particles.
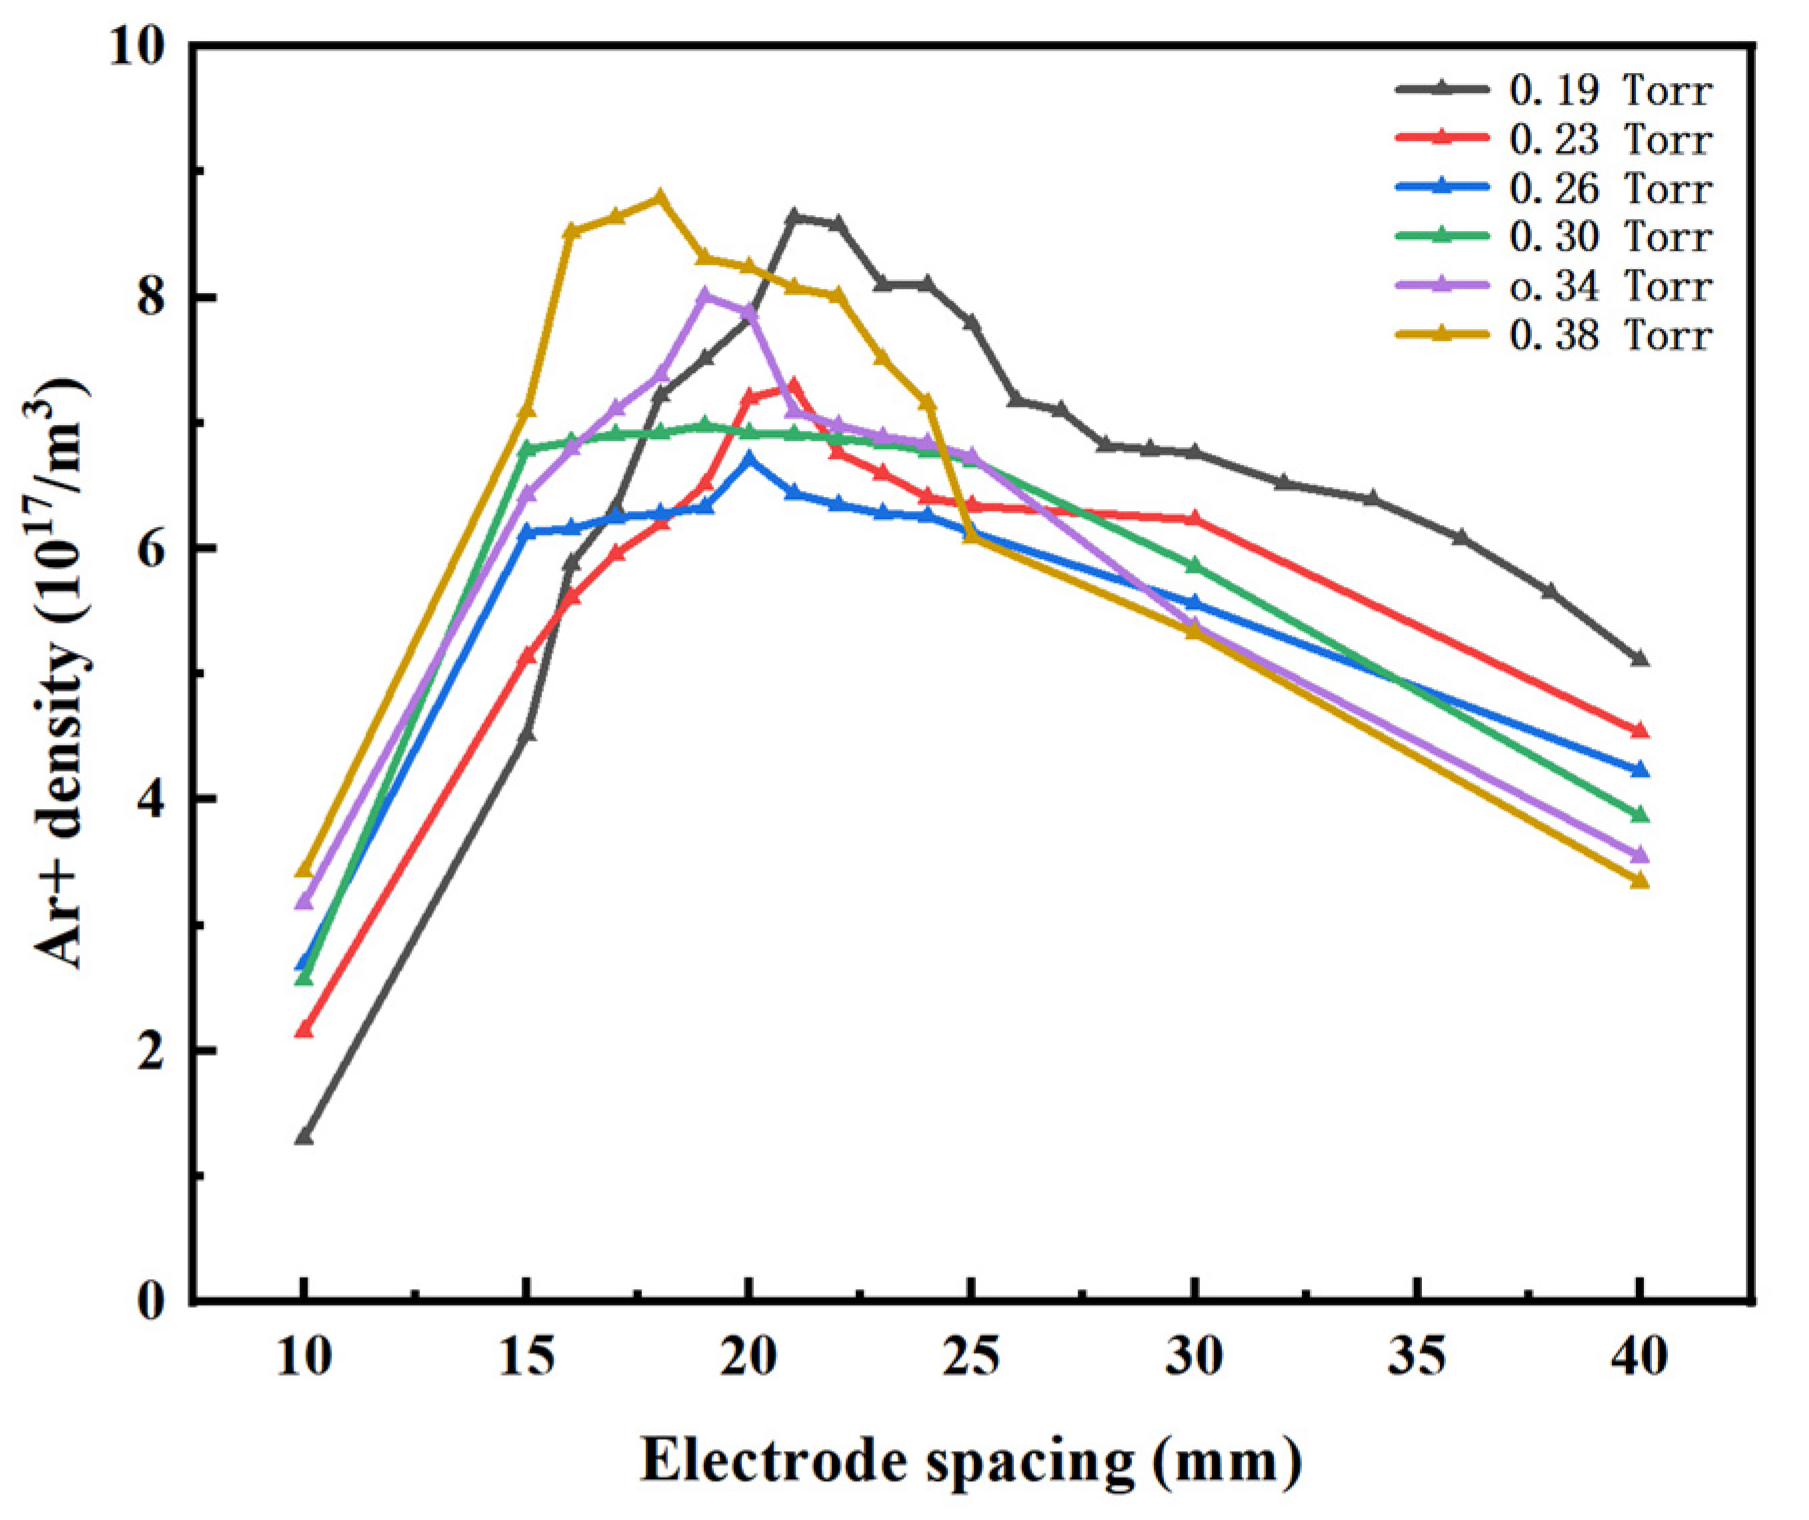
Figure 6 highlights that under different working pressure conditions, as the electrode spacing increases, the number density of excited argon ions first increases and then slowly decreases when reaching a certain peak. At a specific electrode spacing, there is a fast rise in the density of argon ions that are excited, resulting in a noticeable increase in the brightness of the glow and a rapid surge in the current flowing through the electrodes at a large scale [31]. The observed phenomena suggest that a hollow cathode discharge has taken place in the system at present. The glow discharge process takes place between two electrode plates, which influences the size of the electric field in the discharge region. An excessive or insufficient distance might result in an unstable plasma discharge, which directly impacts the kinetic energy of the plasma in the discharge region [32]. Furthermore, as illustrated in Figure 6, the ideal distance between electrodes decreases as the working pressure increases. Hence, it is crucial to take into account the impact of operating pressure while calculating the most favorable distance between electrodes.
There is an optimal distance between the two electrodes. When the distance between the two electrodes is 10 mm, the density of argon ions is very low. At this distance, the discharge area is compressed, and the sputtered elements are only ionized in a very small area. On the contrary, when the distance between the two electrodes reaches 40 mm, maintaining stable discharge becomes difficult. Meanwhile, due to the increase in the molecular free path, inelastic collisions consume most of the energy, leading to a weakening of ionization. Therefore, for the double-glow discharge process, maintaining a distance between the two electrodes of 15 mm and 30 mm can help improve the ionization rate and enhance the quality of the coating.

3.3. Effect of Voltage on Plasma Parameters

3.3.1. Impact of Cathode/Source Voltage

When the working pressure is 0.23 Torr, the electrode spacing is 40 mm and the cathode voltage is 400 V, Figure 7 expresses the distribution of different plasma physical fields when the different source voltages are 200 V, 400 V, 600 V and 800 V, respectively. During the process of unequal potential discharge between dual electrodes, the side of the electrode plate with higher absolute voltage values experiences a higher electron density, as shown in Figure 7a–d. When the cathode voltage in Figure 7a is 400 V and the source voltage is 200 V, the magnitude of the cathode voltage exceeds that of the source voltage, resulting in the formation of a region with a high electron density on one side of the cathode electrode plate. Conversely, the area with a greater concentration of electrons in Figure 7c,d is located on the side of the source electrode plate. Figure 7b illustrates the equi-potential discharge procedure involving two electrodes. During the process, the electron density is evenly distributed, and the distributions on both the source electrode and the cathode electrode plate side are same. The electron density peak exhibits a positive correlation with the absolute difference between the source voltage and the cathode voltage. The voltage disparity between the two poles escalates, resulting in an augmentation of the peak electron density. When the experimental circumstances are identical, the peak electron density is lower during equal-potential discharge compared to unequal-potential discharge.
Figure 7e–p displays that the distributions of the electron temperature, electric potential and number density of excited argon ions are similar to the distribution of electron density. It is worth noting that the potential distribution in Figure 7g takes the maximum potential in the center between the electrode plates. With the increase of voltage, electrons obtain higher energy from the electric field, which makes the ionization collision reaction in all parts of the chamber enhanced to different degrees, so the electron density is significantly increased. As the voltage difference increases, the sheath electric field increases, and high-energy electrons participate in more excitation and ionization, improving the ionization efficiency and generating high-density plasma.
As shown in Figure 7a,e,i,m and Figure 7c,g,k,o, the absolute value of the voltage difference is 200 V. It is found that the distribution of the electron field in the source plate and the cathode plate is opposite, and the values are basically equal. It indicates that the voltage difference is the main factor affecting the distribution compared with the cathode voltage and source voltage.

3.3.2. Impact of Negative/Source Voltage Difference

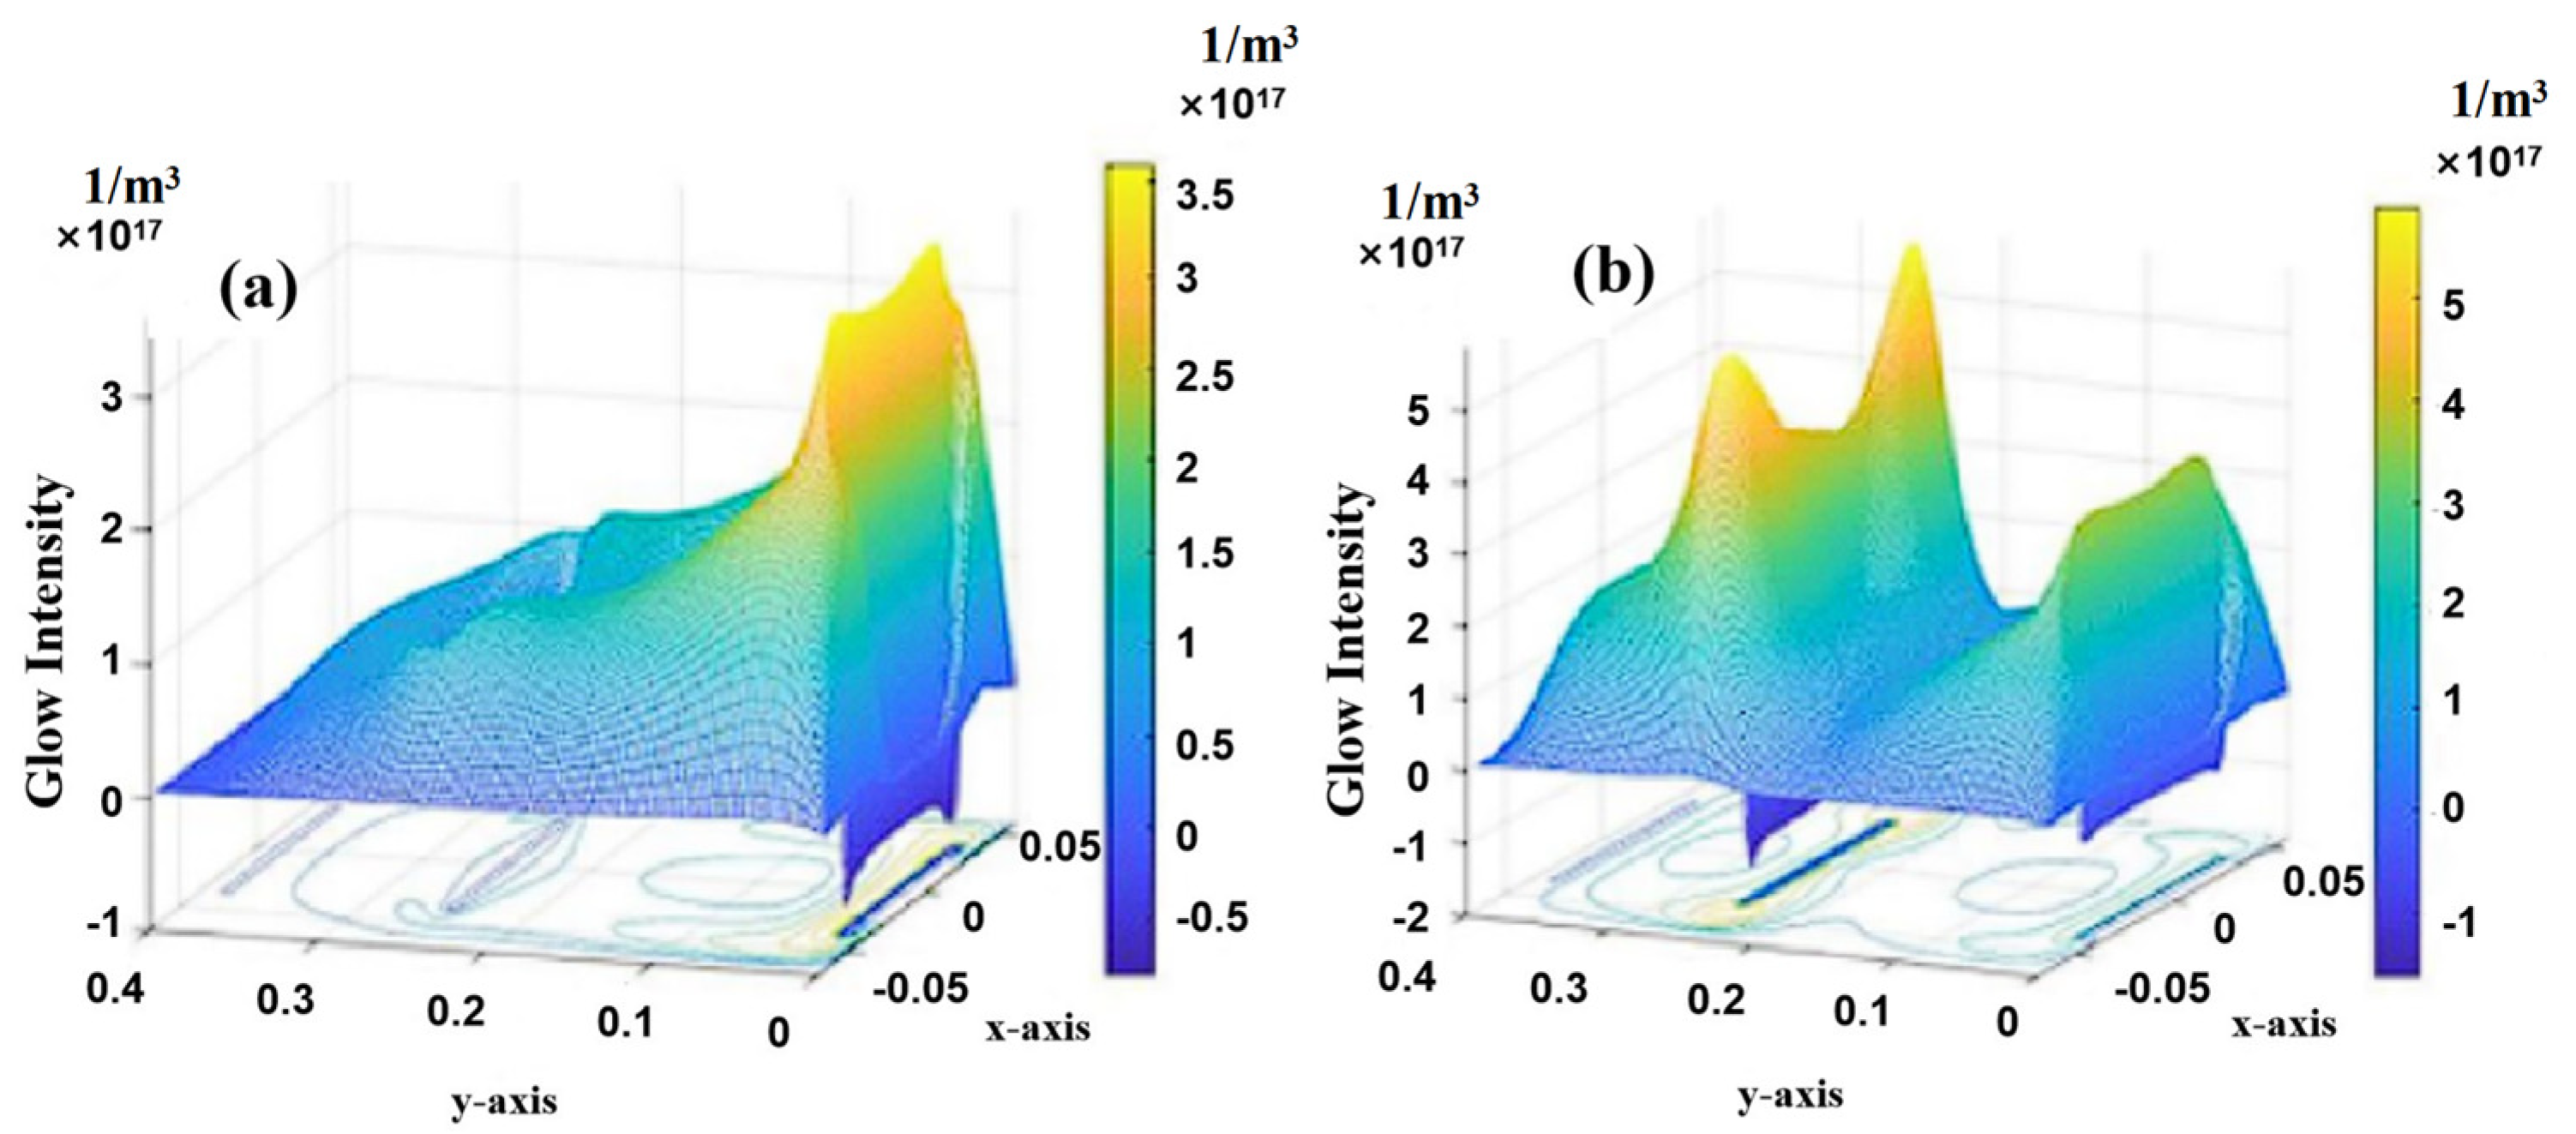
The supply capacity of the alloying elements is reflected in the glow intensity. Compared with other plasma metallurgy, the double glow has a unique glow crosslinking phenomenon. The higher the degree of crosslinking between the cathode and source glow, the stronger the glow. It shows that the more intense the ion sputtering occurs on the electrode plate surface, the higher the alloying element supply. The cathode voltage and source voltage have a nearly identical impact on the system, exerting the same influence. As the source voltage increases, the concentration of particles on the source electrode and the energy of particle impacts also increase. As the quantity of alloyed elements increases, the thickness of the coating also increases. The primary purpose of the cathode voltage is to thermally energize the workpiece, facilitating the activation of its surface and subsequently enhancing the diffusion capability of sprayed particles on the workpiece’s surface. Additionally, it enhances the assimilation of particles expelled by the cathode onto the workpiece; thus, the higher the voltage applied to the cathode, the larger the thickness of the resulting coating. Theoretically, augmenting both the source voltage and the cathode voltage should provide identical outcomes, and it appears that elevating the voltage consistently leads to favorable advantages. However, this contradicts the real-life manufacturing experience. The alteration in voltage must be examined in terms of the correlation between the voltage at the cathode and the voltage at the source.
Under the normal conditions, the phenomenon is generated independently by the two electrodes, and the two negative glow bands are unrelated to each other, cannot cross-connect and the current on each electrode cannot change significantly, which is the so-called “double glow”. However, as the source voltage continues to increase, the negative glow area of the cathode will slowly spread toward the source. Once the two negative glow areas are connected together, a whole can be formed, and the intensity of the glow will be greatly increased. It can be considered that a hollow cathode effect is produced, as shown in Figure 8. When the cathode and the source electrode are energized, there is a voltage difference between the cathode and the source electrode. There is an electric field between the cathode and the source that causes the dots to migrate. As a whole, the negative glow range of the two stages is cross-linked, and the movement amplitude of the negative glow region increases with the increase in the voltage difference.
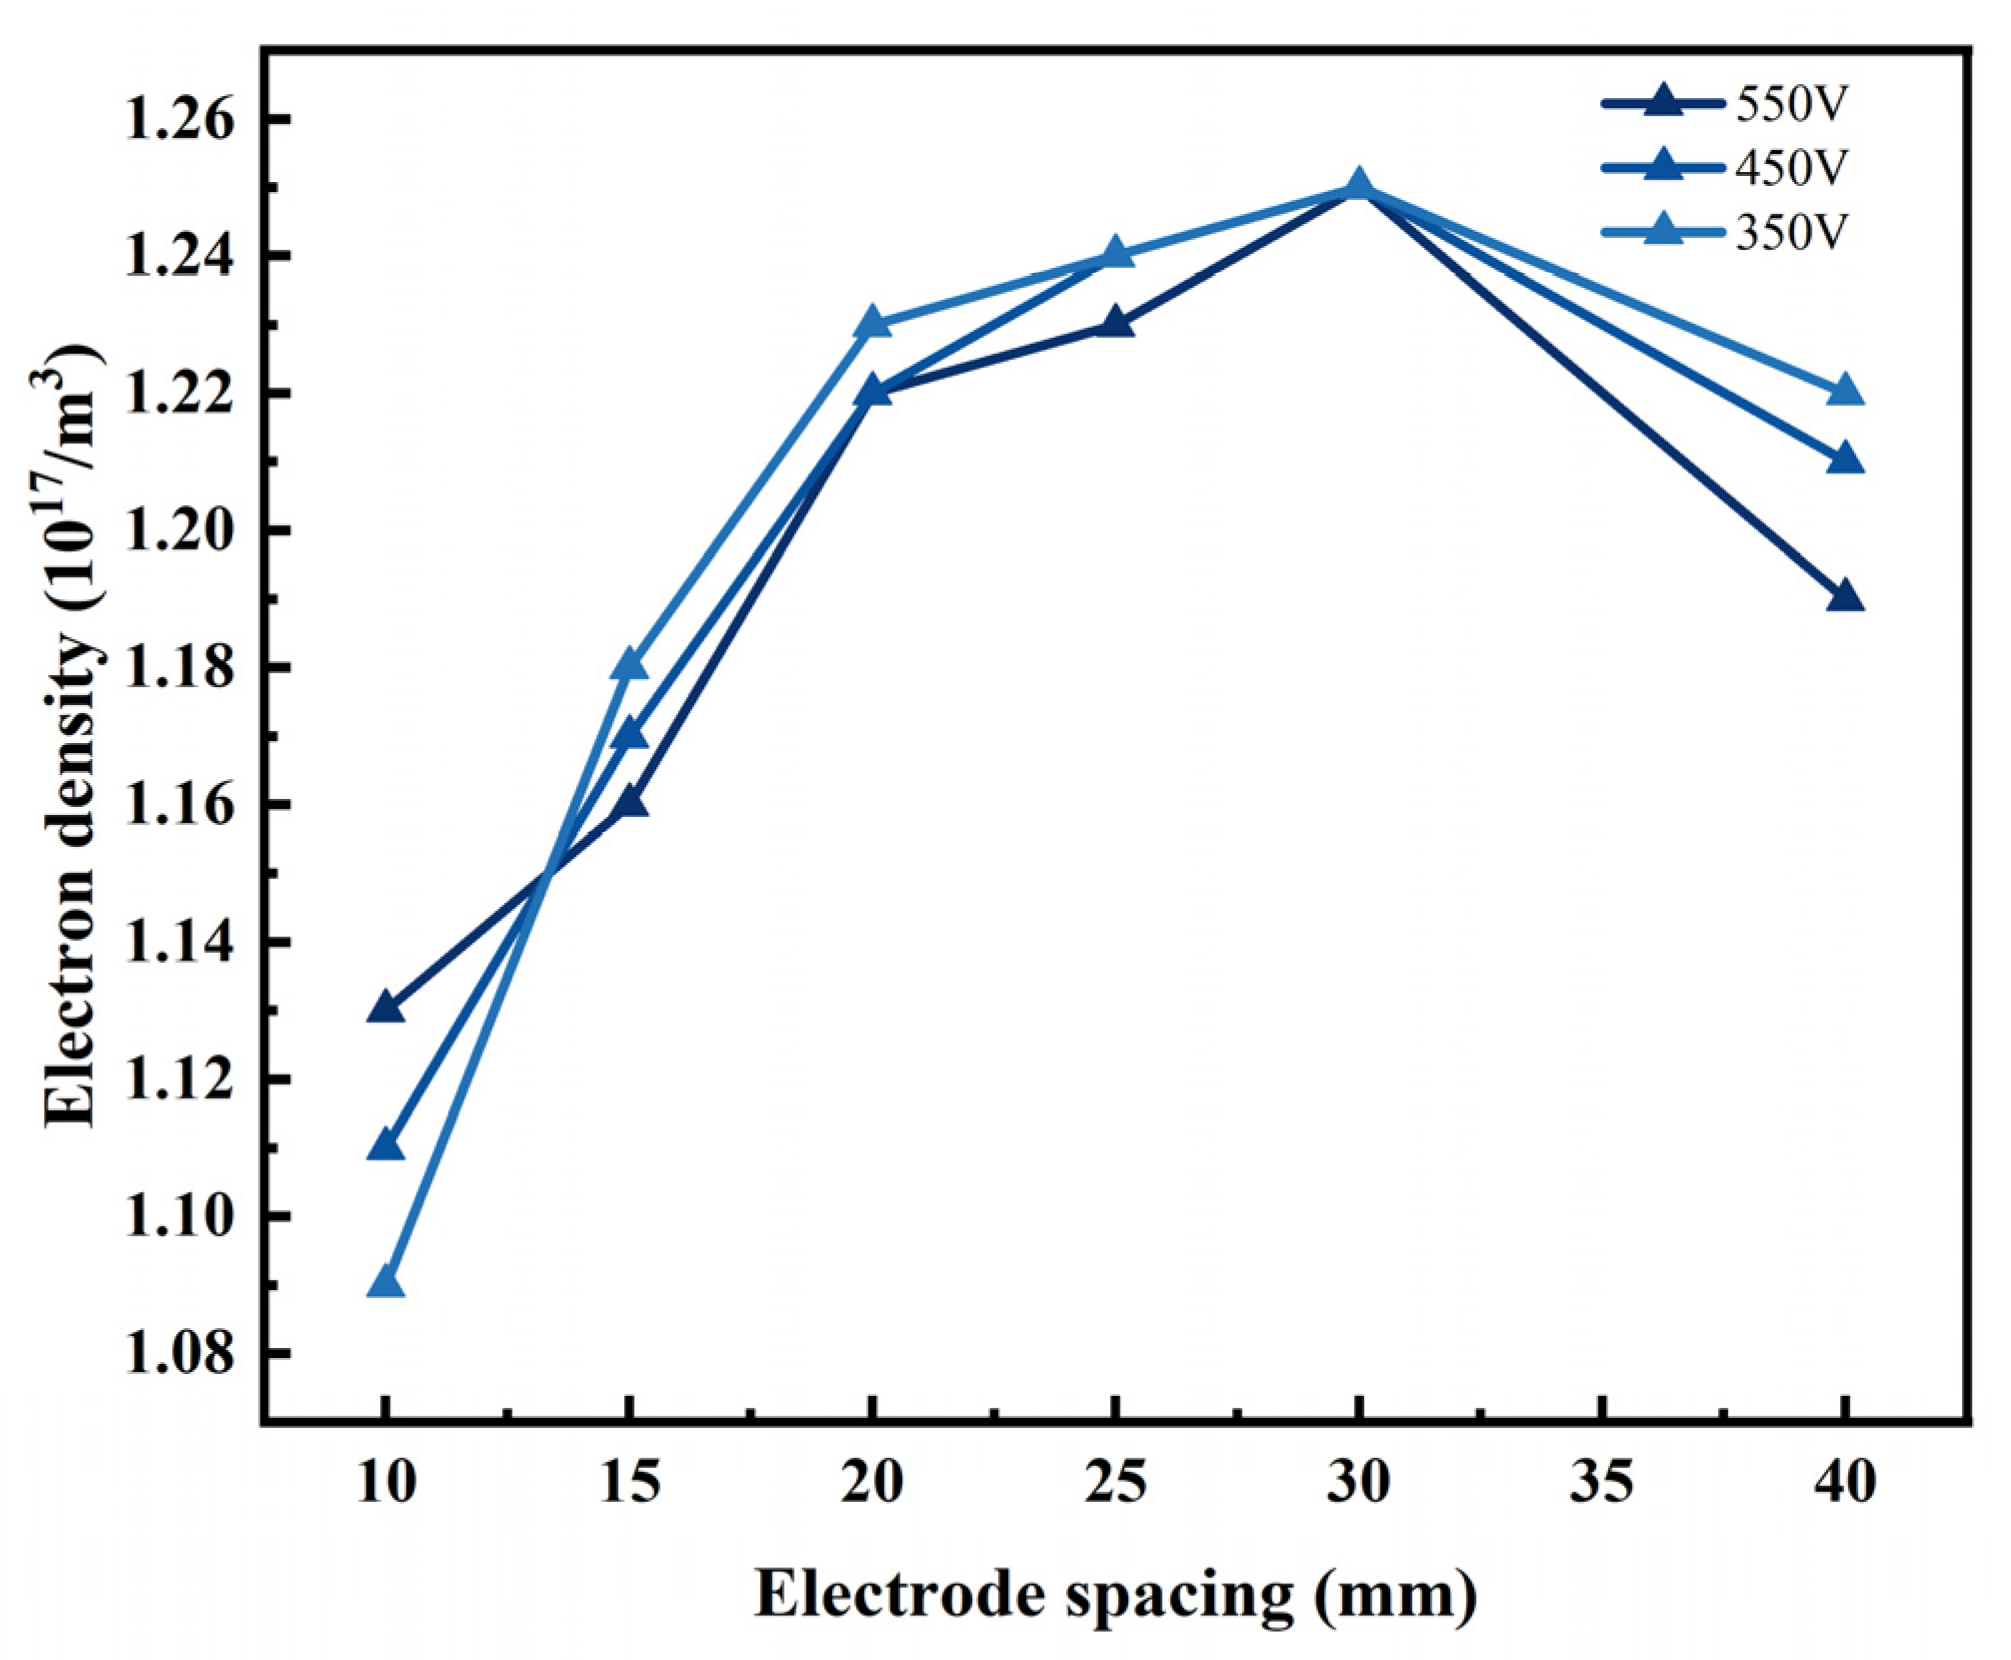
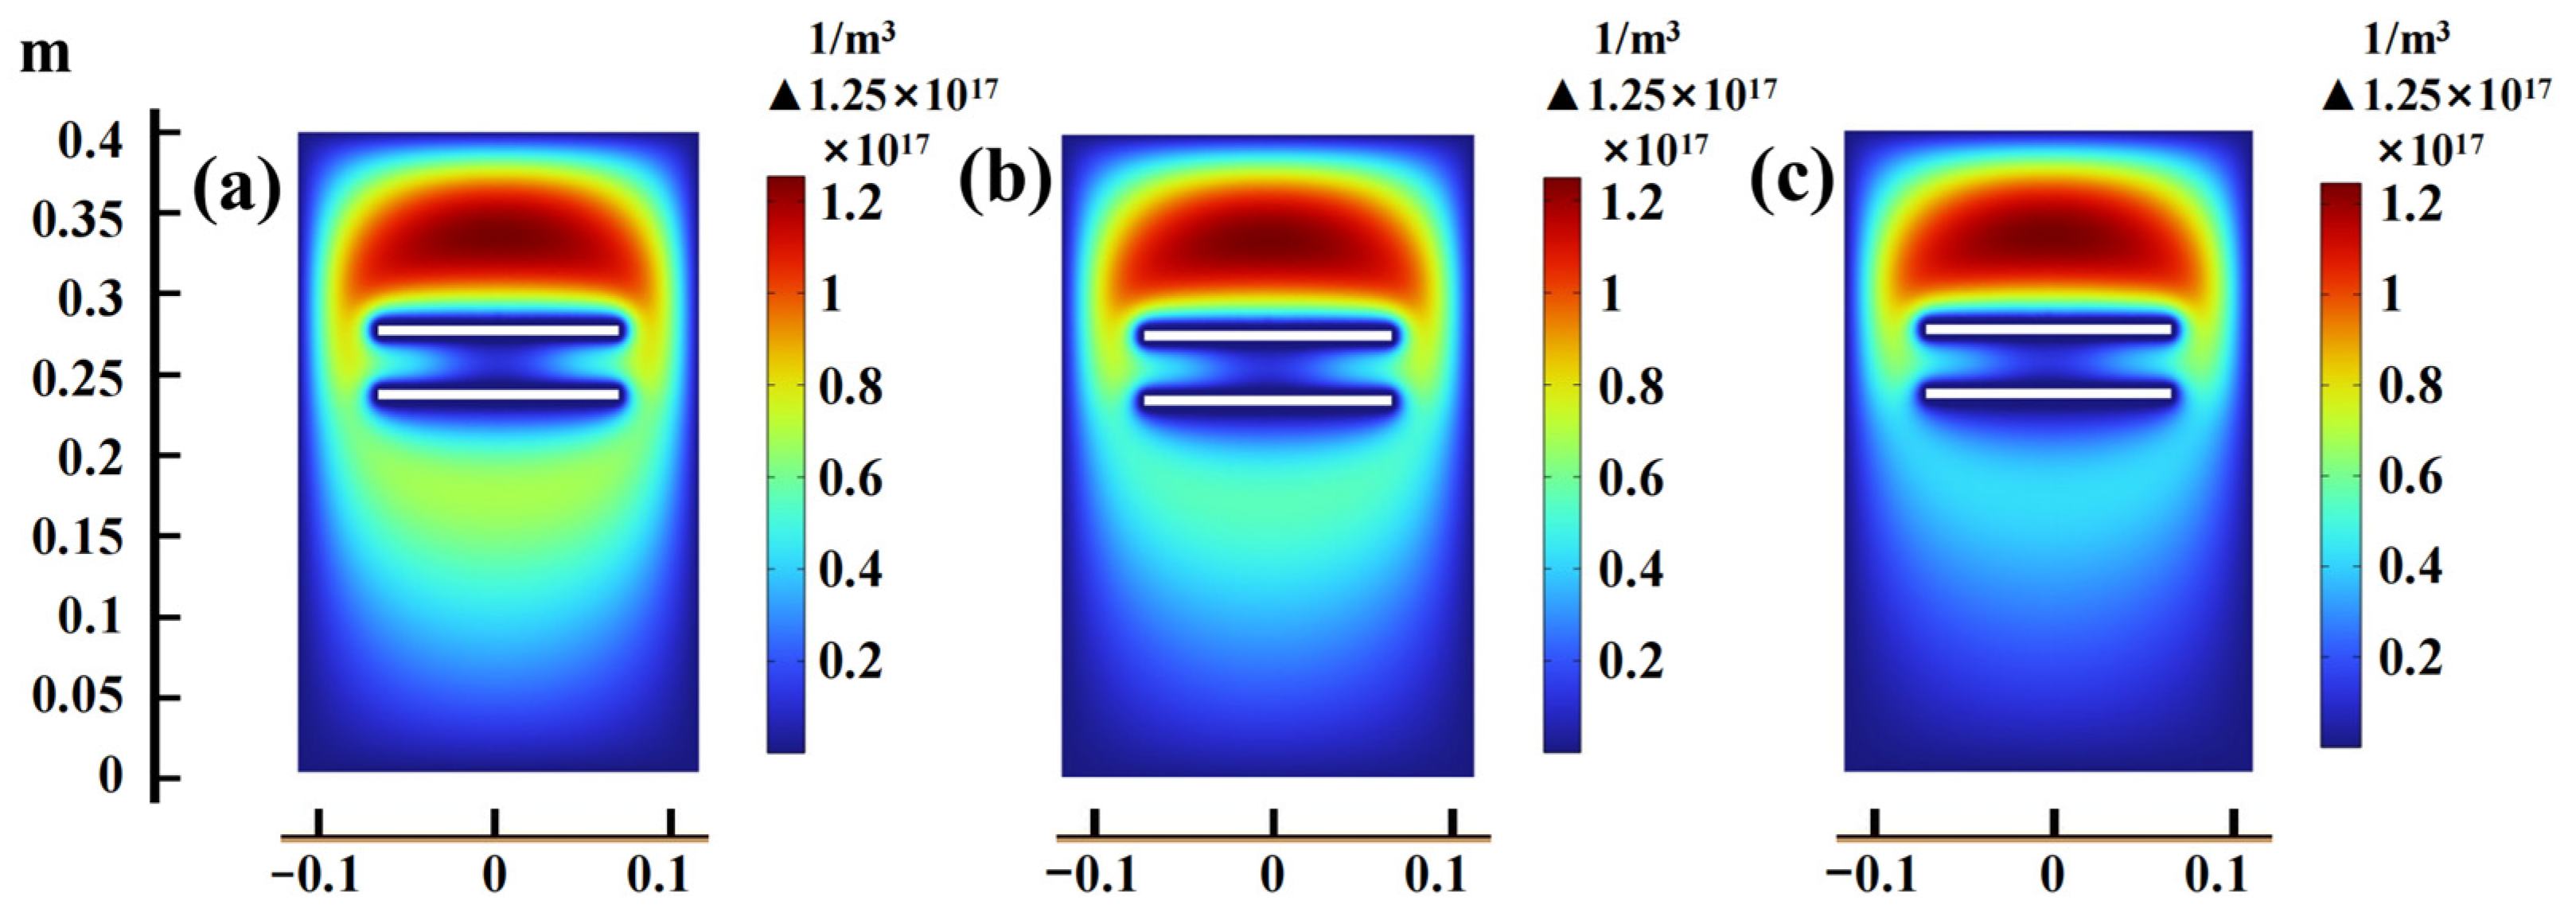
In order to reach a general conclusion, the following studies are conducted to control the voltage difference by changing the cathode voltage under the condition of a certain source voltage. The relationship between the electron density and electrode spacing under the different voltage differences is obtained, as shown in Figure 9. It is found that the electron density increases first and then decreases with the increase in electrode spacing. After the electrode spacing is 30 mm, the decrease rate of electron density is opposite to the original increase rate. The larger the distance between the two electrodes, the smaller the overlap area of the negative glow region necessary to form a hollow cathode, and the weaker the binding ability of the radial electric field on the plasma. Therefore, between 15 mm and 30 mm, the electron density is higher and the voltage difference required for glow discharge is lower. It is worth noting that, as Figure 10 illustrates, at the electrode spacing of 30 mm, the electron density values remain constant under various voltage differentials, but the distribution is different.
The results reveal that, compared with the source and cathode voltages, the real factor affecting the whole system is the voltage difference between the two electrode plates. There is a voltage difference between the two plates, so there is an electric field between the two electrode plates, and the direction of the electric field is determined by the positive or negative voltage difference. Because of the existence of such an electric field, the phenomenon can occur.

4. Comparison between the Theoretical and Experimental

Based on the effects of the working pressure, electrode spacing, cathode voltage and source voltage on the glow discharge process, the optimal process parameters will be designed for the preparation of Fe-Al alloy layers in specific experimental environments [33], providing practical theoretical guidance for practical production activities.
The whole alloying process is simulated, and the optimization of the working pressure and electrode spacing is solved by using the simulated data, as shown in Figure 11. Low electrode spacing or low working pressure are two necessary conditions for the hollow cathode effect [34].
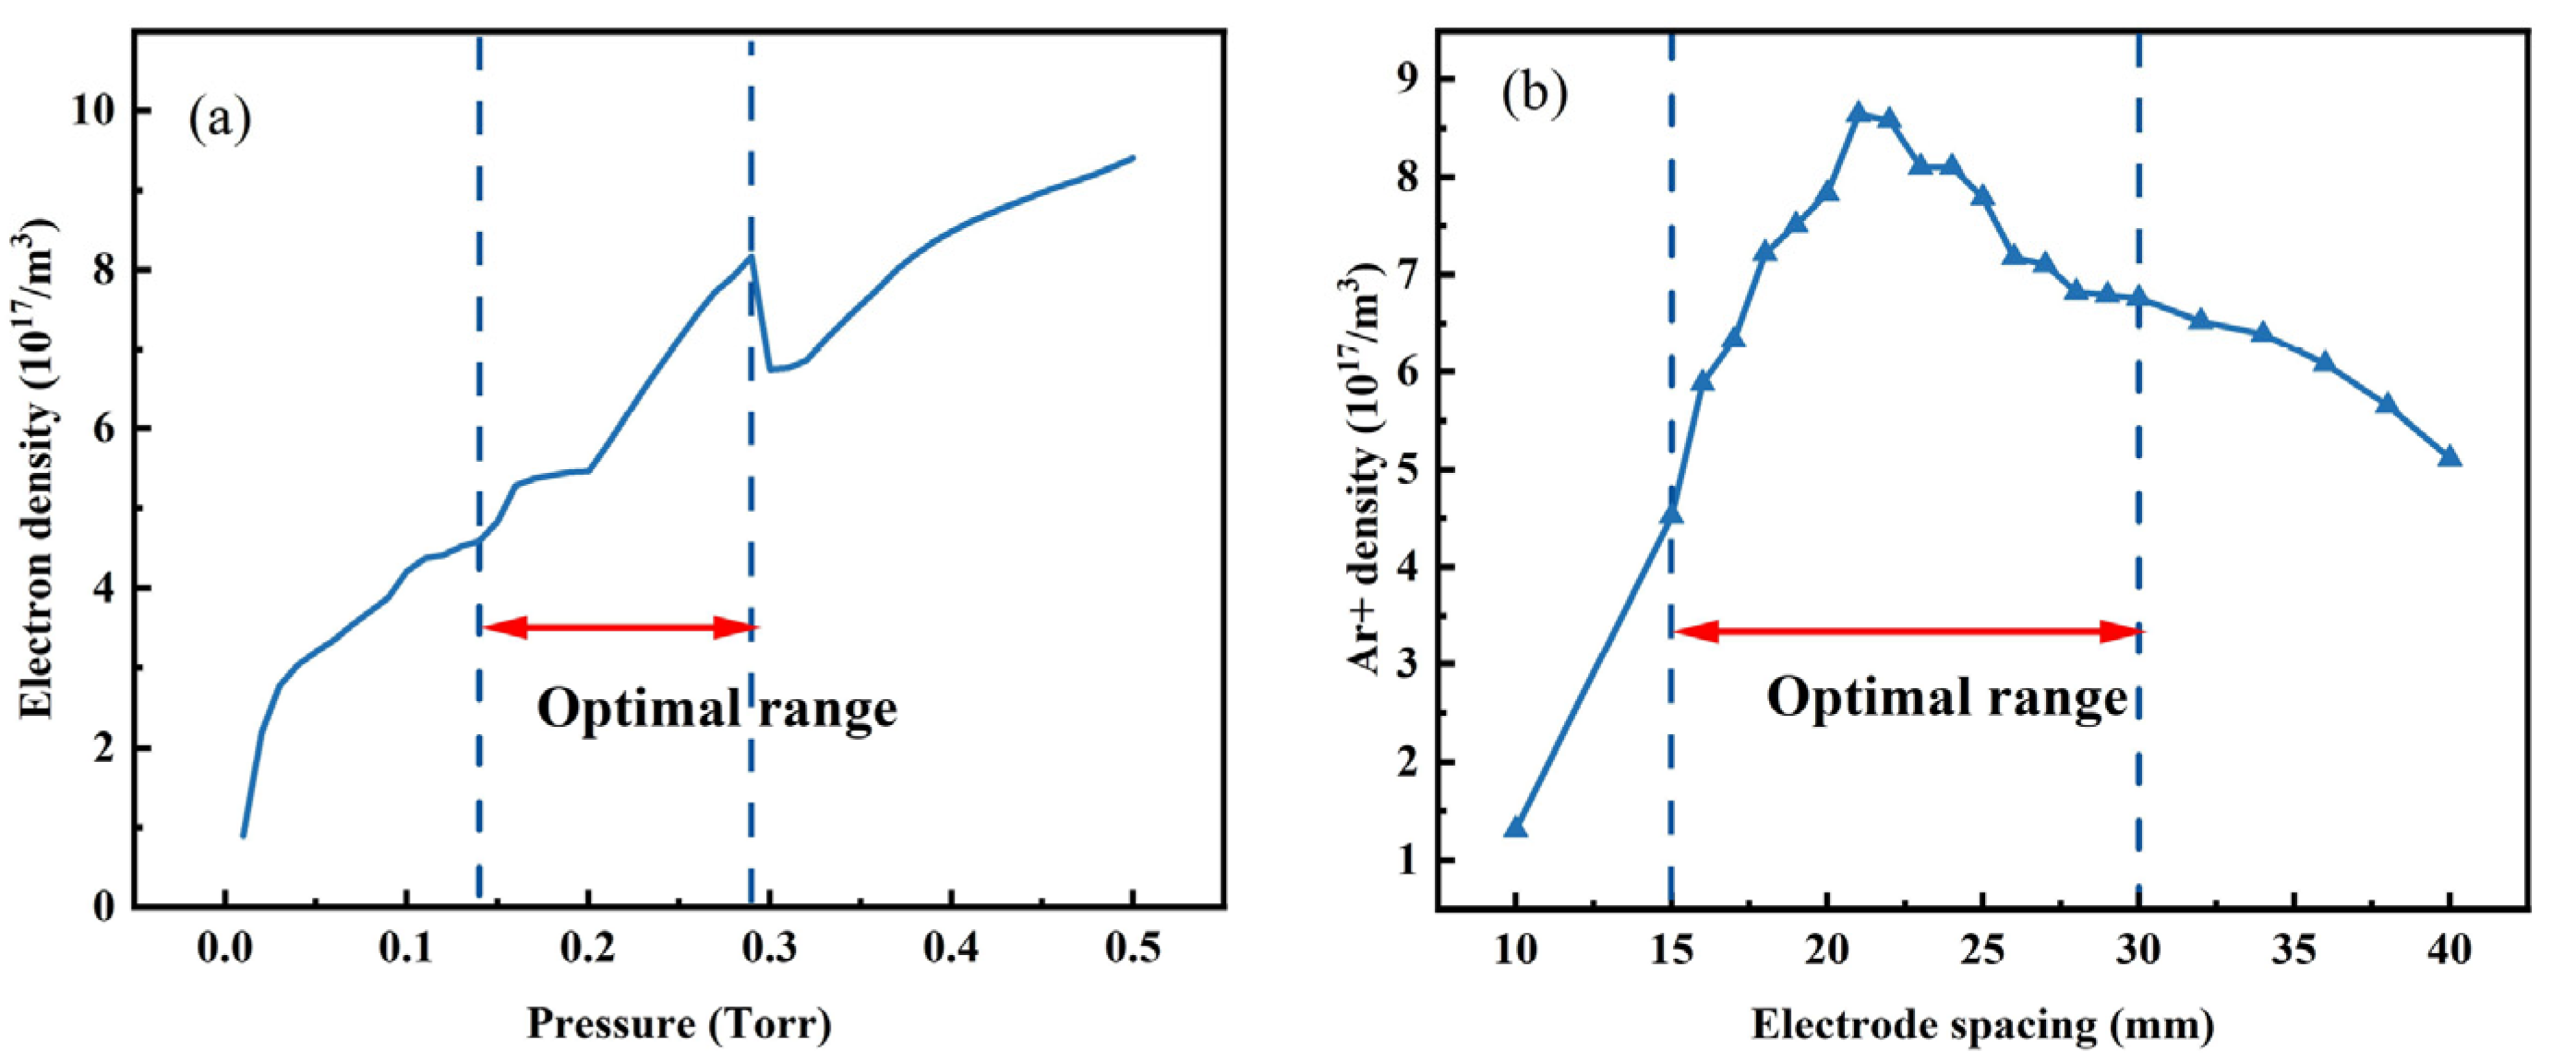
There is a positive correlation between the electron density and the glow intensity of the system. Additionally, the thickness of the alloying increases as the glow intensity increases. Figure 11a displays a curve illustrating the correlation between working pressure and electron density. This analysis aims to determine the ideal working pressure. An interval of rapid density expansion is observed in the lower and middle pressure ranges, suggesting that this interval can reach the optimal functioning condition. The ideal operating pressure ranges from 0.14 Torr to 0.29 Torr.
When the electrode spacing is too large, the hollow cathode effect weakens or even disappears, resulting in a decrease in the surface current of the target material. The glow intensity of the system will also be significantly reduced, and the sputtering rate of the target elements can be reduced. The electrode spacing of the plate should not be too small; it causes the hollow cathode effect to be very intense. Subsequently, the discharge process as a whole exhibits instability, resulting in an inconsistent amount of sputtered target elements, ultimately leading to non-uniform coating. Figure 11b illustrates the correlation between the distance between the electrodes and the number density of argon ions. The breakdown voltage in glow discharge depends on the product of the working pressure and the distance between the anode and cathode. It can be inferred that the distance between the anode and cathode is either too far or too close, resulting in increased difficulty in achieving glow discharge. The ideal distance between electrodes should range from 15 mm to 30 mm.
Figure 12 shows the comparison between the actual experimental data [35] and the simulation results. The actual experimental data are included in the simulation results, proving the feasibility of the simulation results. In summary, the optimum process parameters for the alloy coating are as follows: the working pressure is between 0.14 Torr and 0.29 Torr, and the electrode spacing is between 15 mm and 30 mm.

5. Conclusions

In this present study, the plasma physical characteristics were investigated based on the 2D fluid model simulation in Ar plasma during the glow discharge surface modification. The relationship between the process parameters and discharge characteristics of the physical field was studied. Finally, it is found that the optimal working pressure and electrode spacing intervals were in better accordance with the experimental results. The main conclusions are as follows:
(1)
Based on the double-glow plasma discharge model, we studied the plasma field’s physical characteristics, including the working pressure, electrode spacing and voltage difference. The result showed that as the working pressure increases, the electron density, temperature, potential and excited argon ion number density near the source electrode plate gradually increase, while it is less effective near the cathode electrode plate. As the electrode spacing increases, the above electron-field parameters significantly decrease at the beginning stage and then increase. However, due to the occurrence and disappearance of the glow crosslinking between the two electrode plates, the change in the number density of excited argon ions shows an opposite trend. The variation in voltage between the cathode and source electrodes significantly influences the electron field distribution across the electrode plates.
(2)
The relationship between the process parameters and physical field discharge characteristics has also been studied. The results revealed that the optimal working pressure range is between 0.14 Torr and 0.29 Torr. The electron temperature during the working pressure range has a maximum value, which can improve the diffusion efficiency of the sputtering elements. The optimal electrode-spacing range is between 15 mm and 30 mm. In this interval, the optimal value has a decreasing tendency with the increase in working pressure, which affects the distribution of the number density of excited argon ions, which can be beneficial for forming a uniform coating.
(3)
The results of the theory and experiment verify the consistency of the double-glow plasma discharge simulation. It has been confirmed that the model can guide the acquisition of optimized process parameters for the double-glow discharge and improve the predictability of dual glow surface metallurgy technology.

Author Contributions

Conceptualization, L.Y. and H.Z.; methodology, L.Y. and J.Z.; software, L.Y., D.Y., Y.Q. and Y.W.; validation, H.D. and H.Z.; formal analysis, L.Y. and Y.Q.; investigation, D.Y. and Y.W.; resources, H.Z. and Z.H.; data curation, L.Y. and J.Z.; writing—original draft preparation, L.Y. and H.Z.; writing—review and editing, A.M.K. and H.W.; visualization, H.D. and G.L. All authors have read and agreed to the published version of the manuscript.

Funding

This project is supported by the company Shougang Zhixin Electromagnetic Material R&D (Beijing) Co., Ltd. and commissioned by enterprises and institutions (NO.2023h454).

Institutional Review Board Statement

Not applicable.

Informed Consent Statement

Not applicable.

Data Availability Statement

Data are contained within the article.

Acknowledgments

Thanks to Nanjing University of Aeronautics and Astronautics for their support of COMSOL-related software and knowledge. During the preparation of this work, the authors used ChatGPT3.5 in order to improve orthography and enhance the overall effectiveness of their writing. After using this tool/service, the authors reviewed and edited the content as needed and take full responsibility for the content of the publication.

Conflicts of Interest

Author Hu, Z. was employed by the company Shougang Zhixin Electromagnetic Material R&D (Beijing) Co., Ltd.; Author Liu, G. was employed by the company Shougang Zhixin Electromagnetic Material R&D (Beijing) Co., Ltd. The remaining authors declare that the research was conducted in the absence of any commercial or financial relationships that could be construed as a potential conflict of interest.

References

  1. Aung, L.M.; Renn, T.; Lin, J.C.; Salamanca, E.; Wu, Y.; Pan, Y.; Teng, N.; Huang, H.; Sun, Y.; Chang, W. Improving osteogenic properties of zirconia ceramic via glow discharge plasma-enhanced deposition of amine organic compound. J. Dent. Sci. 2024, in press. [Google Scholar] [CrossRef]
  2. Yang, Z.; Yu, T.; Hu, S.; Feng, Y.; Zhao, Y.; Chen, Y. Structural evolution, wear and corrosion failure mechanisms of CrN coating synthesized by applying gradient voltage and arc-enhanced glow discharge. Mater. Today Commun. 2024, 40, 109361. [Google Scholar] [CrossRef]
  3. Guo, R.; Yu, T.; Zhou, X.; Wang, G.; Chen, M. Chip geometry modeling in micro-milling of glow discharge polymer by a single-edge diamond tool considering tool inclination. J. Mater. Process Technol. 2023, 320, 118109. [Google Scholar] [CrossRef]
  4. Li, J.; Lei, B.; Wang, J.; Xu, B.; Ran, S.; Wang, Y.; Zhang, T.; Tang, J.; Zhao, W.; Duan, Y. Atmospheric diffuse plasma jet formation from positive-pseudo-streamer and negative pulseless glow discharges. Commun. Phys. 2021, 4, 64. [Google Scholar] [CrossRef]
  5. Yu, H.; Liang, W.; Miao, Q.; Yin, M.; Xue, L.; Yi, J.; Qi, Y. Improvement of plasma carbonitriding modified layer on TA15 surface by RASP-assisted DGPSA treatment. Vacuum 2022, 206, 111499. [Google Scholar] [CrossRef]
  6. Dong, C.; Huang, J.; Cui, A.; Luo, J.; Zhou, Z.; Cheng, H.; Wen, Z.; Xu, J. Microstructure and high-temperature oxidation behavior of Al2O3/Cr composite coating on Inconel 718 alloy. J. Mater. Res. Technol. 2024, 28, 4498–4507. [Google Scholar] [CrossRef]
  7. La, L.; Wang, L.; Liang, F.; Zhang, J.; Liang, G.; Wang, Z.; Lin, Q. High-temperature oxidation and tribological behaviors of WTaVCr alloy coating prepared by double glow plasma surface alloying technology. Surf. Coat. Technol. 2023, 464, 129429. [Google Scholar] [CrossRef]
  8. Lei, X.; Lin, N.; Yuan, S.; Lei, C.; Nouri, M.; Liu, Z.; Yu, Y.; Zeng, Q.; Ma, G.; Li, D.; et al. Combining laser surface texturing and double glow plasma surface chromizing to improve tribological performance of Ti6Al4V alloy. Surf. Coat. Technol. 2024, 478, 130418. [Google Scholar] [CrossRef]
  9. He, S.; Wang, P.; Ha, J.; Zhang, B.; Zhang, Z.; Li, Q. Effects of Discharge Parameters on the Micro-hollow Cathode Sustained Glow Discharge. Spectrosc. Spect. Anal. 2019, 39, 3377–3382. [Google Scholar] [CrossRef]
  10. Olejníček, J.; Šmíd, J.; Perekrestov, R.; Kšírová, P.; Rathouský, J.; Kohout, M.; Dvořáková, M.; Kment, Š.; Jurek, K.; Čada, M.; et al. Co3O4 thin films prepared by hollow cathode discharge. Surf. Coat. Technol. 2019, 366, 303–310. [Google Scholar] [CrossRef]
  11. Hsieh, J.H.; Huang, Y.; Huang, P.; Li, Y. Investigation of anode diameter and keeper geometry influence on open-end emitter heaterless hollow cathode discharge. Vacuum 2024, 113504. [Google Scholar] [CrossRef]
  12. Sorokin, I.A.; Kolodko, D.V. Planar hollow cathode sputtering with asymmetrical voltage supply. Vacuum 2023, 207, 111570. [Google Scholar] [CrossRef]
  13. Korolev, Y.D.; Koval, N.N. Low-pressure discharges with hollow cathode and hollow anode and their applications. J. Phys. D Appl. Phys. 2018, 51, 323001. [Google Scholar] [CrossRef]
  14. Bayki, S.; Mujumdar, S. A 1D model for prediction of dry electrical discharge machining (dry-EDM) plasma characteristics. J. Manuf. Process. 2023, 102, 417–428. [Google Scholar] [CrossRef]
  15. Yu, Y.; Kang, Z. Oscillation suppression for pulsed arc electrohydraulic discharges based on plasma impedance model. J. Electrostat. 2024, 129, 103923. [Google Scholar] [CrossRef]
  16. Yücel, H.H.; Utaş, S.; Ongun, E. The Study of DC-and AC-Driven GaAs-Coupled Gas Discharge Micro Plasma Systems: Modeling and Simulation. J. Electron. Mater. 2024, 53, 3792–3808. [Google Scholar] [CrossRef]
  17. Qiu, Y.; Yu, L.; Zhou, J.; Zhu, H.; Yang, D.; Yu, L.; Chen, R.; Zhang, C.; Ni, R.; Li, Q.; et al. Study of plasma characteristics of hollow cathode in glow discharge. J. Phys. D Appl. Phys. 2023, 56, 485201. [Google Scholar] [CrossRef]
  18. Liang, Y.; Yuan, C.; Gao, R.; Jia, J.; Kirsanov, G.; Bekasov, V.; Marin, A.; Kudryavtsev, A.; Eliseev, S.; Zhou, Z. Investigation of low-pressure glow discharge in a coaxial gridded hollow cathode. IEEE Trans. Plasma Sci. 2016, 44, 2965–2972. [Google Scholar] [CrossRef]
  19. Jiang, X.X.; He, F.; Chen, Q.; Ge, T.; Ouyang, J.T. Numerical simulation of the sustaining discharge in radio frequency hollow cathode discharge in argon. Phys. Plasmas 2014, 21, 033508. [Google Scholar] [CrossRef]
  20. Hagelaar, G.J.M.; Pitchford, L.C. Solving the Boltzmann equation to obtain electron transport coefficients and rate coefficients for fluid models. Plasma Sources Sci. Trans. 2005, 14, 722. [Google Scholar] [CrossRef]
  21. COMSOL. Available online: https://cn.comsol.com/model/dc-glow-discharge-8640 (accessed on 1 September 2024).
  22. Hojo, H.; Mase, A. Electromagnetic-wave transmittance characteristics in one-dimensional plasma photonic crystals. J. Plasma Fusion Res. Ser. 2009, 8, 477–479. [Google Scholar]
  23. Rafatov, I.; Bogdanov, E.A.; Kudryavtsev, A.A. On the accuracy and reliability of different fluid models of the direct current glow discharge. Phys. Plasmas 2012, 19, 033502. [Google Scholar] [CrossRef]
  24. Eliseev, S.I.; Kudryavtsev, A.A.; Liu, H.; Ning, Z.; Yu, D.; Chirtsov, A.S. Transition from glow microdischarge to arc discharge with thermionic cathode in argon at atmospheric pressure. IEEE Trans. Plasma Sci. 2016, 44, 2536–2544. [Google Scholar] [CrossRef]
  25. Arshadi, A.; Brinkmann, R.P. Analytical investigation of microwave resonances of a curling probe for low and high-pressure plasma diagnostics. Plasma Sources Sci Trans. 2016, 26, 015011. [Google Scholar] [CrossRef]
  26. Bormashenko, E.; Whyman, G.; Multanen, V.; Shulzinger, E.; Chaniel, G. Physical mechanisms of interaction of cold plasma with polymer surfaces. J. Colloid Interface Sci. 2015, 448, 175–179. [Google Scholar] [CrossRef]
  27. Zhang, Y.; Qu, Y.; Zhao, K.; He, S.; Zhao, X.; Li, Q. Discharge Characteristics in Hollow Cathode Filled with Helium/Argon Mixture: A Simulation Study. Chin. J. Vac. Sci. Technol. 2019, 39, 8. [Google Scholar]
  28. Ferreira, C.M.; Loureiro, J.; Ricard, A. Modelling of Stepwise Ionisation Effects in a Low-Pressure Argon Positive Column. In Phenomena in Ionized Gases, Proceedings of the XVI International Conference, Düsseldorf, Germany, 29 August–2 September 1983; Bötticher, W., Wenk, H., Schultz-Gulde, E., Eds.; Organizing Committee ICPIG-XVI: Düsseldorf, Germany, 1983; Volume 1, p. 598. [Google Scholar]
  29. Che, X.; Shao, T.; Nie, W.; Yan, P. Numerical simulation on a nanosecond-pulse surface dielectric barrier discharge actuator in near space. J. Phys. D Appl. Phys. 2012, 45, 145201. [Google Scholar] [CrossRef]
  30. Nakao, Y.; Tsukida, K.; Voronchev, V.T. Realistic neutron energy spectrum and a possible enhancement of reaction rates in the early Universe plasma. Phys. Rev. D 2011, 84, 063016. [Google Scholar] [CrossRef]
  31. Hopwood, J. Review of inductively coupled plasmas for plasma processing. Plasma Sources Sci. Trans. 1992, 1, 109. [Google Scholar] [CrossRef]
  32. Alakoski, E.; Tiainen, V.M. Energy dependence of the carbon plasma beam on the arc voltage and the anode–cathode distance in the pulsed arc discharge method. Diam. Relat. Mater. 2005, 14, 1451–1454. [Google Scholar] [CrossRef]
  33. Katoh, R.; Nonaka, K.; Sumiyama, K.; Peng, D.L.; Hihara, T. Morphology and magnetic properties of Fe and Al nanocomposites prepared with single and double-glow-discharge sources. Mater. Trans. 2008, 49, 1830–1835. [Google Scholar] [CrossRef]
  34. Ha, J.; Liu, L.; He, S. Influential Mechanism of Electrode Spacing on the Self-pulsing Discharge in Cavity Cathode Discharge. High Volt. Eng. 2021, 47, 796–804. [Google Scholar]
  35. Gu, X. Study on Processes and Properties of Fe-Al Alloy Layer of 45 Steel by Double-Glow Plasma Alloying. Master’s Thesis, Nanjing University of Aeronautics and Astronautics, Nanjing, China, 2008. [Google Scholar]
Figure 1. The schematic diagram of the electrode structure set during the double-glow plasma discharge: (a) Non-intersection between the source and the workpiece. (b) Intersect between the source and workpiece and the glow discharge zones overlap.
Coatings 14 01175 g001
Figure 2. Mesh refinement model used in simulation.
Coatings 14 01175 g002
Figure 3. (a) The electron density; (b) the electronic temperature; (c) the potential distribution; (d) the number density of excited-state argon ions when the working pressure is 0.08 Torr, 0.30 Torr, 0.45 Torr and 0.75 Torr, respectively.
Coatings 14 01175 g003
Figure 4. The influence of different working pressures on electron temperature and electron density.
Coatings 14 01175 g004
Figure 5. (a) The electron density distribution; (b) the electron temperature distribution; (c) the potential distribution; and (d) the number density distribution of excited-argon ions at the electrode spacing of 3 mm, 10 mm, 20 mm, 40 mm.
Coatings 14 01175 g005
Figure 6. The curves of the electrode spacing versus number density of excited argon ions at different working pressures.
Coatings 14 01175 g006
Figure 7. (ad) The distribution of the electron density; (eh) the electron temperature distribution; (il) the potential distribution; and (mp) the number density distribution of excited-argon ions when the different source voltages are 200 V, 400 V, 600 V and 800 V, respectively.
Coatings 14 01175 g007
Figure 8. The glow intensity distribution map (a) before cross-linking in the negative glow region; (b) after cross-linking in the negative glow zone.
Coatings 14 01175 g008
Figure 9. The relationship curve between the electron density and electrode spacing at the different voltage differences.
Coatings 14 01175 g009
Figure 10. The distribution of the electron density at the voltage differences: (a) 350 V, (b) 450 V and (c) 550 V at the working pressure of 0.26 Torr and the electrode spacing of 30 mm.
Coatings 14 01175 g010
Figure 11. (a) The determination of optimal working pressure. (b) The determination of optimal electrode spacing.
Coatings 14 01175 g011
Figure 12. The comparison between experimental data and simulation results.
Coatings 14 01175 g012
Table 1. Reactions between particles during the discharge process.
Serial NumberReaction ExpressionsReaction Rate Constant
R 1e + Ar => e + ArBased on collision cross-section
R 2e + Ar => e + Ar*Based on collision cross-section
R 3e + Ar* => e + ArBased on collision cross-section
R 4e + Ar => 2e+ Ar+Based on collision cross-section
R 5e + Ar* => 2e + Ar+Based on collision cross-section
R 6Ar* + Ar* => e + Ar + Ar+3.734 × 10⁸ m3/(s·mol)
R 7Ar* + Ar => Ar + Ar1 × 107 m3/(s·mol)
Disclaimer/Publisher’s Note: The statements, opinions and data contained in all publications are solely those of the individual author(s) and contributor(s) and not of MDPI and/or the editor(s). MDPI and/or the editor(s) disclaim responsibility for any injury to people or property resulting from any ideas, methods, instructions or products referred to in the content.