Article

Effect of an Ultrasonic Vibration on the Microstructure and Properties of Al Alloy/Steel Laser Welding-Brazing Joints

1
School of Public Utilities, Jiangsu Urban and Rural Construction Vocational College, Changzhou 213003, China
2
College of Automotive Engineering, Changzhou Institute of Technology, Changzhou 213003, China
3
School of Intelligent Manufacturing and Control Engineering, Shanghai Polytechnic University, Shanghai 201209, China
4
Harbin Welding Institute Limited Company, Harbin 150028, China
5
Zhengzhou Research Institute of Mechanical Engineering, Zhengzhou 450001, China
*
Author to whom correspondence should be addressed.
Coatings 2024, 14(9), 1219; https://doi.org/10.3390/coatings14091219
Submission received: 2 September 2024 / Revised: 18 September 2024 / Accepted: 19 September 2024 / Published: 21 September 2024
(This article belongs to the Special Issue Tribology and Mechanical Characteristics of Films)

Abstract

:
This study analyzes the influence of different ultrasonic amplitudes on the microstructure composition, microhardness, tensile strength, and corrosion resistance of Al alloy/steel laser welding-brazing joints assisted by ultrasonic vibration. The application of ultrasonic vibration did not change the microstructure composition of the joints but refined them. The joints were all composed of θ-Fe(Al, Si)3 and τ5-Al7.2Fe1.8Si formed at the interface reaction zone, as well as an α-Al solid solution and Al-Si eutectic phase generated in the weld seam zone. Meanwhile, the thickness of the IMCs at the interface decreased with an increase in the ultrasonic amplitude. When the ultrasonic amplitude was 8 μm, the IMCs thickness was a minimum of 1.62 μm. In this condition, the reduction of the IMCs thickness and the refined grain of joints made the microhardness and tensile strength reach the maximum. The fracture of joints with ultrasonic amplitudes of 0 and 4.8 μm began at the weld seam and extended to the interface reaction zone at the steel side, while the fracture of joints was located in the heat-affected zone (HAZ) of the Al alloy side when the ultrasonic amplitude was 8.0 and 11.2 μm. The fracture mode of the former presented a typical mixed fracture with cleavage steps and tearing edges, and that of the latter showed ductile fracture with uniform and fine ductile dimples. The corrosion resistance of the joints was improved by adding ultrasonic vibration. When the ultrasonic amplitude was 8 μm, its corrosion resistance was optimum; it was ascribed to a dense oxide film formed on the surface of the metal under the action of ultrasonic vibration.

1. Introduction

To protect the environment and save energy [1,2], Al alloy/steel structures are widely used in the manufacturing fields of automobiles, aerospace, and ships due to the high strength of steel and the lightweight and corrosion resistance of Al alloys, which achieve lightweight structures [3,4]. However, due to its differences in physical and chemical properties, problems during the joining process of Al alloy and steel are as follows [5,6,7]: First, the melting point of Al alloy is much lower than that of steel, so Al alloy is melted, but the steel remains in the solid state during the joining process. The difference in melting point leads to poor fusion and uneven microstructure of Al alloy/steel joints. Secondly, their linear expansion coefficients are different. Stress appears easily in joints, which can cause deformation or cracking of joints. Finally, Al reacts with Fe to form brittle Fe-Al intermetallic compounds (IMCs) easily at the interface, which can deteriorate the mechanical properties of joints and become the source of cracks in joints.
Based on the above reasons, it is difficult to achieve high-quality joints using traditional fusion welding, and fusion brazing is considered one of the most effective methods to join Al alloy and steel [8,9,10]. It places the heat source on the Al alloy side to melt it, and then the liquid metal wets and spreads on the surface of the steel to achieve metallurgical bonding. The laser heat source has the characteristics of high energy density, concentrated heat, fast welding speed, and small welding deformation; thus, laser welding brazing has a significant advantage in joining the Al alloy and steel. However, the following problems need to be solved during laser welding brazing between steel and Al alloy. On the one hand, the wettability of liquid Al alloy on the surface of steel should be improved to obtain a good weld appearance. On the other hand, the thickness of the brittle IMCs layer should be reduced to achieve high-quality Al alloy/steel joints [11]. Li et al. [12] investigated the effect of three different groove types on the wettability of liquid Al alloy as well as the thickness and composition of IMCs at the interface of Al alloy /steel joints. They showed that when the groove type was a single V-shaped groove for the steel and without a groove for the Al alloy, the wettability of the liquid metal was optimal. Under this condition, the thickness of the IMCs at the interface was 2.0 μm. When Y-type groove edge preparation was performed for both the Al alloy and steel, the thickness of the IMCs layer at the interface was 7.2 μm. The IMCs thickness was 4.9 μm with a single Y-type groove for the steel and a single V-type groove for the Al alloy. All the IMCs at the interface consisted of θ-Fe(Al, Si)3 and τ5-Fe1.8Al7.2Si. Other scholars [13,14] have reported that regardless of how the process parameters of laser welding brazing are adjusted, an IMCs layer with a thickness of 2–10 μm appears at the interface of joints. If the IMCs thickness is too large, the mechanical properties of the joint will deteriorate. Reducing the IMC layer thickness can improve the performance of the joint [15].
An ultrasonic wave is a kind of mechanical vibration with a frequency higher than 20 kHz [16], which has good directional propagation and high energy density. It can produce cavitation effects, acoustic flow effects, acoustic radiation effects, mechanical vibration effects, and thermal effects in propagation media [17]. These effects can improve the fluidity of the liquid metal in the molten pool to improve its wettability, promote the interdiffusion of atoms to upgrade its metallurgical bond, and break down the dendrite structure during the solidification process to refine grains [18,19]. Hong et al. [20] applied ultrasonic vibration during the friction stir welding process of 6061 Al alloy and 301L stainless steel. The results showed that the interdiffusion of atoms at the interface was promoted under ultrasonic vibration, thereby improving the metallurgical bonding strength of the joint. The tensile strength of the joint was increased by 27.9%. Liu et al. [21] also confirmed that the application of ultrasonic vibration improved the fluidity of metal in the molten pool, which facilitated the escape of pores. Meanwhile, the microstructure of the weld seam was refined, and the IMC thickness at the interface was reduced. These modified the mechanical properties of the joint.
Therefore, ultrasonic vibration-assisted laser welding brazing was adopted to conduct butt-welding tests on Al alloy and steel. The influence of ultrasonic vibration on the macroscopic morphology, microstructure composition, and mechanical properties of the joints was studied. The effect of ultrasonic vibration on the IMC layer at the interface was analyzed in detail. This will provide experimental data and a theoretical basis for the application of Al alloy/steel structural components.

2. Materials and Methods

2.1. Materials

In this paper, Q235 low-carbon steel and 6061 Al alloy were selected as the base metals, and the plate size was 150 mm × 80 mm × 2 mm. Using AlSi12 flux-cored welding wire as the filler material, the welding wire diameter was 1.6 mm. The chemical compositions of these materials are listed in Table 1.

2.2. Experiments on Ultrasonic Vibration-Assisted Laser Welding Brazing

Butt-welding experiments on 6061 Al alloy/Q235 steel were conducted using a laser equipment (model IPG YLS-6000-ST2) and a Fronius MIG welding machine. Ultrasonic vibration equipment (model YP-7015-4BZ-BZ) was used at the bottom of the workpiece. The equipment consisted mainly of an ultrasonic generator, ultrasonic transducer, and ultrasonic amplitude horn. The ultrasound equipment maintains a constant frequency of 20.5 kHz during startup, and its amplitude varies from 0 to 16 μm.
Before welding, the base materials were processed for Al alloy without a groove and for steel with a single V-type groove of 60°. The root clearance between the Al alloy and steel was 1.0 mm in the assembly process. The welding device of the ultrasonic vibration-assisted laser welding brazing system is shown in Figure 1. The process parameters are presented in Table 2. Argon, with a purity of 99.99%, was used as the shielding gas during welding.

2.3. Macro Morphology and Microstructure Analysis

After welding, the analysis samples were machined by cutting the wire electrode from the joints perpendicular to the weld seam. Metallographic specimens were ground and polished, followed by corrosion of welds by Keller’s reagent (95 mL H2O + 2.5 mL HNO3 + 1.5 mL HCl + 1.0 mL HF). The effect of different ultrasonic amplitudes on the morphology and microstructure composition of joints was analyzed using an ZEISS optical microscope (OM, Jena, Germany) and a JSM-6480 scanning electron microscope (SEM, JEOL, Tokyo, Japan) with an X-ray energy dispersive spectroscopy (EDS, Carl Zeiss, Jena, Germany).

2.4. Mechanical Property Testing

The tensile properties of the joints were tested on a YJ-8619 universal testing machine at a constant rate of 2 mm/min based on the GB/T2651-2008 standard [22]. The weld reinforcements on the front and bottom of the samples were removed to ensure the accuracy of the tensile results. Three samples were tested for each parameter, and the average value of the results was obtained.

2.5. Corrosion Resistance Analysis

In order to analyze the corrosion resistance of welding-brazing joints, potentiodynamic polarization curves and electrochemical impedance spectroscopy (EIS) measurements on joints in 3.5 wt. % NaCl solution were conducted by using the EG M283 electrochemical workstation with a standard three-electrode system, using the sample as the working electrode, the platinum electrode as the counter electrode and the saturated calomel electrode (SCE) as the reference electrode. The dimensions of the samples were 10 mm × 10 mm × 2 mm and the corrosion area was 20 cm2. The potentiodynamic polarization curve was tested with a scanning rate of 2 mV/s and a scanning range from −1 V to 1.5 V. The EIS data were obtained with a scanning frequency from 10−2 Hz to 105 Hz.
To investigate the corrosion resistance mechanism of welding-brazing joints under different ultrasonic amplitudes, a stable passive film was prepared at a passivation potential of 0.2 VSCE for 1 h in 3.5 wt. % NaCl solution. The chemical composition of the passive films on the surface of the joints was investigated by an X-ray photoelectron spectrometer (XPS). The element composition was confirmed based on the standard spectra of the elements.
Microelectrochemical corrosion testing was conducted using scanning vibration probe technology (SVET), and the potential gradient resulting from the flow of anions and cations was detected using vibrating microelectrodes. The probe tip started scanning at a distance of 100 μm from the surface and vibrated perpendicular to the electrode surface at a frequency of 330 Hz. The micro-corrosion currents of the joint soaked in the solution for 0, 1, 2, and 4 h were recorded.

3. Results and Discussion

3.1. Macro Morphology Analysis

Figure 2 illustrates the macro morphology and cross-sectional morphology of the Al alloy/steel laser welding-brazing joints under different ultrasonic amplitudes. From Figure 2a1–a3, the weld appearance was nice for the front but was not smooth for the back, and the wetting angle of the welding wire on the surface of the steel was 55.3° without ultrasonic vibration during the welding process. When vibration was applied, and the ultrasonic amplitude was 4.8 μm, as shown in Figure 2b1–b3, the weld appearance of the front and back weld seams were better, and the wetting angle was decreased to 50.7°, which indicated the wettability of welding wire was improved with the assistance of ultrasonic vibration during the welding process. From Figure 2c1–c3, when the ultrasonic amplitude was 8.0 μm, the weld width and weld reinforcement of the front and back weld seam increased, and the wetting angle decreased to 43.2° as a result of the better fluidity of the liquid metal. However, when the ultrasonic amplitude was 11.2 μm, as shown in Figure 2d1–d3, the weld width and weld reinforcement of the front and back weld seam were excessive. Therefore, by adding ultrasonic vibration in the welding process, the small ripples generated by vibration can change the surface morphology of the molten pool and reduce its surface tension, resulting in the fluidity improvement of the liquid metal. An excellent joint was obtained with a good weld appearance and a high weld quality when the ultrasonic amplitude was 8 μm.

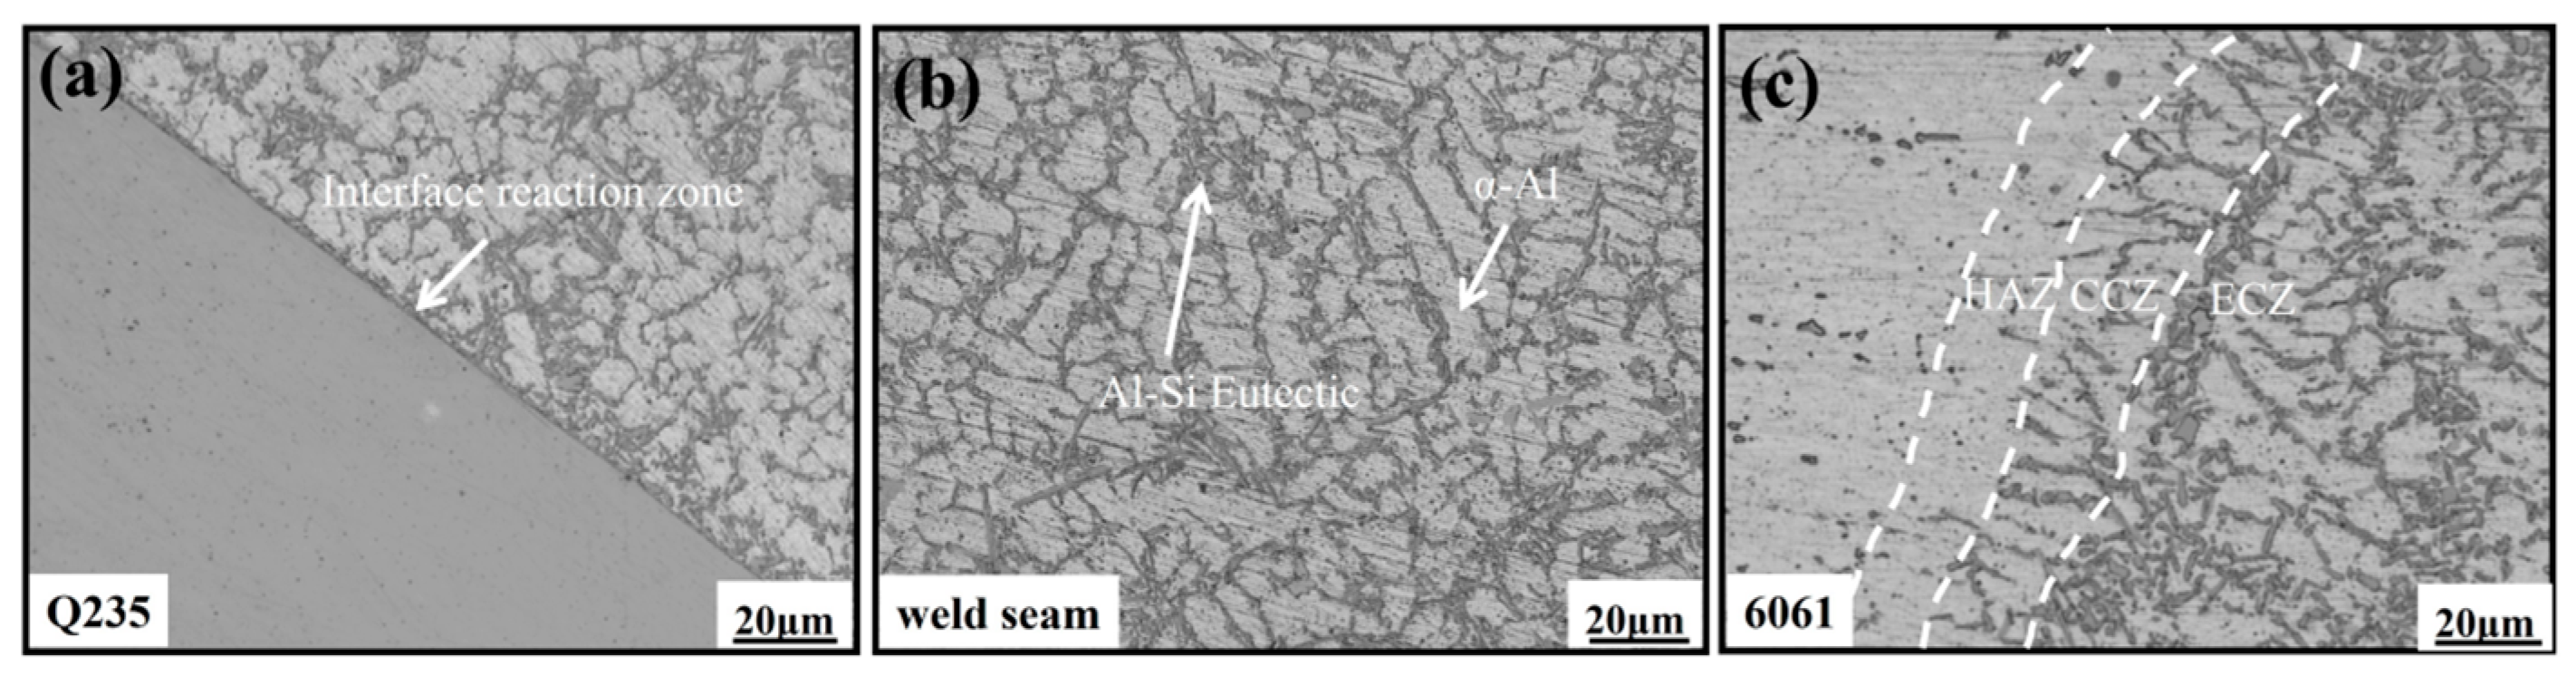
3.2. Microstructure Analysis

Figure 3 presents the microstructure of the Al alloy/steel laser welding-brazing joint. The joint includes the interface reaction zone on the steel side (see Figure 3a), weld seam zone (see Figure 3b), and fusion zone on the Al alloy side (see Figure 3c). From the Figures, it can be seen that the interface reaction zone near the steel side was relatively narrow. The weld seam zone was mainly composed of Al-Si eutectic and α-Al solid solution. On the Al alloy side, the Al alloy melted locally, and then the columnar crystal zone (CCZ) formed along the fusion line perpendicular to the heat-affected zone, while the fine equiaxed crystal zone (ECZ) formed near the center of the weld seam during the welding process. The reason for the formation of the CCZ is the large temperature gradient near the fusion line, and grain growth occurs along the direction of heat dissipation. However, at the center of the weld seam, there is sufficient time for the crystal nuclei to form and grow, and finally, the ECZ forms. To analyze the interface reaction zone (see Figure 3a) at the steel side in detail, SEM images and line scanning results of the brazing zone under different ultrasonic amplitudes are shown in Figure 4.
EDS analysis was performed on three characteristic points at the interface reaction zone in Figure 4a1–d1, and the results are listed in Table 3. Based on the point analysis results and the Al-Fe-Si binary and ternary phase diagrams, it was inferred that the interface reaction layer was mainly composed of the θ-Fe(Al, Si)3 phase near the steel side and the τ5-Al7.2Fe1.8Si phase near the weld seam zone. The authors’ team [23,24,25] had conducted a detailed analysis in previous studies. During the cooling process, molten metals preferentially formed the τ5-Al7.2Fe1.8Si phase; subsequently, Fe atoms reacted with the τ5-Al7.2Fe1.8Si phase to form the θ-Fe(Al, Si)3 phase. Thus, this indicated that applying ultrasonic vibration in laser welding brazing did not change the phase composition but could reduce the thickness of the IMCs layer. The thickness of the IMCs was 2.97 μm without ultrasonic vibration, as shown in Figure 4a1. The thickness of IMCs decreased to 2.52 μm with the ultrasound amplitude of 4.8 μm (see Figure 4b1). The thickness of IMCs decreased to 1.62 μm with the ultrasonic amplitude of 8.0 μm (see Figure 4c1). The thickness of IMCs was 1.65 μm with the ultrasonic amplitude of 11.2 μm (see Figure 4d1). The addition of ultrasonic vibration can effectively promote dislocation motion and reduce the dislocation density in the joint, which decreases the atomic diffusion rate and inhibits the growth of IMCs. When the ultrasound amplitude was 8.0 μm and 11.2 μm, the suppression effect was optimal, and it was beneficial for improving the mechanical properties of the joint.
Figure 4a2–d2 shows the element distribution at the Fe/Al interface of the joints with different ultrasound amplitudes. From the steel side to the weld seam, the content of Fe element decreased while the content of Si and Al elements increased. Fe, Si, and Al elements gathered at the interface and reacted to form Al-Fe-Si compounds. No significant difference was observed in element diffusion under different ultrasound amplitudes.
Figure 5 shows the microstructure of the weld seam under different ultrasonic amplitudes. Compared with the absence of ultrasonic vibration, the grain size of the weld seam was refined when the ultrasonic amplitude was 4.8 μm. When the ultrasonic amplitude increased to 8.0 μm, the grain size in the weld seam was smaller, and the distribution of the microstructure was more uniform. In the process of laser welding brazing, the energy field of ultrasonic vibration was transferred to the molten pool, and then acoustic cavitation and streaming were created in the liquid metal, which agitated the liquid metal during solidification, resulting in the modification and refinement of the microstructure. Grain refinement can enhance the strength and toughness of the weld seam. When the ultrasonic amplitude increased to 11.2 μm, the grain of the weld seam was not further refined due to the upper threshold value of ultrasonic vibration. Therefore, applying ultrasonic vibration in the laser welding-brazing process can refine the grain of the weld seam, and this refinement effect reached the optimal when the ultrasonic amplitude was 8.0 μm.

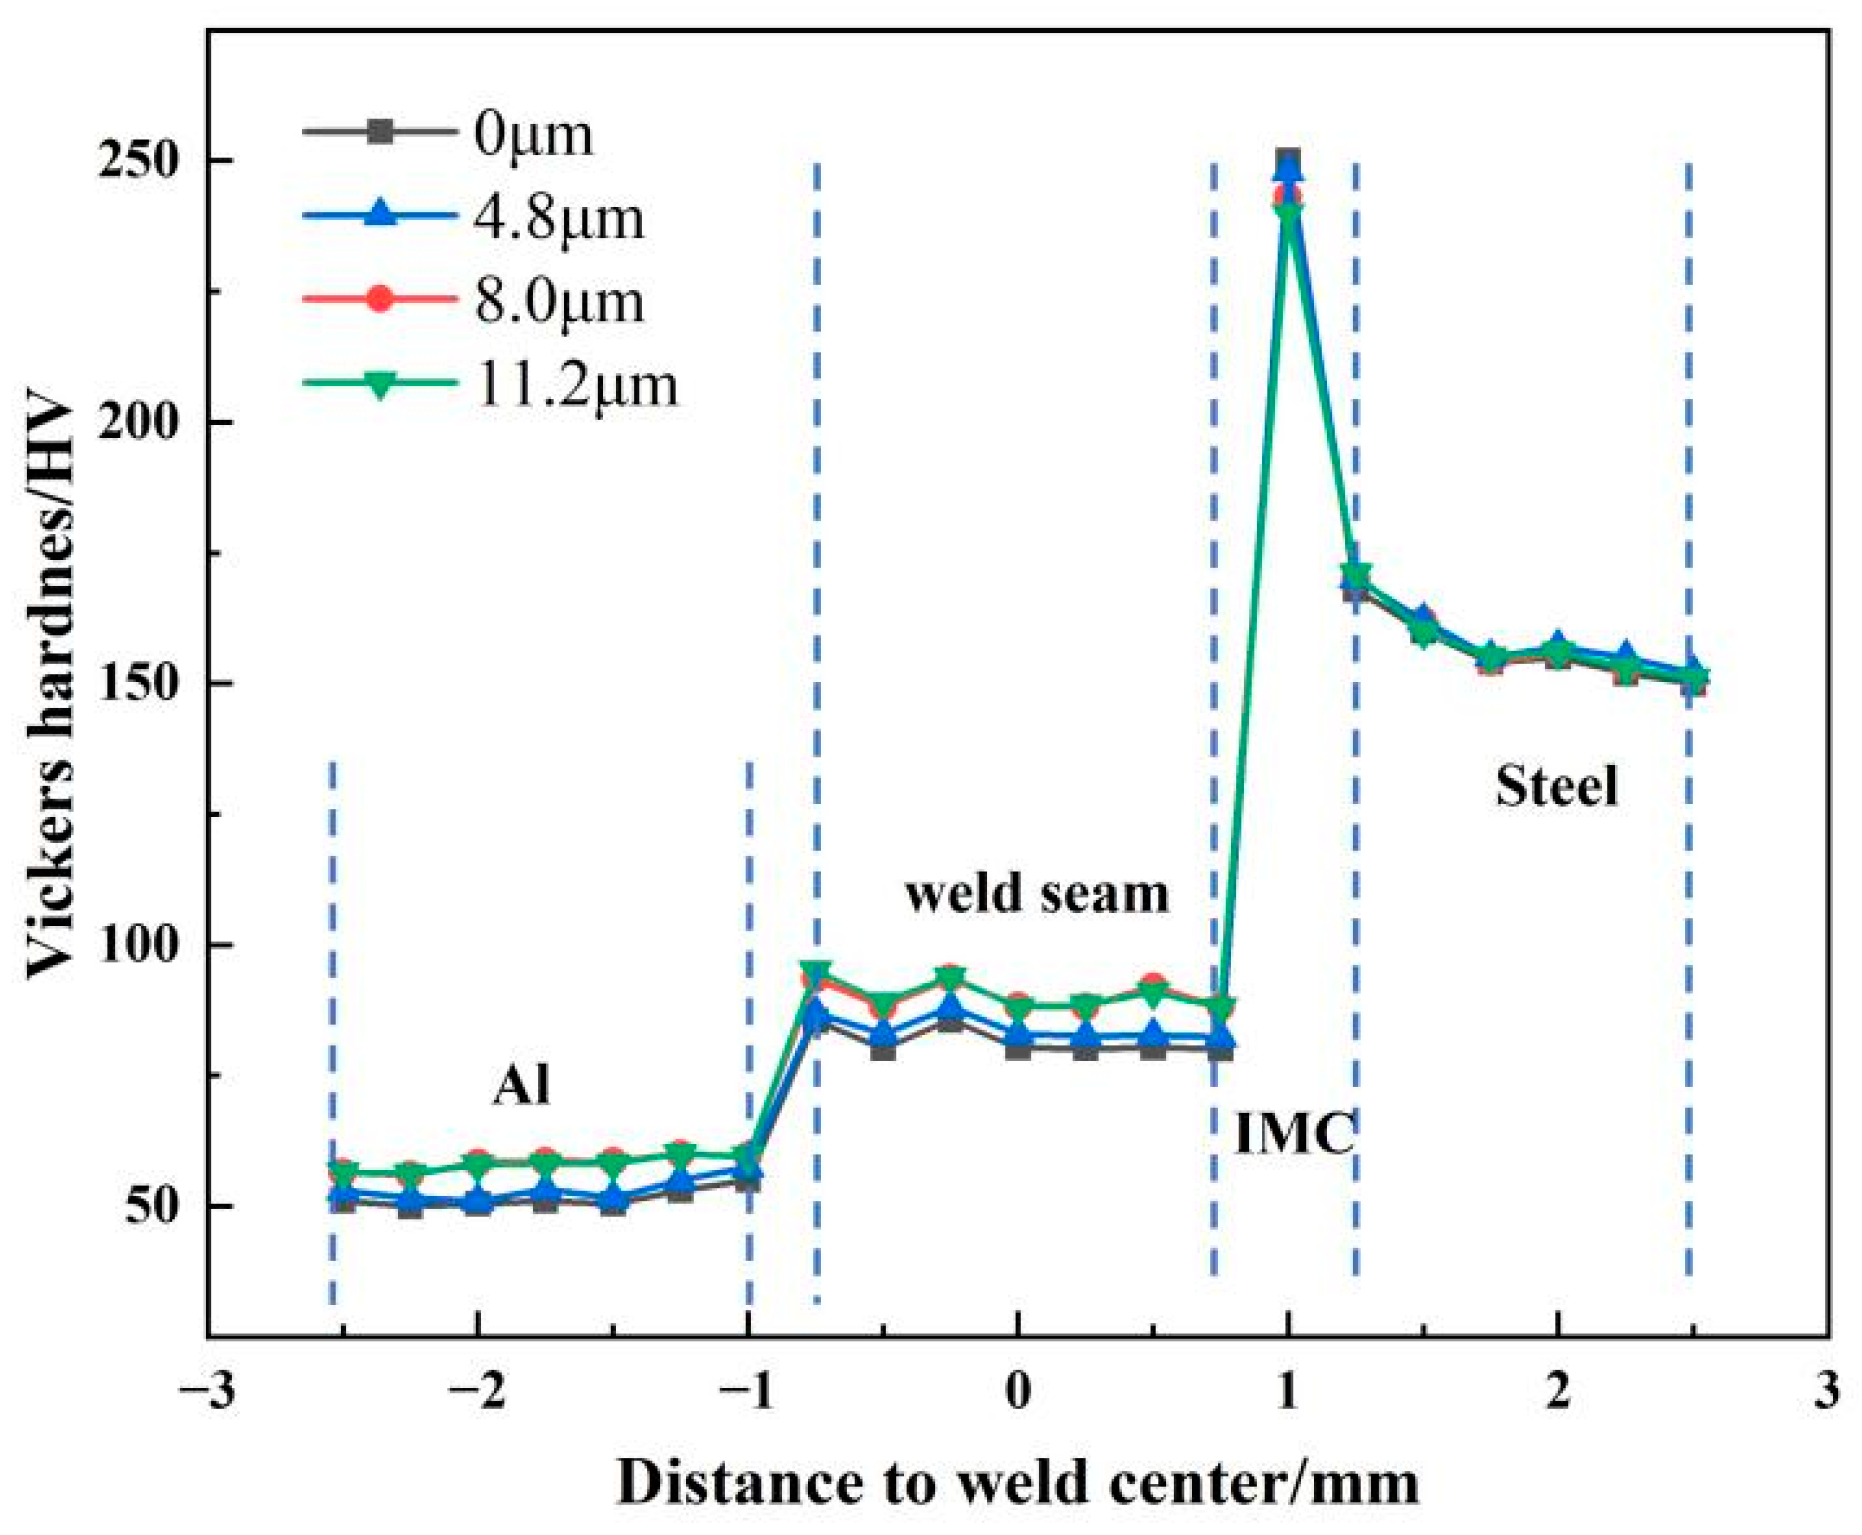
3.3. Hardness Analysis

Figure 6 shows the hardness distribution of the joints under different ultrasonic amplitudes. The hardness of the 6061 Al alloy was about 55 HV, and the hardness of Q235 steel was about 155 HV. The hardness at the center of the weld seam was higher than that of the 6061 Al alloy but lower than that of the Q235 steel. Among them, the hardness of the interface reaction layer reached the optimum due to the higher hardness of the θ-Fe(Al, Si)3 phase and τ5-Al7.2Fe1.8Si phase. Meanwhile, the hardness of the weld seam increased after applying ultrasonic vibration in the process of laser welding brazing. This was because, under the action of ultrasonic vibration, the liquid molten pool decomposed and recombined at the grain boundaries due to the shear stress resulting from damping. Finally, the grain boundaries became finer, and the hardness of the weld seam increased.

3.4. Tensile Strength Analysis

Figure 7 shows the tensile strength of the laser welding-brazing joints under different ultrasonic amplitudes. The tensile strength of the joints without ultrasonic vibration was 192 MPa. The tensile strength of the joints first increased and then decreased slightly, reaching a maximum of 227 MPa when the ultrasonic amplitude was 8.0 μm. The variation trend in the tensile properties was consistent with the microstructure analysis results. The grain size of the weld seam in the joint was the finest, and the thickness of the IMCs layer was the smallest when the ultrasonic amplitude was 8.0 μm. During the solidification process of the joint, the stress is non-uniform in the grain boundaries. Ultrasonic vibration can remove this non-uniformity and improve the crystal strength. Meanwhile, ultrasonic vibration can also enhance the strength of the joint by changing the intergranular interface and grain boundary orientation.
Figure 8 shows the fracture location and morphology of the joint under different ultrasonic amplitudes. The fracture of the joint with ultrasonic amplitudes of 0 and 4.8 μm began at the weld seam and extended to the interface reaction zone at the steel side, as shown in Figure 8a1 and Figure 8b1. The Al-Si eutectic phase in the weld seam presented a long strip shape, and the thickness of the IMCs at the interface was large under these parameter conditions. These two brittle and hard compounds are prone to becoming crack sources, causing fracture of the joint. Figure 8a2 and Figure 8b2 present a typical mixed fracture with cleavage steps and tearing edges.
Figure 8c1 and Figure 8d1 show that the fracture of the joint was located in the heat-affected zone (HAZ) of the Al alloy side when the ultrasonic amplitude was 8.0 and 11.2 μm, respectively. Under the action of ultrasonic vibration, the thickness of the IMCs at the interface decreased significantly, and the microstructure in the weld seam was uniform and fine, which resulted in its good toughness. However, the Al alloy was affected by the welding thermal cycle and then aged; thus, it underwent shrinkage and fracture during tensile testing. From Figure 8c2 and Figure 8d2, uniform and fine ductile dimples were distributed in the fracture, which exhibited typical ductile fracture. Hence, with the ultrasonic amplitude increasing, the weak point of the joint shifted from the interface zone on the steel side to the HAZ on the Al alloy side.

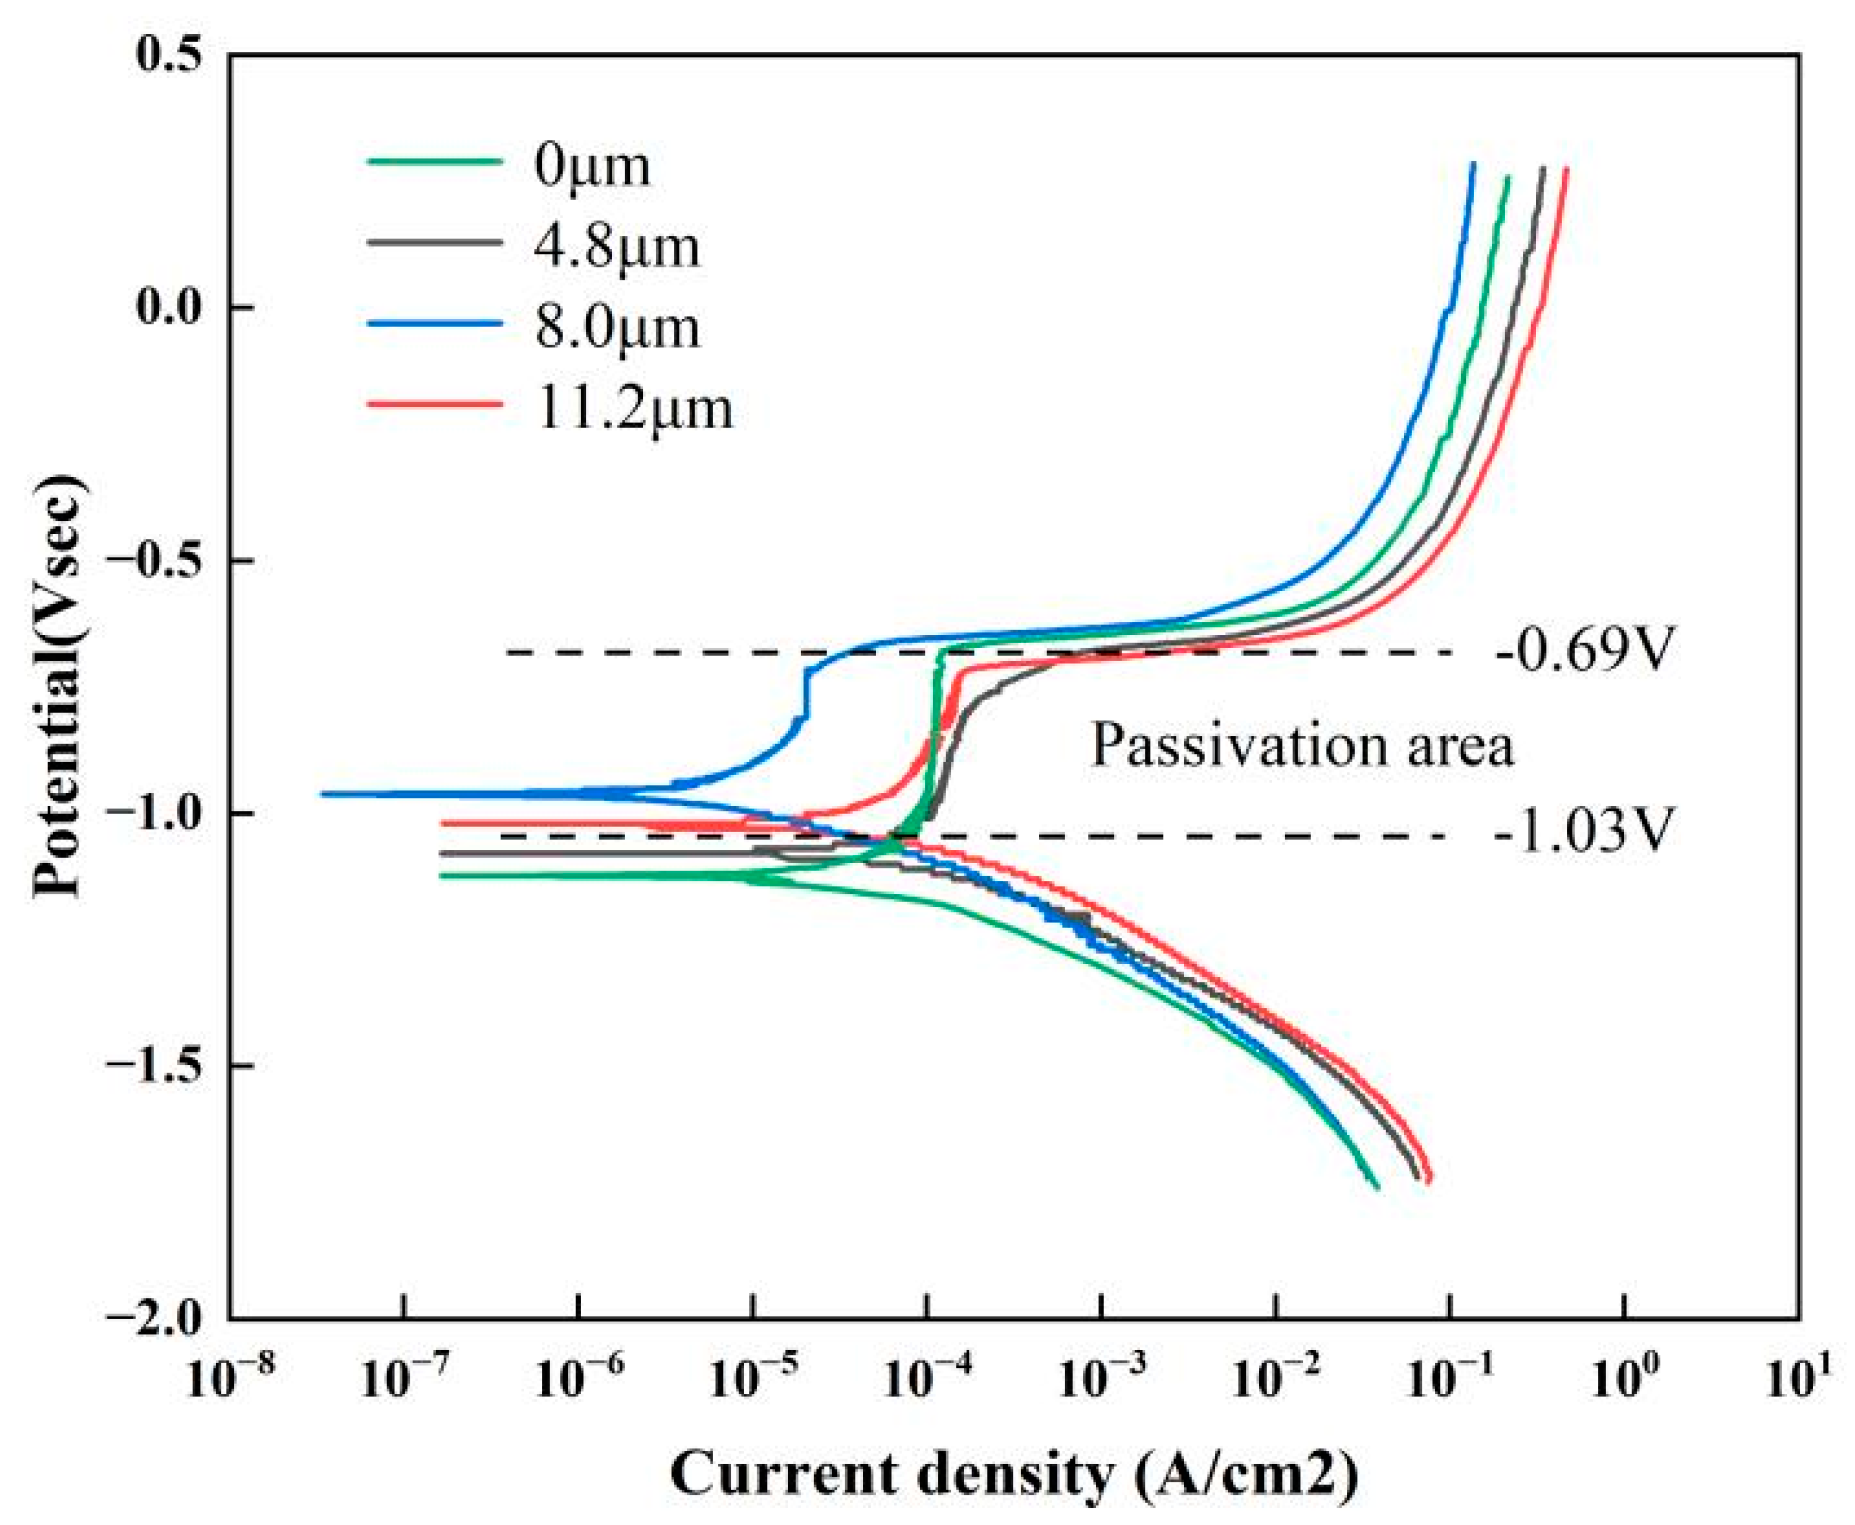
3.5. Corrosion Resistance Analysis

Figure 9 shows the dynamic potential polarization curves of the joint in a 3.5% NaCl solution under different ultrasound amplitudes. The self-corrosion potential Ecorr and self-corrosion current density Icorr were measured by fitting the polarization curves using the Cview software (version 3.0), and the parameters of the corresponding electrochemical measurements are listed in Table 4. From Figure 9, it can be seen that the joint passivated multiple times during the corrosion process, with a passivation zone ranging from −1.03 V to −0.69 V. This was attributed to the slow dissolution rate of the passivation film on the surface of the joint during the early stage of corrosion. As the corrosion potential and corrosion current increased, the dissolution rate of the passivation film increased, and the passivation film began to rupture. The self-corrosion potential reflects the difficulty or ease of corrosion in the joint, and the larger the self-corrosion potential, the less likely the corrosion is. The self-corrosion current density reflects the actual corrosion rate of the joint during the corrosion process; the lower the corrosion current density, the lower is the corrosion rate [26,27]. From Table 4, it can be observed that as the ultrasound amplitude increased from 0 μm to 11.2 μm, the self-corrosion potential of the joint first increased and then decreased, whereas the self-corrosion current density first decreased and then increased. When the ultrasonic amplitude was 8.0 μm, the self-corrosion potential was a maximum of −0.9623 V, the self-corrosion current density was a minimum of 3.9032 × 10⁻⁶, and the corrosion resistance of the joint was optimal. Under this condition, the grain size of the joint was the smallest. The refinement of grains increased the number of grain boundaries per unit volume, which resulted in more active sites at the grain boundaries participating in corrosion reactions. These active sites can effectively hinder the infiltration of corrosive agents, thereby improving the corrosion resistance of the joint [28,29]. In addition, fine grains can reduce the stress concentration to prevent crack formation and propagation, which indirectly improves the corrosion resistance.
Figure 10 shows the EIS diagram of the joints under different ultrasonic amplitudes. The capacitance arc radius enlarged with an increase in the ultrasound amplitude, as shown in the Nyquist diagram in Figure 10a. Some researchers have reported that the capacitive arc radius of a joint represents its corrosion resistance. The larger the capacitive arc radius, the better the corrosion resistance of the joint [30,31,32]. From the figure, when the ultrasonic amplitude was 8.0 and 11.2 μm, the capacitive arc radius was large, and the corresponding corrosion resistance was optimum. This is because a dense oxide film forms on the surface of the metal under the effect of ultrasonic vibration. The presence of an oxide film not only prevents the joint from being corroded further, but also protects the joint from being corroded by other substances.
The relationship between the phase angle and the frequency of the Bode is shown in Figure 10b. The capacitive arc in the low-frequency region was generated by surface corrosion of the electrode, and the phase angle increased first and then decreased slightly with the increase in ultrasonic amplitude. Some scholars have pointed out that a larger phase angle implies a more homogeneous current distribution and lower corrosion rate [33]. When the ultrasonic amplitude was 8.0 μm, the phase angle of the joint reached the maximum, which suggested that the corrosion resistance of the joint was optimal.
Figure 10c shows the relationship between Bode-|Z| and frequency. In general, a high value of |Z| in the low-frequency region indicates the superior corrosion resistance of the joint. When the ultrasonic amplitude was 8.0 μm, the |Z| value of the joint was the largest, which meant that the corrosion resistance of the joint was the optimum.
Figure 10d shows an equivalent circuit diagram that simulates the formation process of the passivation film. Where Rs represents the solution resistance, Rct represents the charge transfer resistance, CPE represents the constant phase element of the double charge layer capacitor, and W represents the angular frequency. Based on the equivalent circuit diagram, the curve in Figure 10a was fitted using Zview software to obtain the data in Table 5. It is suggested that Rct represents the charge transfer rate of the joint; the larger the Rct, the slower the charge transfer and the better the corrosion resistance [34]. Research has shown that the value of n is related to the passivation film on the surface of the joints. The more corrosion products on the surface of the joint, the larger the surface roughness and the smaller the n value, which results in poorer corrosion resistance [35]. When the ultrasonic amplitude was 8.0 μm, the Rct of the joint was a maximum of 3248 Ω·cm2, and n was a maximum of 0.90, which meant that the corrosion resistance of the joint was the best. This result is consistent with that of Nyquist and Bode.

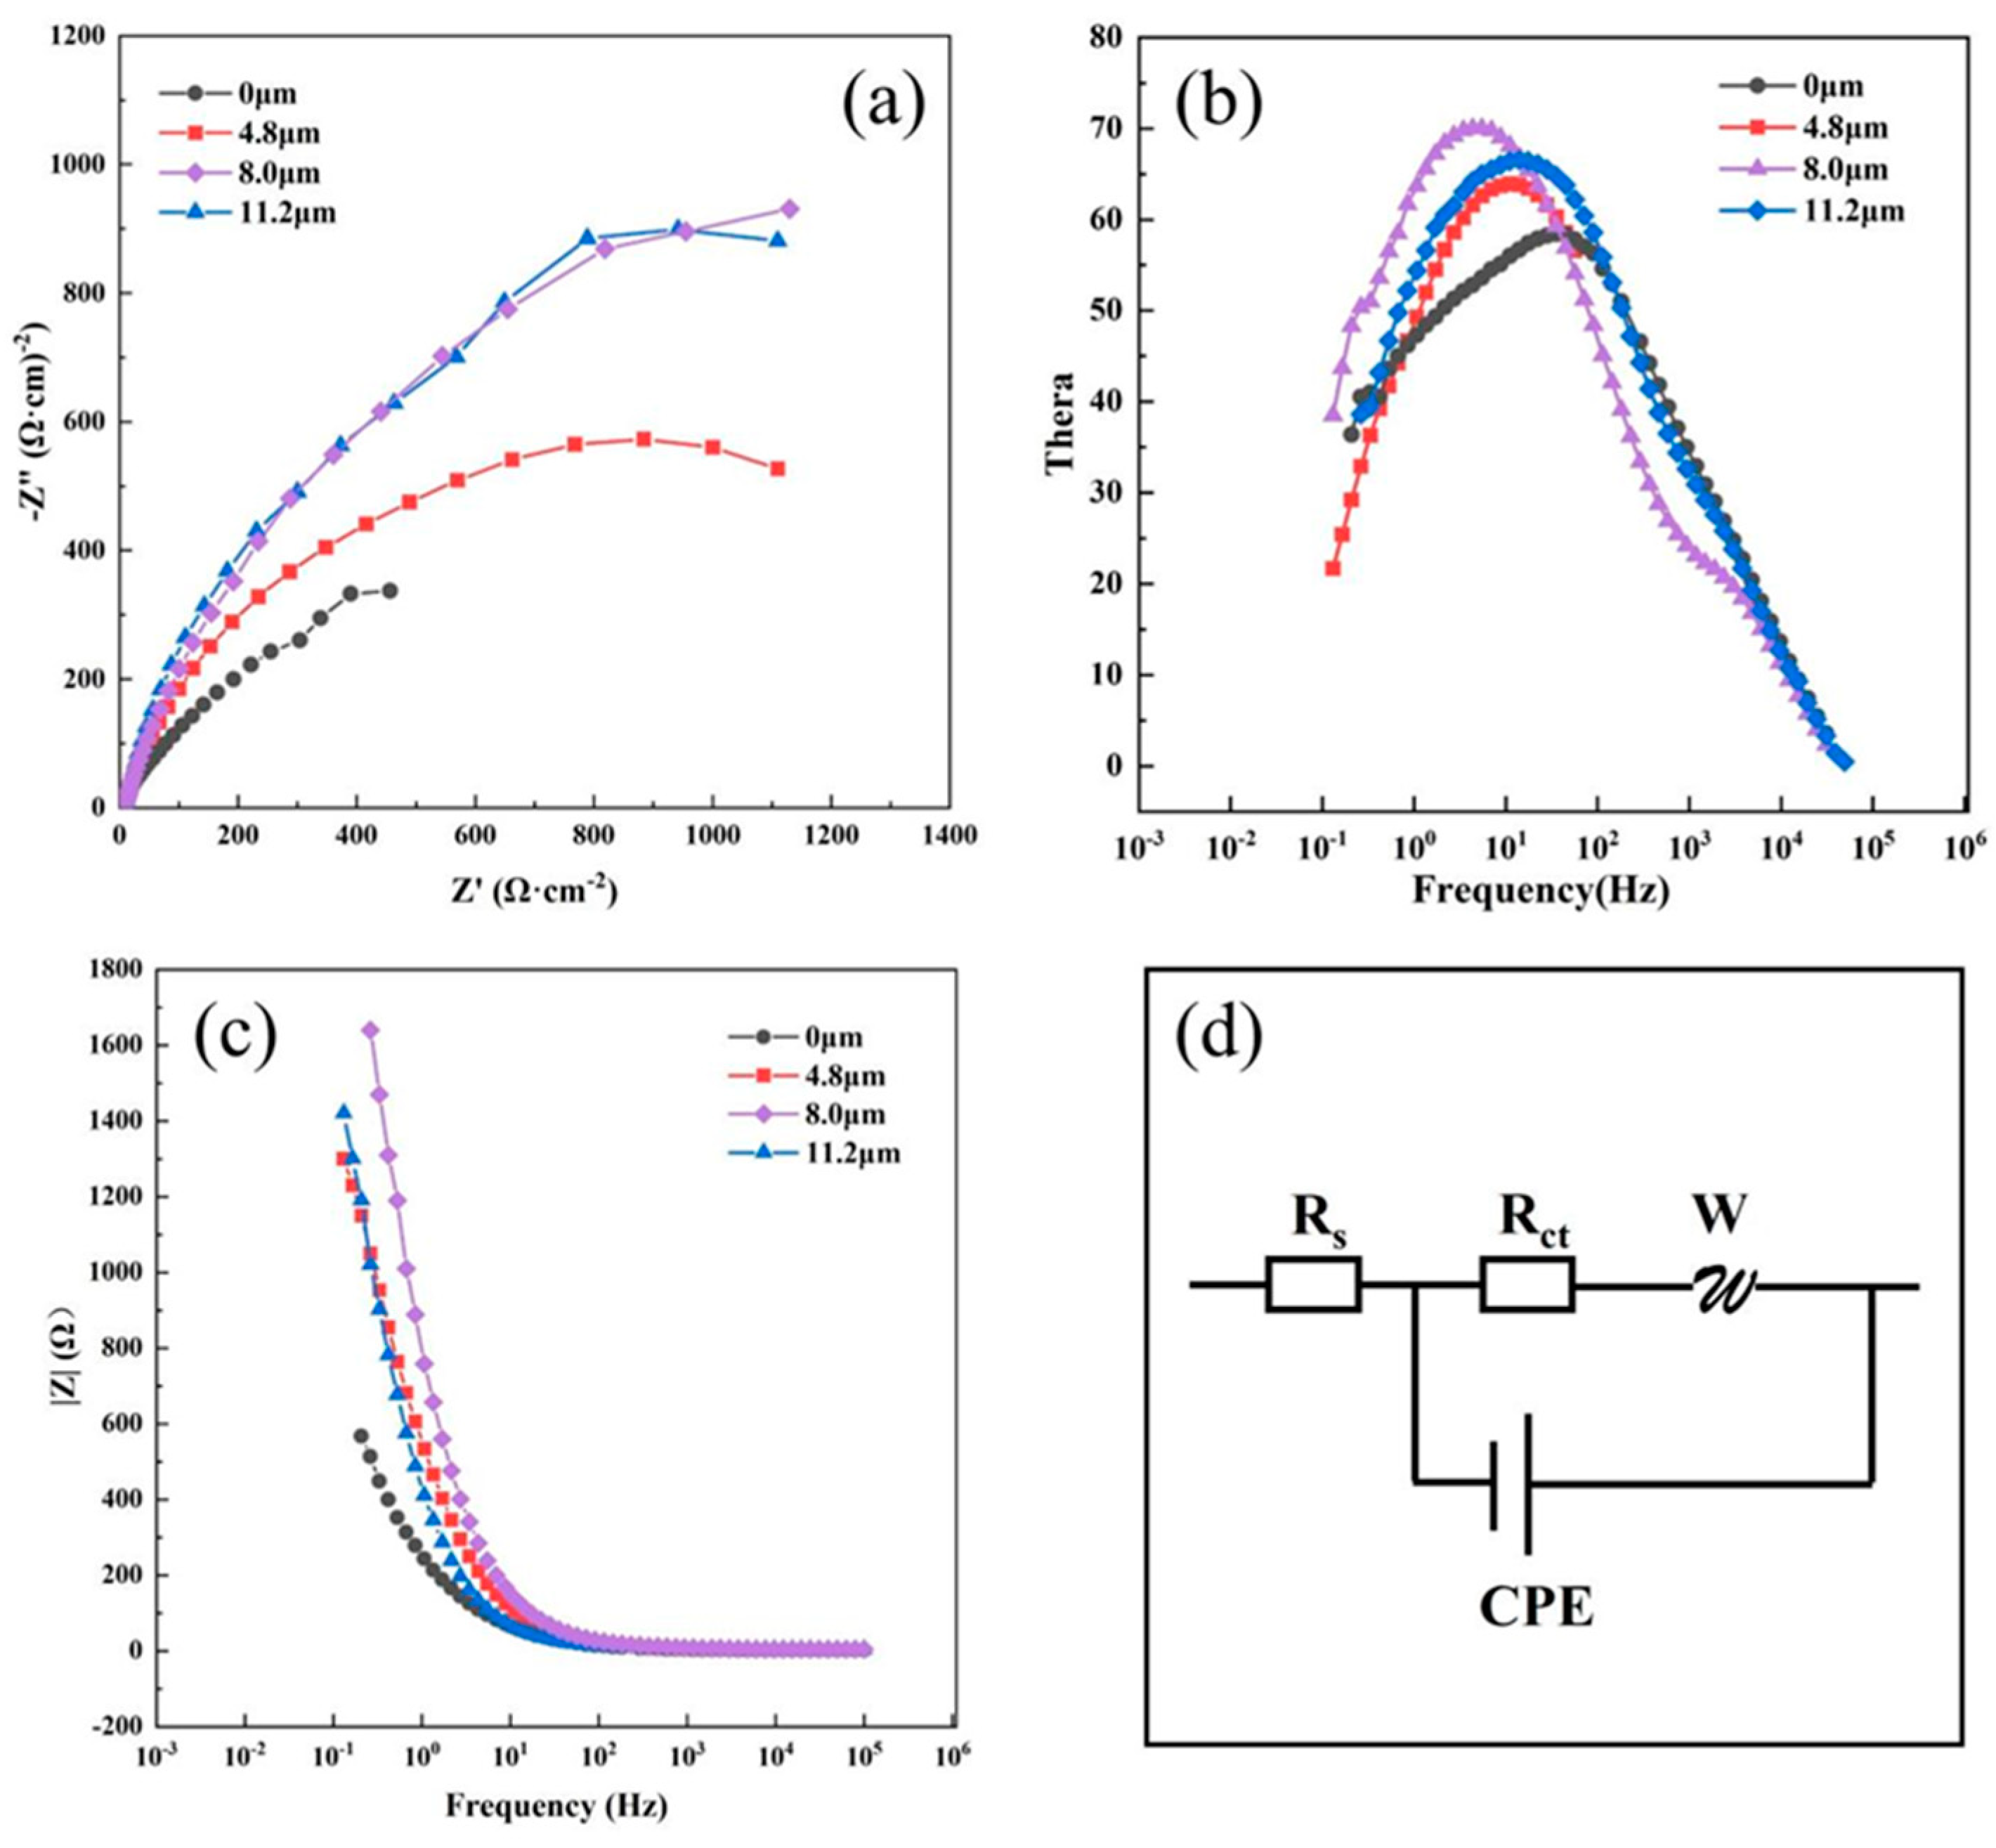
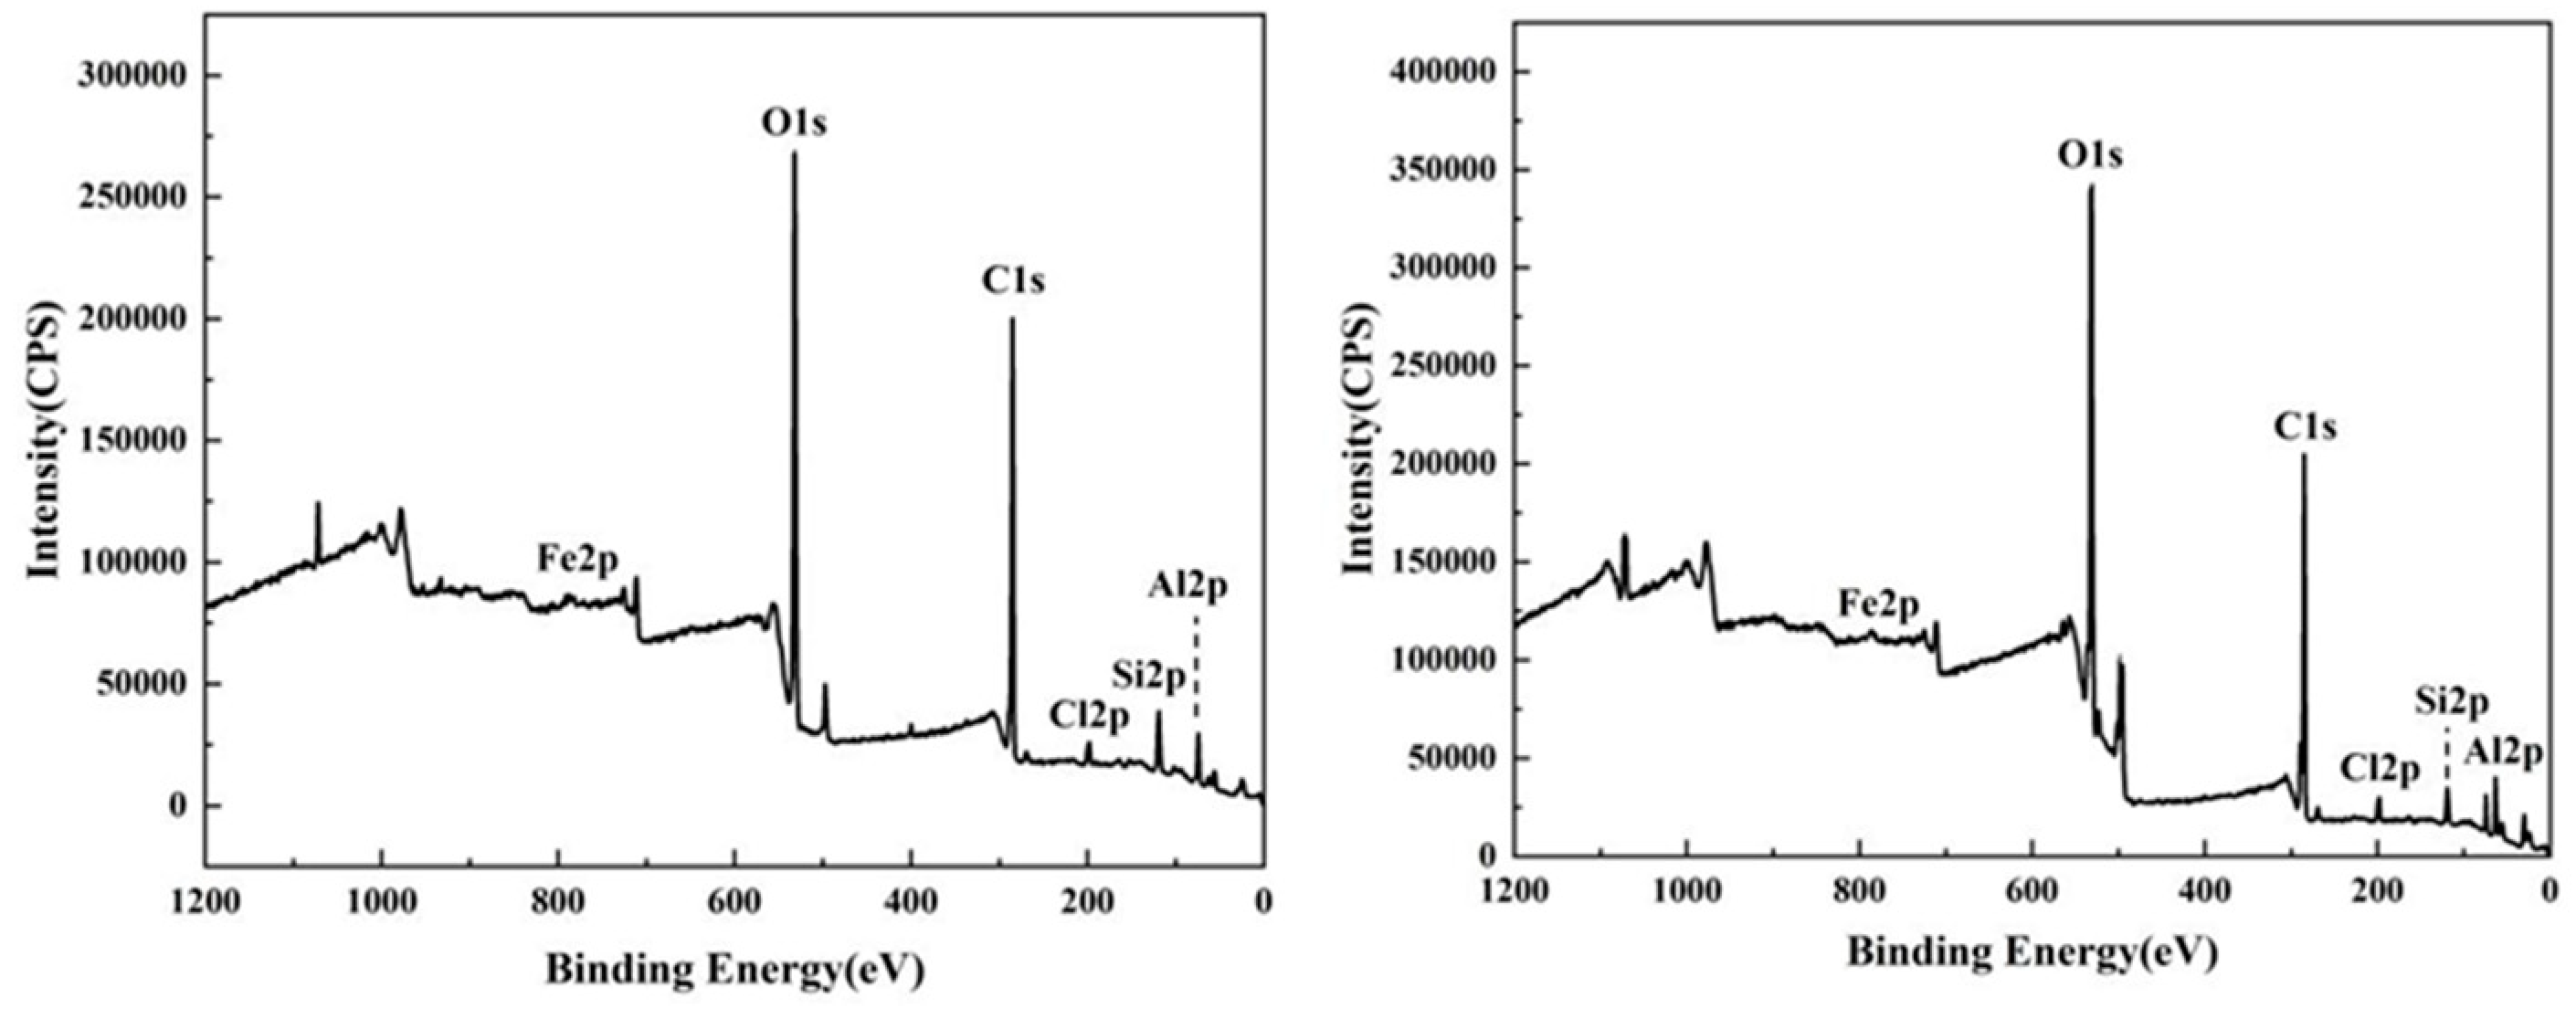
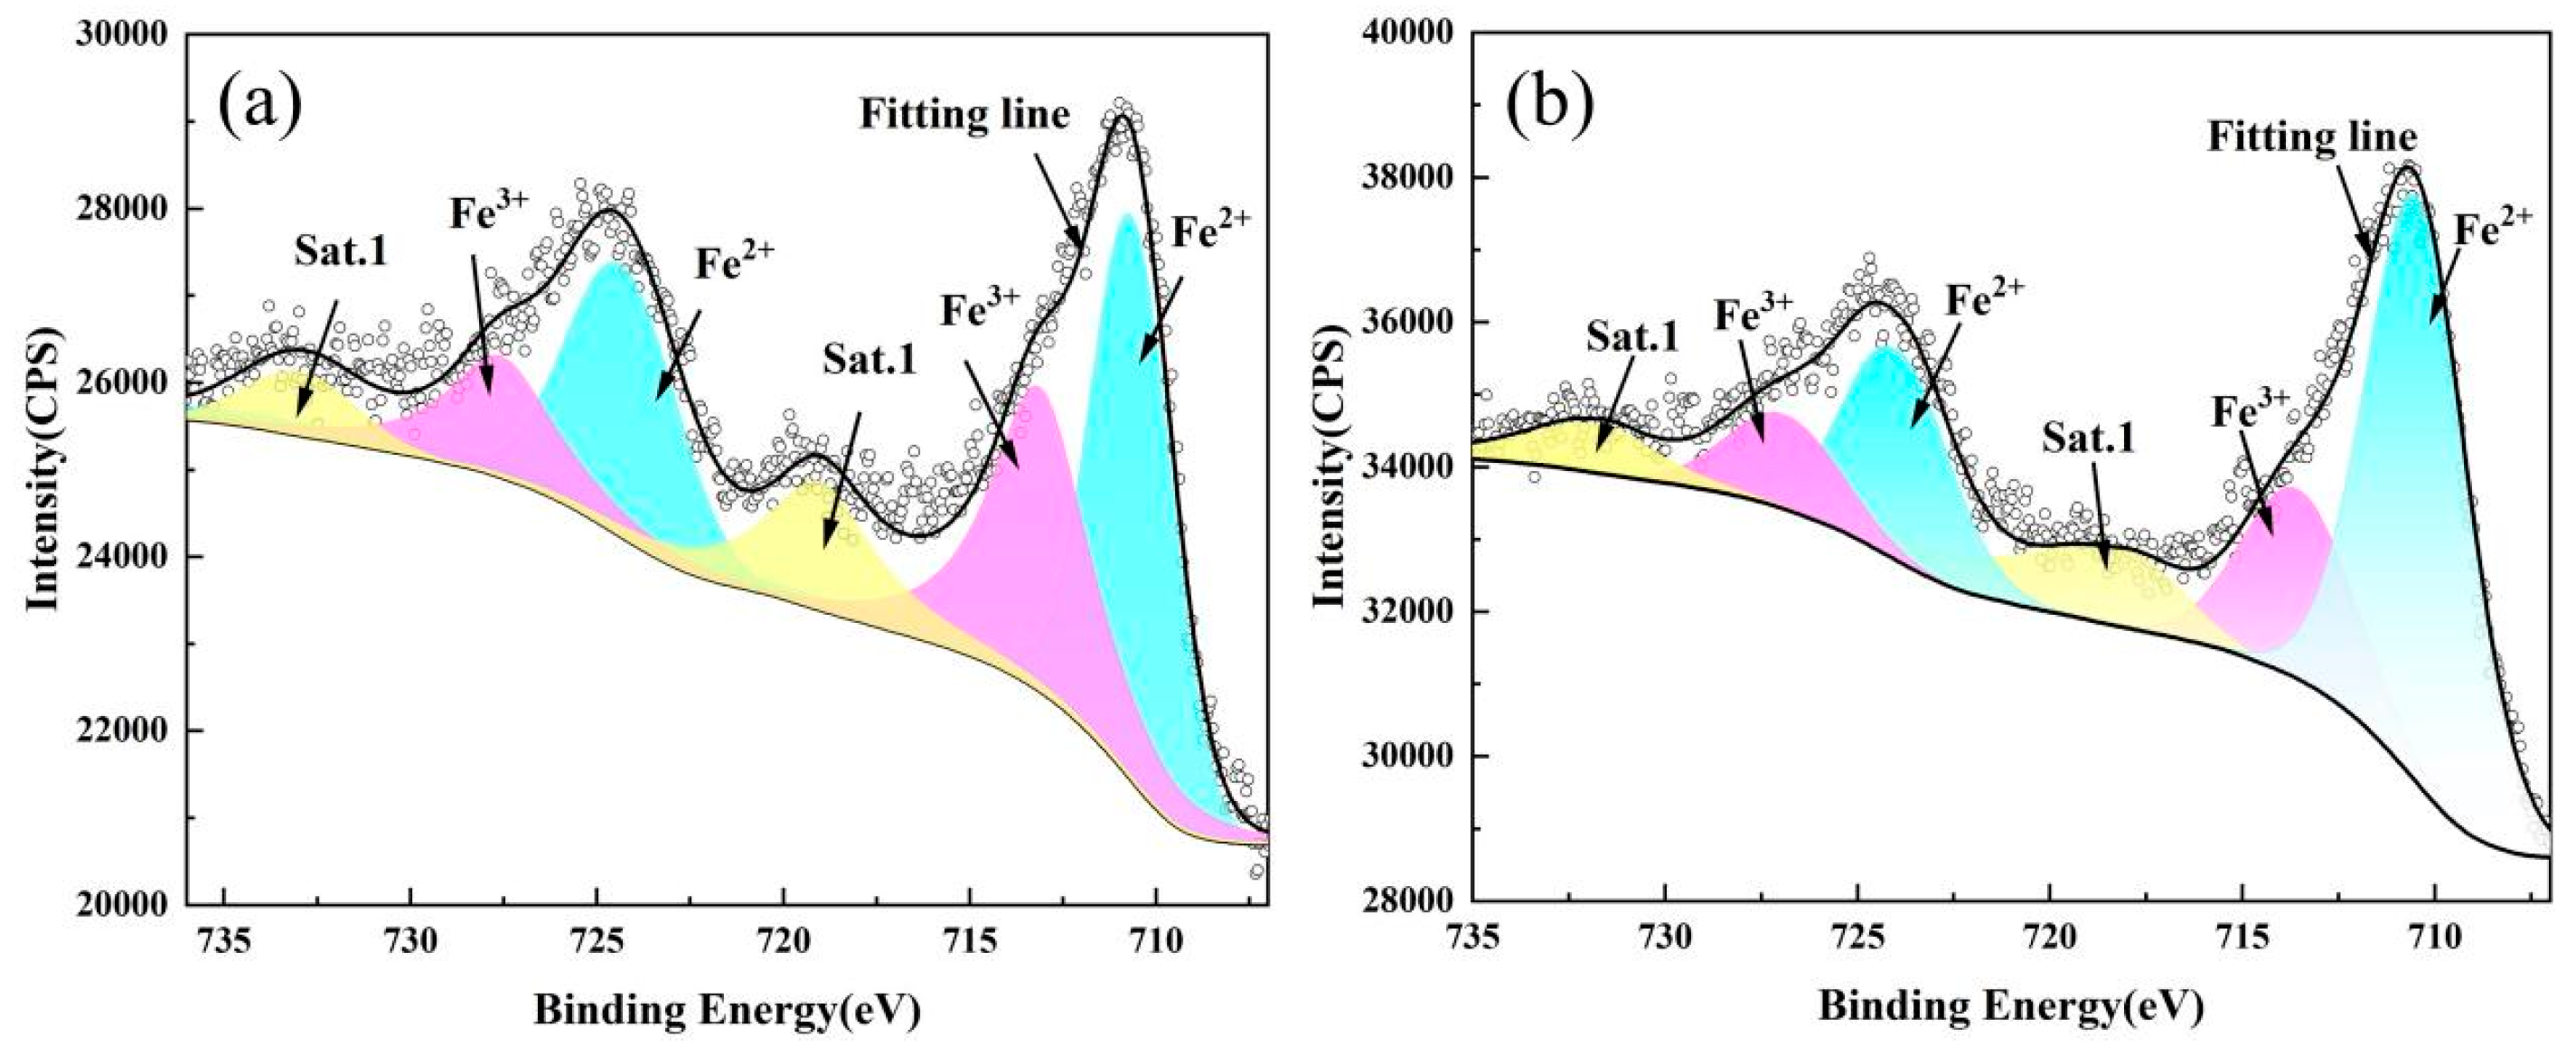
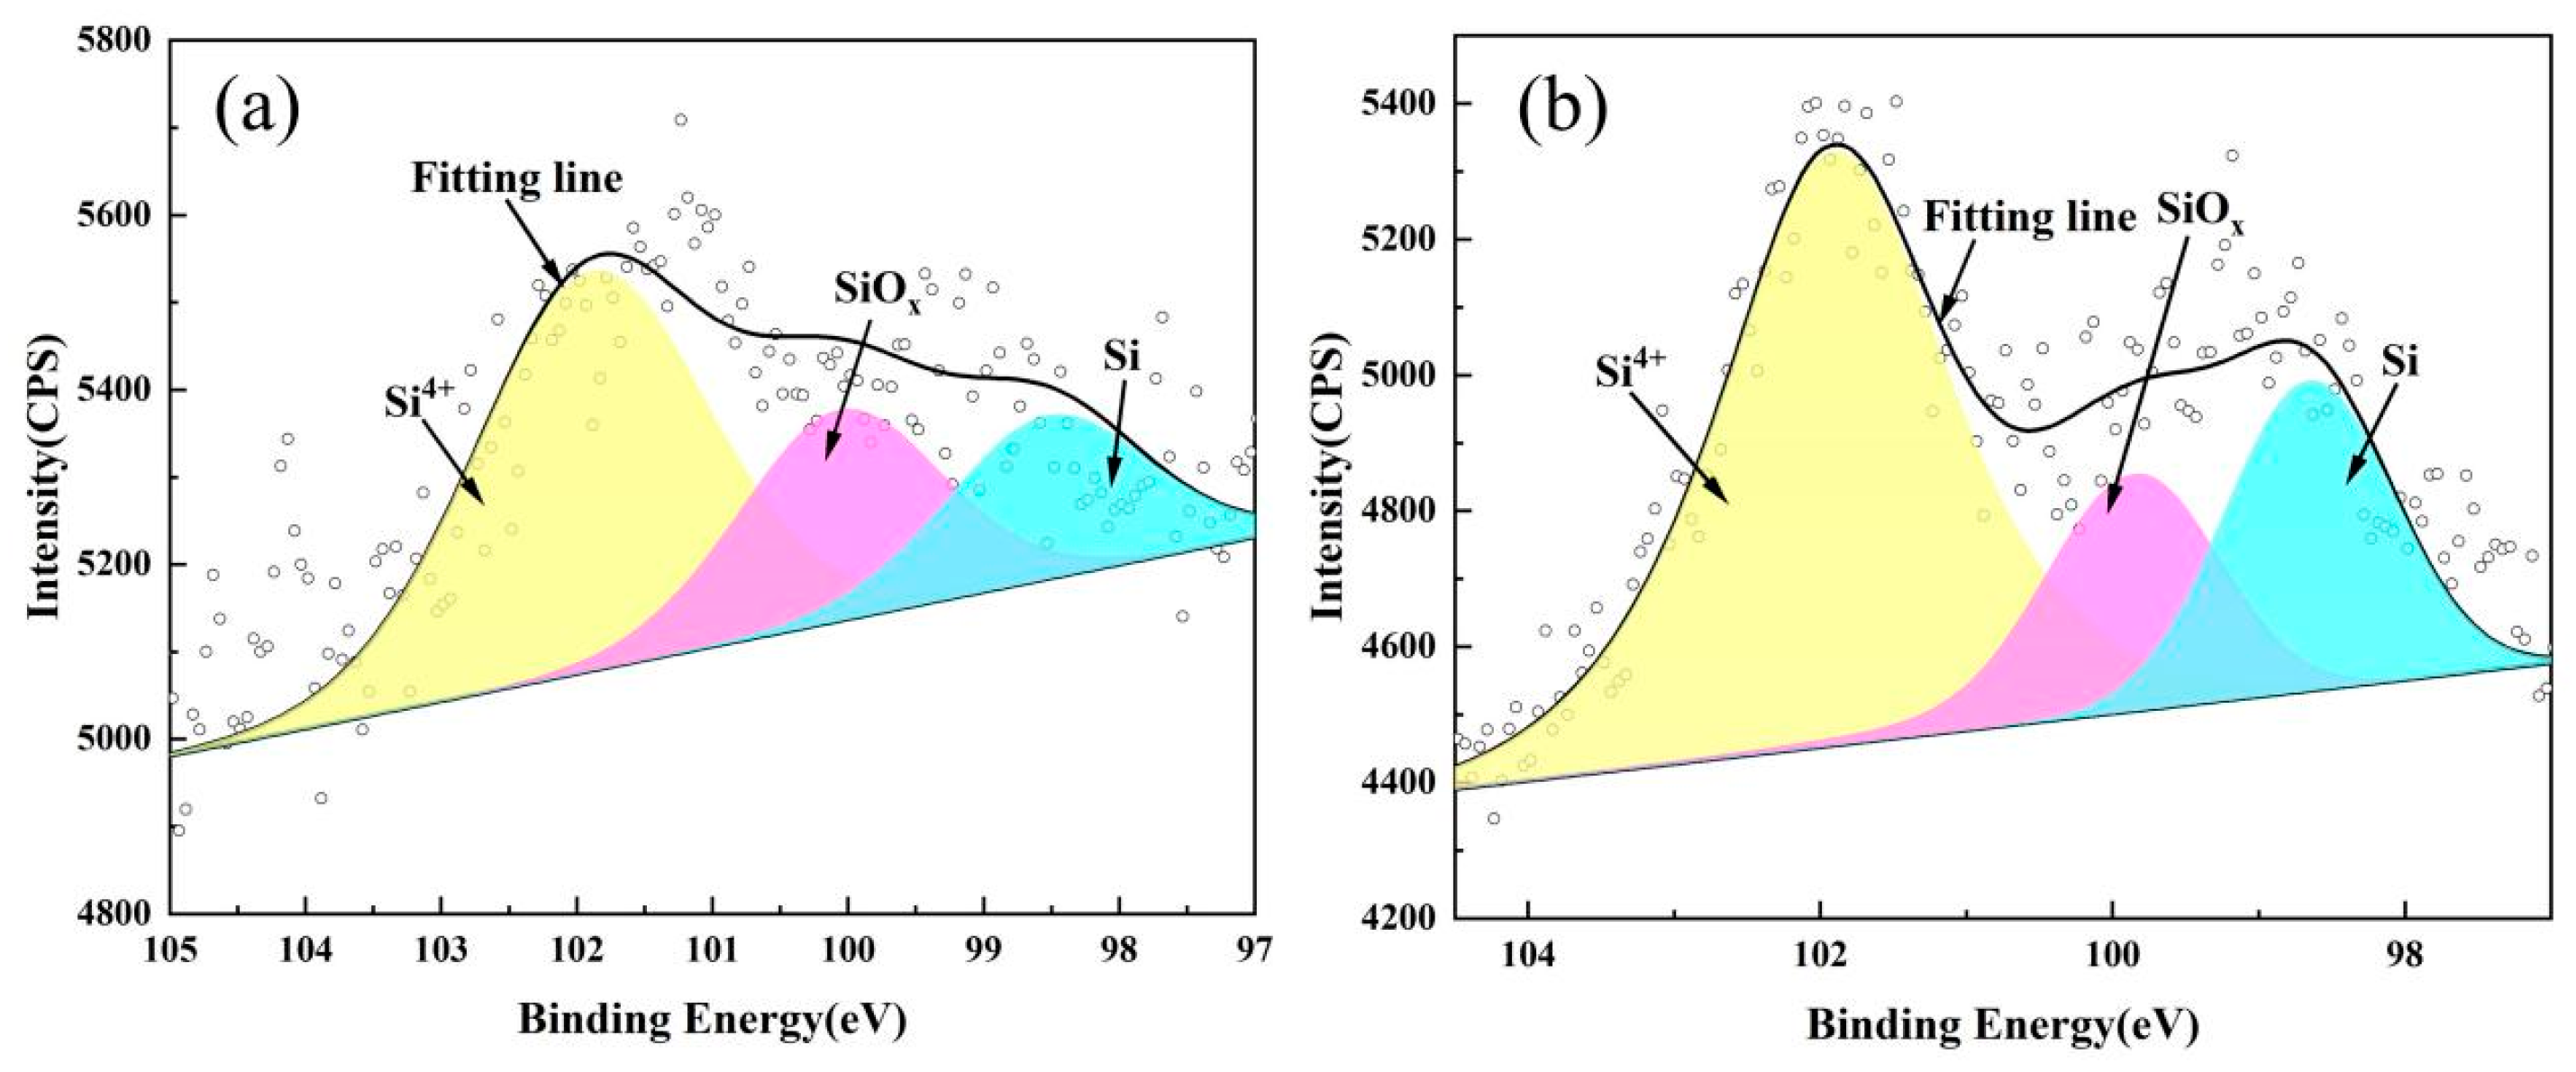
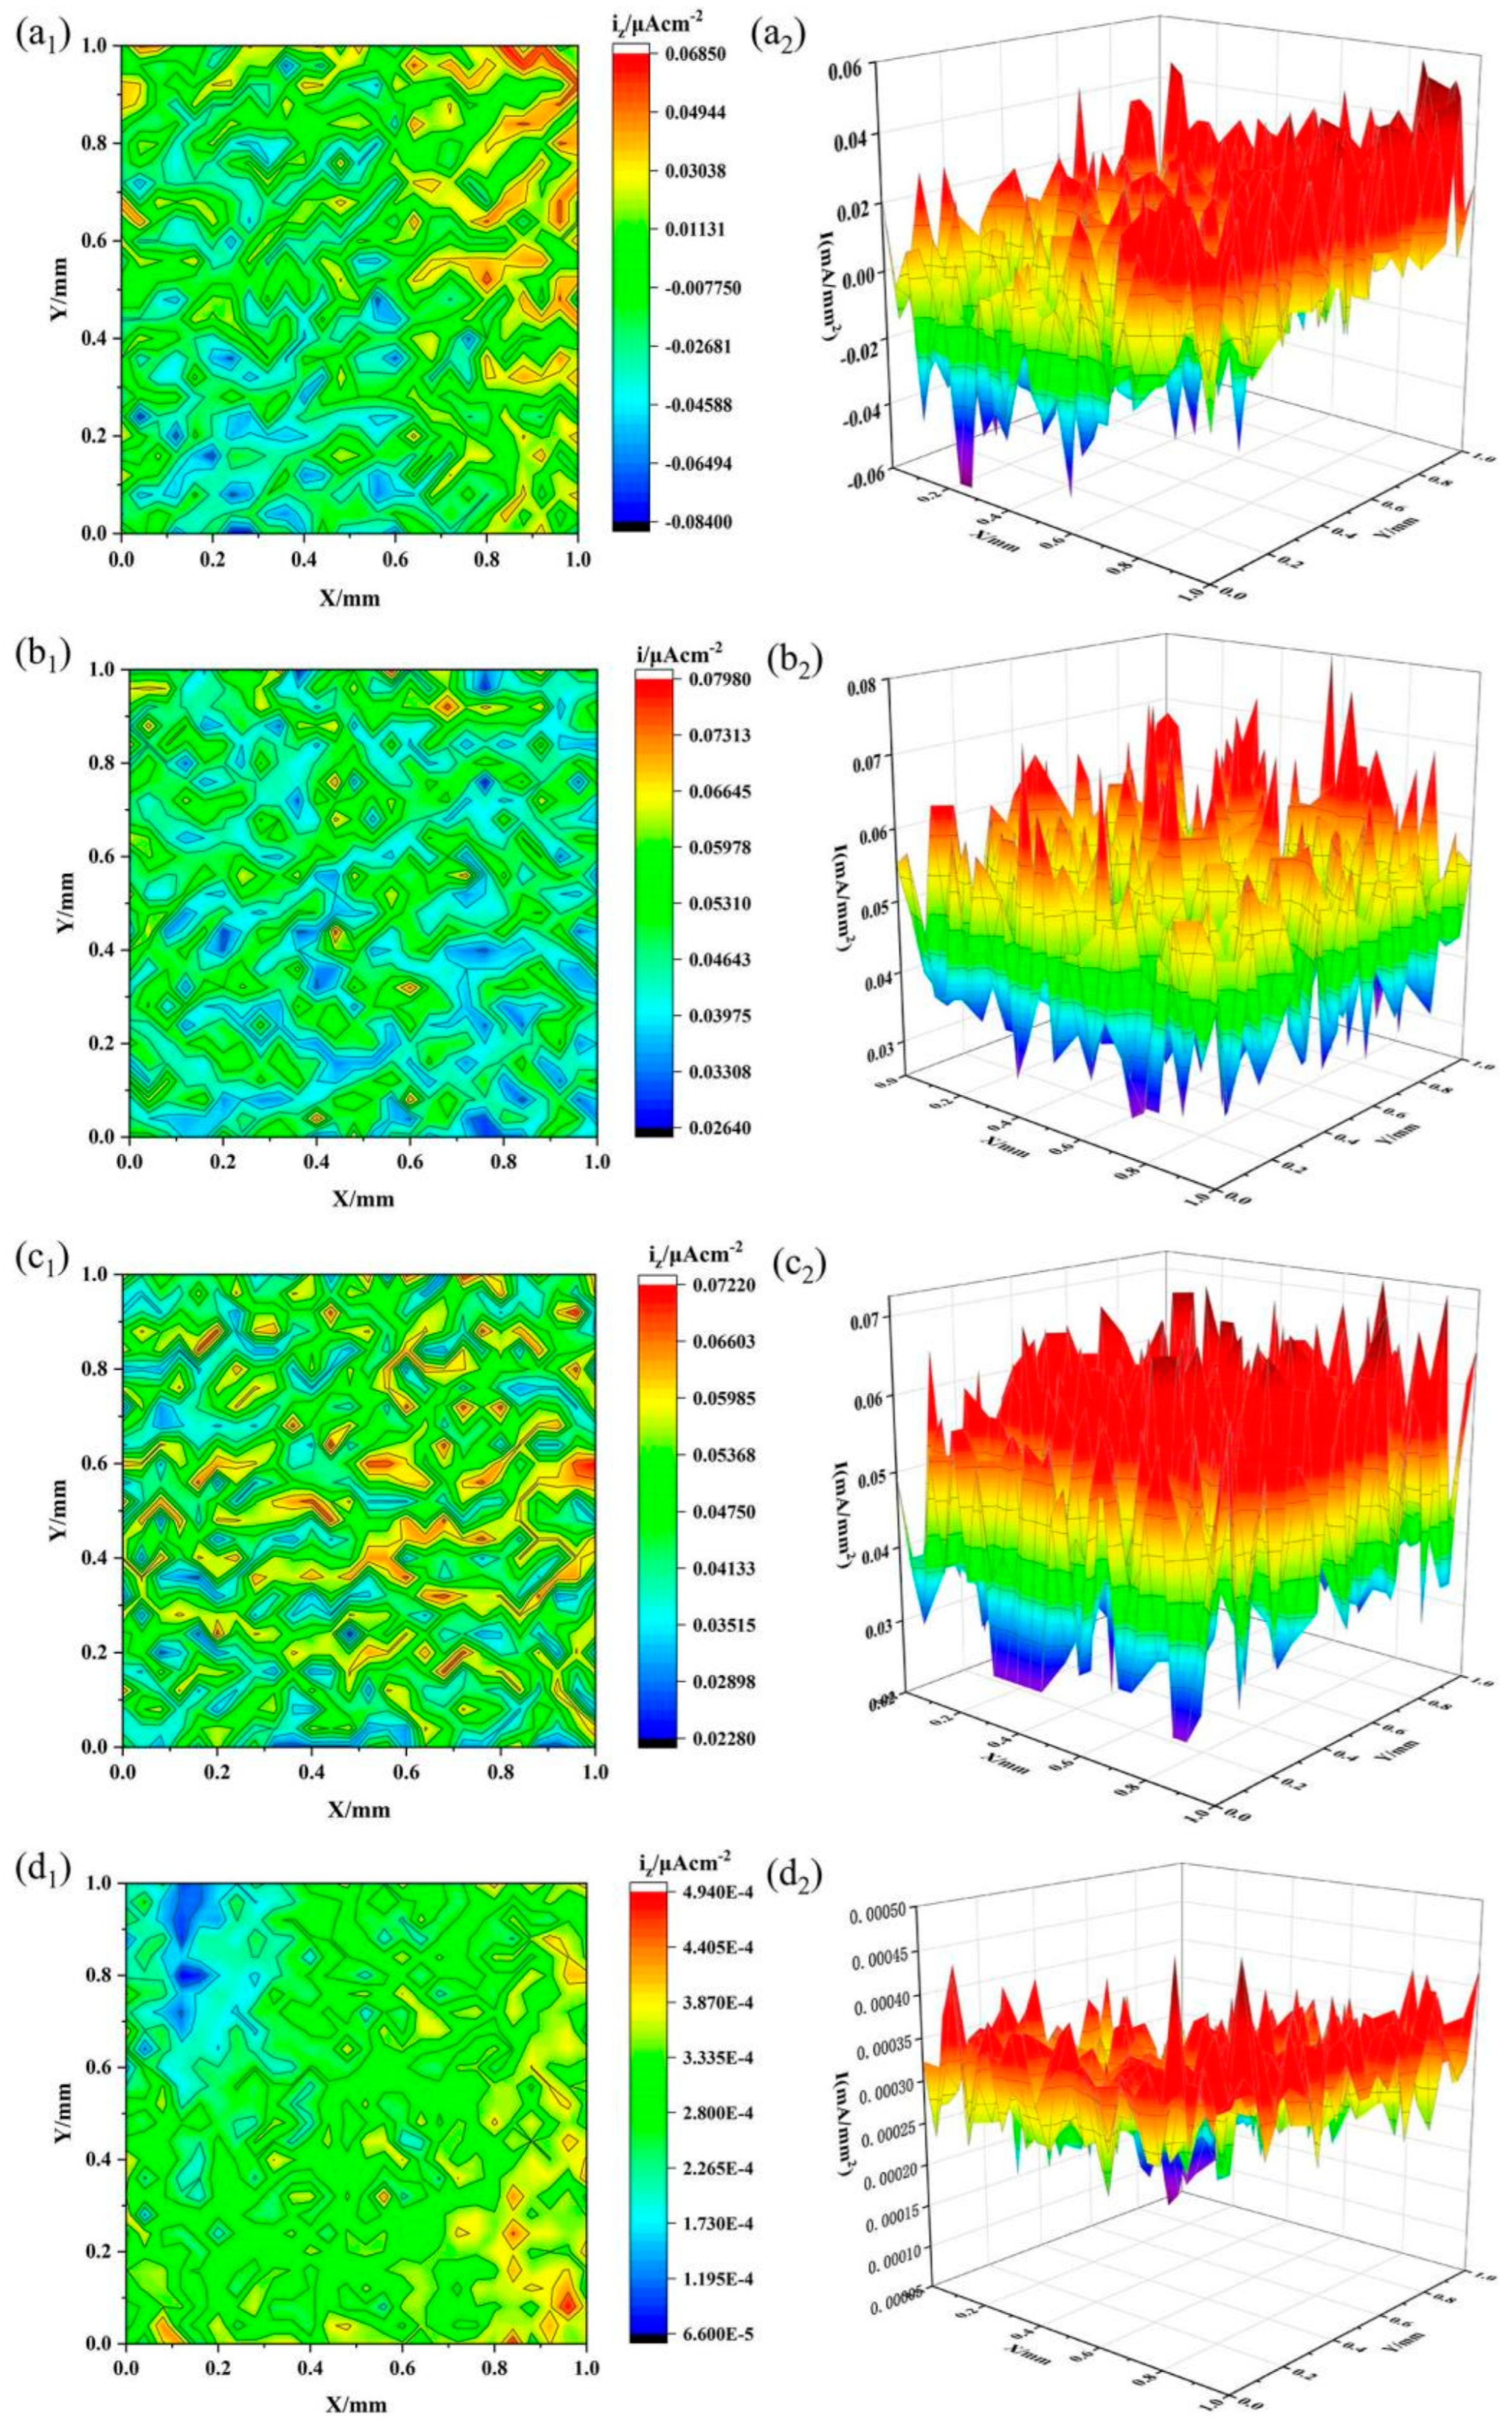
3.6. Corrosion Resistance Mechanism Analysis

To further confirm the corrosion mechanism of the joints, the compositions of the passivated films on the surface of the joints were analyzed by XPS. Figure 11 shows the XPS elemental spectra of the passivated films on the surface of the joint without ultrasonic vibration and with an ultrasonic amplitude of 8.0 μm. As shown in Figure 11, regardless of whether ultrasonic vibration was applied, the elemental composition of the passivation film did not change. The elements with strong signal peaks were mainly C, O, Fe, Al, and Si, which indicated that the main components of the passivation film were oxides of Fe, Al, and Si. The C element was used to check other peaks, and all XPS data were rectified based on a C1s bonding energy of 284.8 eV.
Figure 12, Figure 13 and Figure 14 show the fitting results of the Fe2p, Al2p, and Si2p peaks for the passivation film on the surface of the joint without ultrasonic vibration and with an ultrasound amplitude of 8.0 μm, respectively. It can be seen from Figure 12 that the Fe2p peak consisted of two peaks: Fe2+ and Fe3+. Therefore, the main oxides in the passivation film were FeO and Fe2O3. When ultrasonic vibration was not applied (see Figure 12a), the Fe2+ (710.67 eV) content was higher, and the Fe3+ (713.12 eV) content was lower in the passivation film. When the ultrasonic amplitude was 8.0 μm (see Figure 12b), the Fe3+ (713.55 eV) content in the passivation film increased. Usually, the corrosion rate of the joint accelerates, and its corrosion resistance decreases as Fe3+ is reduced to Fe2+ in the passivation film. This indicates that ultrasonic vibration inhibited the transformation of Fe3+ to Fe2+ in the electrochemical corrosion process, thereby improving the corrosion resistance of the joint.
Figure 13 shows that Al2p is composed of two Al3+ ions in the passivation film. It can be seen from Figure 13a that there are two peaks of Al3+2p3/2 (74.23 eV) and Al3+2p1/2 (74.91 eV) in the Al2p orbitals of the joint without ultrasound vibration. Figure 13b shows that the Al2p orbital has two peaks of Al3+2p3/2 (73.72 eV) and Al3+2p1/2 (74.29 eV) when the ultrasonic amplitude was 8.0 μm. Based on the O1s peak and XPS database, the main component of the oxide film was Al2O3.
From Figure 14, the Si2p spectrum consists of three peaks in the passivated film. The main peaks in the Si2p orbitals of the passivation film without ultrasound vibration were Si4+ (101.90 eV), SiOx (99.85 eV), and the simple substance Si (98.66 eV), as shown in Figure. The main peaks in the Si2p orbitals with an ultrasound amplitude of 8.0 μm were Si4+ (101.90 eV), SiOx (100.06 eV), and the simple substance Si (98.53 eV), as shown in Figure 14b. Comparing Figure 14a with Figure 14b, the application of ultrasonic vibration reduced the peak area and peak intensity of the simple substance Si but increased the peak area of SiOx, which suggested that ultrasonic vibration promoted the reaction among Si, Fe, and Al. Thus, the Fe-Al-Si compounds replace the Fe-Al compounds at the interface of the joints.
The scanning vibration electrode testing (SVET) technology was used to analyze the local solution potential gradient on the surface of the joint without ultrasound after soaking for 0–4 h; the result is shown in Figure 15. The dimension of the sample was 1 mm × 1 mm. The figure on the left is a scanned two-dimensional plan view, which reflects the gradient distribution of current density in different areas of the joint in a 3.5 wt. % NaCl solution. The figure on the right is a three-dimensional diagram, where the red part represents the anode region of the positive current and the blue part represents the cathode region of the negative current. As shown in the figure, the values of the micro-cathode and micro-anode on the joint fluctuated with increasing soaking time because of general corrosion on the surface of the metal in the activated state.
When the soaking time was 0 h, the initial stage of corrosion is shown in Figure 15(a1,a2), and the anode current peak was small. Because pitting corrosion appeared on the surface of the joint under the erosion of Cl during the initial stage of corrosion, the passivated film formed, but it was thin and uneven, which resulted in uneven current peaks. After soaking for 1 h, as shown in Figure 15(b1,b2), the anode current density in the micro area increased from 0.6850 mA/cm2 to 0.7980 mA/cm2 and the anode current peak increased. This indicates that a dense and stable passivated film formed on the surface of the joint. When the soaking time was 2 h, the anode current density was 0.7220 mA/cm2, as shown in Figure 15 (c1,c2). It can be concluded that the anode current density changed slightly, and the current peak in the micro area of the joint was relatively uniform. This indicates that the corrosion rate in the micro area was constant at this time, and the joint was in a stable corrosion state. When the soaking time was 4 h, as shown in Figure 15(d1,d2), the anode current density decreased rapidly to 4.940 × 10⁻⁴ mA/cm2. Due to the prolonged soaking time, a stable passivation film formed on the surface of the joint, which inhibited further corrosion.
Figure 16 shows the measurement images of the joint with an ultrasonic amplitude of 8.0 μm measured by SVET under different soaking times. When the soaking time was 0 h, compared with the non-ultrasonic joint sample, the anode current density in the micro area of the joint decreased from 0.6850 mA/cm2 (see Figure 15(a1,a2)) to 0.6460 mA/cm2 (see Figure 16(a1,a2)). This indicates that the initial corrosion resistance of the joint was improved after the application of ultrasonic vibration. When the soaking time increased from 1 h to 4 h (as shown in Figure 16(c1,c2) and Figure 16(d1,d2)), the anode current density in the micro area changed little. After adding ultrasonic vibration, there was a stirring effect on the weld seam; thus, the microstructure was refined, and the elemental distribution was more uniform. The refined and uniform microstructure resulted in a relatively stable corrosion resistance rate of the joint. Therefore, compared with the joint without ultrasonic vibration in Figure 15, the joint with ultrasonic vibration had a slower corrosion rate and better corrosion resistance. On the one hand, it was ascribed to the refinement and homogenization of the microstructure of the joint. On the other hand, a dense oxide film was easily formed on the surface of the joint under the action of ultrasonic vibration, thereby suppressing the corrosion rate of the joint.

4. Conclusions

6061 Al alloy and Q235 steel were joined using laser welding brazing assisted by ultrasonic vibration. The effects of different ultrasonic amplitudes on the macro morphology, microstructure composition, mechanical properties, and corrosion resistance of the joints were studied. The main conclusions are as follows:
  • Applying an ultrasonic vibration into the process of laser welding brazing, the surface tension of the molten pool was reduced, and the fluidity of liquid metal was improved. The weld appearance was optimal with an ultrasonic amplitude of 8 μm.
  • Al alloy/steel laser joints assisted were composed of θ-Fe(Al, Si)3 and τ5-Al7.2Fe1.8Si formed at the interface reaction zone as well as α-Al solid solution and Al-Si eutectic phase generated in the weld seam zone. The addition of ultrasonic vibration did not change the microstructure composition of the joints, but decreased the thickness of the IMC layers and refined the grains of the joints.
  • The microhardness and tensile strength first increased and then decreased with an increase in the ultrasonic amplitude. When the ultrasonic amplitude was 8 μm, both the hardness and tensile strength were maximized as a result of the grain refinement in the weld seam and the thickness reduction of IMCs.
  • The corrosion resistance of the joints was improved by adding ultrasonic vibration. When the ultrasonic amplitude was 8 μm, its corrosion resistance was optimum; this was ascribed to a dense oxide film forming on the surface of the metal under the action of ultrasonic vibration.

Author Contributions

Conceptualization, C.Z. and J.P.; methodology, D.D. and X.W.; validation, C.Z., W.L. and J.P.; writing—original draft preparation: C.Z., X.W. and Y.S.: writing—review and editing, J.P. and Y.S.: supervision, J.P. and W.L.: project administration, Z.W. and C.Z.; funding acquisition, C.Z. All authors have read and agreed to the published version of the manuscript.

Funding

This research was supported by Changzhou Sci & Tech Program (Grant No.CJ20230024), Shanghai Polytechnic University (No.C80ZK230037, No.C80ZK240037, No.C80ZK242003, No.C80ZK242002), Jiangsu University (High-tech Ship) Cooperative Innovation Centre and Institute of Marine Equipment, Jiangsu University of Science and Technology (No.HZ2018008), Jiangsu Province Undergraduate Innovation Project, and Jiangsu Key Laboratory Project of Green Ship Technology (No.2019Z02).

Institutional Review Board Statement

Not applicable.

Informed Consent Statement

Not applicable.

Data Availability Statement

The authors do not have permission to share the data.

Conflicts of Interest

The authors declare that they have no known competing financial interests or personal relationships that could have appeared to influence the work reported in this paper.

References

  1. Taub, A.; De Moor, E.; Luo, A.; Matock, D.K.; Speer, J.G.; Vaidya, U. Materials for automotive lightweighting. Annu. Rev. Mater. Res. 2019, 49, 327–359. [Google Scholar] [CrossRef]
  2. Han, S.; Guang, X.; Li, Z.; Li, Y. Joining processes of CFRP-Al sheets in automobile lightweighting technologies: A review. Polym. Compos. 2022, 43, 8622–8633. [Google Scholar] [CrossRef]
  3. Wan, L.; Huang, Y. Friction stir welding of dissimilar aluminum alloys and steels: A review. Int. J. Adv. Manuf. Technol. 2018, 99, 1781–1811. [Google Scholar] [CrossRef]
  4. Zhang, Y.; Lai, X.; Zhu, P.; Wang, W. Lightweight design of automobile component using high strength steel based on dent resistance. Mater. Des. 2006, 27, 64–68. [Google Scholar] [CrossRef]
  5. Reza-E-Rabby, M.; Ross, K.; Overman, N.R.; Olszta, M.J.; McDonnell, M.; Whalen, S.A. Joining thick section aluminum to steel with suppressed FeAl intermetallic formation via friction stir dovetailing. Scr. Mater. 2018, 148, 63–67. [Google Scholar] [CrossRef]
  6. Matsuda, T.; Hayashi, K.; Iwamoto, C.; Nozawa, T.; Ohata, M.; Hirose, A. Crack initiation and propagation behavior of dissimilar interface with intermetallic compound layer in Al/steel joint using coupled multiscale mechanical testing. Mater. Des. 2023, 235, 112420. [Google Scholar] [CrossRef]
  7. Yang, J.; Oliveira, J.P.; Li, Y.; Tan, C.; Gao, C.; Zhao, Y.; Yu, Z. Laser techniques for dissimilar joining of aluminum alloys to steels: A critical review. J. Mater. Process. Technol. 2022, 301, 117443. [Google Scholar] [CrossRef]
  8. Pardal, G.; Meco, S.; Ganguly, S.; Williams, S.; Prangnell, P. Dissimilar metal laser spot joining of steel to aluminum in conduction mode. Int. J. Adv. Manuf. Technol. 2014, 73, 365–373. [Google Scholar] [CrossRef]
  9. Pardal, G.; Meco, S.; Dunn, A.; Williams, S.; Ganguly, S.; Hand, D.P.; Wlodarczyk, K.L. Laser spot welding of laser textured steel to aluminium. J. Mater. Process. Technol. 2017, 241, 24–35. [Google Scholar] [CrossRef]
  10. Li, H.Y.; Li, L.Q.; Zhang, Z.S.; Meng, X.Y.; Xia, H.B.; Chen, B.; Tan, C.W.; Song, X.G. Dynamic spreading and interfacial reactions during the laser-induced wetting process of aluminum on stainless steel. Appl. Surf. Sci. 2022, 587, 152869. [Google Scholar] [CrossRef]
  11. Xia, H.B.; Tan, C.W.; Tian, R.Y.; Meng, S.H.; Li, L.Q.; Ma, N.S. Influence of shielding gas on microstructure and mechanical properties of laser welded-brazed Al/steel lapped joint. J. Manuf. Process. 2020, 54, 347–358. [Google Scholar] [CrossRef]
  12. Li, L.Q.; Xia, H.B.; Tan, C.W.; Ma, N.S. Effect of groove shape on laser welding-brazing Al to steel. J. Mater. Process. Technol. 2018, 252, 573–581. [Google Scholar] [CrossRef]
  13. Sun, J.H.; Yan, Q.; Li, Z.; Huang, J. Effect of bevel angle on microstructure and mechanical property of Al/steel butt joint using laser welding-brazing method. Mater. Des. 2016, 90, 468–477. [Google Scholar] [CrossRef]
  14. Yu, G.Y.; Chen, S.H.; Li, S.Q.; Huang, J.H.; Yang, J.; Zhao, Z.Y.; Huang, W.H.; Chen, S.J. Microstructures and mechanical property of 5052 aluminum alloy/Q235 steel butt joint achieved by laser beam joining with Sn-Zn filler wire. Opt. Laser Technol. 2021, 139, 106996. [Google Scholar] [CrossRef]
  15. Bouayad, A.; Gerometta, C.; Belkebir, A.; Ambari, A. Kinetic interactions between solid iron and molten aluminum. Mater. Sci. Eng. A 2003, 363, 53–61. [Google Scholar] [CrossRef]
  16. Eskin, G.I. Principles of ultrasonic treatment application for light alloys melts. Adv. Perform. Mater. 1997, 4, 223–232. [Google Scholar] [CrossRef]
  17. Wu, W.H.; Wei, Z.; Hu, H.B.; Wei, B.B. Acoustic field and convection pattern within liquid material during ultrasonic processing. Acta Phys. Sin. 2017, 66, 194303. [Google Scholar]
  18. Chen, Q.H.; Lin, S.B.; Yang, C.L.; Fan, C.L.; Ge, H.L. Effect of ultrasound on heterogeneous nucleation in TIG welding of Al-Li alloy. Acta Metall. Sin. (Engl. Lett.) 2016, 29, 1081–1088. [Google Scholar] [CrossRef]
  19. Chen, C.; Fan, C.L.; Cai, X.Y.; Lin, S.B.; Liu, Z.; Fan, Q.K.; Yang, C.L. Investigation of formation and microstructure of Ti-6Al-4V weld bead during pulse ultrasound assisted TIG welding. J. Manuf. Process. 2019, 46, 241–247. [Google Scholar] [CrossRef]
  20. Hong, K.; Wang, Y.; Zhou, J.; Zhou, C.; Wang, L. Investigation on ultrasonic assisted friction stir welding of aluminum/steel dissimilar alloys. High Temp. Mater. Process. 2021, 40, 45–52. [Google Scholar] [CrossRef]
  21. Liu, T.; Gao, S.; Ye, W.; Shi, L.; Kumar, S.; Qiao, J. Achievement of high-quality joints and regulation of intermetallic compounds in ultrasonic vibration enhanced friction stir lap welding of aluminum/steel. J. Mater. Res. Technol. 2023, 25, 5096–5109. [Google Scholar] [CrossRef]
  22. GB/T 2651-2008; Tensile Test Method on Welded Joints. Ministry of Chemical Industry of the People Republic of China: Beijing, China, 2008.
  23. Zhang, C.; Wu, M.F.; Pu, J.; Shan, Q.; Sun, Y.B.; Wang, S.Q.; Hermann, S.K.U.G. Effect of Cu Coating on Microstructure and Properties of Al/Steel Welding-Brazing Joints Obtained by Cold Metal Transfer (CMT). Coatings 2022, 12, 1123. [Google Scholar] [CrossRef]
  24. Zhang, C.; Wu, M.F.; Pu, J.; Rao, J.W.; Long, W.M.; Shen, Y.X. Effect of Ni Coating on Microstructure and Property of Al Alloy/Steel CMT Welding-Brazing Joints. Coatings 2023, 13, 418. [Google Scholar] [CrossRef]
  25. Liu, H.D.; Pu, J.; Wu, M.F.; Zhang, C.; Rao, J.W.; Long, W.M.; Shen, Y.X. Research on the Microstructure and Properties of Al Alloy/Steel CMT Welding-Brazing Joints with Al-Si Flux-Cored Welding Wires. Coatings 2023, 13, 1590. [Google Scholar] [CrossRef]
  26. Kang, D.H.; Lee, H.W. Study of the correlation between pitting corrosion and the component ratio of the dual phase in duplex stainless steel welds. Corros. Sci. 2013, 74, 396–407. [Google Scholar] [CrossRef]
  27. Long, F.; Chen, G.Q.; Zhou, M.R.; Shi, Q.Y.; Liu, Q. Simultaneous enhancement of mechanical properties and corrosion resistance of as-cast Mg-5Zn via microstructural modification by friction stir processing. J. Magnes. Alloys 2023, 11, 1931–1943. [Google Scholar] [CrossRef]
  28. Yang, Z.; Huang, H.L. Corrosion behavior of ADC12 aluminum alloy welded joint using tungsten inert gas welding in 3.5 wt.% NaCl solution. Mater. Chem. Phys. 2023, 295, 127217. [Google Scholar] [CrossRef]
  29. Long, F.; Liu, Q.; Zhu, Y.X.; Zhou, M.R.; Chen, G.Q.; Shi, Q.Y. Research on regulating corrosion resistance of Mg-5Zn-0.6Zr alloy by friction stir processing. Mater. Rep. 2024, 38, 155–160. [Google Scholar]
  30. Abreu, C.M.; Cristóbal, M.J.; Losada, R.; Nóvoa, X.R.; Pena, G.; Pérez, M.C. The effect of Ni in the electrochemical properties of oxide layers grown on stainless steels. Electrochim. Acta 2006, 51, 2991–3000. [Google Scholar] [CrossRef]
  31. Guiñón-Pina, V.; Igual-Muñoz, A.; García-Antón, J. Influence of pH on the electrochemical behaviour of a duplex stainless steel in highly concentrated LiBr solutions. Corros. Sci. 2011, 53, 575–581. [Google Scholar] [CrossRef]
  32. Jin, T.Y.; Cheng, Y.F. In situ characterization by localized electrochemical impedance spectroscopy of the electrochemical activity of microscopic inclusions in an X100 steel. Corros. Sci. 2011, 53, 850–853. [Google Scholar] [CrossRef]
  33. Fan, Y.M.; Liu, W.; Sun, Z.T.; Chowwanonthapunya, T.; Zhao, Y.G.; Dong, B.J.; Zhang, T.Y.; Banthukul, W. Effect of chloride ion on corrosion resistance of Ni-advanced weathering steel in simulated tropical marine atmosphere. Constr. Build. Mater. 2021, 266, 120937. [Google Scholar] [CrossRef]
  34. Gerengi, H.; Cabrini, M.; Solomon, M.M.; Kaya, E.; Gritti, L.; Yola, M.L. Chemical, Electrochemical, and Surface Morphological Studies of the Corrosion Behavior of the AZ31 Alloy in Simulated Body Fluid: Effect of NaOH and H2O2 Surface Pretreatments on the Corrosion Resistance Property. ACS Omega 2022, 7, 26687–26700. [Google Scholar] [CrossRef] [PubMed]
  35. Long, F.; Liu, Q.; Chen, G.Q.; Zhou, M.R.; Shi, Q.Y. Improved corrosion resistance achieved in a friction stir processed Mg-5Zn-0.3 Ca alloy with fragmented precipitates. Corros. Sci. 2022, 208, 110675. [Google Scholar] [CrossRef]
Figure 1. Schematic diagram of ultrasonic vibration-assisted laser welding brazing system.
Coatings 14 01219 g001
Figure 2. Macro morphology and cross-section morphology of joints under different ultrasonic amplitudes: (a) without ultrasonic vibration; (b) ultrasound amplitude of 4.8 μm; (c) ultrasound amplitude of 8.0 μm; (d) ultrasound amplitude of 11.2 μm.
Coatings 14 01219 g002
Figure 3. Microstructure morphology of Al alloy/steel laser welding-brazing joints: (a) interface reaction zone at the steel side; (b) weld seam zone; (c) fusion zone at the Al alloy side.
Coatings 14 01219 g003
Figure 4. SEM images and EDS line scanning results of interface reaction zone at the steel side under different ultrasonic amplitudes: (a1,a2) without ultrasonic vibration; (b1,b2) ultrasound amplitude of 4.8 μm; (c1,c2) ultrasound amplitude of 8.0 μm; (d1,d2) ultrasound amplitude of 11.2 μm.
Coatings 14 01219 g004
Figure 5. Microstructure morphology of weld seam under different ultrasonic amplitudes: (a) without ultrasonic vibration; (b) ultrasound amplitude of 4.8 μm; (c) ultrasound amplitude of 8.0 μm; (d) ultrasound amplitude of 11.2 μm.
Coatings 14 01219 g005
Figure 6. Hardness distribution of welding-brazing joints under different ultrasonic amplitudes.
Coatings 14 01219 g006
Figure 7. Tensile strength of joints under different ultrasonic amplitudes.
Coatings 14 01219 g007
Figure 8. Fracture position and fracture morphology of the joint under different ultrasonic amplitudes: (a1,a2) 0 μm; (b1,b2) 4.8 μm; (c1,c2) 8.0 μm; (d1,d2) 11.2 μm.
Coatings 14 01219 g008
Figure 9. Polarization curves of joints under different ultrasonic amplitudes.
Coatings 14 01219 g009
Figure 10. The EIS diagram of joints under different ultrasonic amplitudes: (a) Nyquist diagram; (b) Phase angle-frequency Bode diagram; (c) Mode-frequency Bode diagram; (d) Fitting circuit diagram.
Coatings 14 01219 g010
Figure 11. XPS spectra of passivated films on the surface of joints: (a) without ultrasonic vibration; (b) with the ultrasound amplitude of 8.0 μm.
Coatings 14 01219 g011
Figure 12. Fe element XPS fine spectrum in the passivation film: (a) without ultrasonic vibration; (b) with the ultrasound amplitude of 8.0 μm.
Coatings 14 01219 g012
Figure 13. Al element XPS fine spectrum in the passivation film: (a) without ultrasonic vibration; (b) with the ultrasound amplitude of 8.0 μm.
Coatings 14 01219 g013
Figure 14. Si element XPS fine spectrum in the passivation film: (a) without ultrasonic vibration; (b) with the ultrasound amplitude of 8.0 μm.
Coatings 14 01219 g014
Figure 15. The measurement images of Al alloy/steel joints without ultrasonic vibration during corrosion by SVET: (a1,a2) Soak time—0 h; (b1,b2) Soak time—1h; (c1,c2) Soak time—2 h; (d1,d2) Soak time—4 h.
Coatings 14 01219 g015
Figure 16. The measurement images of Al alloy/steel joints with the ultrasonic amplitude of 8.0 μm during corrosion by Scanning vibrating electrode technique (SVET): (a1,a2) Soak time—0 h; (b1,b2) Soak time—1 h; (c1,c2) Soak time—2 h; (d1,d2) Soak time—4 h.
Coatings 14 01219 g016
Table 1. Chemical compositions of the base metals and AlSi12 flux-cored welding wire.
MaterialsElements (wt. %)
6061Al AlloyAlSiFeMnMgCuZn
Bal.0.80.70.150.80.20.2
Q235 SteelCSiMnSPCrFe
0.20.20.20.030.030.7Bal.
AlSi12 Flux-Cored
Welding Wire
SiCuZnMgMnFeAl
12.150.00570.00480.00020.0750.209Bal.
Table 2. Welding process parameters.
Process ParametersValues
Laser Power3000 W
Wire Feeding Speed3.0 m/min
Welding Speed
Shielding Gas Flow Rate
7 mm/s
15 L/min
Ultrasonic Frequency20.5 kHz
Ultrasonic Amplitude4.8, 8.0, and 11.2 μm
Table 3. Point analysis results in the corresponding region in Figure 4.
UAPoints(at %)Possible Phase
AlSiFe
0 μmP171.568.6219.82θ-Fe(Al, Si)3
P276.525.5617.92τ5-Al7.2Fe1.8Si
P378.565.9818.46τ5-Al7.2Fe1.8Si
4.8 μmP471.878.8019.33θ-Fe(Al, Si)3
P576.075.5418.39τ5-Al7.2Fe1.8Si
P675.965.5818.46τ5-Al7.2Fe1.8Si
8.0 μmP770.728.3220.96θ-Fe(Al, Si)3
P875.985.2618.76τ5-Al7.2Fe1.8Si
P975.825.5618.62τ5-Al7.2Fe1.8Si
11.2 μmP1068.9510.7920.26θ-Fe(Al, Si)3
P1175.395.6818.93τ5-Al7.2Fe1.8Si
P1275.865.8218.32τ5-Al7.2Fe1.8Si
Table 4. Self-corrosion potential and self-corrosion current density of joints under different ultrasonic amplitudes.
Ultrasonic AmplitudeSelf-Corrosion Potential
Ecorr/V
Self-Corrosion Current
Density Icorr/A·cm−2
0 μm−1.12339.3703 × 10−5
4.8 μm−1.10425.9486 × 10−6
8.0 μm−0.96233.9032 × 10−6
11.2 μm−1.06615.2355 × 10−6
Table 5. EIS fitting results of joints under different ultrasonic amplitudes.
Ultrasonic
Amplitude
Rs
(Ω·cm2)
Rct
(Ω·cm2)
CPE1
−1·Sn·cm−2 × 10⁻⁵)
n
0 μm4.81292153.900.81
4.8 μm3.857221648.320.85
8.0 μm4.574324829.340.90
11.2 μm4.236293535.630.82
Disclaimer/Publisher’s Note: The statements, opinions and data contained in all publications are solely those of the individual author(s) and contributor(s) and not of MDPI and/or the editor(s). MDPI and/or the editor(s) disclaim responsibility for any injury to people or property resulting from any ideas, methods, instructions or products referred to in the content.

