Article

Regulation of Microstructure and Mechanical Properties of DC Electrodeposited Copper Foils by Electrolyte Parameters

1
State Key Laboratory of Advanced Processing and Recycling of Nonferrous Metal, Lanzhou University of Technology, Lanzhou 730050, China
2
Gansu Hailiang New Energy Materials Co., Ltd., Lanzhou 730300, China
*
Authors to whom correspondence should be addressed.
Coatings 2025, 15(5), 521; https://doi.org/10.3390/coatings15050521 (registering DOI)
Submission received: 29 March 2025 / Revised: 21 April 2025 / Accepted: 22 April 2025 / Published: 27 April 2025

Abstract

:
Introducing nano-twins into electrolytic copper foil is an effective method to enhance strength and toughness. While pulse electrodeposition enables the easier preparation of high-density nano-twin copper, large-scale industrial production mainly relies on direct current electrodeposition. Therefore, systematically studying the effects of electroplating parameters on the microstructure and mechanical properties of direct current electrodeposited copper foil is crucial. In this paper, we discuss the effects of pH value, CCuSO4, and Jk on the microstructure and mechanical properties of electroplated copper foils at room temperature. The results show that copper foils exhibit stronger (220)Cu preferred orientation on the M surface than on the S surface with changes in pH value, CCuSO4, and Jk. When the pH value is 2.5, the CCuSO4 is between 70 and 90 g/L, and the Jk is within the range of 70–90 mA/cm2, the prepared copper foil has better compactness and no obvious pinhole-like defects. Particularly, the copper foil electroplated with a pH value of 2.5, a CCuSO4 of 80 g/L, and a Jk of 80 mA/cm2 consists of equiaxed and columnar grains, featuring small grain size, uniform distribution, and a dense structure, resulting in excellent mechanical properties.

1. Introduction

Electrolytic copper foil serves as the core material for the negative current collector in lithium-ion power batteries, primarily functioning to support the battery’s negative active materials and facilitate electron transfer. Its mechanical properties and surface characteristics play a decisive role in the safety and practical performance of power batteries [1,2]. As electronic devices continue to evolve through upgrades and replacements, the market has imposed increasingly stringent requirements on the quality and performance of electrolytic copper foil. At present, the development of copper foil with high strength, high toughness, and precisely controlled thickness and surface roughness is crucial for fulfilling the demands of its diverse application environments [3,4,5].
According to the existing literature reports, nano-twinned copper (NT-Cu) has attracted much attention in the fields of structural materials and electronic materials due to its excellent mechanical properties and electrical conductivity. For example, Lu et al. [5] successfully prepared nano-twinned copper materials through pulsed electrodeposition technology. This material exhibits ultra-high strength, high elongation, and excellent electrical conductivity. It was found that, as the average twin lamella thickness decreased from 96 nm to 15 nm, the tensile strength increased significantly, from 550 MPa to 1068 MPa, while maintaining an elongation of 13.5%; Zhan et al. [6] successfully prepared anisotropic nano-twinned copper (nt-Cu) with a high (111) texture by applying an external pulsed current and adopting a strategy without additives. Its microstructure consists of columnar grains and parallelly arranged nano-twin lamellae, among which the twin thickness ranges from 85 nm to 270 nm, and the grains show a distinct (111) preferred orientation; Cheng et al. [7] systematically investigated the influence of electrolyte temperature on the thickness of nano-twin lamellae in copper foil. The results showed that, when the electrolyte temperature decreased from 20 °C to 0 °C, the thickness of the nano-twin lamellae significantly decreased from 21.8 nm to 16.6 nm. It can be seen that the adoption of pulsed current can form high-density nano-twins more conveniently. The main reason lies in that nano-twin copper is generated under the drive of internal stress, and pulsed current can significantly increase the internal stress, thereby promoting the formation of nano-twins. However, compared with direct current deposition, the production efficiency of pulsed current deposition is lower. Therefore, in actual copper foil production, the direct current deposition method is usually preferred.
Jin et al. [8] also showed that, although the pulsed power supply has more advantages in generating nano-twinned copper, nano-twinned copper can also be prepared under the condition of direct current deposition by reasonably adjusting the experimental parameters. In the process of direct current deposition, although the current density is low, with the extension of the deposition time, a large internal stress will gradually accumulate inside the sample. At present, a large number of literature sources have reported research on preparing nano-twinned copper by regulating the deposition parameters. For example, Lu’s research team [9,10,11] successfully prepared nano-twinned copper (nt-Cu) with isotropy by using both external direct current and pulsed current forms under the electrolyte condition of high copper ion concentration and low acid value. Its microstructure is mainly characterized by the combination of columnar crystals and parallel nano-twin lamellae, or the combination of equiaxed crystals and randomly oriented nano-twin lamellae. However, Chen’s research team [12,13,14,15,16] also successfully prepared nano-twinned copper by reducing the copper ion concentration and pH value, applying a large current density and vigorously stirring the electrolyte under the condition of only applying an external direct current power supply. This material shows strong anisotropy and large internal stress, and the microstructure is the combination of equiaxed crystals and randomly oriented nano-twin lamellae. In addition, Liu et al. [17,18] prepared nt-Cu with the combination of columnar crystals and parallel nano-twin lamellae by applying a direct current power supply in the electrolyte with high copper ion concentration and high pH value. Wen et al. [19] further pointed out that the increase in current density during the electrodeposition process reduced the grain size on the surface of the copper film, significantly decreased the length and size of columnar grains in the cross-section, and slightly reduced the thickness of the twin lamellae.
It can be inferred from the aforementioned literature that the fundamental parameters of the electrolyte (e.g., temperature, pH value, CuSO4 concentration (CCuSO4), current density (Jk), etc.) are critical factors in regulating the structure and properties of copper foil. Consequently, systematically investigating the influence of these parameters on the structure and properties of direct current electroplated copper foil holds significant importance. Nevertheless, during the actual copper foil preparation process, the electrolyte often contains additional additives, which also considerably affect the final structure and properties of the copper foil. For instance, Huang et al. [20] discovered that, when methylene blue was employed as an additive for direct current deposition, increasing its concentration effectively reduced the surface roughness of the copper film and decreased the twin crystal density, thereby leading to a reduction in material strength. Meanwhile, Liu et al. [21] selected Bis-(3-sulfopropyl)-disulfide (SPS) as an additive and examined the impact of its concentration on the surface roughness and tensile strength of the electroplated copper foil. Their findings indicated that adding 1.5 mg/L of SPS enabled the preparation of copper foil with the smoothest surface (Rz = 2.1 μm) and the highest tensile strength (approximately 338 MPa). Therefore, to comprehensively elucidate the influence laws of the basic parameters of the electrolyte on direct-current-deposited copper foil, comparative analysis must be conducted under conditions where all other variables remain entirely consistent.
Therefore, in the present paper, under the condition that all other additives were the same, the effects of pH value, CCuSO4, and Jk on the microstructure and mechanical properties of copper foil during electroplating at room temperature are discussed in detail, and the formation mechanism of the micro–nano-structure of electrolytic copper foil and its mechanism of action on mechanical properties are also discussed.

2. Materials and Methods

2.1. Sample Preparation

Pure titanium and pure copper plates were employed as the cathode and anode, respectively, with a working area of 40 × 40 mm2 for the cathode. The preparation process for the copper foil is described below. Initially, 200 mL of pre-configured electrolyte was injected into the electrolytic cell, followed by the placement of a magnetic stirrer. Subsequently, the electrolytic cell was placed in a constant-temperature water bath equipped with a magnetic stirrer and digital temperature display, and the temperature was set to 23 °C. Thereafter, the surface-treated cathode and anode were inserted into the electrolytic cell and connected to the power supply. After setting the process parameters, the direct current (DC) power supply was activated, and the timing commenced (15 min). Upon the completion of the experiment, the power supply was turned off, and the titanium cathode plate was removed and briefly soaked in deionized water for 5 s to facilitate the removal of the copper foil. The side of the copper foil that adhered to the titanium plate is referred to as the shiny side (S side), while the side exposed to the electrolyte is designated as the matte side (M side). Table 1 lists the parameters and additive contents of the electrolyte used for direct-current-electroplated copper foil, including pH value, CCuSO4, Jk, the concentration of Cl (CCl−), etc.

2.2. Characterization of Structure and Properties

The cross-sectional morphologies of the copper foils were characterized using a QUANTA-FEG-450 field emission scanning electron microscope (SEM, FEIC, Hillsboro, OH, USA). Phase analysis was performed using a D8 ADVANCE X-ray diffractometer (XRD, Bruker Corporation, Karlsruhe, Germany). The microstructure, including grain size, grain orientation, local orientation difference, and twin distribution, was analyzed using a Zeiss Gemini300 SEM (Carl Zeiss AG, Oberkochen, Germany) equipped with electron backscatter diffraction (EBSD) capabilities. EBSD samples were prepared by argon ion thinning using an IM 4000 plus instrument (Hitachi High-Tech Corporation, Tokyo, Japan) at a voltage of 4 kV and a scanning angle of 3°. EBSD data were collected at an accelerating voltage of 20 kV and a step size of 0.075 μm. The resulting images and experimental data were processed and analyzed using Channel 5 software. Additional microstructural characterization was conducted using a JEOL JEM-F200 transmission electron microscope (TEM, JEOL Ltd., Tokyo, Japan) operated at 200 kV. Cross-sectional TEM samples were prepared using a Helios G4 PFIB CXe dual-beam electron/ion beam microscope (FEIC, Hillsboro, OH, USA), as illustrated in Figure 1.
The surface roughness of the S and M sides of the copper foil was characterized using a Zeiss LSM800 confocal laser scanning microscope (Carl Zeiss AG, Oberkochen, Germany). Specifically, the arithmetic average roughness (Ra) was employed to quantify the roughness of the S-side, whereas the ten-point average roughness (Rz) was utilized to evaluate the roughness of the M-side. The tensile tests of copper foils were conducted using a T3E-N300-3E tensile testing machine in accordance with Appendix D of the Chinese National Standard GB/T 5230–1995 [22] for electrolytic copper foil. Due to the small dimensions of the samples, the specimens were proportionally downscaled according to national standards during preparation. The specimens were cut into rectangular strips measuring 6 mm in width and 40 mm in length, with a gauge length of 20 mm. Testing was performed at a strain rate of 0.5 mm/min. Three repetitive tests were conducted on the copper foil samples with the same parameters. According to the national standard, the ultimate tensile strength and elongation of the copper foil are calculated as follows.
The formula for calculating the tensile strength (σ, MPa) of copper foil is
σ = F S A
where F (N) denotes the maximum load required to fracture the sample, SA (m2) represents the average cross-sectional area. The formula for SA is
S A = m 8.909 × 1000000 × d
where m (g) denotes the mass of weighing copper foil and d (m) represents the cutting length of the copper foil.
The formula for calculating the elongation δ (%) is
δ = L L × 100 %
where ΔL (cm) is the extension length of the sample at fracture and L (cm) is the gauge length, defined as the distance between the grips.

3. Results

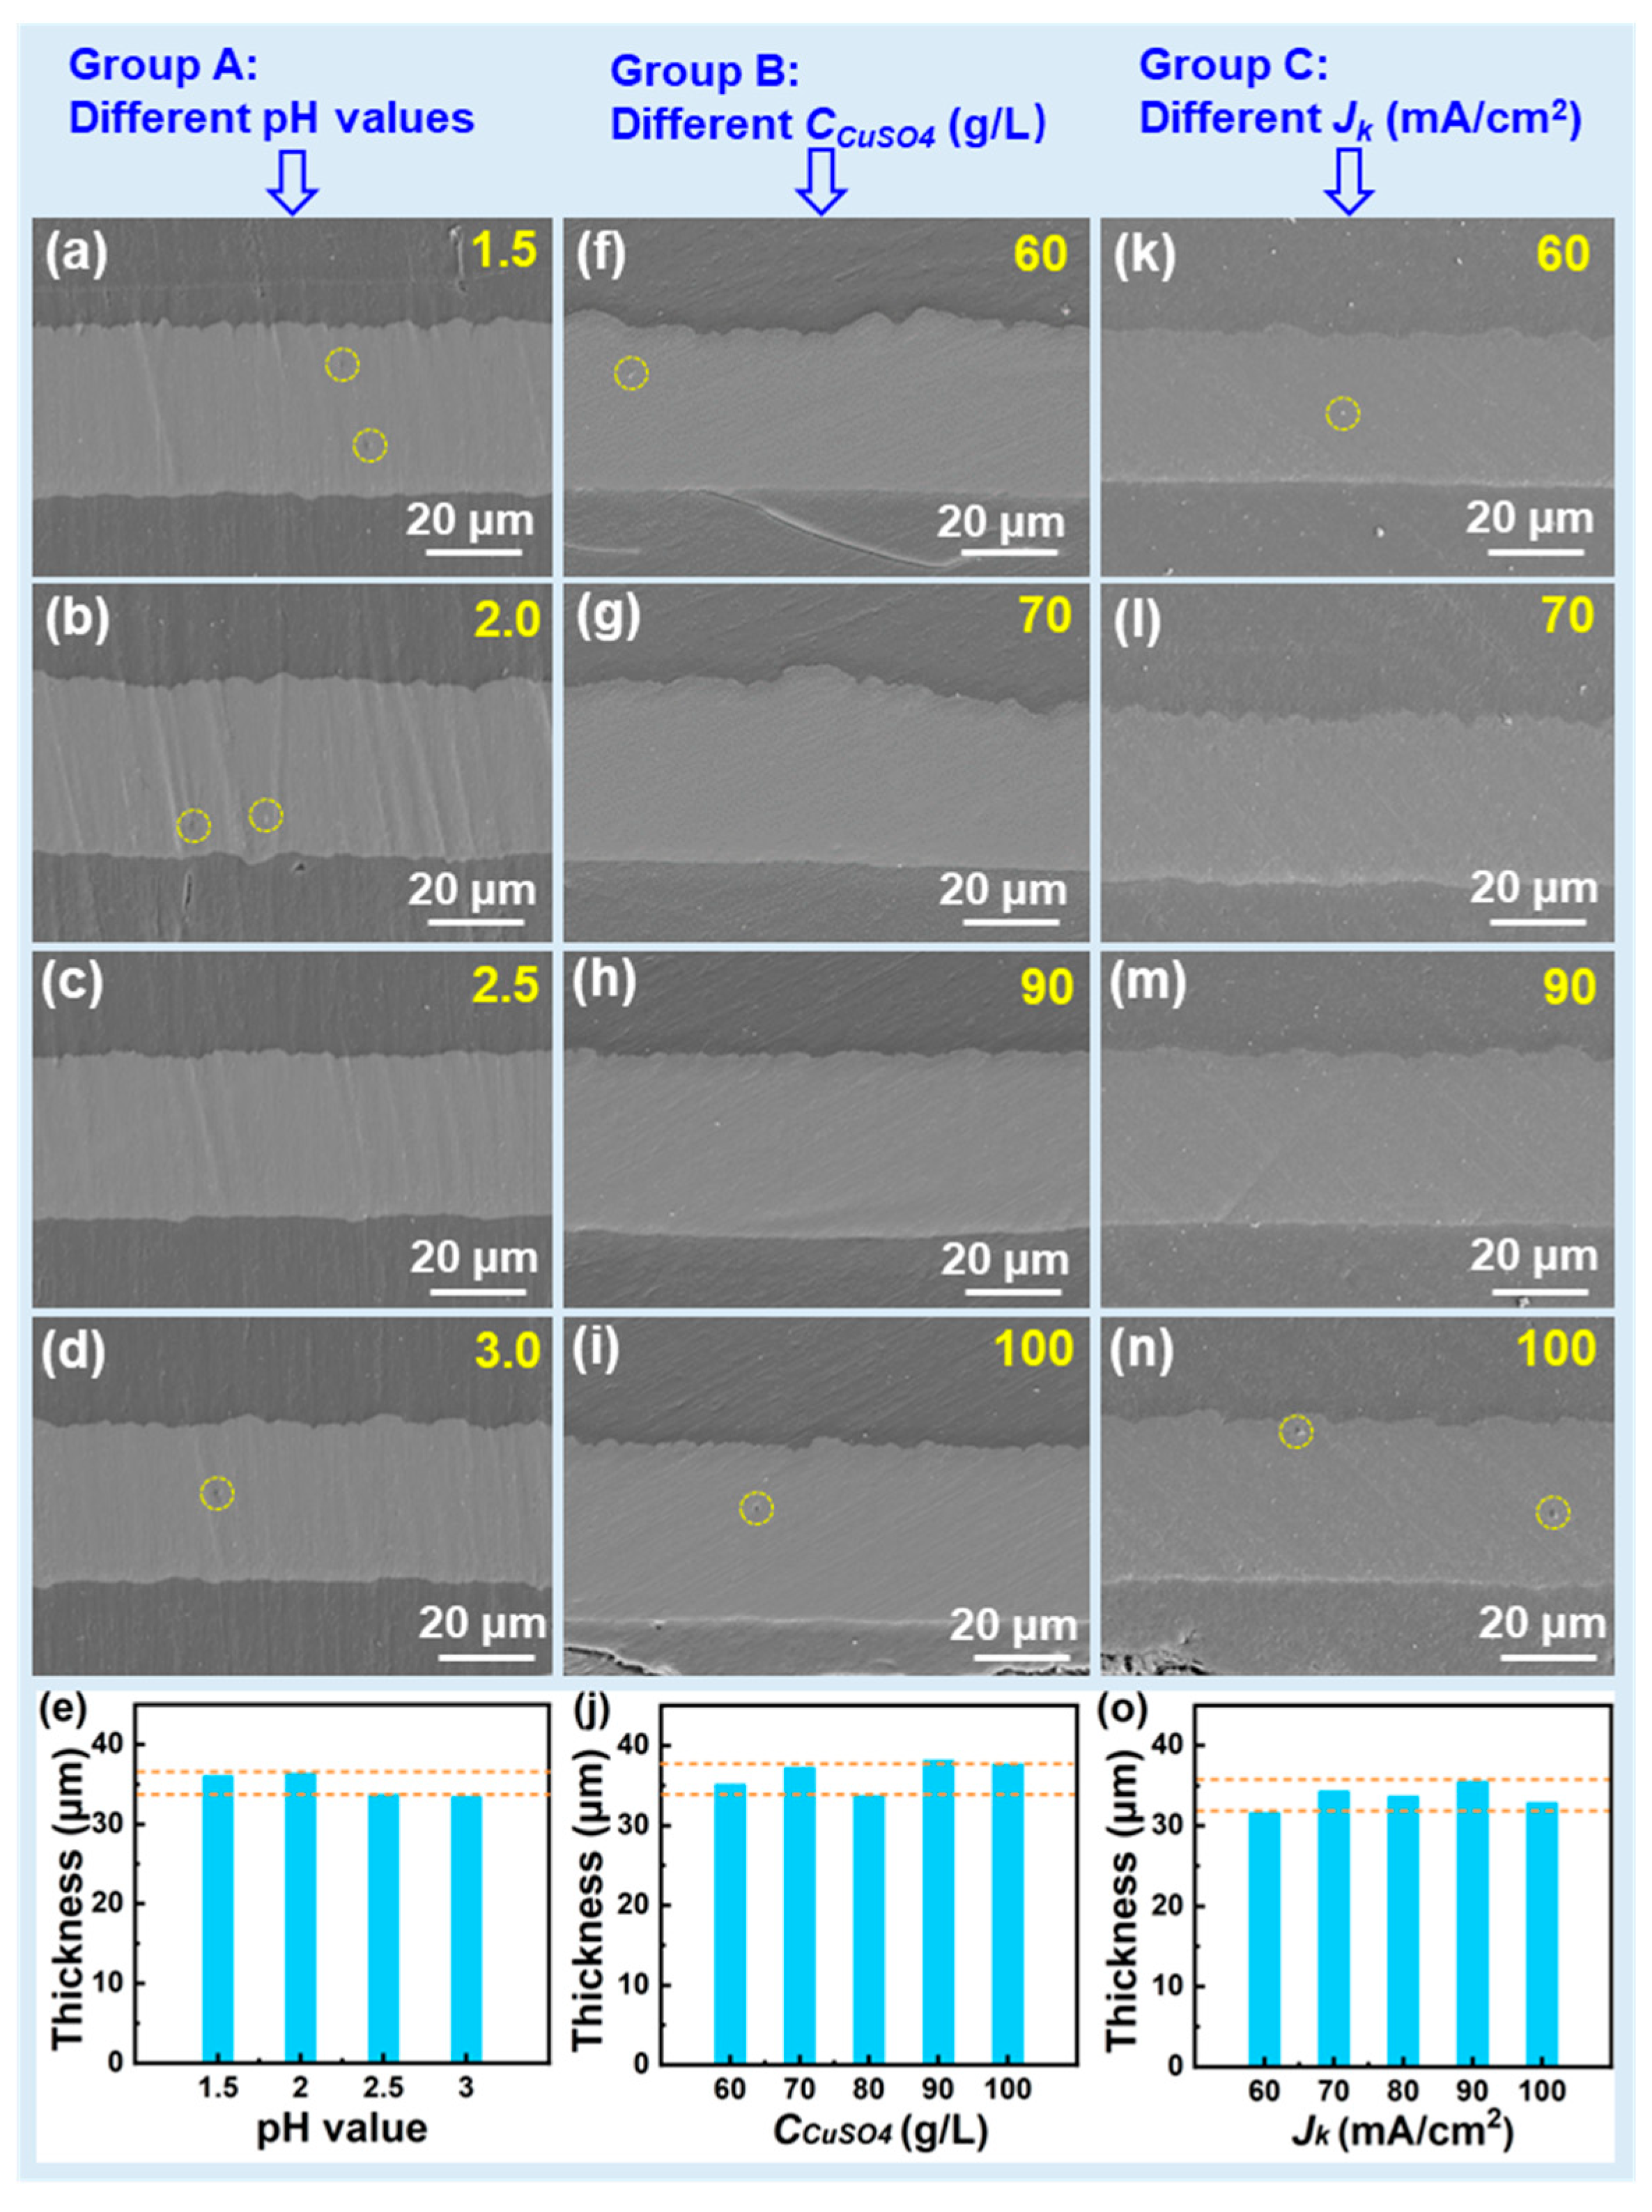
Figure 2 illustrates the cross-sectional SEM morphologies and thickness statistics of the copper foils electroplated under various parameter conditions. From Figure 2a–d, it is evident that, at a pH value of 2.5, no noticeable pores are observed in the cross-section of the copper foil, indicating excellent compactness. In contrast, at pH values of 1.5, 2.0, and 3.0, while the overall structure remains intact, a few pinhole-like defects are present (as indicated by the dotted circles). When the pH value is fixed at 2.5 and the CCuSO4 is varied, pinhole-like defects appear at CCuSO4 of 60 g/L and 100 g/L (Figure 2f–i). A further adjustment of the Jk at a pH value of 2.5 and a CCuSO4 of 80 g/L reveals that pinhole-like defects also occur at current densities of 60 mA/cm2 and 100 mA/cm2 (Figure 2k–n). Therefore, the optimal compactness is achieved when the pH value is 2.5, the CCuSO4 is between 70 and 90 g/L, and the Jk is within 70–90 mA/cm2. Additionally, according to the thickness statistics (Figure 2e,j,o), variations in these three parameters have minimal impact on the thickness of the copper foil, with all samples falling within the range of 31–38 μm. It should be noted that, due to the relatively high surface roughness of some samples, the measurement error for thickness may be significantly larger.
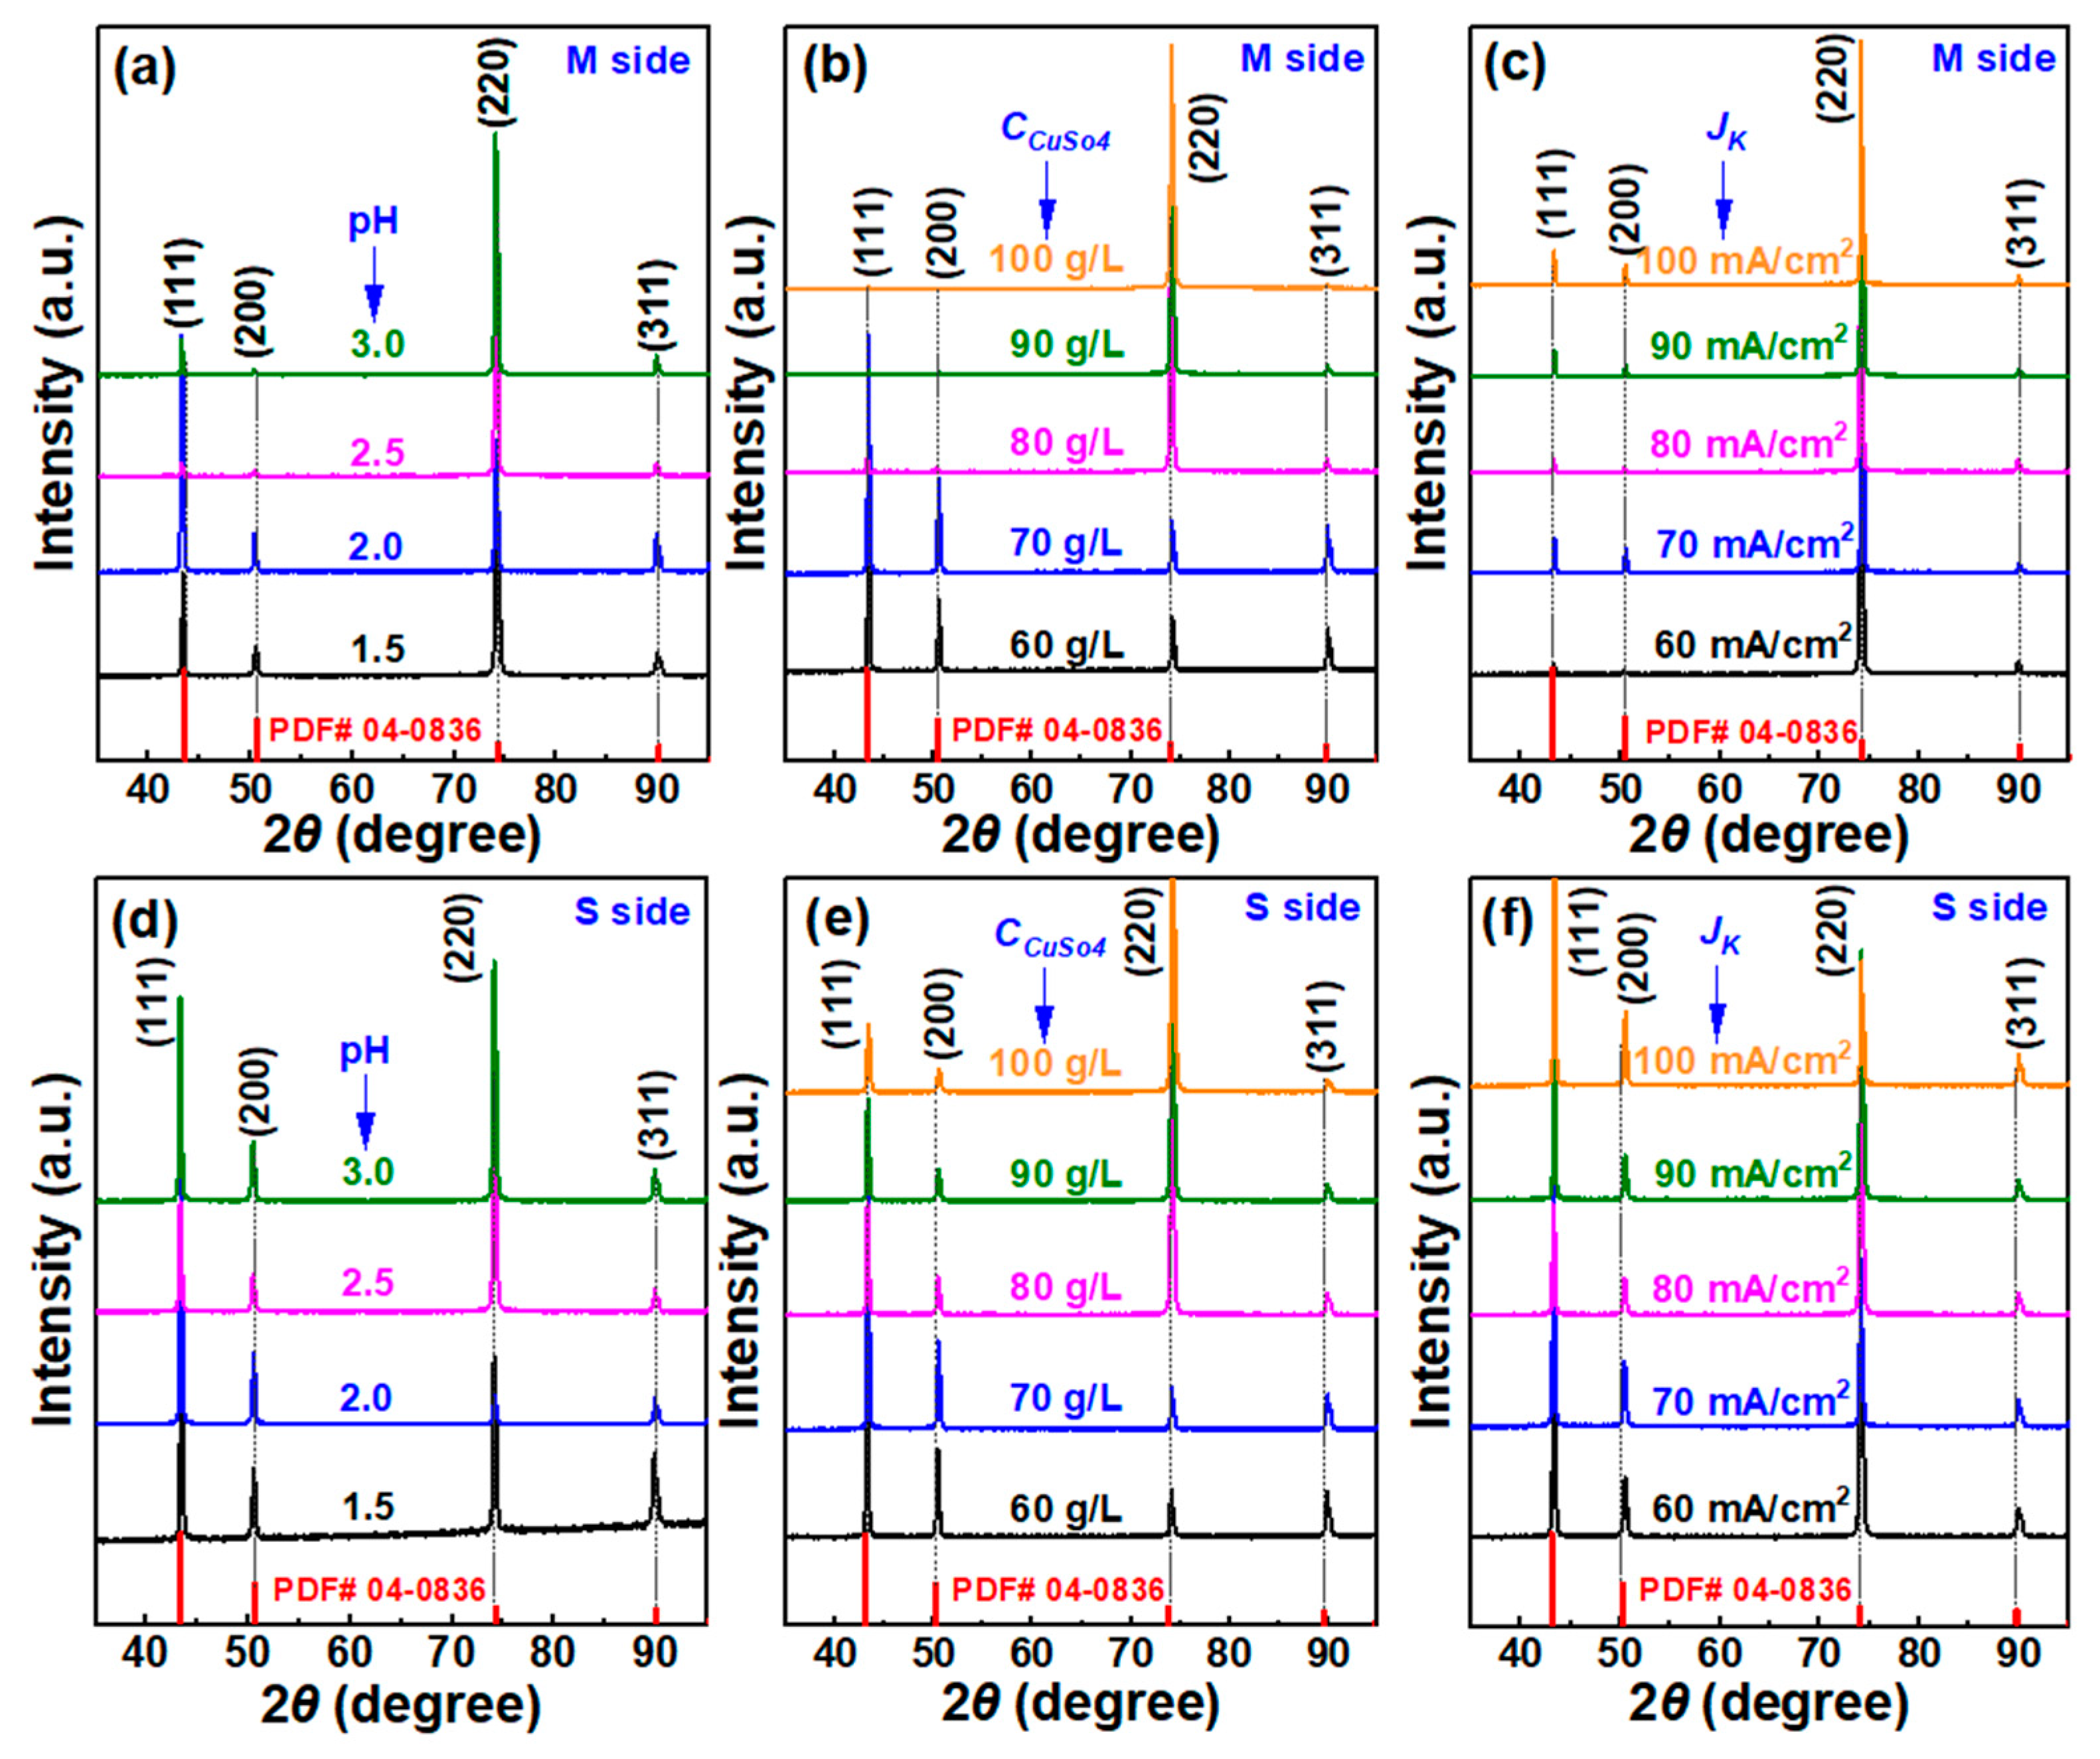
Figure 3 shows the XRD patterns of the M and S sides of electroplated copper foils under different electrolyte parameters. Four diffraction peaks on both sides can be well-indexed to (111)Cu, (200)Cu, Cu(220)Cu, and Cu(311)Cu, but the diffraction peak intensity has changed significantly. The calculation of the texture coefficient (TC(hkl)) is shown in Formula (4) [23]:
T C ( h k l ) = I h k l / I 0 ( h k l ) ( 1 / n ) I ( h k l ) / I 0 ( h k l )
where I(hkl) is the intensity corresponding to the (hkl) diffraction peak, I0(hkl) is the intensity of the (hkl) diffraction peak in the JCPDS (Joint Committee on Powder Diffraction Standards) card, and n is the number of diffraction peaks. For the M sides of the copper foils, when the pH value of the electrolyte is 1.5 and 2.0, the intensities of both the (111)Cu and (220)Cu diffraction peaks increase. As the pH value increases to 2.5 and 3.0, the intensity of the (111)Cu diffraction peak decreases while that of the (220)Cu continues to rise, leading to a more pronounced preferred orientation of the (220)Cu plane. This indicates that, as the pH level increases, the preferred orientation of (220)Cu is gradually enhanced (Figure 3a). Additionally, as the CCuSO4 changes, the intensity of the (111)Cu diffraction peak gradually diminishes, whereas the intensity of the (220)Cu diffraction peak consistently increases, ultimately shifting the preferred orientation from (111)Cu to (220)Cu at a CCuSO4 of 80 g/L (Figure 3b). When the Jk varies, the intensity of the (220)Cu diffraction peak significantly surpasses that of the (111)Cu, demonstrating a strong preferred orientation towards (220)Cu (Figure 3c).
For the S surface of the copper foil, at pH values of 1.5 and 2.2, the intensities of the (111)Cu and (220)Cu diffraction peaks are comparable, with the preferred orientation of the (220)Cu plane being less prominent compared to the M side (Figure 3d). With increasing CCuSO4, the trend in preferred orientation change for the S side mirrors that of the M side (Figure 3e). However, as the Jk increases, the intensity of the (111)Cu diffraction peak rises while that of the (220)Cu gradually decreases, resulting in a markedly weaker preferred orientation of (220)Cu relative to the M side (Figure 3f).
For electroplated copper foil, the different preferred orientations significantly affect the mechanical properties, but this influence does not follow a single rule. For example, the literature [24] indicates that, when the copper foil shows a (220)Cu preferred orientation, it exhibits better tensile properties; while other studies [11,25] show that the copper foil with a (111)Cu preferred orientation shows more excellent mechanical properties. Therefore, in this paper, the preferred orientation of the copper foil is regulated by adjusting the parameters of the electrolyte, and then the specific influence on the mechanical properties of the copper foil is discussed.
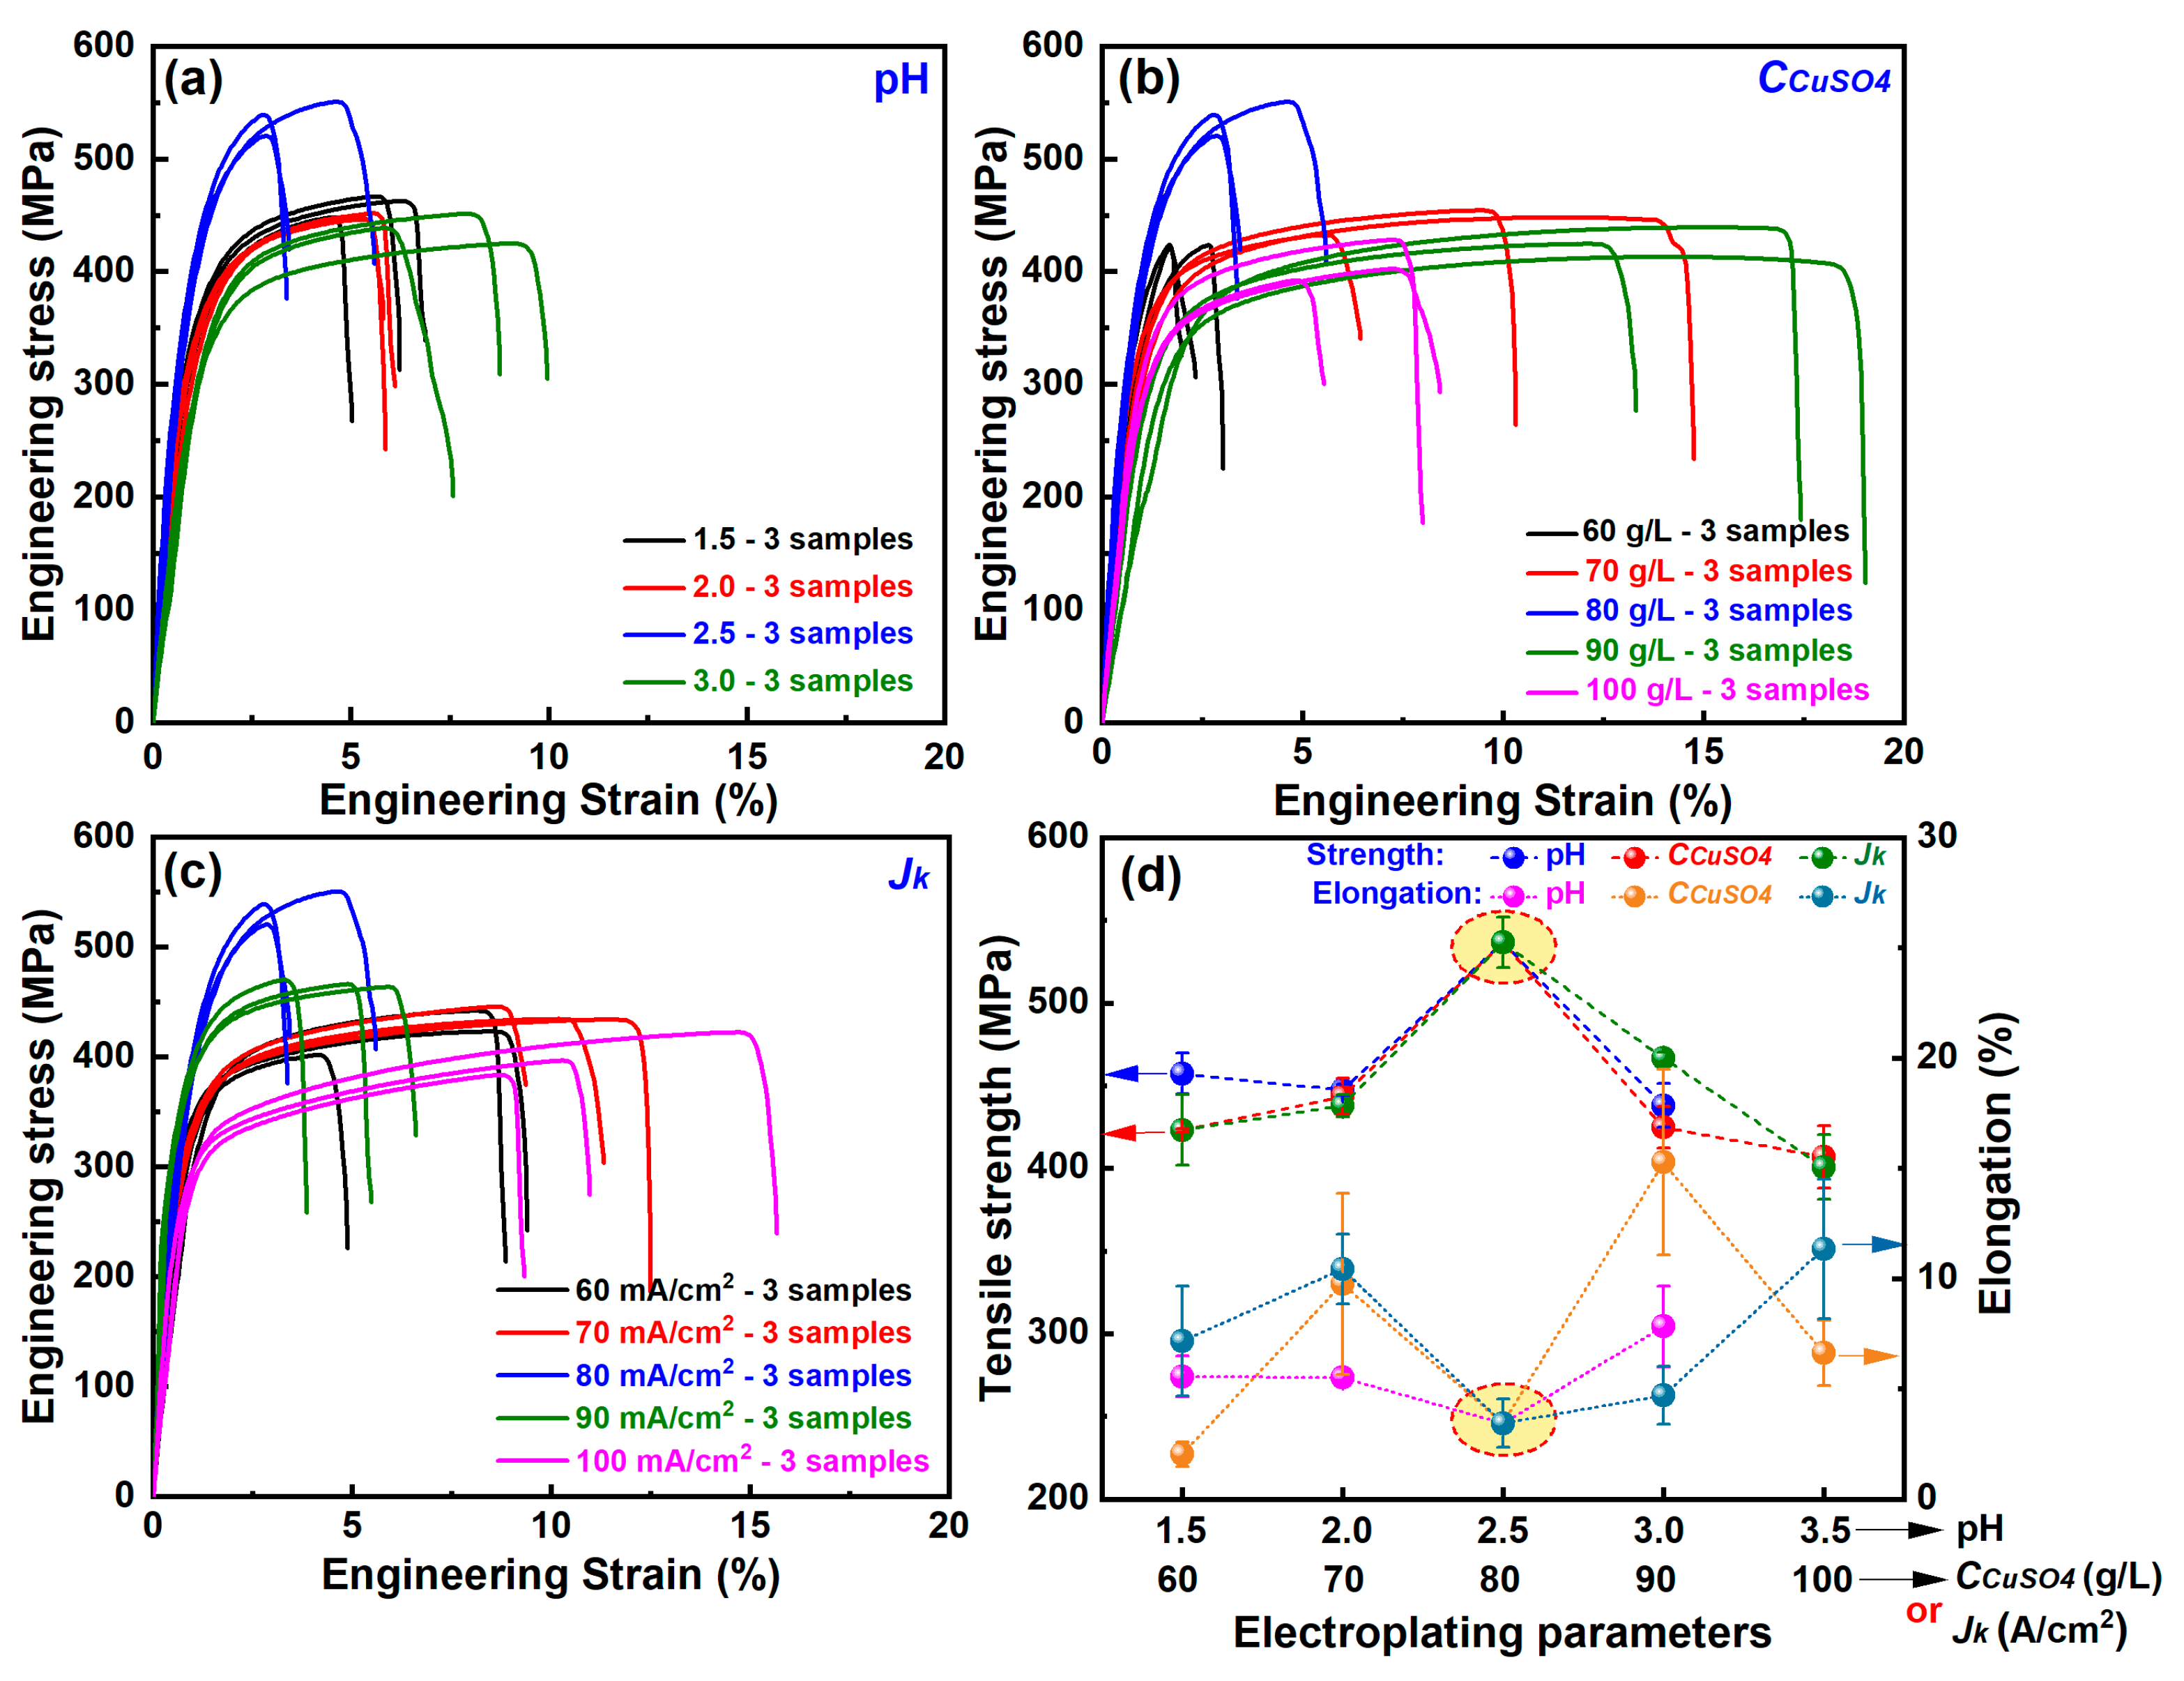
Figure 4a–c illustrates the stress–strain curves of direct-current-electroplated copper foil under varying pH values, CCuSO4, and Jk, respectively. It can be seen from the figure that the repeated curves of electroplated copper foil under the same parameters are relatively close, which indirectly proves the uniformity of the copper foil. Figure 4d presents the tensile strength and elongation of the copper foil prepared under different parameters, along with their respective error ranges. Overall, the tensile strength of the copper foil initially increases and then decreases as the pH value, CCuSO4, and Jk are increased. Specifically, the maximum tensile strength of 547 MPa is achieved at a pH value of 2.5, a CCuSO4 of 80 g/L, and a Jk of 80 mA/cm2, with the corresponding minimum elongation of 6.03%. Notably, the lowest tensile strength and elongation values are observed when the CCuSO4 is 60 g/L. Additionally, suboptimal tensile strength and elongation are also recorded at Jk of 60 mA/cm2 and 100 mA/cm2.
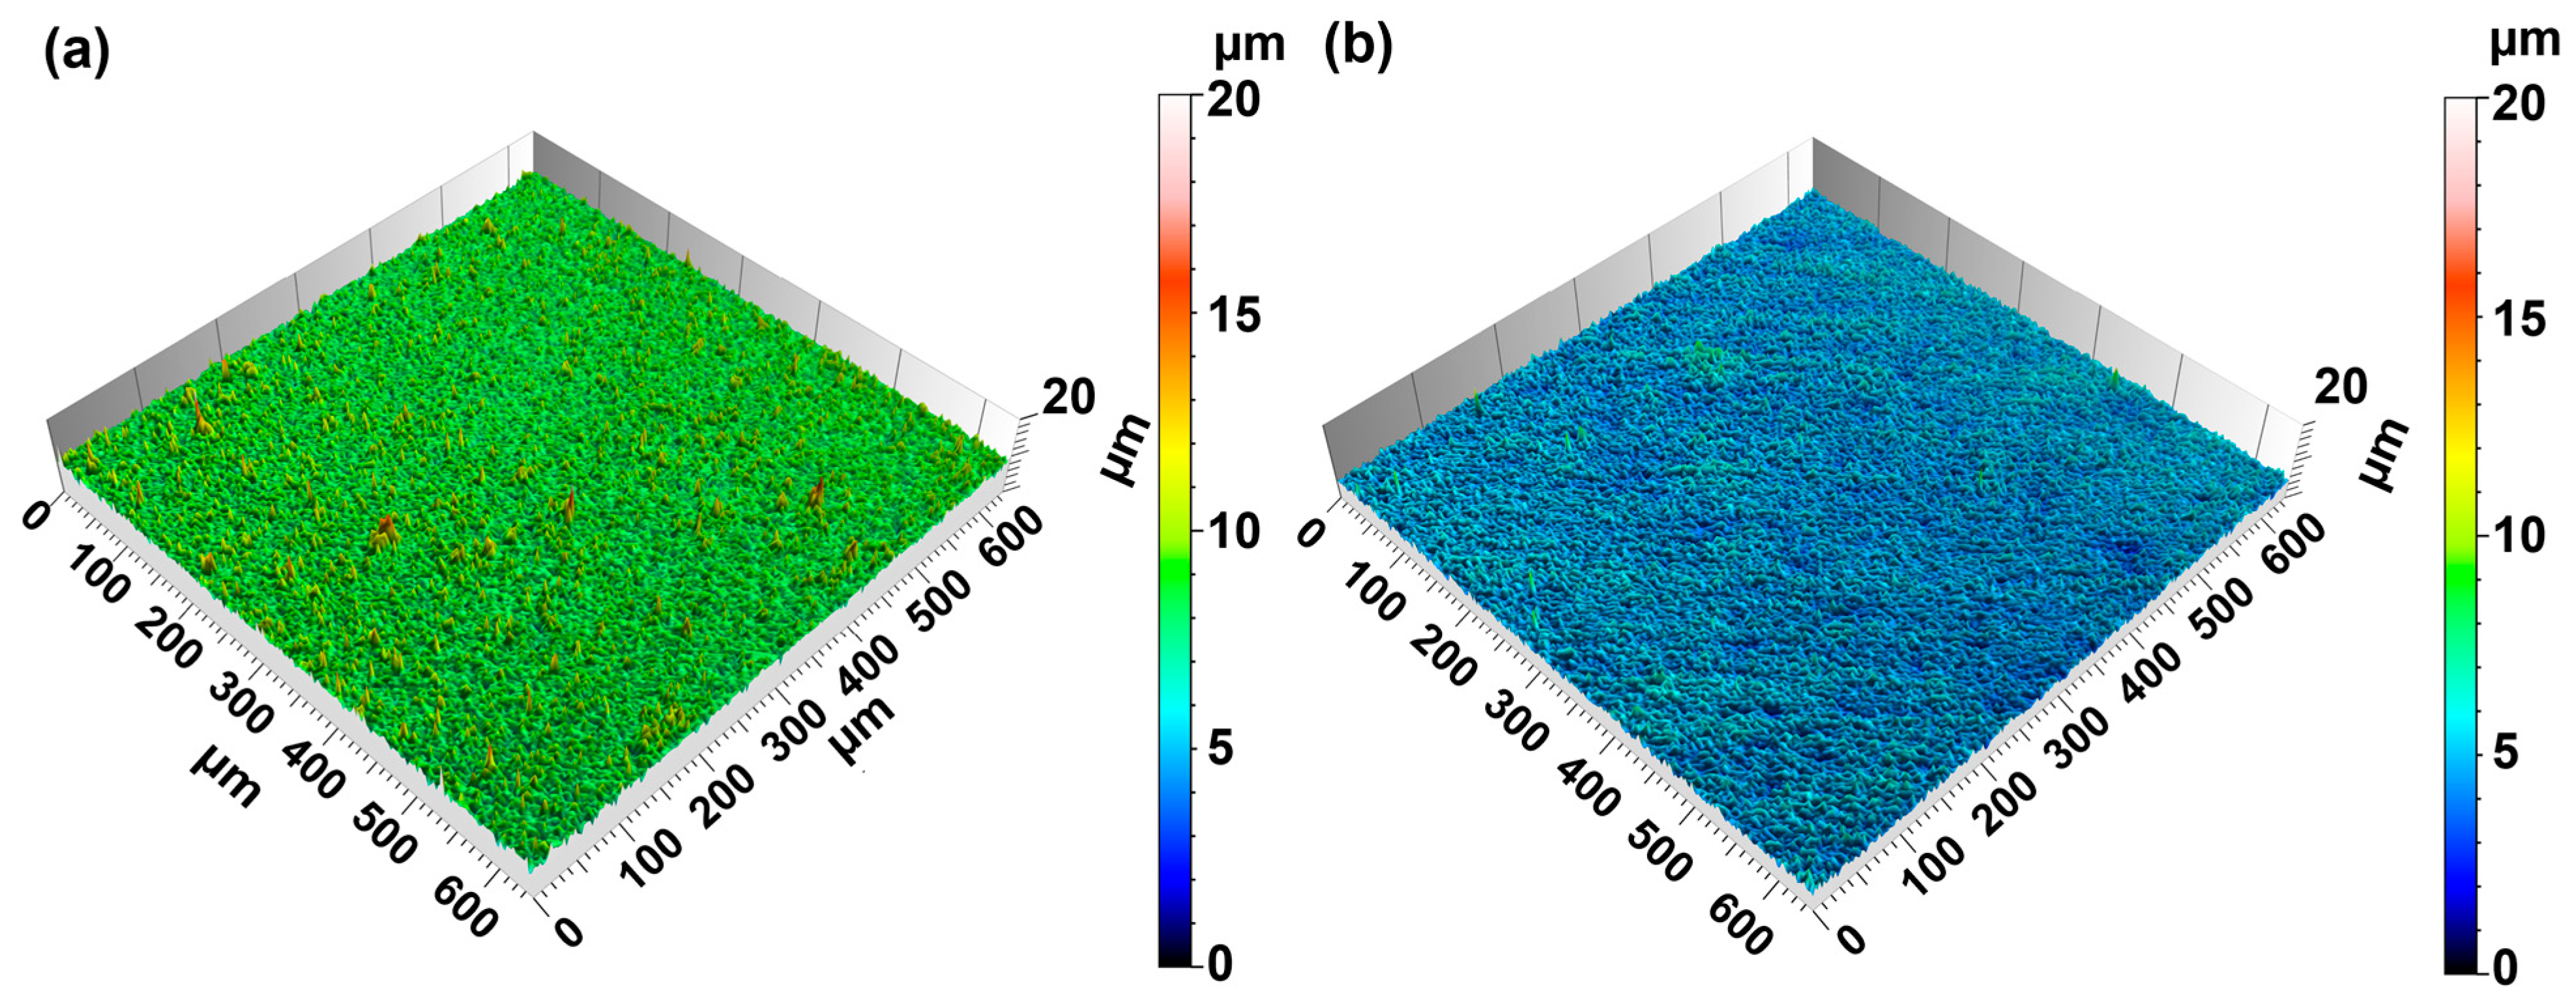
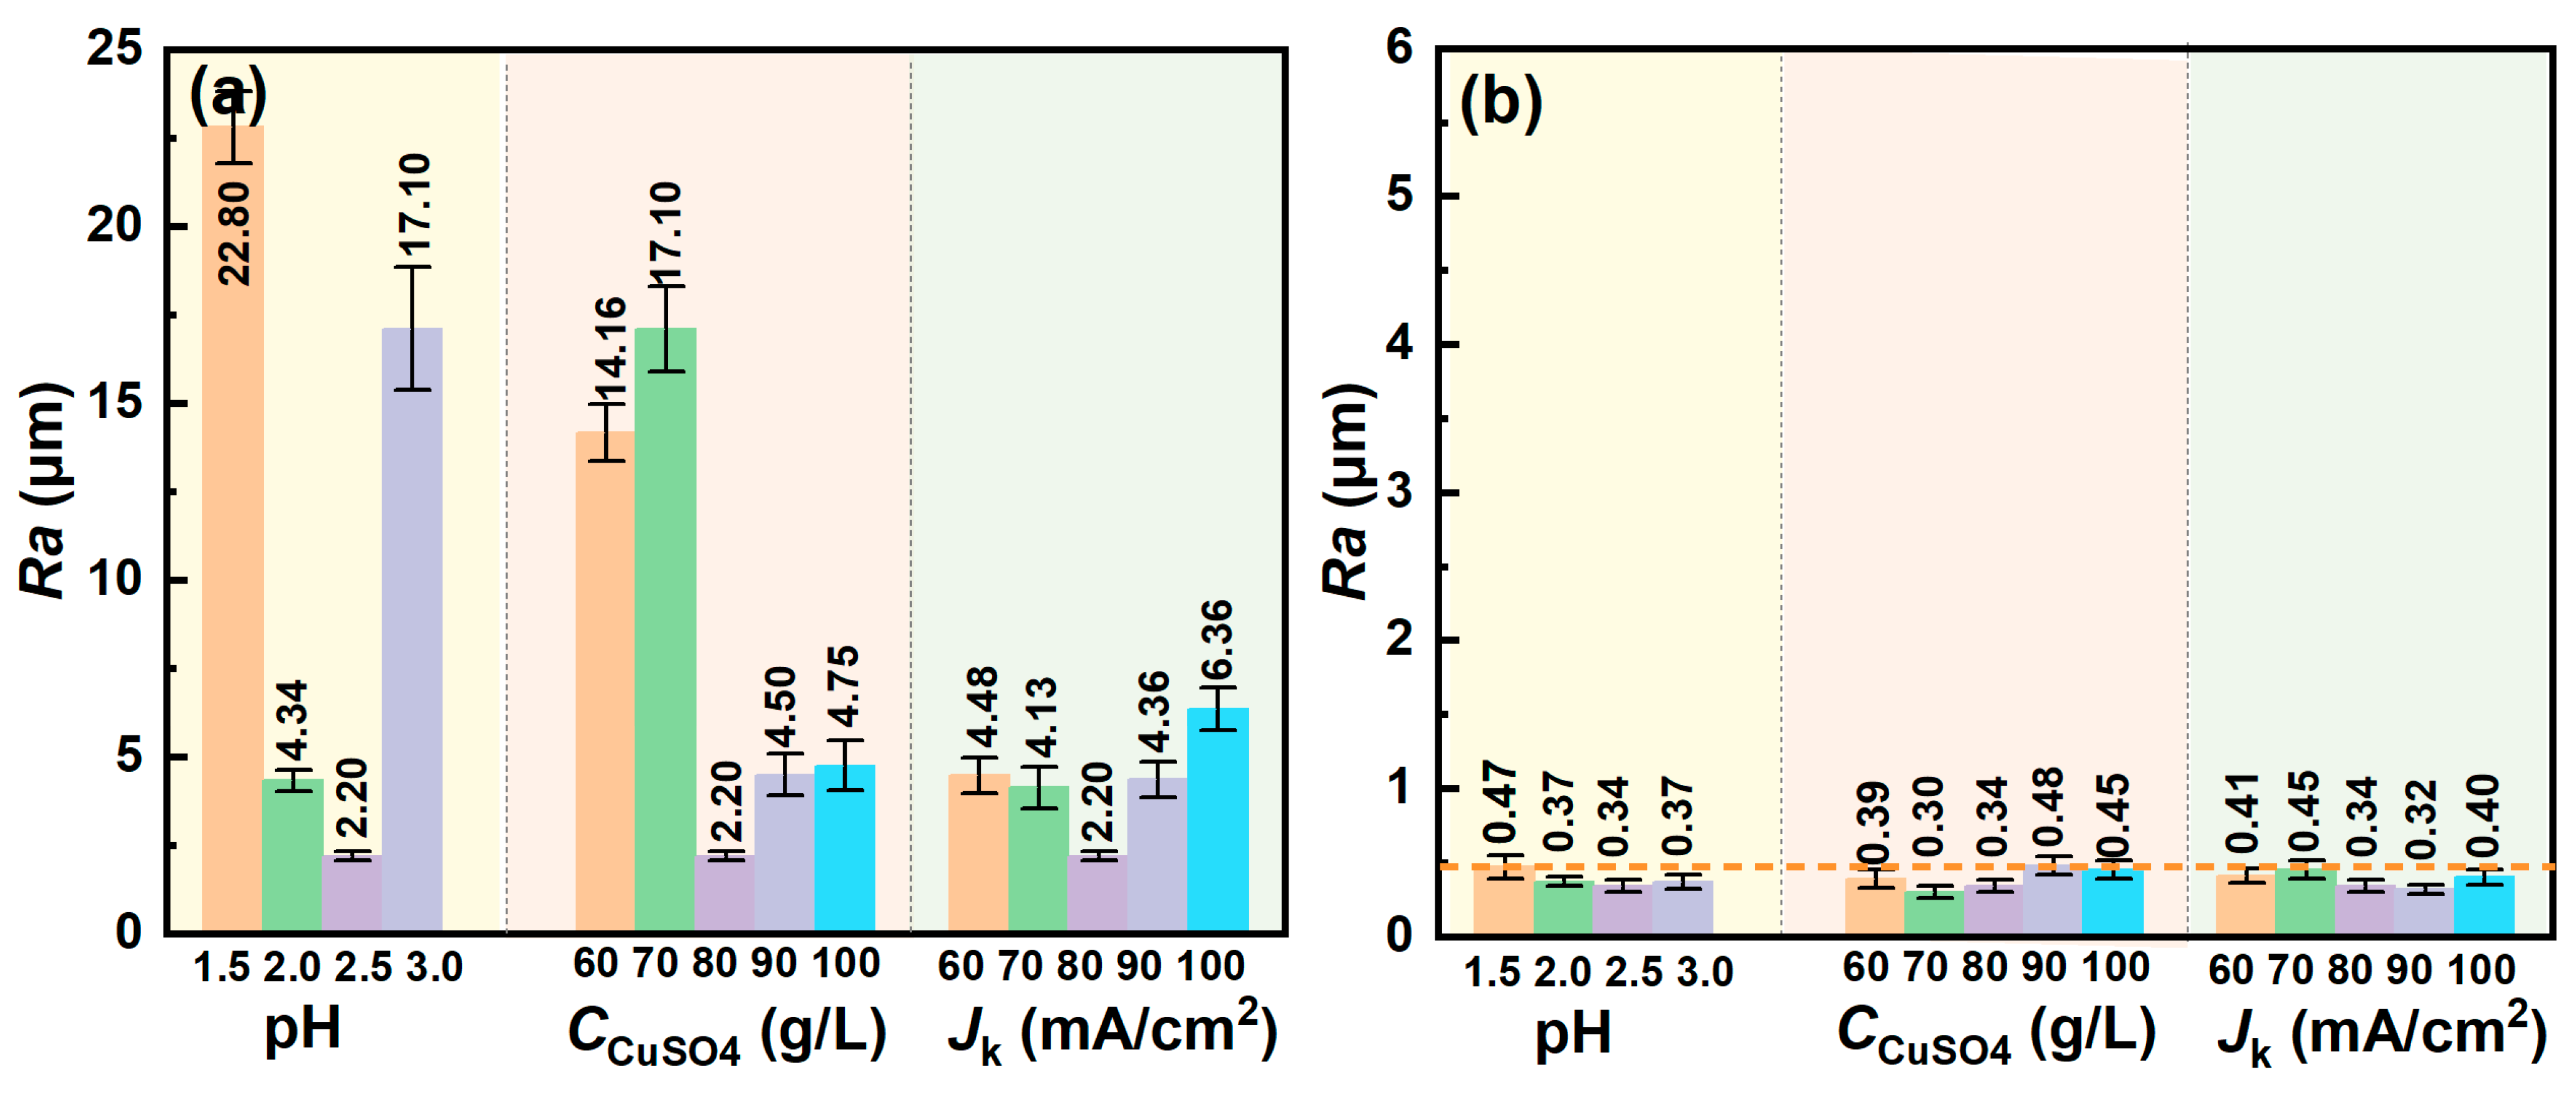
The surface roughness morphologies of copper foils prepared under various parameter conditions were systematically collected. As an example, Figure 5 illustrates the roughness morphologies of the M and S sides of the copper foil electroplated with a pH value of 2.5, a CCuSO4 of 80 g/L, and a Jk of 80 mA/cm2. The roughness values statistically obtained from the roughness topographies are shown in Figure 6. It can be seen that, for the M sides (Figure 6a), when the pH value is 2.5, Rz reaches the minimum value of 2.2 μm, while, when the pH values are 1.5 and 3.0, Rz significantly increases. With the change in CCuSO4, Rz reaches the minimum value when CCuSO4 is 80 g/L, while, when the CCuSO4 values are 60 g/L and 70 g/L, Rz significantly increases. With the change in Jk, Rz shows the same trend as different pH values. When Jk is 80 mA/cm2, Rz reaches the minimum value. For the S sides (Figure 6b), the roughness is closely related to the surface treatment of the Ti plate. Since the grinding and polishing processes of the Ti plate in this paper are the same, the Ra values of all copper foils do not differ much, all ranging between 0.30 and 0.48 μm. Based on the above results, the copper foil electroplated with a pH value of 2.5, a CCuSO4 of 80 g/L, and a Jk of 80 mA/cm2 has good comprehensive mechanical properties.
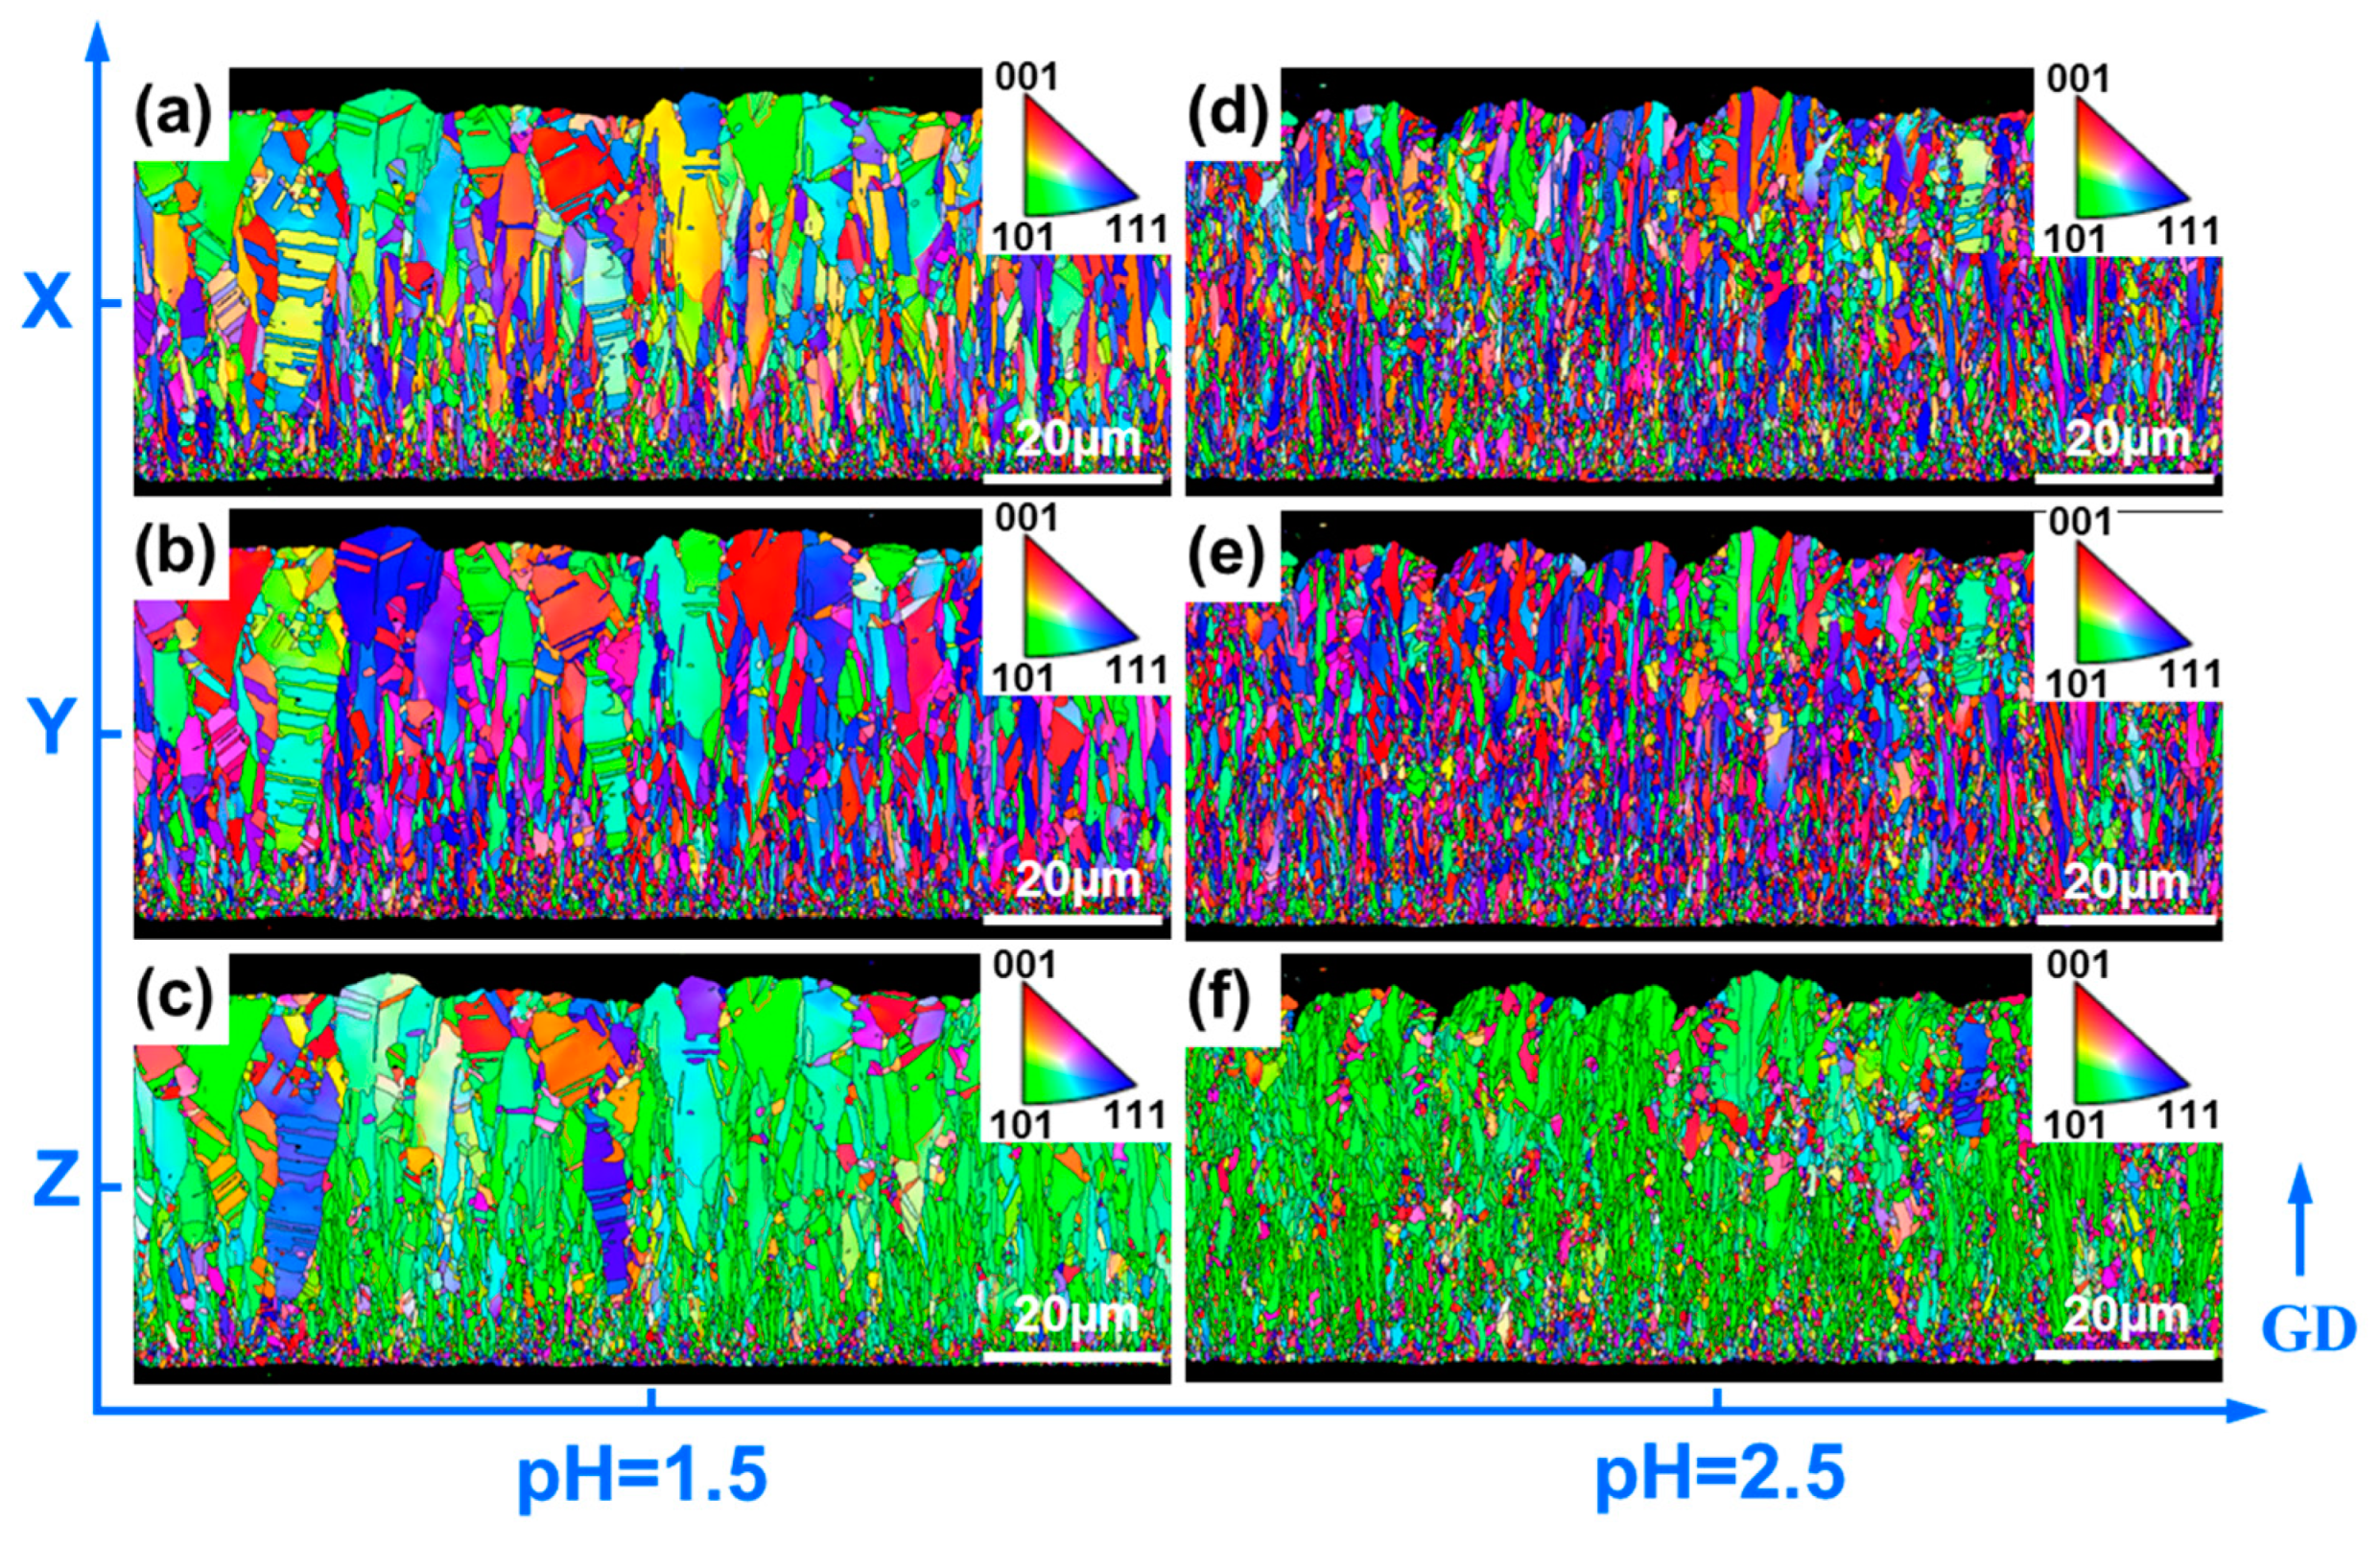
In order to deeply analyze the microstructure characteristics of copper foil, EBSD analyses were conducted on copper foils with pH values of 1.5 and 2.5. Figure 7 shows the grain orientation distribution of the cross-sections of these two copper foils in the three-dimensional direction, where the M side and the S side are located at the upper and lower parts of each figure, respectively. It can be seen from the figure that the microstructures of both copper foils are composed of fine equiaxed grains and larger columnar grains. At the initial stage of deposition, a large number of fine grains nucleate to form equiaxed crystals; with the increase in deposition time and copper foil thickness, the grains merge and show a preferred orientation phenomenon, gradually growing along the deposition direction, and finally forming larger-sized columnar grains and a small amount of equiaxed grains. It is worth noting that, when the pH value is 2.5, the grain size of the electroplated copper foil is smaller, and the thickness of the fine-grain region is larger. In the EBSD crystal coordinate system, blue, red, and green correspond to the (111)Cu, (200)Cu, and (220)Cu crystal planes, respectively. According to Figure 7a,b,d,e, the cross-section of the copper foil is dominated by blue and green in the X and Y directions, indicating that the (111)Cu and (220)Cu crystal planes are more significant, while, in the Z direction, there are more green areas (see Figure 7c,f), proving that there is a preferred orientation of (220)Cu on both sides of the sample, which is consistent with the XRD results.
Figure 8 illustrates the distribution of grains, recrystallized regions, and twin boundaries within the cross-section of electrodeposited copper foil at pH values of 1.5 and 2.5, along with corresponding statistical analyses. At a pH value of 1.5, the average grain size across the entire cross-section is 0.94 μm (Figure 8a). To more accurately analyze the grain sizes in the equiaxed fine-grained zone and the columnar coarse-grained zone during the initial deposition stage, the cross-section is segmented into two regions by a white dotted line (Figure 8b), yielding average grain sizes of 0.88 μm and 1.00 μm (Figure 8c,d). Figure 8e presents the distribution of recrystallized grains and associated statistics. The blue area denotes recrystallized grains, comprising 23.32% of the total; the yellow area represents sub-structural grains, accounting for 74.76%; and the red area indicates deformed grains, making up 1.92%. Figure 8f depicts the distribution of twin boundaries (marked by red lines) and provides proportion statistics for high-angle grain boundaries (HAGBs), low-angle grain boundaries (LAGBs), and twin boundaries (TBs). The HAGBs constitute the predominant type, representing 90.84%, while LAGBs account for 9.16% and the TBs represent 39.66%.
When the pH value is 2.5, the average grain size of the overall cross-section of the copper foil is 0.66 μm (Figure 8h). Specifically, the average grain sizes in the equiaxed fine-grain region and the columnar coarse-grain region are 0.59 μm and 0.72 μm, respectively (Figure 8i–h). The recrystallization distribution map and its statistical data (Figure 8k) reveal that 24.39% of the grains are recrystallized, 48.85% are substructural grains, 26.76% are deformed grains, and 29.07% are twin boundaries. The higher proportion of HAGBs can be attributed to the characteristic orientation differences associated with TBs. During the recrystallization process, LAGBs transform into HAGBs, leading to the formation of twin boundaries.
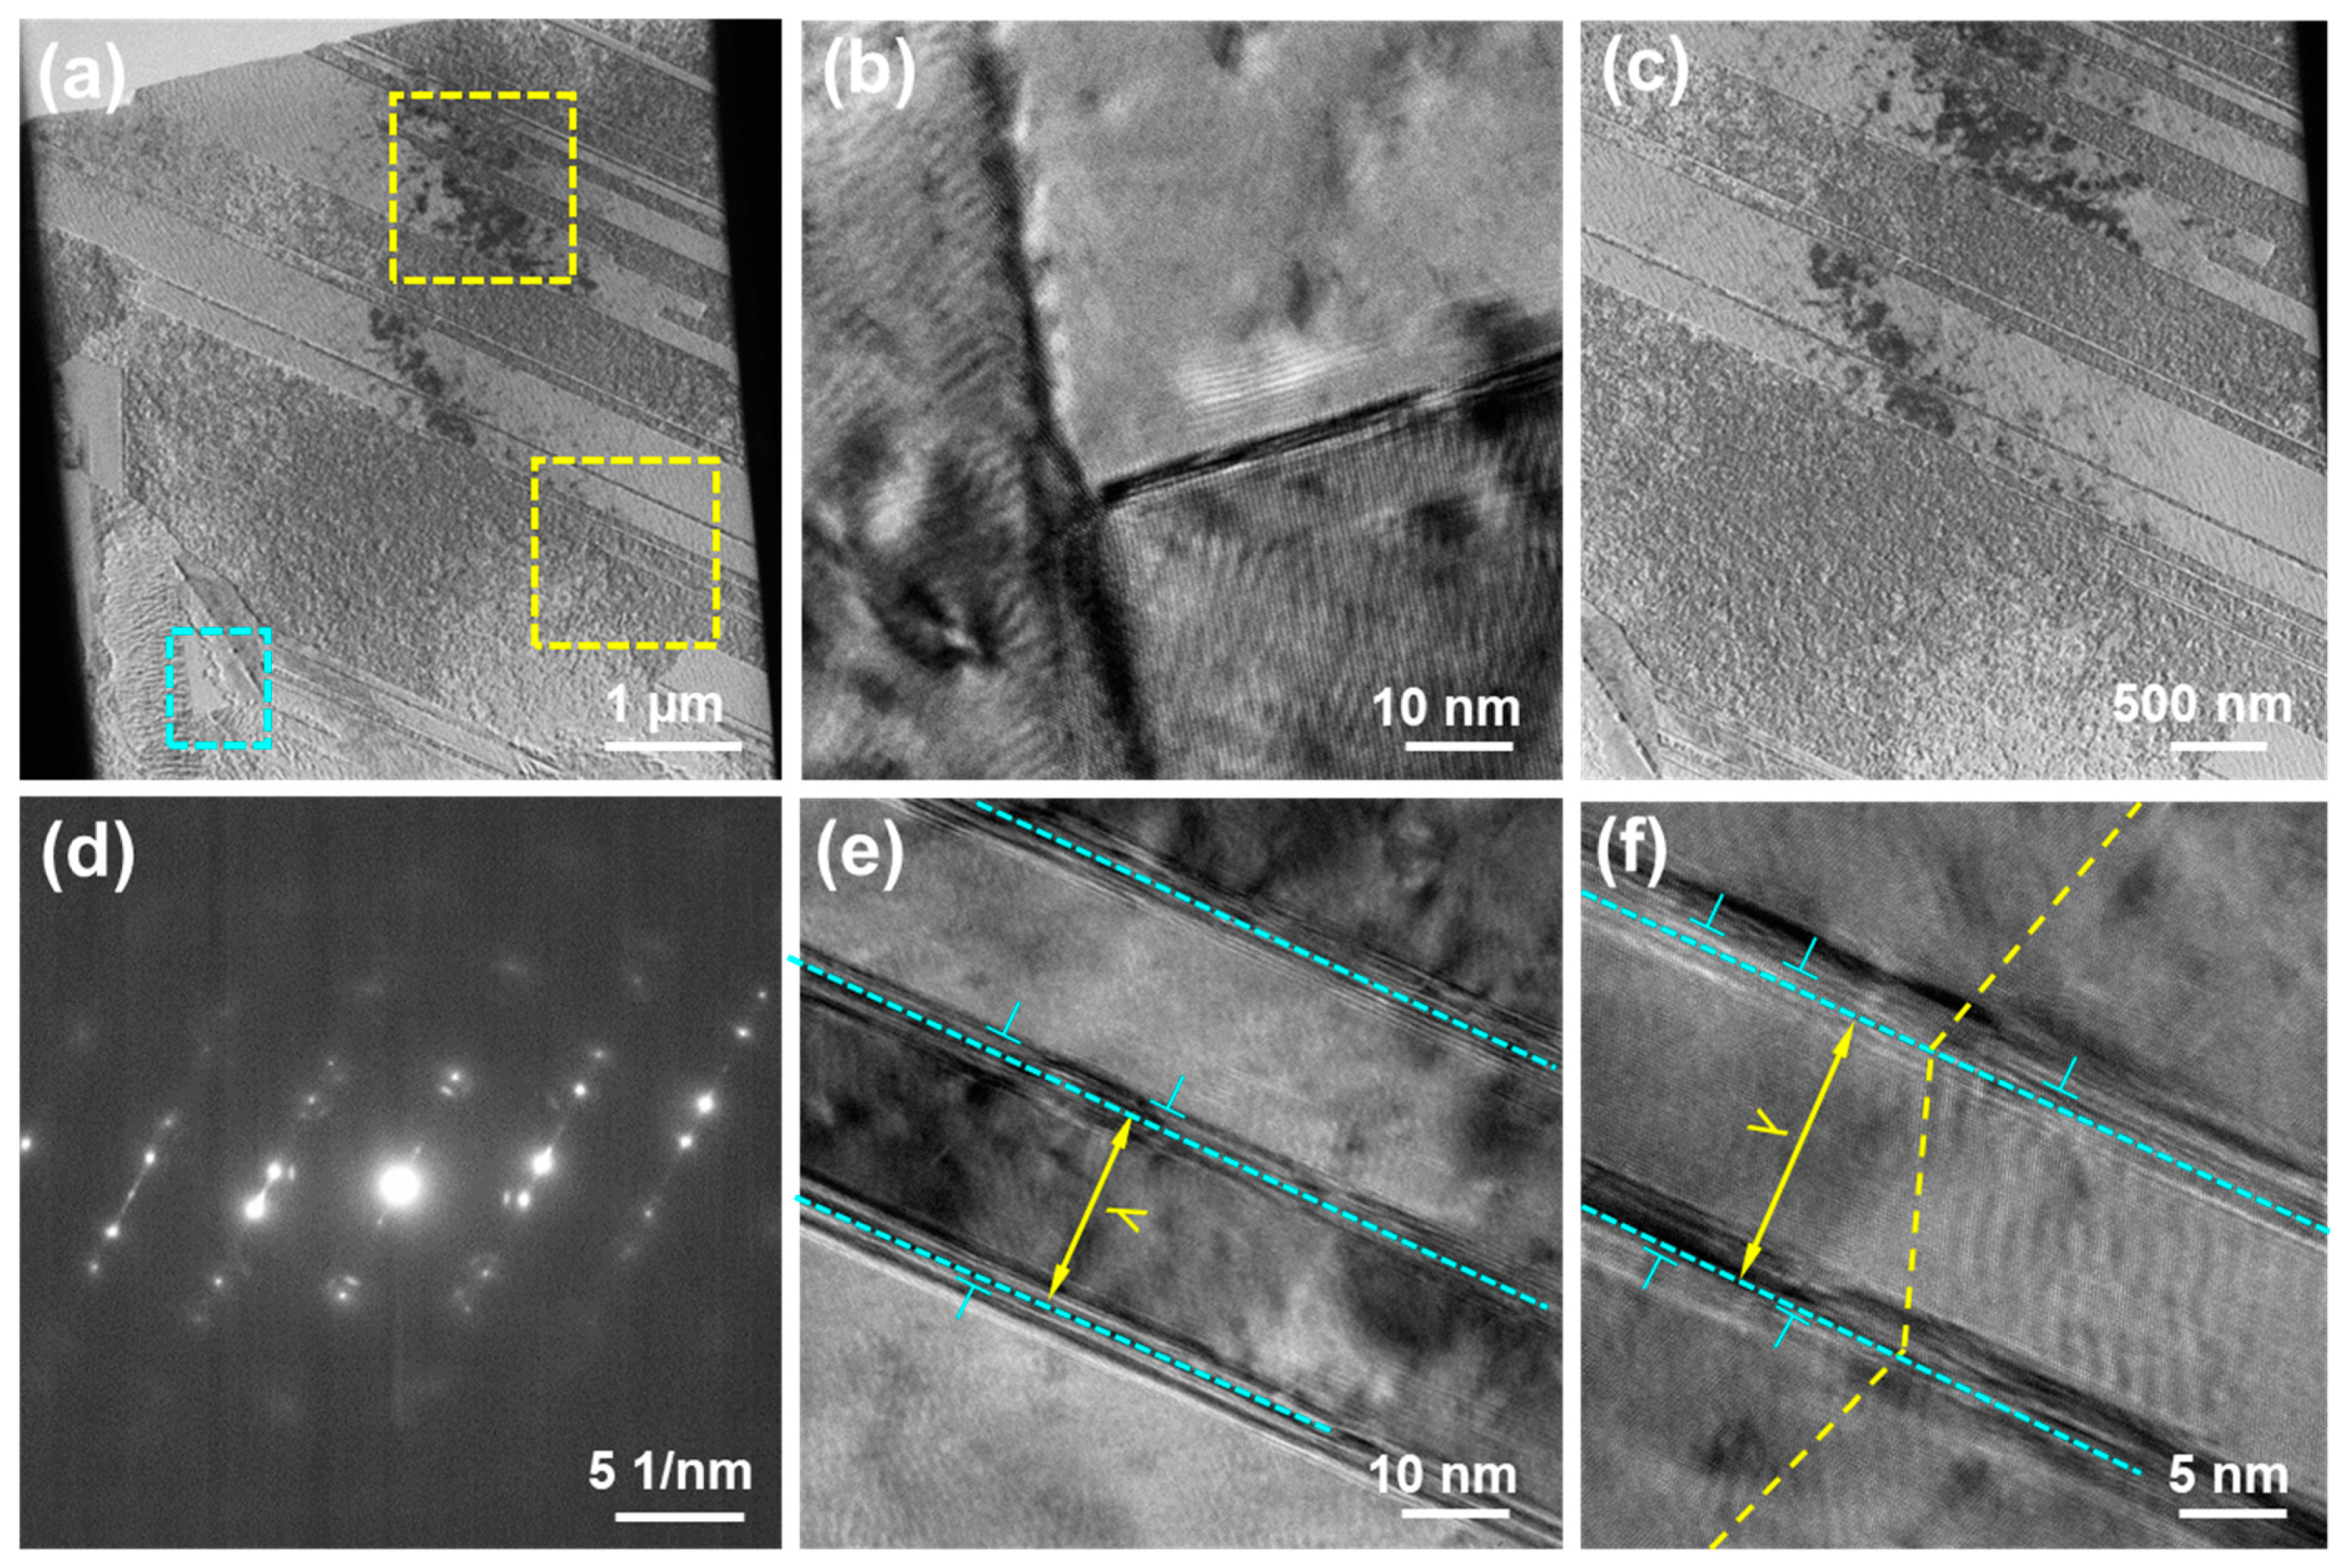
Figure 9 shows the TEM results of the cross-section of the electroplated copper foil at a pH value of 2.5. Figure 9a presents the overall morphology of the cross-section of the copper foil. It can be seen that the cross-section of the copper foil is mainly composed of banded regions of varying widths (shown by the yellow dashed box) and a small number of non-banded regions (shown by the light blue dashed box). The magnified views of these two typical regions are shown in Figure 9b,c. It can be seen that the non-banded regions are actually composed of large grains and have obvious triple grain boundaries, while the banded regions show a parallel arrangement feature, revealing a typical twin structure. The selected area electron diffraction (SAED) pattern (Figure 9d) further confirms that these regions are twin structures. Figure 9e,f shows the high-resolution images of the twin regions, indicating that a large number of twin boundaries (TBs) divide the grains into a form of twin/matrix layer stacking, and the interiors of most twin boundaries are clean and dense. Statistical results show that the average width (λ) of the twins in this copper foil is approximately 11.84 nm.

4. Discussion

4.1. Influence of Different Electrolyte Parameters on the Microstructure of Copper Foil

According to the analysis results of the microstructure of copper foil prepared under different electrolyte conditions mentioned above, it can be known that, with the changes in the three parameters of pH value, CCuSO4, and Jk, copper foil usually shows a stronger (220)Cu preferred orientation on the M surface than on the S surface. However, only when the pH value is 2.5, the CCuSO4 is between 70 and 90 g/L, and the Jk is within the range of 70–90 mA/cm2, the prepared copper foil has better compactness and no obvious pinhole-like defects. Specifically, the regulation of the electrolyte pH value mainly depends on the added amount of sulfuric acid, and the content of sulfuric acid should be moderate. If the content is low, this may lead to a rough coating surface; if the content is high, this will affect the brightness of the coating, cause pinhole phenomena, and may corrode the experimental equipment [26]. The concentration of Cu2+ is a key factor affecting electrolytic copper foil. When the concentration of Cu2+ is too high, this may lead to the crystallization of copper sulfate. These crystals will accumulate and block the electrolyte channels, which is not conducive to production. Conversely, a low concentration of Cu2+ will not only reduce production efficiency but also may cause a large number of defects in the copper foil due to the lack of Cu2+ [27]. The influence of Jk on the deposition state of copper is also relatively large. When Jk rises, the deposition rate accelerates, and the nucleation density increases, which is conducive to a reduction in grain size. However, if the cathode Jk exceeds the critical value, copper ions on the cathode surface will become scarce, resulting in coarser, loose, and porous coating grains. At the same time, a high Jk will also lead to excessive precipitation of copper, and “copper powder dropping” may occur in the subsequent processing [28].
According to Bravais’s law, the growth rate of crystals is closely related to the interplanar spacing or atomic density of crystal planes. Specifically, the crystal planes with larger interplanar spacing or denser atomic arrangement have lower growth rates. Taking the face-centered cubic (FCC) structure as an example, the high-density crystal planes (such as (111)) have extremely dense atomic arrangement, and new atoms are difficult to attach and require higher energy to form new layers; thus, the growth rate is lower. Conversely, the low-density crystal planes (such as (200), (220)) have relatively loose atomic arrangement, providing more adsorption sites, resulting in a higher growth rate. Based on the above analysis, for copper with an FCC structure, the order of crystal plane growth rates is V(200)Cu > V(220)Cu > V(111)Cu. Therefore, in the electrodeposition process, regardless of the adopted process, the preferred growth direction of copper foil should be (200)Cu > (220)Cu > (111)Cu. It has been reported that, with the increase in the thickness of copper foil, the (111) texture of copper foil gradually degrades, while the (220) texture gradually strengthens [29], that is, the preferred orientation of the deposited layer will gradually form and change. Therefore, in this paper, direct-current-electroplated copper foils with different electrolyte parameters all show a strong (220)Cu preferred orientation on the M plane.

4.2. Influence of Copper Foil Structure on Mechanical Properties

In terms of performance, the copper foil electroplated with a pH value of 2.5, a CCuSO4 of 80 g/L, and a Jk of 80 mA/cm2 exhibits good comprehensive mechanical properties. Further microstructure analysis indicates that this copper foil is mainly composed of equiaxed grains and columnar grains, exhibiting a small grain size, uniform distribution, and a dense structure. Notably, no obvious macroscopic defects, such as pinholes, were observed. Compared with the copper foil prepared under the condition of pH value of 1.5 (with an average grain size of 0.94 μm), the grains of this copper foil are finer (with an average size of 0.66 μm). The fine columnar grain structure not only reduces the roughness of the M surface, but also significantly improves the strength of the material.
Existing experimental studies [5,30,31,32,33,34,35,36], crystal plasticity models [37,38], and molecular dynamics simulations [39,40] have confirmed that, in copper materials with a grain size less than 1 μm, the twin thickness determines the strength of nano-twinned copper. The ordered twin boundaries with a twin thickness less than or equal to 100 nm are the ideal interfaces for material strengthening [41,42,43,44], among which the contribution of twins to the yield strength σTB follows the Hall–Petch-type relationship [5,32,33], where the grain size is replaced by the average twin lamella thickness (λ):
σ T B = K T B λ 1 / 2
where KTB is a constant. It can be known from the above equation that, the smaller the twin spacing, the greater the enhancement of strength. It can be known from the above equation that, the smaller the twin spacing, the greater the enhancement of strength. However, when applying this formula, the value range of λ should be mainly considered. When λ > 15 nm, this equation can be directly used for calculation. When λ < 15 nm, this equation cannot be used for calculation.
According to the TEM results for this sample, the average spacing of the twin lamellae is 11.84 nm, and a tensile strength higher than 800 MPa can be theoretically obtained [5], but the tensile strength obtained experimentally is only 536 MPa, which is significantly lower than the theoretical value. The main reason is that the density of twins in this sample is low, and the twin spacing is not very uniform.

5. Conclusions

In the present paper, under the condition that all other additives are the same, the effects of pH value, CCuSO4, and Jk on the microstructure and mechanical properties of electroplated copper foils at room temperature are discussed in detail. The results show that, with the changes in the three parameters of pH value, CCuSO4, and Jk, copper foil usually shows a stronger (220)Cu preferred orientation on the M surface than on the S surface. When the pH value is 2.5, the CCuSO4 is between 70 and 90 g/L, and the Jk is within the range of 70–90 mA/cm2, the prepared copper foil has better compactness and no obvious pinhole-like defects. Particularly, the copper foil electroplated with a pH value of 2.5, a CCuSO4 of 80 g/L, and a Jk of 80 mA/cm2 is mainly composed of equiaxed grains and columnar grains, characterized by small grain size, uniform distribution, and a dense structure, thereby demonstrating excellent comprehensive mechanical properties.

Author Contributions

W.M.: Validation, Formal analysis, Investigation, Data curation, Writing—Original Draft; Y.Z.: Supervision, Project administration, Funding acquisition, Conceptualization, Methodology; Writing—Review and Editing; C.L.: Methodology, Writing—Review and Editing; T.F.: Methodology, Data curation; G.D.: Formal analysis; H.G.: Investigation; P.L.: Conceptualization, Supervision, Project administration. All authors have read and agreed to the published version of the manuscript.

Funding

This research was funded by the financial supports by Major Science and Technology Projects of Gansu Province (23ZDGA008 and 22ZD6GA008), and the Foundation of Key Laboratory of Solar Power System (2024SPKL02).

Institutional Review Board Statement

Not applicable.

Informed Consent Statement

Not applicable.

Data Availability Statement

All data included in this study are available upon request by contact with the corresponding author.

Conflicts of Interest

Authors Chong Luo, Tao Feng, Gang Dong were employed by the company Gansu Hailiang New Energy Materials Co., Ltd. The remaining authors declare that the research was conducted in the absence of any commercial or financial relationships that could be construed as a potential conflict of interest.

References

  1. Yang, S.; Wang, W.C.; Zhang, R.; Qin, S.P.; Wu, M.X.; Mitsuzaki, N.; Chen, Z.D. Effect of sodium alcohol thiyl propane sulfonate on electrolysis of high performance copper foil for lithium ion batteries. J. Electrochem. 2022, 28, 2104501. [Google Scholar] [CrossRef]
  2. Han, W.; Shen, C.; Zhu, D. High-density nanotwinned copper foils electrodeposited under low temperatures for lithium-ion batteries. Energy 2025, 320, 135241. [Google Scholar] [CrossRef]
  3. Kitada, A. Electrodeposition of metal foils for battery current collectors: Status and challenges. Energy Storage Mater. 2025, 75, 104073. [Google Scholar] [CrossRef]
  4. Huang, J.; Liu, W.; Chen, M.; Tang, Y.; Fan, X. Electrodeposition of 15 μm nanotwinned Cu foils with low warpage and excellent mechanical properties. J. Alloys Compd. 2025, 1010, 178156. [Google Scholar] [CrossRef]
  5. Lu, L.; Chen, X.; Huang, X.; Lu, K. Revealing the maximum strength in nanotwinned copper. Science 2009, 323, 607–610. [Google Scholar] [CrossRef]
  6. Zhan, X.; Lian, J.; Li, H.; Wang, X.; Zhou, J.; Trieu, K.; Zhang, X. Preparation of highly (111) textured nanotwinned copper by medium-frequency pulsed electrodeposition in an additive-free electrolyte. Electrochim. Acta 2021, 365, 137391. [Google Scholar] [CrossRef]
  7. Cheng, Z.; Jin, S.; Lu, L. Effect of Electrolyte Temperature on Microstructures of Direct-Current Electrodeposited Nanotwinned Cu. Acta Metall. 2018, 54, 428–434. [Google Scholar] [CrossRef]
  8. Jin, S.; Pan, Q.S.; Lu, L. Microstructure dependence of directcurrent electrodeposited bulk cu with preferentially oriented nanotwins on the current densities. Acta Metall. Sin. 2013, 49, 635–640. [Google Scholar] [CrossRef]
  9. Fang, T.H.; Li, W.L.; Tao, N.R.; Lu, K. Revealing Extraordinary intrinsic tensile plasticity in gradient nano-grained copper. Science 2011, 331, 1587–1590. [Google Scholar] [CrossRef]
  10. You, Z.S.; Lu, L. Effect of strain rate on tensile ductility and fracture behavior of bulk nanotwinned copper. Adv. Funct. Mater. 2015, 17, 1754–1759. [Google Scholar] [CrossRef]
  11. You, Z.S.; Lu, L.; Lu, K. Tensile behavior of columnar grained Cu with preferentially oriented nanoscale twins. Acta Mater. 2011, 59, 6927–6937. [Google Scholar] [CrossRef]
  12. Li, Y.J.; Tu, K.N.; Chen, C. Tensile Properties of <111>-Oriented Nanotwinned Cu with Different Columnar Grain Structures. Materials 2020, 13, 1310. [Google Scholar] [CrossRef] [PubMed]
  13. Hsiao, H.Y.; Liu, C.M.; Lin, H.W.; Liu, T.C.; Lu, C.L.; Huang, Y.S.; Chen, C.; Tu, K.N. Unidirectional growth of microbumps on (111)-oriented and nanotwinned copper. Science 2012, 336, 1007–1010. [Google Scholar] [CrossRef]
  14. Liu, C.M.; Lin, H.W.; Lu, C.L.; Chen, C. Effect of grain orientations of Cu seed layers on the growth of <111>-oriented nanotwinned Cu. Sci. Rep. 2014, 4, 6123. [Google Scholar] [CrossRef]
  15. Lin, H.W.; Lu, C.L.; Liu, C.M.; Chen, C.; Chen, D.; Kuo, J.C.; Tu, K.N. Microstructure control of unidirectional growth of η-Cu6Sn5 in microbumps on <111> oriented and nanotwinned Cu. Acta Mater. 2013, 61, 4910–4919. [Google Scholar] [CrossRef]
  16. Liu, T.C.; Liu, C.M.; Huang, Y.S.; Chen, C.; Tu, K.N. Eliminate Kirkendall voids in solder reactions on nanotwinned copper. Scr. Mater. 2013, 68, 241–244. [Google Scholar] [CrossRef]
  17. Sun, F.L.; Gao, L.Y.; Liu, Z.Q.; Zhang, H.; Sugahara, T.; Nagao, S.; Suganuma, K. Electrodeposition and growth mechanism of preferentially orientated nanotwinned Cu on silicon wafer substrate. J. Mater. Sci. Technol. 2018, 34, 1885–1890. [Google Scholar] [CrossRef]
  18. Sun, F.L.; Liu, Z.Q.; Li, C.F.; Zhu, Q.S.; Zhang, H.; Suganuma, K. Bottom-up electrodeposition of large-scale nanotwinned copper within 3D through silicon via. Materials 2018, 11, 319. [Google Scholar] [CrossRef]
  19. Wen, S.; Wang, B.; Zhao, C. Study on microstructure and hardness of direct-current electrodeposited nanotwinned Cu. Hot Work. Technol. 2017, 46, 107–109. [Google Scholar] [CrossRef]
  20. Lu, Q.; You, Z.; Huang, X.; Hansen, N.; Lu, L. Dependence of dislocation structure on orientation and slip systems in highly oriented nanotwinned Cu. Acta Mater. 2017, 127, 85–97. [Google Scholar] [CrossRef]
  21. Liu, L.; Bu, Y.; Sun, Y.; Pan, J.; Liu, J.; Ma, J.; Qiu, L.; Fang, Y. Trace bis-(3-sulfopropyl)-disulfide enhanced electrodeposited copper foils. J. Mater. Sci. Technol. 2021, 74, 237–245. [Google Scholar] [CrossRef]
  22. GB/T 5230–1995; Electrodeposited Copper Foil. Standardization Administration of China: Beijing, China, 1995.
  23. Li, Z.G.; Gao, L.Y.; Li, Z.; Sun, R.; Liu, Z.Q. Regulating the orientation and distribution of nanotwins by trace of gelatin during direct current electroplating copper on titanium substrate. J. Mater. Sci. 2022, 57, 17797–17811. [Google Scholar] [CrossRef]
  24. Zhang, J.; Chen, H.; Fan, B.; Shan, H.; Chen, Q.; Jiang, C.; Hou, G.; Tang, Y. Study on the relationship between crystal plane orientation and strength of electrolytic copper foil. J. Alloys Compd. 2021, 884, 161044. [Google Scholar] [CrossRef]
  25. Yu, W.; Lin, C.; Li, Q.; Zhang, J.; Yang, P.; An, M. A novel strategy to electrodeposit high-quality copper foils using composite additive and pulse superimposed on direct current. J. Appl. Electrochem. 2021, 51, 489–501. [Google Scholar] [CrossRef]
  26. Xiao, Q.; Lin, G.; Wang, J.; Zheng, K.; Feng, X. Effect of pH Value on Electroless Deposition of Copper Graphite Powders. Prot. Met. Phys. Chem. Surf. 2021, 57, 132–138. [Google Scholar] [CrossRef]
  27. Li, Y.; Huang, G.; Yin, X.; Chen, X.; Ma, X.; Li, Y.; Yao, E. Effect of copper ion concentration on microstructure and mechanical properties of electrolytic copper foil. IOP Conf. Ser. Mater. Sci. Eng. 2018, 381, 012166. [Google Scholar] [CrossRef]
  28. Lin, C.C.; Yen, C.H.; Lin, S.C.; Hu, C.C.; Dow, W.P. Interactive effects of additives and electrolyte flow rate on the microstructure of electrodeposited copper foils. J. Electrochem. Soc. 2017, 164, D810–D817. [Google Scholar] [CrossRef]
  29. Hu, J.; Fan, B.; Wu, Z.; Zuo, D.; Zhang, J.; Chen, Q.; Hou, G.; Tang, Y. Research progress on the texture of electrolytic copper foils. J. Electron. Mater. 2024, 53, 3460–3473. [Google Scholar] [CrossRef]
  30. Lu, L.; Schwaiger, R.; Shan, Z.W.; Dao, M.; Lu, K.; Suresh, S. Nano-sized twins induce high rate sensitivity of flow stress in pure copper. Acta Mater. 2005, 53, 2169–2179. [Google Scholar] [CrossRef]
  31. Shen, Y.F.; Lu, L.; Dao, M.; Suresh, S. Strain rate sensitivity of Cu with nanoscale twins. Scr. Mater. 2006, 55, 319–322. [Google Scholar] [CrossRef]
  32. Lu, L.; Zhu, T.; Shen, Y.F.; Dao, M.; Lu, K.; Suresh, S. Stress relaxation and the structure size-dependence of plastic deformation in nanotwinned copper. Acta Mater. 2009, 57, 5165–5173. [Google Scholar] [CrossRef]
  33. Lu, L.; Dao, M.; Zhu, T.; Li, J. Size dependence of rate-controlling deformation mechanisms in nanotwinned copper. Scr. Mater. 2009, 60, 1062–1066. [Google Scholar] [CrossRef]
  34. You, Z.S.; Lu, L.; Lu, K. Temperature effect on rolling behavior of nano-twinned copper. Scr. Mater. 2010, 62, 415–418. [Google Scholar] [CrossRef]
  35. Tamakawa, K.; Sakutani, K.; Miura, H. Effect of micro texture of electroplated copper thin films on their mechanical properties. Zair. J. Soc. Mater. Sci. 2007, 56, 907–912. [Google Scholar] [CrossRef]
  36. Wei, K.X.; Zheng, X.C.; Wei, W.; Alexandrov, I.V. High tensile properties and low surface roughness of Gr/Cu foils. J. Mater. Eng. Perform. 2022, 31, 9362–9369. [Google Scholar] [CrossRef]
  37. Dao, M.; Lu, L.; Shen, Y.F.; Suresh, S. Strength, strain-rate sensitivity and ductility of copper with nanoscale twins. Acta Mater. 2006, 54, 5421–5432. [Google Scholar] [CrossRef]
  38. Jérusalem, A.; Dao, M.; Suresh, S.; Radovitzky, R. Three-dimensional model of strength and ductility of polycrystalline copper containing nanoscale twins. Acta Mater. 2008, 56, 4647–4657. [Google Scholar] [CrossRef]
  39. Li, X.; Wei, Y.; Lu, L.; Lu, K.; Gao, H. Dislocation nucleation governed softening and maximum strength in nano-twinned metals. Nature 2010, 464, 877–880. [Google Scholar] [CrossRef]
  40. Shabib, I.; Miller, R.E. Deformation characteristics and stress–strain response of nanotwinned copper via molecular dynamics simulation. Acta Mater. 2009, 57, 4364–4373. [Google Scholar] [CrossRef]
  41. Jang, D.C.; Li, X.Y.; Gao, H.J.; Greer, J.R. Deformation mechanisms in nanotwinned metal nanopillars. Nat. Nanotech. 2012, 7, 594–601. [Google Scholar] [CrossRef]
  42. Wang, Y.M.; Sansoz, F.; LaGrange, T.; Ott, R.Y.; Marian, J.; Barbee, T.W., Jr.; Hamza, A.V. Defective twin boundaries in nanotwinned metals. Nat. Mater. 2013, 12, 697–702. [Google Scholar] [CrossRef] [PubMed]
  43. Jang, D.C.; Cai, C.; Greer, J.R. Influence of homogeneous interfaces on the strength of 500 nm diameter Cu nanopillars. Nano Lett. 2011, 11, 1743–1746. [Google Scholar] [CrossRef] [PubMed]
  44. Afanasyev, K.A.; Sansoz, F. Strengthening in gold nanopillars with nanoscale twins. Nano Lett. 2007, 7, 2056–2062. [Google Scholar] [CrossRef]
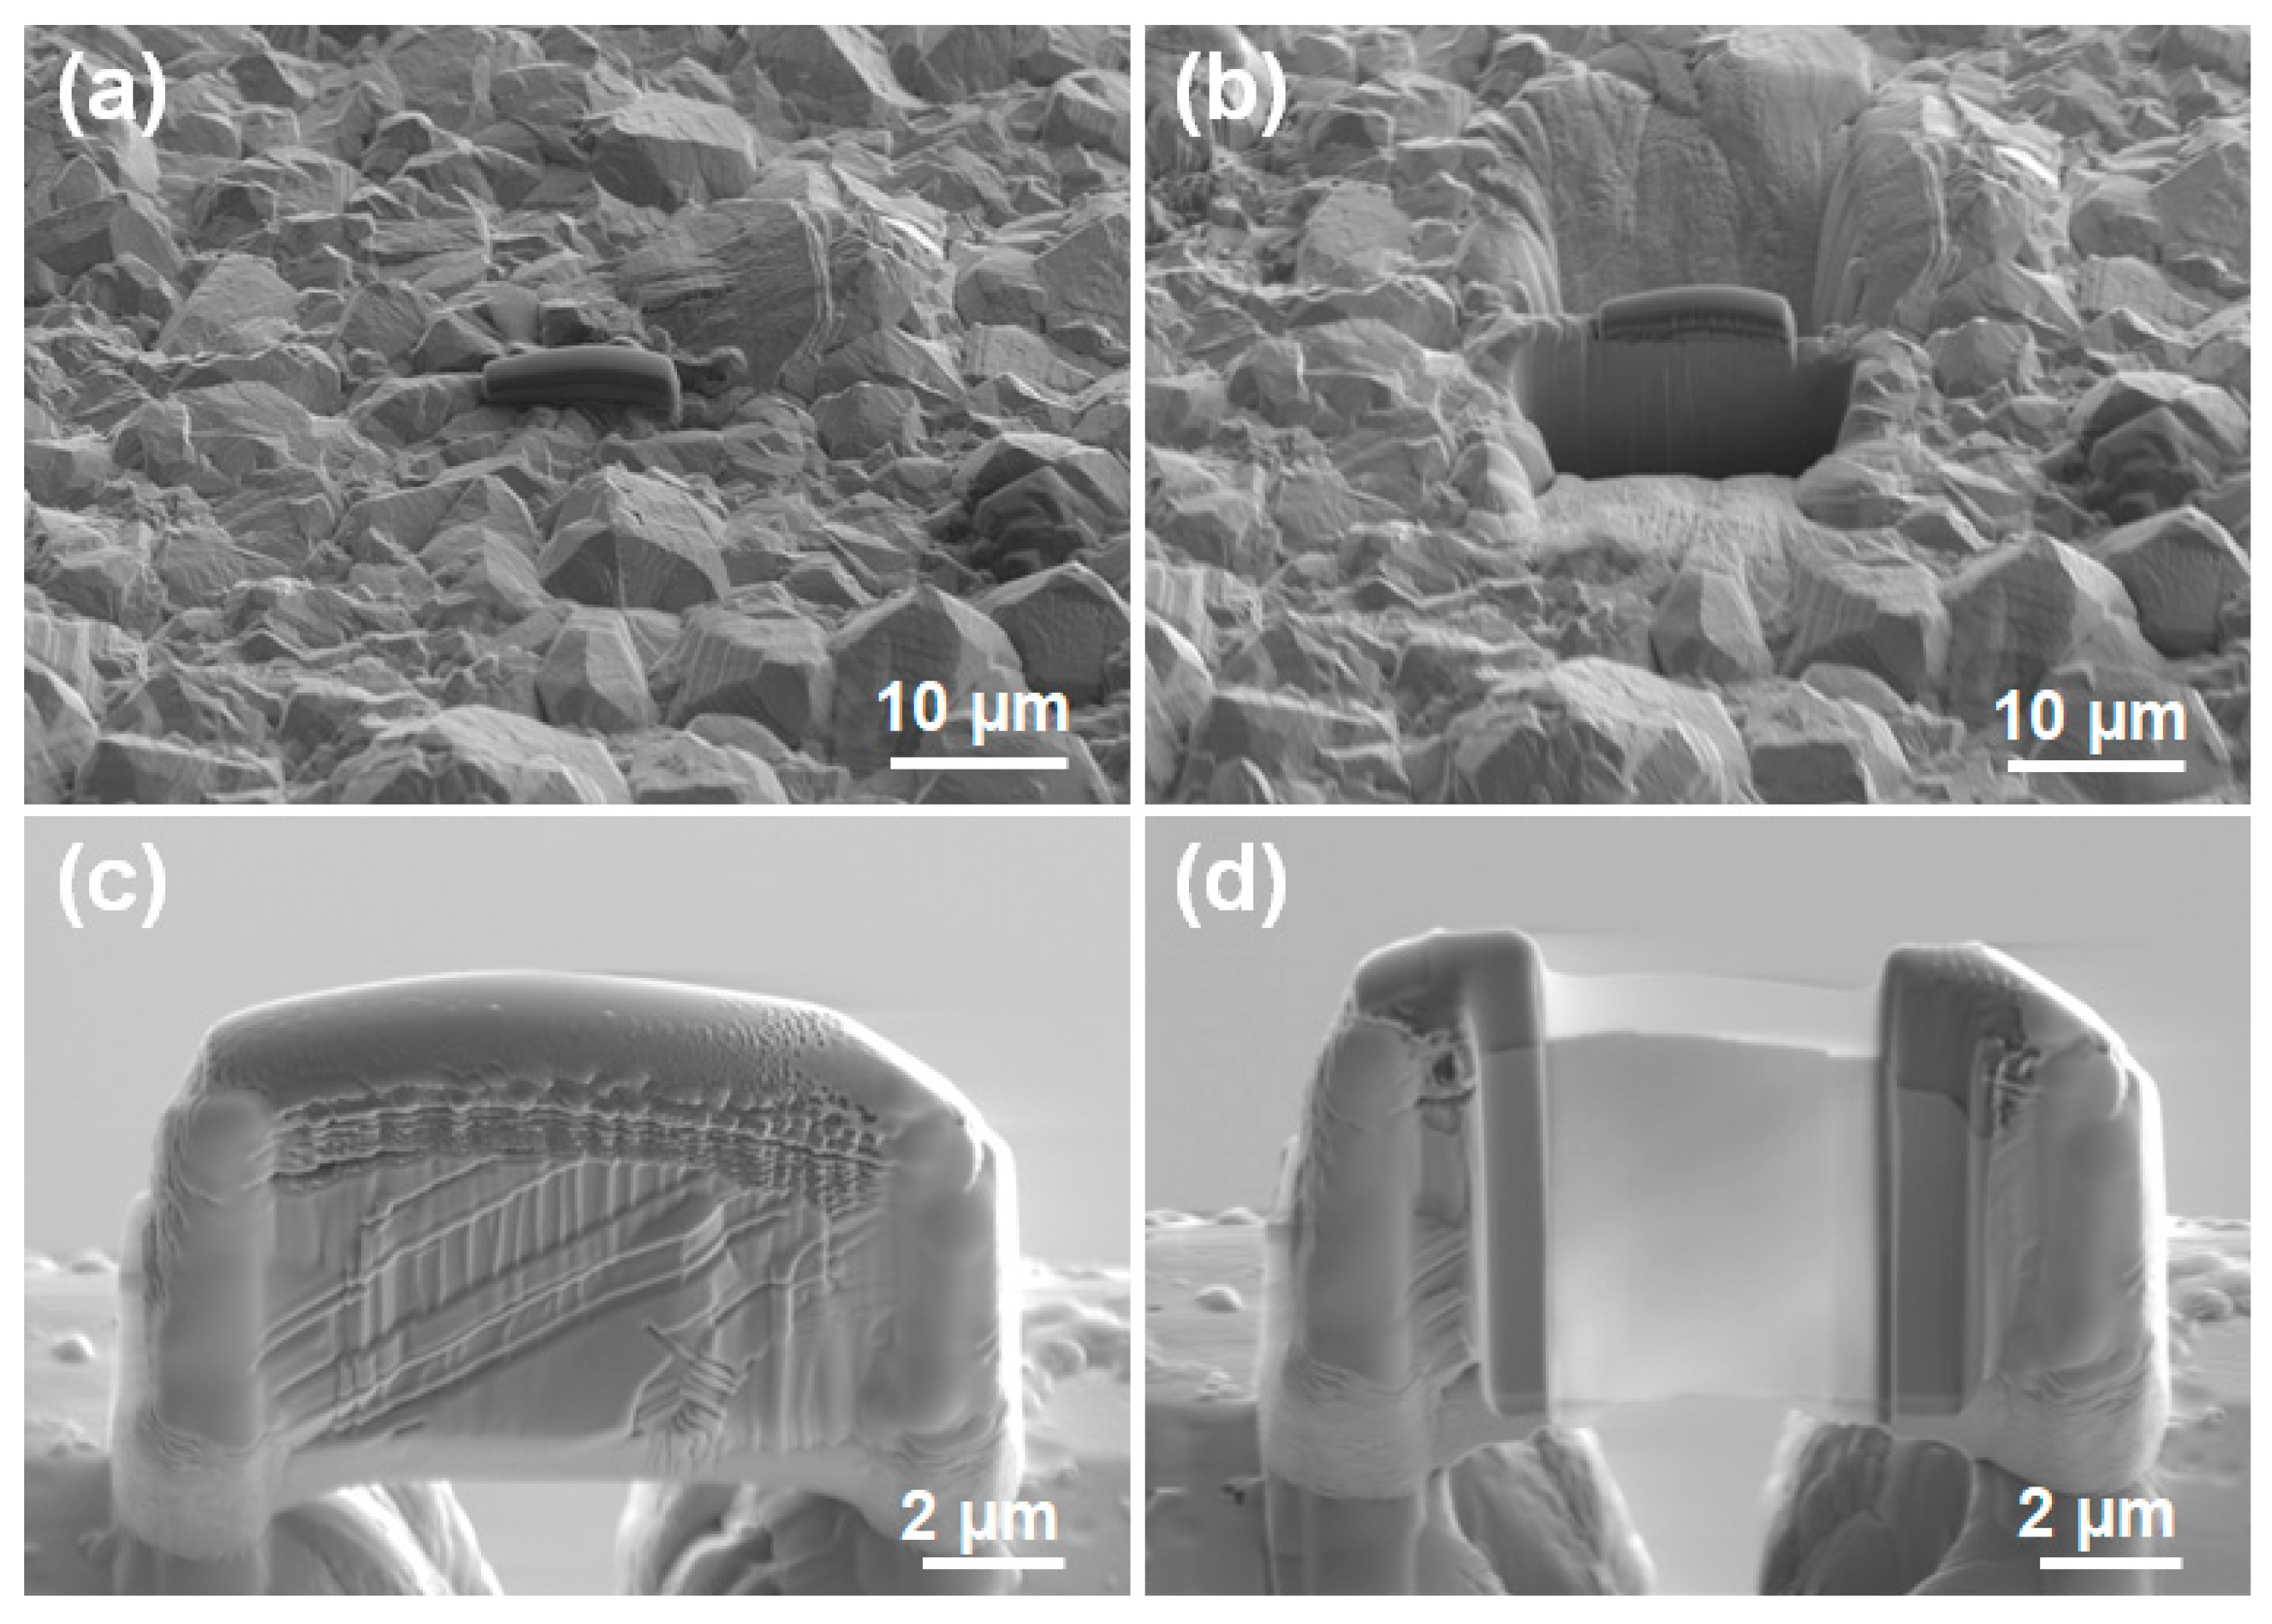
Figure 1. Preparation process of copper foil cross-section TEM sample: (a) surface treatment (sputtering Pt layer); (b) FIB preparation sample (concave pits on both sides obliquely); (c) mechanical nano-hands take out the thin sheet; (d) ion beam thinning.
Coatings 15 00521 g001
Figure 2. Cross-sectional SEM morphologies and thickness statistics of copper foils electroplated by direct current under different conditions: (ae) pH values; (fj) CCuSO4; (ko) Jk. The dotted-line circles indicate the locations of pinhole-like defects. Dotted lines indicate the range of thickness values.
Coatings 15 00521 g002
Figure 3. XRD patterns of copper foils electroplated by direct current under different pH values, CCuSO4, and Jk conditions: (ac) M sides; (df) S sides.
Coatings 15 00521 g003
Figure 4. Stress–strain curves of copper foil electroplated by direct current under different (a) pH values, (b) CCuSO4, and (c) Jk conditions, (d) as well as tensile strength and elongation of copper foil with different parameters.
Coatings 15 00521 g004
Figure 5. Surface roughness morphologies of the (a) M side and the (b) S side of the copper foil electroplated with a pH value of 2.5, a CCuSO4 of 80 g/L, and a Jk of 80 mA/cm2.
Coatings 15 00521 g005
Figure 6. Roughness of copper foils electroplated under different pH values, CCuSO4, and Jk conditions: (a) M sides; (b) S sides.
Coatings 15 00521 g006
Figure 7. Grain orientation in the X, Y, and Z directions of the cross-sections of electroplated copper foils at pH values of (ac) 1.5 and (df) 2.5.
Coatings 15 00521 g007
Figure 8. (ad,gj) Grain distribution diagrams and grain size statistics diagrams, (e,k) recrystallization distribution diagrams, and (f,l) twin boundary distribution diagrams of the cross-section of electroplated copper foils at pH values of 1.5 (af) and 2.5 (gl). In figures (e,k), the red, blue and yellow colors represent deformed, recrystallized and substructure grains, respectively. In figures (f,i), the black line and the red line represent grain boundaries and twinning boundaries, respectively.
Coatings 15 00521 g008
Figure 9. TEM results of the cross-section of electroplated copper foil at pH values of 2.5: (ac) TEM morphologes; (d) the selected area electron diffraction (SAED) pattern of the twin crystal region; (e,f) high-resolution TEM images.
Coatings 15 00521 g009
Table 1. Electrolyte parameters and additive content of DC-electroplated copper foil.
Group No.pH ValueCCuSO4 (g/L)Jk (mA/cm2)CSPS (ppm)CGelatin (ppm)CCl− (ppm)
A1.580802260
2.0
2.5
3.0
B2.560802260
70
90
100
C2.580602260
70
90
100
Disclaimer/Publisher’s Note: The statements, opinions and data contained in all publications are solely those of the individual author(s) and contributor(s) and not of MDPI and/or the editor(s). MDPI and/or the editor(s) disclaim responsibility for any injury to people or property resulting from any ideas, methods, instructions or products referred to in the content.