Article

An Analysis of the Impact of Government Subsidies on Emission Reduction Technology Investment Strategies in Low-Carbon Port Operations

1
School of Maritime Economics and Management, Dalian Maritime University, Dalian 116000, China
2
Collaborative Innovation Center for Transport Studies, Dalian Maritime University, Dalian 116000, China
*
Author to whom correspondence should be addressed.
Systems 2024, 12(4), 134; https://doi.org/10.3390/systems12040134
Submission received: 21 February 2024 / Revised: 29 March 2024 / Accepted: 12 April 2024 / Published: 16 April 2024
(This article belongs to the Special Issue Sustainable Supply Chain Management in a Global Context)

Abstract

:
The sustainable development of the maritime supply chain is an undeniable trend. Low-carbon port operations are a vital component of creating an eco-friendly maritime supply chain, requiring substantial investments in technologies that reduce carbon emissions. However, the key factors influencing investment decisions by ports and shipping companies in these green technologies, particularly government subsidies, remain poorly understood. Hence, this paper proposes a game-based framework to explore the impact of government subsidies. Through numerical analysis, this study first demonstrates that the pricing decisions, investment level, and profits of ports and shipping companies are sensitive to government subsidies and low-carbon preferences of the market; however, the influence of government subsidies and low-carbon preferences varies with different adopted investment strategies. Furthermore, investment decisions are mainly influenced by investment costs, low-carbon preferences, government subsidies, and cost-sharing ratios. Ports are more sensitive to government subsidies and low-carbon preferences while shipping companies are more sensitive to government subsidies and cost-sharing ratios. In addition, government subsidies and low-carbon preferences are substitutes for each other and can balance cost-sharing ratios between ports and shipping companies. Finally, recommendations are provided to the government, ports, and shipping companies for promoting low-carbon port operations based on the findings of this study.

1. Introduction

The international maritime supply chain plays a crucial role in global trade, accounting for 90% of the total trading volume [1]. Ports are important maritime supply chain nodes, driving worldwide economic and trade development, and promoting land and sea transportation. However, port operations are also a major contributor to air and marine pollution, posing a significant threat to human health and the environment [2]. According to a report by the International Maritime Organization, pollutant emissions from ships can cause a significant number of premature deaths worldwide, highlighting the need to limit these emissions [3]. According to the Greenhouse Gas Protocol (GHG Protocol), port carbon accounting encompasses the comprehensive assessment of carbon emissions originating from both ports and shipping entities during the provision of services within port vicinities [4]. Hence, the carbon footprint attributed to the ports under scrutiny in this study stems primarily from two pivotal sources: Firstly, during the docking phase, encompassing the intricate maneuvers from the ship’s arrival in port (anchoring and navigating towards the berth, cargo-handling operations) and subsequent departure, there is a notable emission of carbon [5]. Zis et al. (2014) elucidated the considerable potential of shore power systems in mitigating CO2 emissions by an impressive margin ranging from 48.0% to 70.0% for vessels berthed at ports [6]. Similarly, Sciberras et al. (2016) corroborated these findings, highlighting that the integration of shore power infrastructure alongside vessel operations can yield a noteworthy reduction of up to 40% in CO2 emissions [7]. Furthermore, carbon emissions stemming from land-based activities predominantly emanate from the operational activities of port-related equipment. Scholars often classify such endeavours aimed at curtailing emissions within the maritime supply chain as instances of low-carbon investment [8]. With the increase in carbon emissions from port operations, the damage to the coastal ecological environment and the pollution of near-shore waters have also gained increasing attention [2,9]. Therefore, the government and related companies are currently working towards reducing emissions for low-carbon port operations. Governments are enacting relevant laws and regulations to reduce emissions in port operations, and some countries, such as the US, Canada, and China, have established Emission Control Areas (ECAs) in their coastal regions [10,11]. On the other hand, the development of green technologies, such as tail gas scrubbers, liquefied natural gas (LNG), and shore power technology, offers opportunities for port operations to reduce emissions [12,13,14]. However, the heavy investment and retrofitting costs associated with these technologies make it challenging for ports and shipping companies to implement such technologies [15,16]. Consequently, understanding different parties’ behaviour of investing in emission reduction technology in low-carbon port operations has become a hot topic for academic research in recent years.
The government, ports, and shipping companies are the main players in port operations, but they make decisions independently, forming a mutual game system with the goal of maximising their own benefits. To this end, research on introducing game theory into the analysis of green emission reduction in port operations has gained significant momentum. Nash games [17,18], Stackelberg games [19,20], and evolutionary games [21,22] have already been successfully applied in studying green emission reduction in port operations and provided valuable insights.
Existing studies have identified government subsidies and low-carbon preferences as key factors that can influence the decision of ports and shipping companies to invest in emission-reduction technologies [14,23,24]. However, some key questions regarding government subsidies and other related factors are still not well answered:
(1)
When the government provides subsidies to a company (port or shipping company) that invests in emission reduction technology, how does this affect the company’s market behaviour and profits, and what impact does it have on other companies in the system?
(2)
How do government subsidies, low-carbon preferences, and cost-sharing factors influence the investment decisions of ports and shipping companies in carbon-reduction technologies, and is there an interaction between these factors?
(3)
How do these influences affect the evolution of ports’ and shipping companies’ carbon emissions reduction technology investment strategies?
To address the above issues, this paper develops a game framework to analyse the impact of government subsidies and related factors on the decision-making process of emission reduction investment strategies of ports and shipping companies. Compared with existing models, this framework examines the impact of various factors, including government subsidies, on the market prices and profits of ports and shipping companies, and explores the process of strategies evolution in the investment decisions of ports and shipping companies in emission reduction technologies.
The remainder of this paper is structured as follows. Section 2 provides a review of the relevant literature on low-carbon port operations research in terms of the impact of government subsidies, cost sharing, and applied game theoretic models. Section 3 describes the research questions of this paper. The proposed investment decision game framework that combines the Stackelberg game and the evolutionary game is described, solved and analysis in Section 4. In addition, Section 5 provides a discussion of the differences and connections between the findings of this paper and the existing literature. Finally, Section 6 presents the overall conclusions and identifies future research directions.

2. Literature Review

The existing literature related to this study mainly focuses on three areas: analysing the impact of government subsidies in low-carbon port operations, research on cost-sharing mechanisms in low-carbon port operations, and how game theories can be applied to analysing low-carbon port operations.

2.1. Government Subsidies in Low-Carbon Port Operations

Government subsidies are an effective macro-control method for reducing emissions in low-carbon port operations [25,26,27]. Recent studies have incorporated a range of factors, such as low-carbon preferences [14,28,29], carbon trading mechanisms [18,24,29], carbon taxes [23,30,31], and information-sharing mechanisms [20,32,33], into their analyses, in order to better understand the complex interplay between government subsidies and other key drivers of sustainable practices in the maritime industry. Furthermore, existing studies have also attempted to analyse the relationship and interactions between factors. Chen et al. (2020) [19] proposed an optimisation model for a coastal transportation system, concluding that government subsidies and reasonable tax plans for highway and waterway transportation can significantly reduce carbon emissions without increasing freight rates. Zhou (2022) [16] analysed the interactive effects of government subsidies and low-carbon preferences on emission control technology decisions in low-carbon port operations. Hu and Wang (2022) [34] analysed the impact of government subsidies and low-carbon preferences on low-carbon production technology adoption in the manufacturing industry. However, there are few studies on the interactions between factors under different port and shipping company investment strategies, and they do not take into account the cost-sharing mechanisms when ports and shipping companies invest in emission-reduction technologies.

2.2. Application of Game Theories in Analysing the Low-Carbon Port Operations

The government, ports, and shipping companies make independent decisions and engage in a mutual game to maximise their interests, naturally forming a game. Consequently, the use of game theory to investigate green emission reduction in low-carbon port operations has gained considerable traction. Currently, the game theories commonly applied in analysing low-carbon port operations include traditional game theories (the Nash game [17,18], the Stackelberg game [19,20,35], and the evolutionary game [21,22,36].

2.2.1. Application of Traditional Game Theories in Analysing Low-Carbon Port Operations

Most of the literature applied traditional game theories to study the impact of relevant factors on the decisions in low-carbon port operations. Yang et al. (2019) [18] conducted a study on low-carbon operational technology options for port operations, which included ports and shipping companies operating under a cap-and-trade program. The authors developed two Stackelberg game models and a Nash game model to analyse the optimal investment strategies for sustainable operations [37]. Zhou and Zhang (2022) [14] expanded this research by also considering low-carbon preferences in their analysis [16]. Particularly, some research has applied traditional game theories to consider the impact of government subsidies in the analysis of low-carbon port operations [26,38]. Wang et al. (2022) [25] outlined a Stackelberg game theory model for optimising government subsidies for Shore Side Electricity (SSE) adoption in the Port of Shanghai, providing insights into the prioritisation of subsidies on ships and identifying factors that should be subsidized. As technology becomes more advanced and information becomes more accessible and accurate, information-sharing mechanisms in port operations have been studied [20,32]. However, the above-mentioned literature often analyses these factors in isolation, and the analysis of multiple factors is lacking. Therefore, these studies cannot fully describe the decision-making behaviour of game players.

2.2.2. Application of Evolutionary Game in Analysing Low-Carbon Port Operations

With the development of game theory research, scholars have found that equilibrium strategies between participants are not formulated at a fixed time, but are formed in the process of continuous learning and dynamic adjustment, which leads to the application of evolutionary games. Lin et al. (2021) [39] developed a pricing decision model that considers price elasticity, market competition, green investment, and market concern for greenness. They proposed an evolutionary game-theoretic framework embedded in the pricing model to study the long-term green strategic behaviour of maritime shipping companies. Long et al. (2021) [40] developed a general evolutionary game model consisting of green-sensitive governments, companies, and consumers, revealing that green sensitivity had a significant effect on the stabilisation strategy of the model [41,42]. Li et al. (2020) [13] studied a two-tier port operation system, consisting of ports and shipping companies, under government green subsidies. Their research explored the mechanisms of government green subsidies and their impact [23,43]. Huang et al. (2023) [24] used a dynamic game model to study a three-level maritime supply chain addressing carbon reduction and low-carbon service investments, influenced by government policies and social preferences [34]. While their findings reveal the impact of these key factors on investing in low-carbon emission reduction technologies, the study does not delve into the intricate interactions between these factors, leaving room for further investigation.

2.3. Cost Sharing in Low-Carbon Port Operations

As research on system theory deepens, the supply chain is increasingly perceived as a complex system, prompting scholars to focus on the organic coordination among its various entities. Within this realm, cost sharing emerges as a pivotal mechanism for supply chain coordination, drawing significant scholarly attention. Numerous studies have meticulously examined cost-sharing dynamics between wholesalers and retailers in the manufacturing supply chain [44,45]. Ni et al. (2010) found that suppliers can share costs with downstream members of the supply chain by setting reasonable wholesale prices by examining the investment costs of CSR [46]. In tandem with the growing imperative of energy conservation and emissions reduction, scholars are delving deeper into the application of cost-sharing mechanisms within low-carbon supply chains [47,48]. Yang and Gong (2021) studied green supply chain decision making and coordination under retailers’ reciprocal preferences and found that cost-sharing contracts play a positive role in improving the environmental and economic performance of green supply chains [49]. Moreover, the burgeoning discourse on low-carbon maritime supply chains has garnered considerable academic attention, with a specific focus on supply chain coordination mechanisms, notably cost sharing [50]. Huang et al. (2023), in their analysis of long-term strategic behaviours among ports, shipping companies, and freight forwarders within the ambit of cost-sharing mechanisms, delineated a three-tier maritime supply chain scenario. Their findings underscored how shipping companies can foster mutually beneficial outcomes and enhance decision-making stability by equitably distributing the costs associated with carbon emission reduction efforts in ports [24]. Furthermore, Xue et al. (2023) underscored the pivotal role of cost-sharing mechanisms as determinants for investment in decarbonization technologies within collaborative green port operations. Their findings highlight how such mechanisms shape investment behaviours and cooperation dynamics in the pursuit of sustainable maritime operations [51].

2.4. Summary

This paper has identified two major research gaps based on the review of the two streams of literature. Firstly, in terms of research content, there are fewer studies existing in the literature about the impact of government subsidies under different investment strategies of ports and shipping companies. In addition, with the development of the “systems concept”, a cost-sharing mechanism in port operations is becoming more favoured by companies, but this factor has received limited attention in strategic investment studies of emission reduction technology in ports and shipping companies.
Secondly, in terms of research methods, the existing literature on the emission reduction problem of ports and shipping companies has primarily adopted a single-game approach, part of which adopts the traditional game to study the relationship between pricing, profit, and related variables of ports and shipping companies, and part of which adopts the evolutionary game to study the strategy choice of ports and shipping companies. However, in practice, both the port and the shipping company have limited rationality. The port and shipping company decides whether to invest in emission reduction technologies based on profit maximisation. Therefore, it is not enough to study the strategy selection problem by using only the traditional game, and the relationship between the strategy selection results and the variables cannot be portrayed by using only the evolutionary game.
To address the above-mentioned gaps, this paper proposes a game-based investment framework that considers a port-dominated secondary port operation system, which transitions from a Stackelberg game to a dynamic evolutionary game. This framework considers government subsidies and low-carbon preferences, as well as cost-sharing ratios, to provide a more comprehensive analysis of the investment strategy for emission reduction in low-carbon port operations. Table 1 shows the differences between this study and other relevant studies.

3. Problem Description

This paper delves into the intricate dynamics among stakeholders within the maritime supply chain, encompassing the government, the port terminal operator, the shipping company, and cargo owners. The government plays a pivotal role by offering subsidies to entities embracing carbon emission reduction technologies, whether it be the port terminal operator or the shipping company. The preferences of cargo owners for low-carbon transport significantly influence market demand, thereby impacting the volume of transport required. Subsequently, both the port terminal operator and the shipping company are driven by the objective of maximising profits. In the ensuing discussion, we will elucidate the decision-making processes inherent to both the port terminal operator and the shipping company.
The port terminal operator needs to determine the pricing at which the port call services are provided to shipping companies. This pricing is influenced by various factors, such as the extent of government subsidies and the volume of services subscribed to by the shipping companies, which reflects the demand for handling operations received by the port.
In the maritime supply chain, the shipping company acts as an intermediary, collecting fees from cargo owners and remitting payments to the port terminal operator for services rendered. The port terminal operator receives compensation from the shipping company for various port-related activities, such as loading, unloading, and storage. These costs are factored into the fees charged by the shipping company to cargo owners, shaping their pricing strategies. Consequently, port services emerge as a critical commodity in this ecosystem. By applying a traditional service supply chain framework, we view the shipping company as a retailer of port services, tasked with wholesaling these services to shippers and determining the market price. This abstraction facilitates the examination of the direct influence of port services on the shipping market, simplifying the analysis without compromising the equilibrium of the model [52]. While this approach streamlines the investigation, it is important to acknowledge that port services are often subject to tariffs, although this aspect lies beyond the scope of our study and will not be reiterated here.
Based on the above discussion, this paper gives a schematic diagram of the relationship between various stakeholders in the maritime supply chain, as shown in Figure 1 (the solid line represents the behaviour of the decision and the dashed line represents the effect of the decision).
However, the decision-making process of the port terminal operator and the shipping company regarding investment in carbon-reduction technologies is not immediate but rather occurs over a long period in response to market changes and adjustments in government subsidies. This game ultimately leads to a stable decision being formed at a specific point in time. As a result, this decision-making behaviour can be effectively modelled as an evolutionary game, which can provide insights into the dynamics of the shipping industry and guide policy interventions aimed at promoting sustainable practices.

4. Methods

This paper develops a game framework that both derives port and shipping company payoff functions and describes the evolution of the decision-making process in ports and shipping companies.

4.1. Framework Descriptions

The framework, as described in Figure 2, comprises a Stackelberg model at the bottom and an evolutionary model at the top, facilitating a comprehensive understanding of the interrelated dynamics between these entities.
At the bottom of the framework, the pricing, cost-sharing, and investment decisions of ports and shipping companies are influenced by government subsidies and the market’s low-carbon preferences, and the game between the two parties is modelled as a Stackelberg game, considering their dominant–subordinate relationship. Ports and shipping companies will make different decisions regarding investment in carbon emission reduction technology, namely to invest or not to invest. In this paper, investment is denoted by “Y” and non-investment is denoted by “N”, the investment choices of ports and shipping companies will form four strategic combinations (ports, shipping companies), namely (N, N), (Y, N), (N, Y), and (Y, Y). Therefore, the optimal solution under different strategies is derived and input as a payoff function into the top-level evolutionary game model, forming a payoff matrix regarding investment in emission reduction technology. On the top level, an evolutionary game model is established to analyse the evolution of ports’ and shipping companies’ investment strategies in emission reduction technology.
Overall, this framework offers a sophisticated and multi-faceted approach to the evaluation of investment decisions related to carbon-reduction technologies, thereby providing insights into the optimal strategies that can be employed by ports and shipping companies to enhance their profitability and promote sustainable practices and the influence of key factors on the optimal strategies.

4.2. Notations and Assumptions

Table 2 lists the notations and this study is based on the following assumptions.
Assumption 1. 
The port charges the shipping company  q  for its services, and its marginal cost is assumed to be zero according to [32]. On the other hand, the shipping company charges the shipper  p  for the market price for port service, and its marginal profit is denoted as  m . Therefore, using the above notations, we can express the pricing equation of the shipping company as (1).
p = q + m
Assumption 2. 
In this model, the market demand is assumed to be linearly related to the shipping company’s market price for port service p . Furthermore, the government’s low-carbon promotion has a positive influence on shippers’ green and low-carbon preferences, which in turn affects the market demand [24,41]. Hence, the demand function can be expressed as a function of the carbon reduction level of the port and shipping supply chain, as shown in Equation (2).
Q = a b p + θ e
Assumption 3. 
The port and shipping company incur investment costs of   1 2 η e 2  when investing in emission-reduction technology [16,32,53,54].
Assumption 4. 
When both parties invest in emission-reduction technology, they enter into a cost-sharing contract where the port bears a proportion of the cost, denoted as   α , and the shipping company bears the remaining proportion, denoted as  1 α  [29].
Assumption 5. 
When the port or shipping company invests in emission-reduction technology, the government provides a certain amount of low-carbon subsidy, which increases the revenue gained per unit of a product by  n  [55].
Assumption 6. 
Both the port and the shipping company are independent economic entities that make investment decisions based on their profit maximisation goals, without being influenced by other factors.
Assumption 7. 
Entities in port operations may have short-sighted perspectives and limited decision-making capabilities, which can lead to suboptimal decisions due to incomplete or imperfect information [13,39,40].

4.3. Model Solving

4.3.1. The Embedded Stackelberg Game Model

This section initially defines the profit functions of ports and shipping companies for varying strategies, as demonstrated in Table 3.
To make all equilibrium solutions positive and at the same time ensure the existence of optimal solutions (the Hessian matrix is negative definite), according to Appendix A, we can conclude that η > m a x θ 2 2 b , θ 2 4 b α . Therefore, the order of computation under different strategies is determined according to the computational rules of the Stackelberg inverse solution method. The decision variables and profit results of the four strategies are solved by using Stackelberg’s inverse solution method, as shown in Table 4 and Table 5.

4.3.2. The Complete Evolutionary Game Model

Assuming that the proportion of shipping companies adopting emission-reduction technology (Y) is x (0 ≤ x ≤ 1), the proportion of not applying emission-reduction technology (N) is 1 x . Meanwhile, assuming that the proportion of ports applying emission-reduction technology (Y) is y (0 ≤ y ≤ 1), the proportion of not applying emission-reduction technology (N) is 1 y , as shown in Table 6, where the function expressions are shown in Table 4.
The expected payoff functions for the “investment” and “non-investment” strategies adopted by the port are represented by Equations (3) and (4), and the average expected payoff function is represented by Equation (5).
f p Y = x π p Y Y + 1 x π p Y N
f p N = x π p N Y + 1 x π p N N
f p = y f p Y + 1 y f p N
The expected payoff functions for shipping companies adopting “investment” and “non-investment” strategies are represented by Equations (6) and (7), and the average expected payoff function is represented by Equation (8).
f s Y = y π s Y Y + 1 y π s N Y
f s N = y π s Y N + 1 y π s N N
f s = x f p Y + 1 x f p N
Therefore, the dynamic replication equations of the port and shipping company are represented by Equations (9) and (10), respectively.
f y = d y d t = y 1 y x π p Y Y π p N Y + 1 x π p Y N π p N N
f x = d x d t = x 1 x y π s Y Y π s Y N + 1 y π s N Y π s N N
If Equations (9) and (10) are equal to zero, it means that the system will no longer evolve and achieve equilibrium. Therefore, the above replicator dynamics system has five stable equilibrium points: (1) (0,0); (2) (0,1,); (3) (1,0); (4) (1,1); and (5) ( x * , y * ), where x * = π p N N π p Y N π p Y Y + π p N N π p Y N π p N Y , y * = π s N N π s N Y π s Y Y + π s N N π s Y N π s N Y .
The Jacobi matrix of the above differential equation is as follows:
J = 1 2 x y π s Y Y π s Y N + 1 y π s N Y π s N N x 1 x π s Y Y π s Y N + π s N Y π s N N y 1 y π p Y Y π p N Y + π p Y N π p N N 1 2 y [ ( x π p Y Y π p N Y + 1 x π p Y N π p N N
The local stability of the system at the equilibrium point solved by replicating the dynamic equations is determined by analysing the local stability of the corresponding Jacobian matrix of the system. For discrete systems, the following two conditions need to be satisfied [18,30,31]:
det J = | j 11 j 12 j 21 j 22 | = j 11 j 22 j 12 j 21 > 0 t r J = j 11 + j 22 < 0
The five equilibrium points are substituted into the Jacobian matrix J in turn, and the local stability analysis of the equilibrium points will be obtained, as shown in Table 7.
If η < a + 2 b n 2 1 α θ 2 2 b α 2 a + 2 b n 2 a + b n 2 , ports are likely to invest in carbon-reduction technologies to reap benefits, while shipping companies may engage in “free-riding” behaviour and be less active in pursuing a low-carbon economy. As shown in Figure 3 (Scenario 1), the final evolutionary stabilisation strategy, in this case, is for the port to adopt emission-reduction technology and the shipping company to not adopt it. If η < a 2 2 α 1 + 2 a b n 4 α 1 + b 2 n 2 8 α 1 θ 2 4 b 2 n 2 a + 3 b n α , as shown in Figure 3 (Scenario 2), the final evolutionary stabilisation strategy is for shipping companies to adopt carbon-reduction technologies and for ports to not adopt them. If η < a + 2 b n 2 1 α θ 2 2 b a + b n 2 a + 2 b n 2 α 2 , as shown in Figure 3 (Scenario 3), the final evolutionary stabilisation strategy is for both parties to invest in carbon-reduction technologies at the same time.
Comparing the scenarios above, it is clear that the value of η has a significant impact on the evolution of investment in emission-reduction technology in port operations. Thus, the magnitude of the investment cost is an important factor for ports and shipping companies to invest in carbon emission-reduction technologies. It is evident that the size of the investment cost is influenced by market green preference, government subsidies, and cost-sharing ratios. Therefore, the numerical analysis will be used to investigate the impact of these factors further.

4.4. Results

This section conducts numerical experiments based on the proposed framework to answer the key questions raised in this study and provides recommendations for governments, ports, and shipping companies to effectively reduce pollution emissions. According to the relevant literature and the requirements of this paper, this study sets the parameter values of the model as shown in Table 8.

4.4.1. Analysis of the Effects of Government Subsidies and Low-Carbon Preferences on Different Subjects

This section analyses the impact of government subsidies and low-carbon preferences on decision variables and profits of the port and the shipping company.
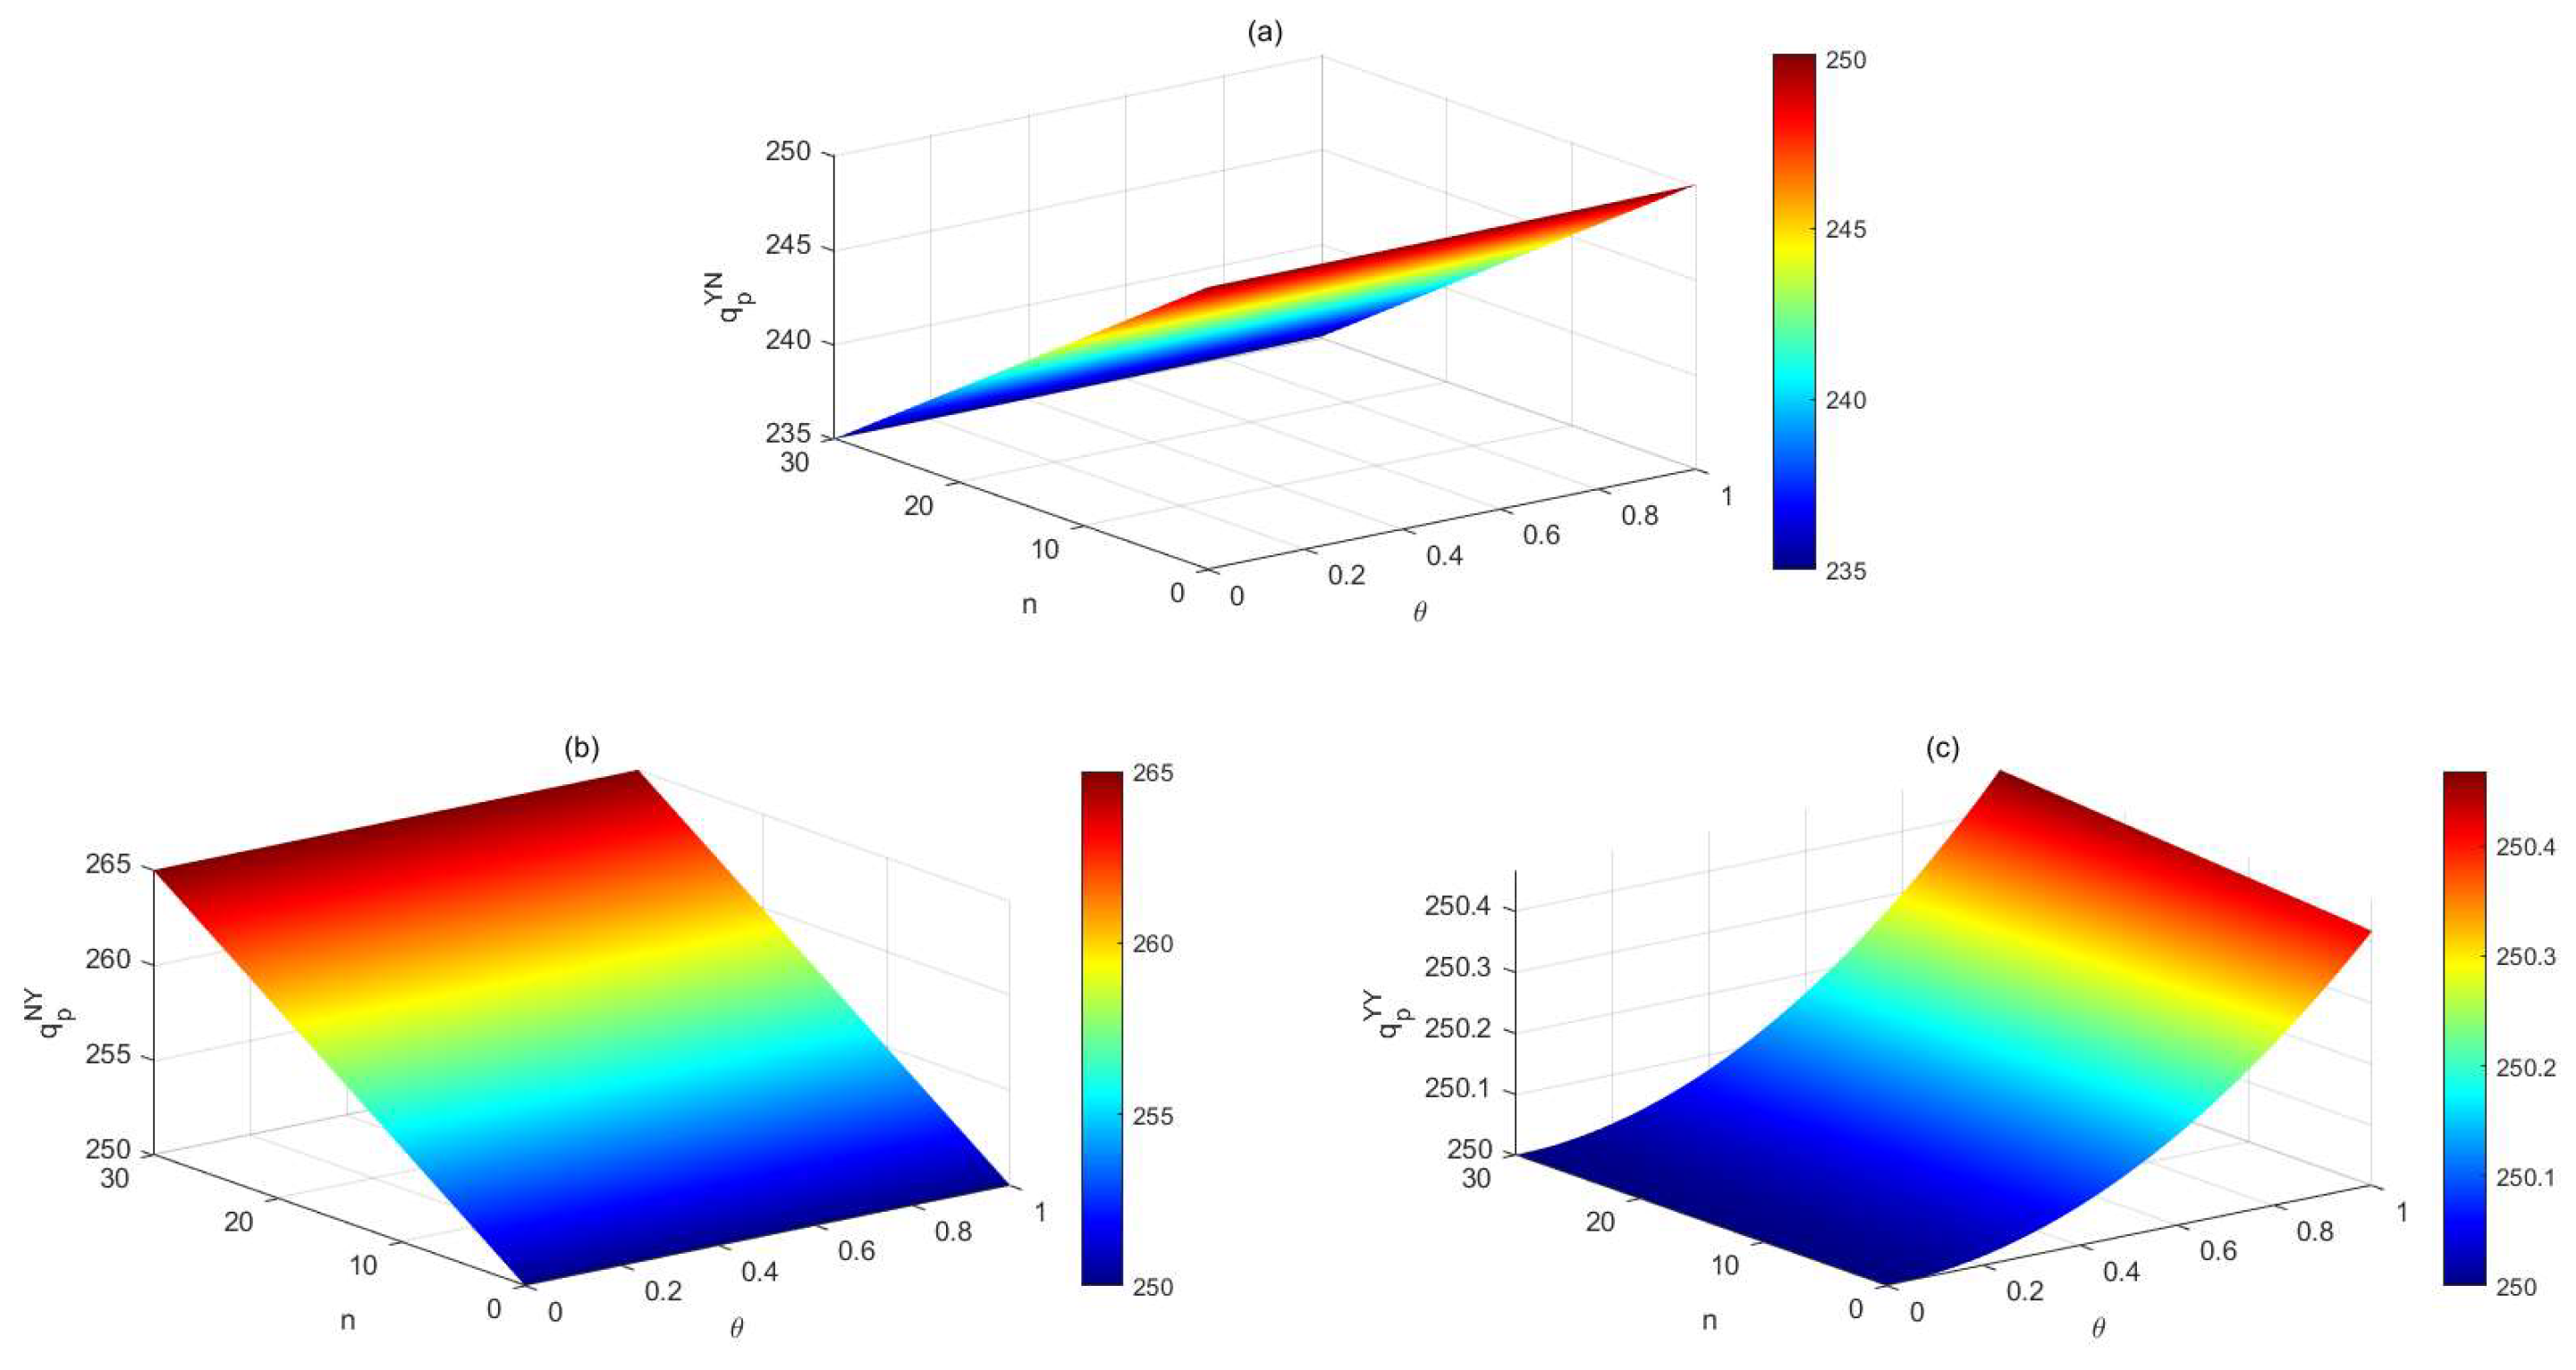
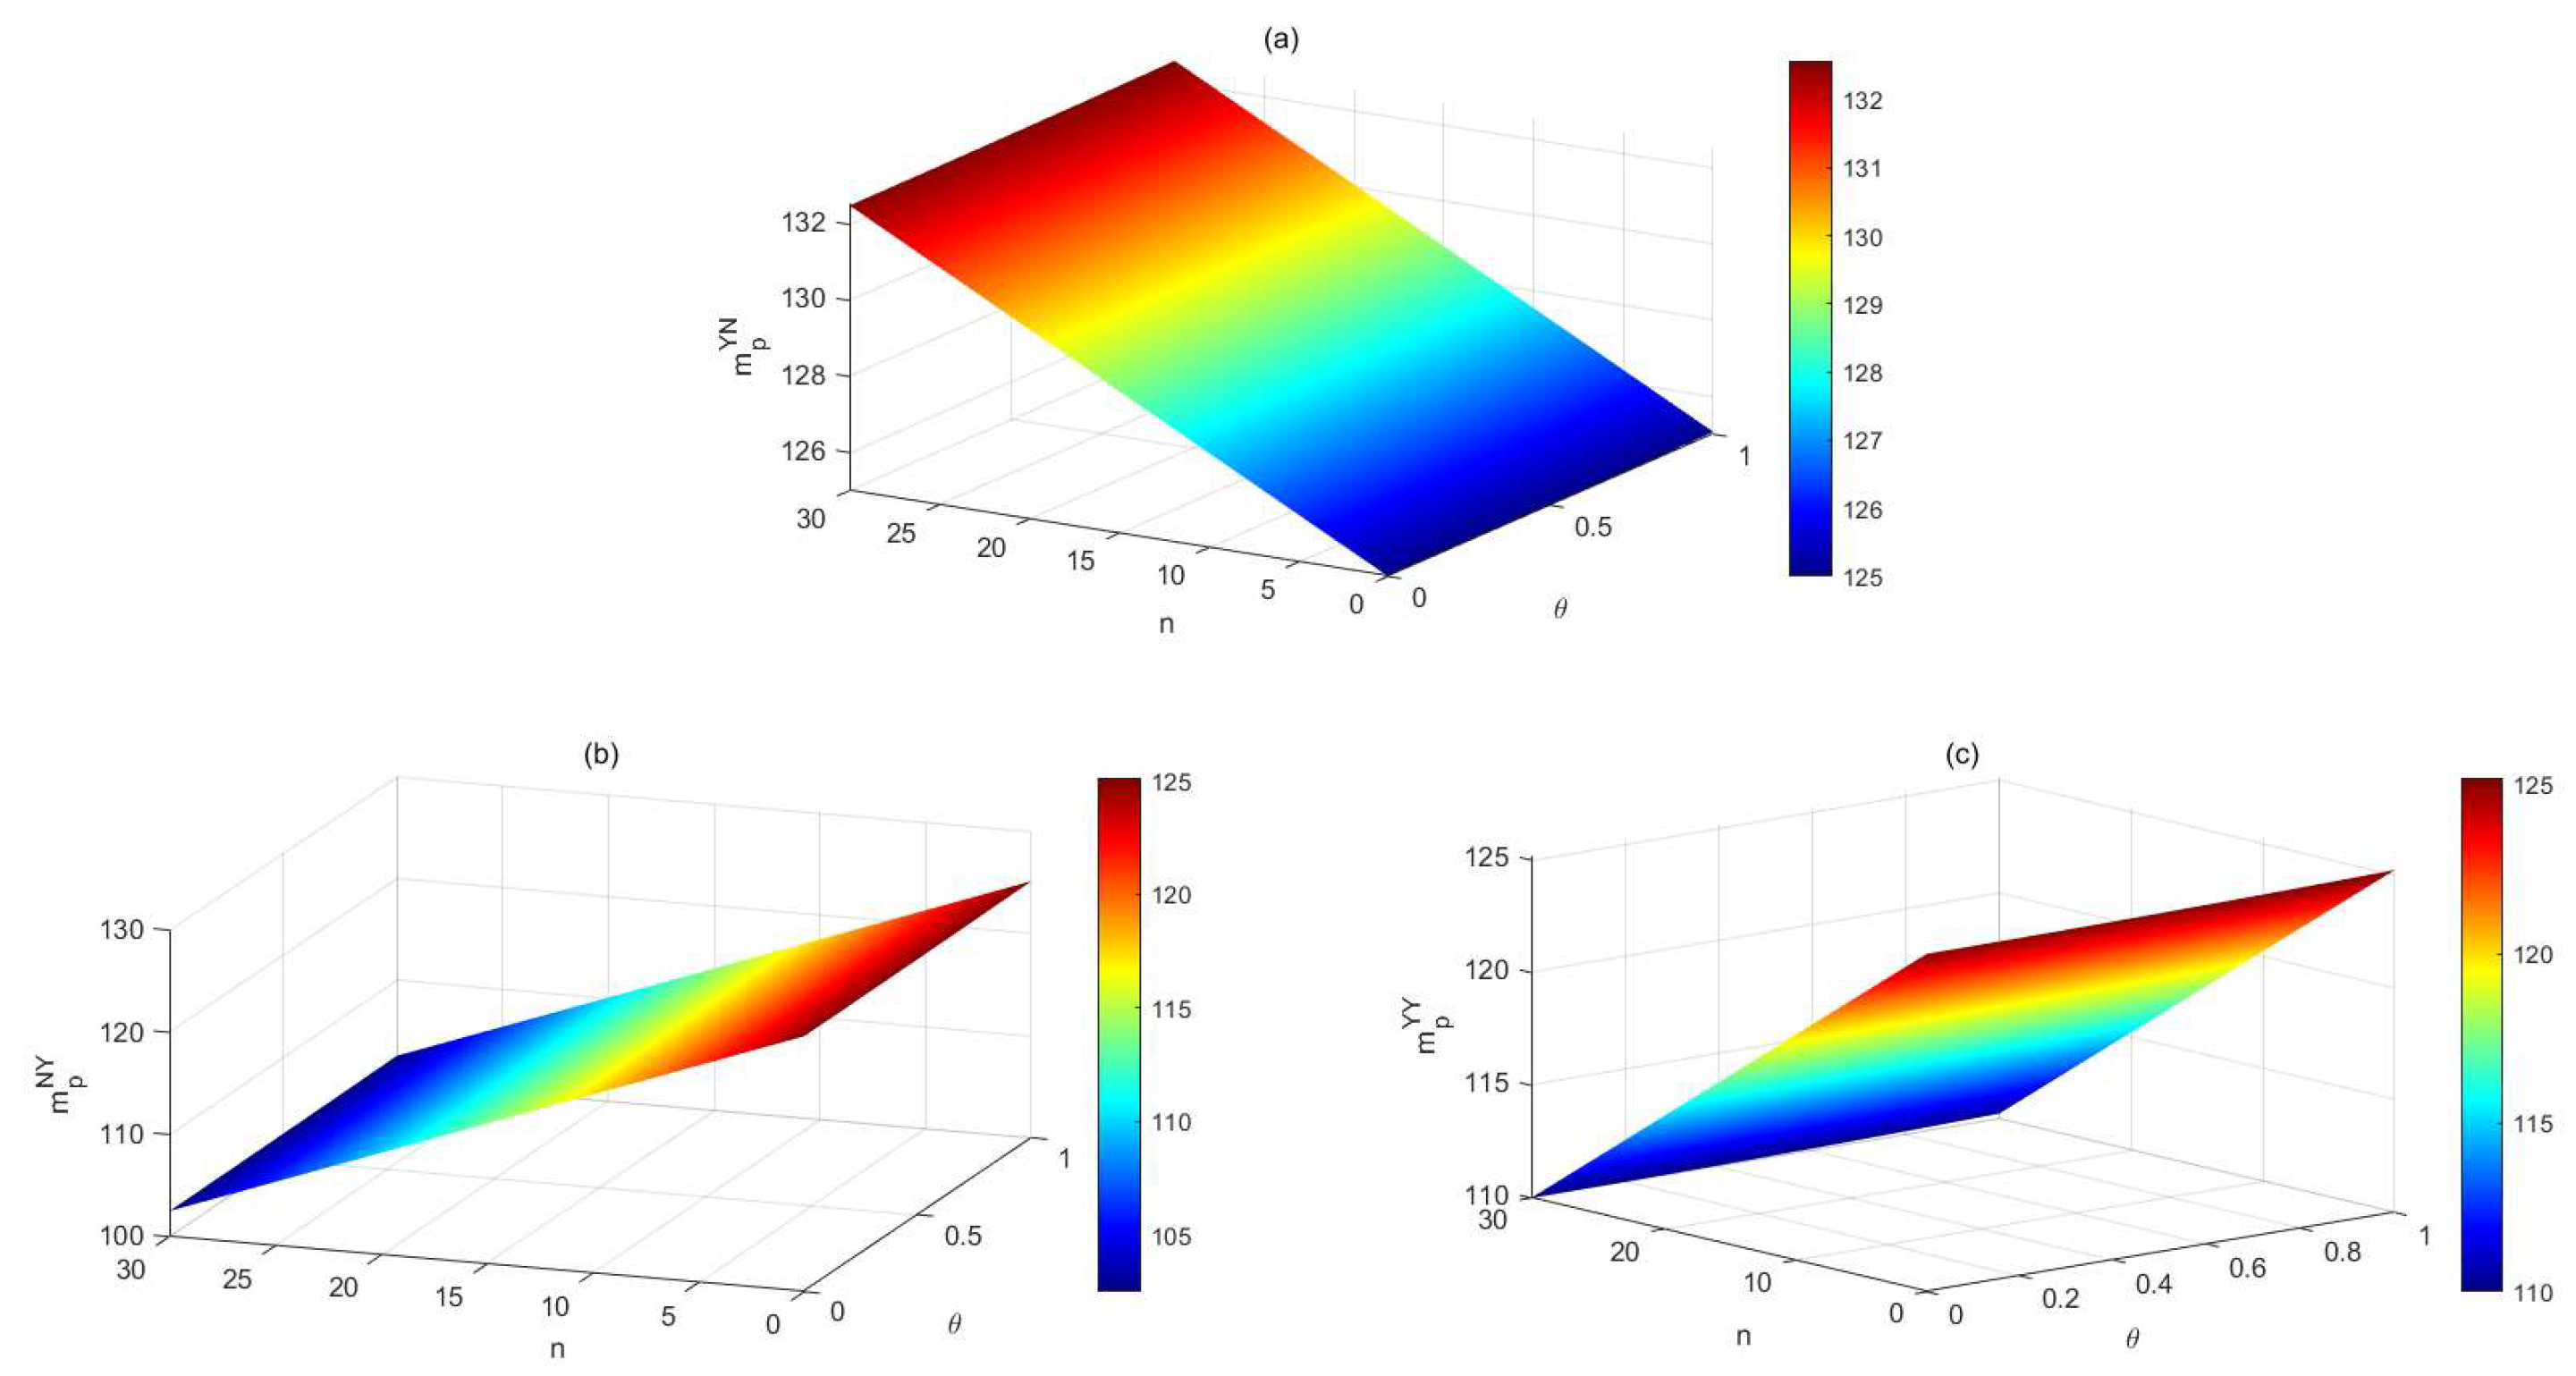
Figure 4 illustrates the relationship between government subsidies n and low-carbon preferences θ on port service price q under three different investment strategies denoted as (Y, N), (N, Y), and (Y, Y), where each strategy is represented by a three-dimensional cubic plot with the price of port service q on the Z-axis and government subsidies n and low-carbon preferences θ on the X- and Y-axes, respectively. The figure reveals that the effects of government subsidies and low-carbon preferences on the service prices of ports vary under different strategies. As shown in Figure 4a, when the market’s green demand is low, the government subsidy compensates part of the port’s investment in emission-reduction technology, leading to a relatively low service price. However, as the green demand in the market increases, even with the government subsidy, the port will increase its service price to maximise benefits. In Figure 4b, the sensitivity of the service price of ports varies in response to different factors. Specifically, the service price of ports tends to be more sensitive to government subsidies, namely it increases with the level of government subsidies provided. However, it is generally not as sensitive to low-carbon preferences in the market. In Figure 4c, both parties jointly invest in emission-reduction technology. When the government subsidizes both parties, the price of the port’s services increases gradually with low-carbon preferences and is not sensitive to subsidies.
In Figure 5, the relationship between government subsidies, low-carbon preferences, and the marginal profits of shipping companies m is depicted through three three-dimensional cubic plots, each representing a different investment strategy denoted as (Y, N), (N, Y), and (Y, Y), with the marginal profit on the Z-axis and government subsidy and low-carbon preference on the X- and Y-axes, respectively. Figure 5a shows that the marginal profit of shipping companies increases with the increase in government subsidies under the strategy (Y, N). This is because the price of services paid by shipping companies to ports decreases due to government subsidies. In contrast, Figure 5b illustrates that the marginal profit of shipping companies is inversely related to the government subsidy under the strategy (N, Y). As the government subsidy increases, the shipping company needs to reduce the price of transportation to obtain the green market demand. Finally, in Figure 5c, the shipping company’s marginal profit increases with the low-carbon preference increase under the strategy (Y, Y). This is because shipping companies can charge a higher price for their low-carbon transportation services in response to the growing demand for environmentally friendly shipping options.
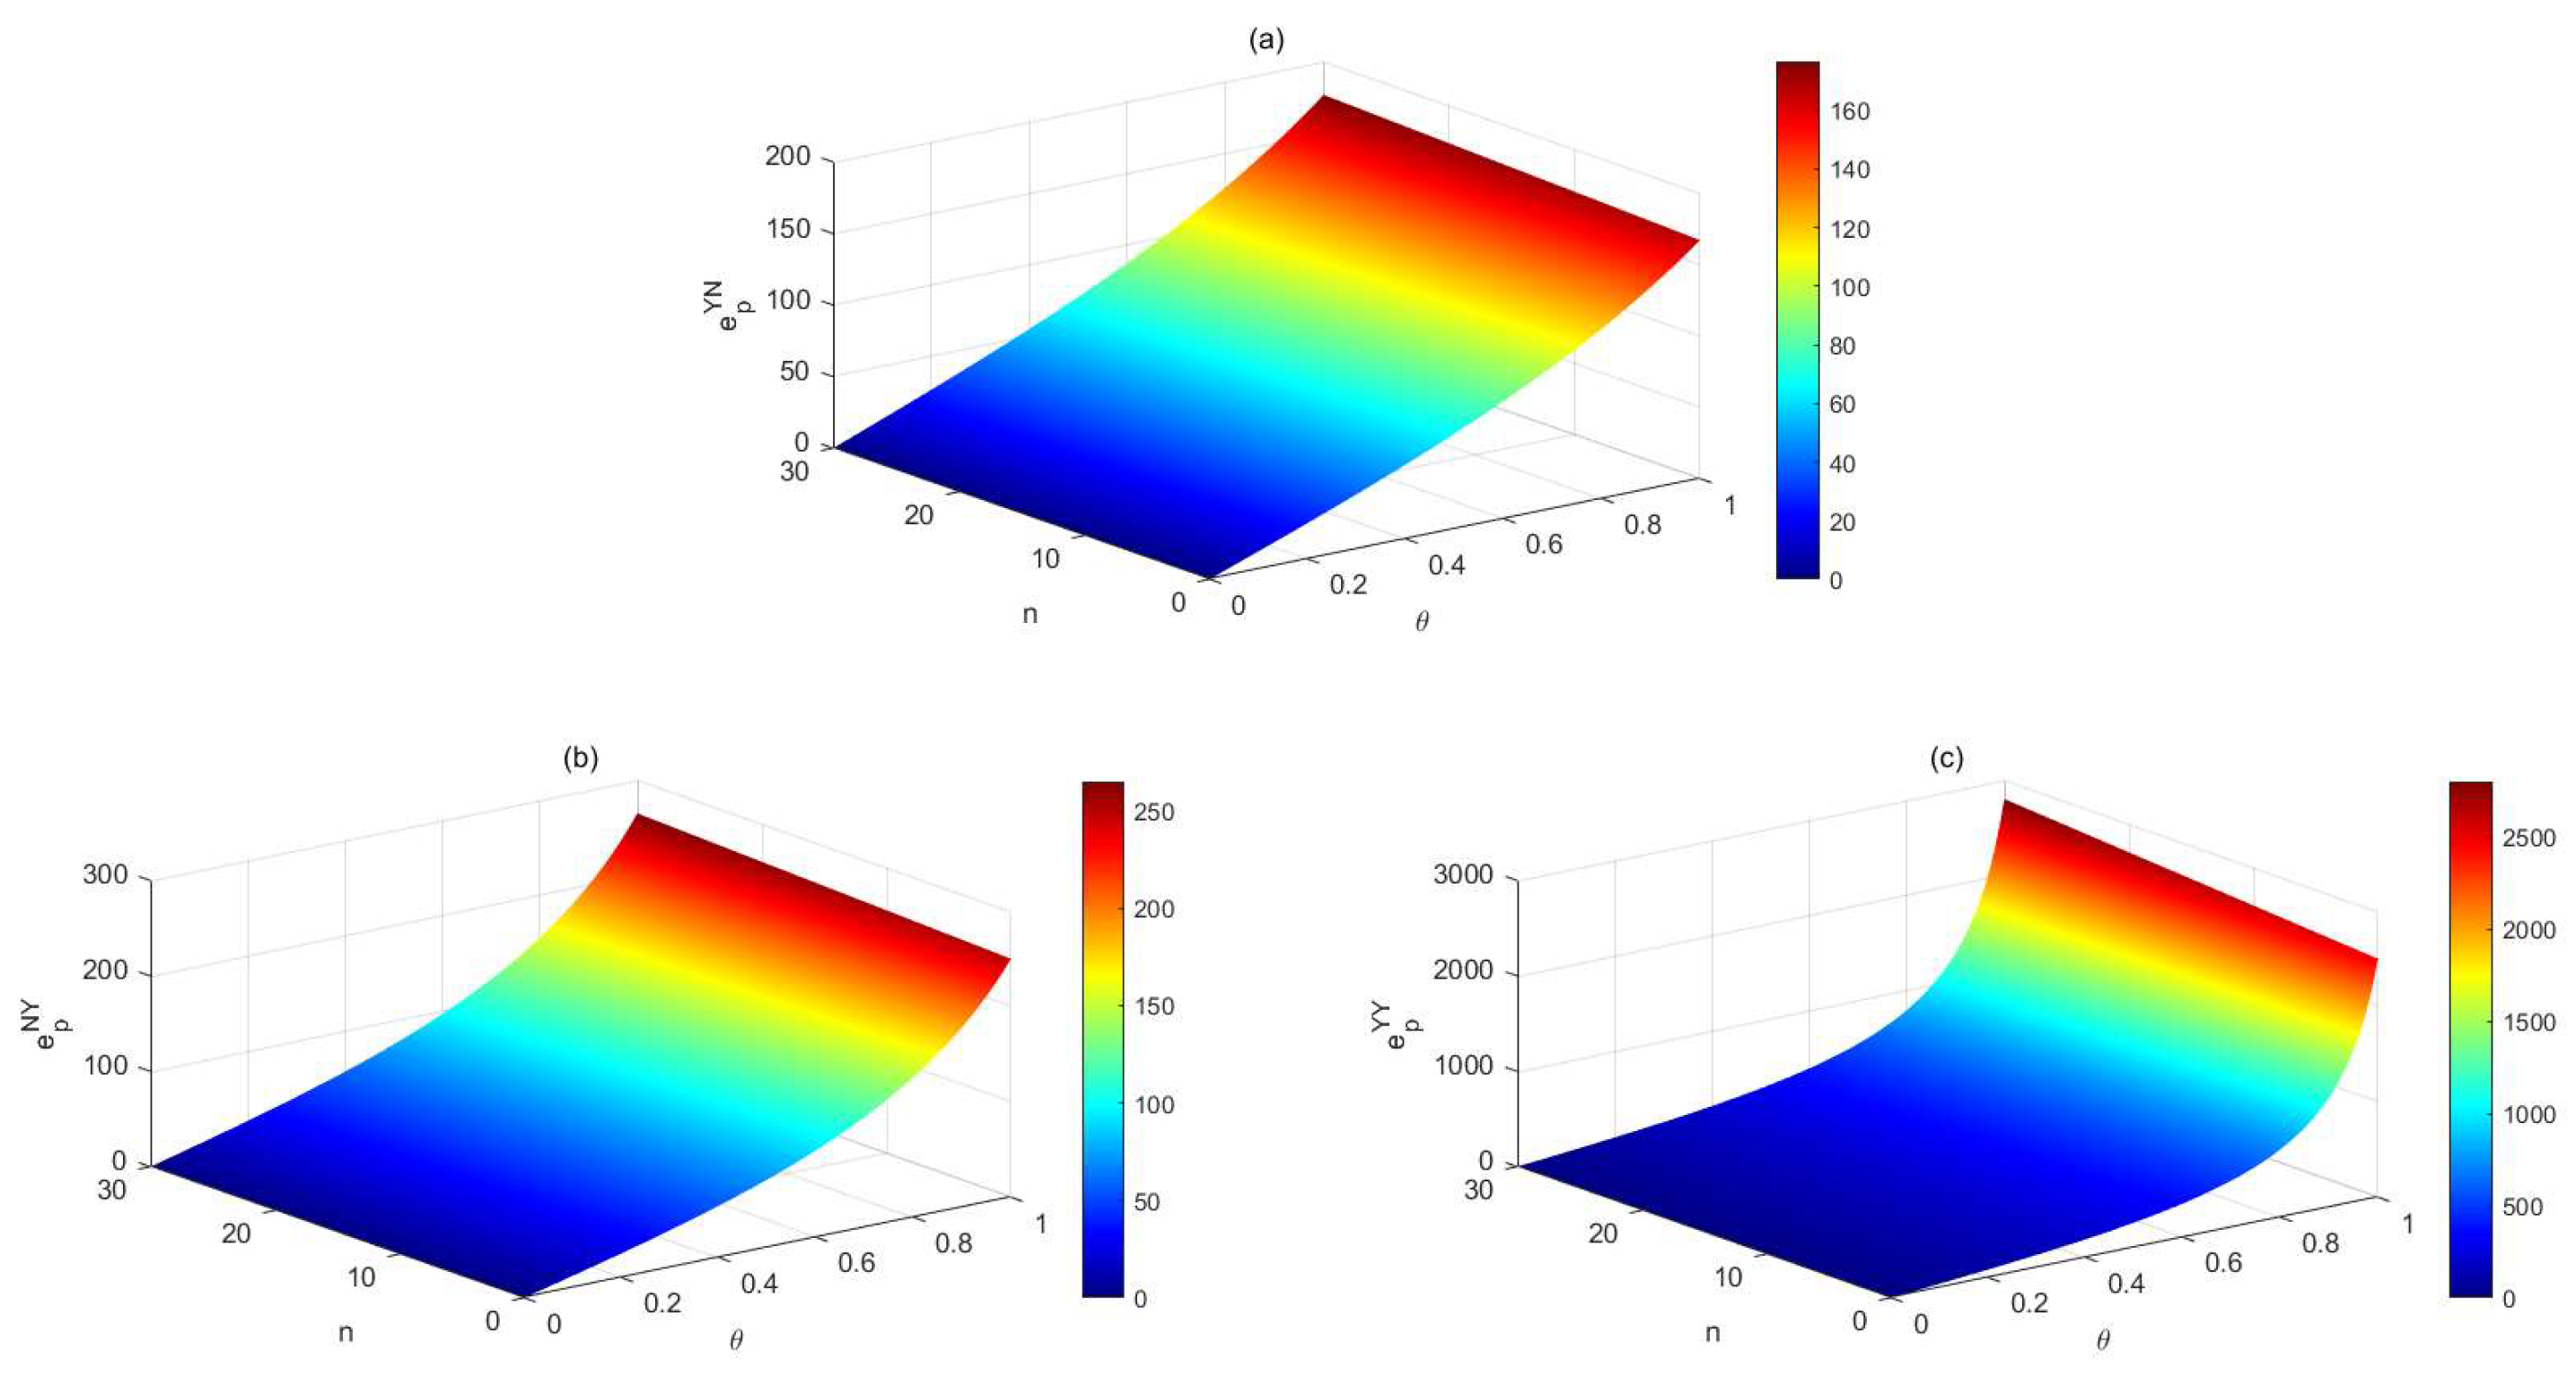
Figure 6 reveals a strong positive relationship between the increase in the level of investment and the low-carbon preference of the market. In Figure 6, the three subplots represent the effects of the two variables, government subsidies and low carbon preference, on the level of investment in carbon emission-reduction technologies under the strategies (Y, N), (N, Y) and (Y, Y), respectively. Figure 6a and Figure 6b show single-party investment with a maximum investment level of 300, respectively. On the other hand, Figure 6c illustrates that the investment level is as high as 2000 when both parties invest together. This phenomenon may be due to the fact that the cost pressure borne by the port and shipping companies when they invest alone is too great, whereas when they invest jointly, the cost pressure is shared by both parties and the level of investment is naturally higher. This finding underscores the significant impact of joint efforts between ports and shipping companies on promoting low-carbon port operations.
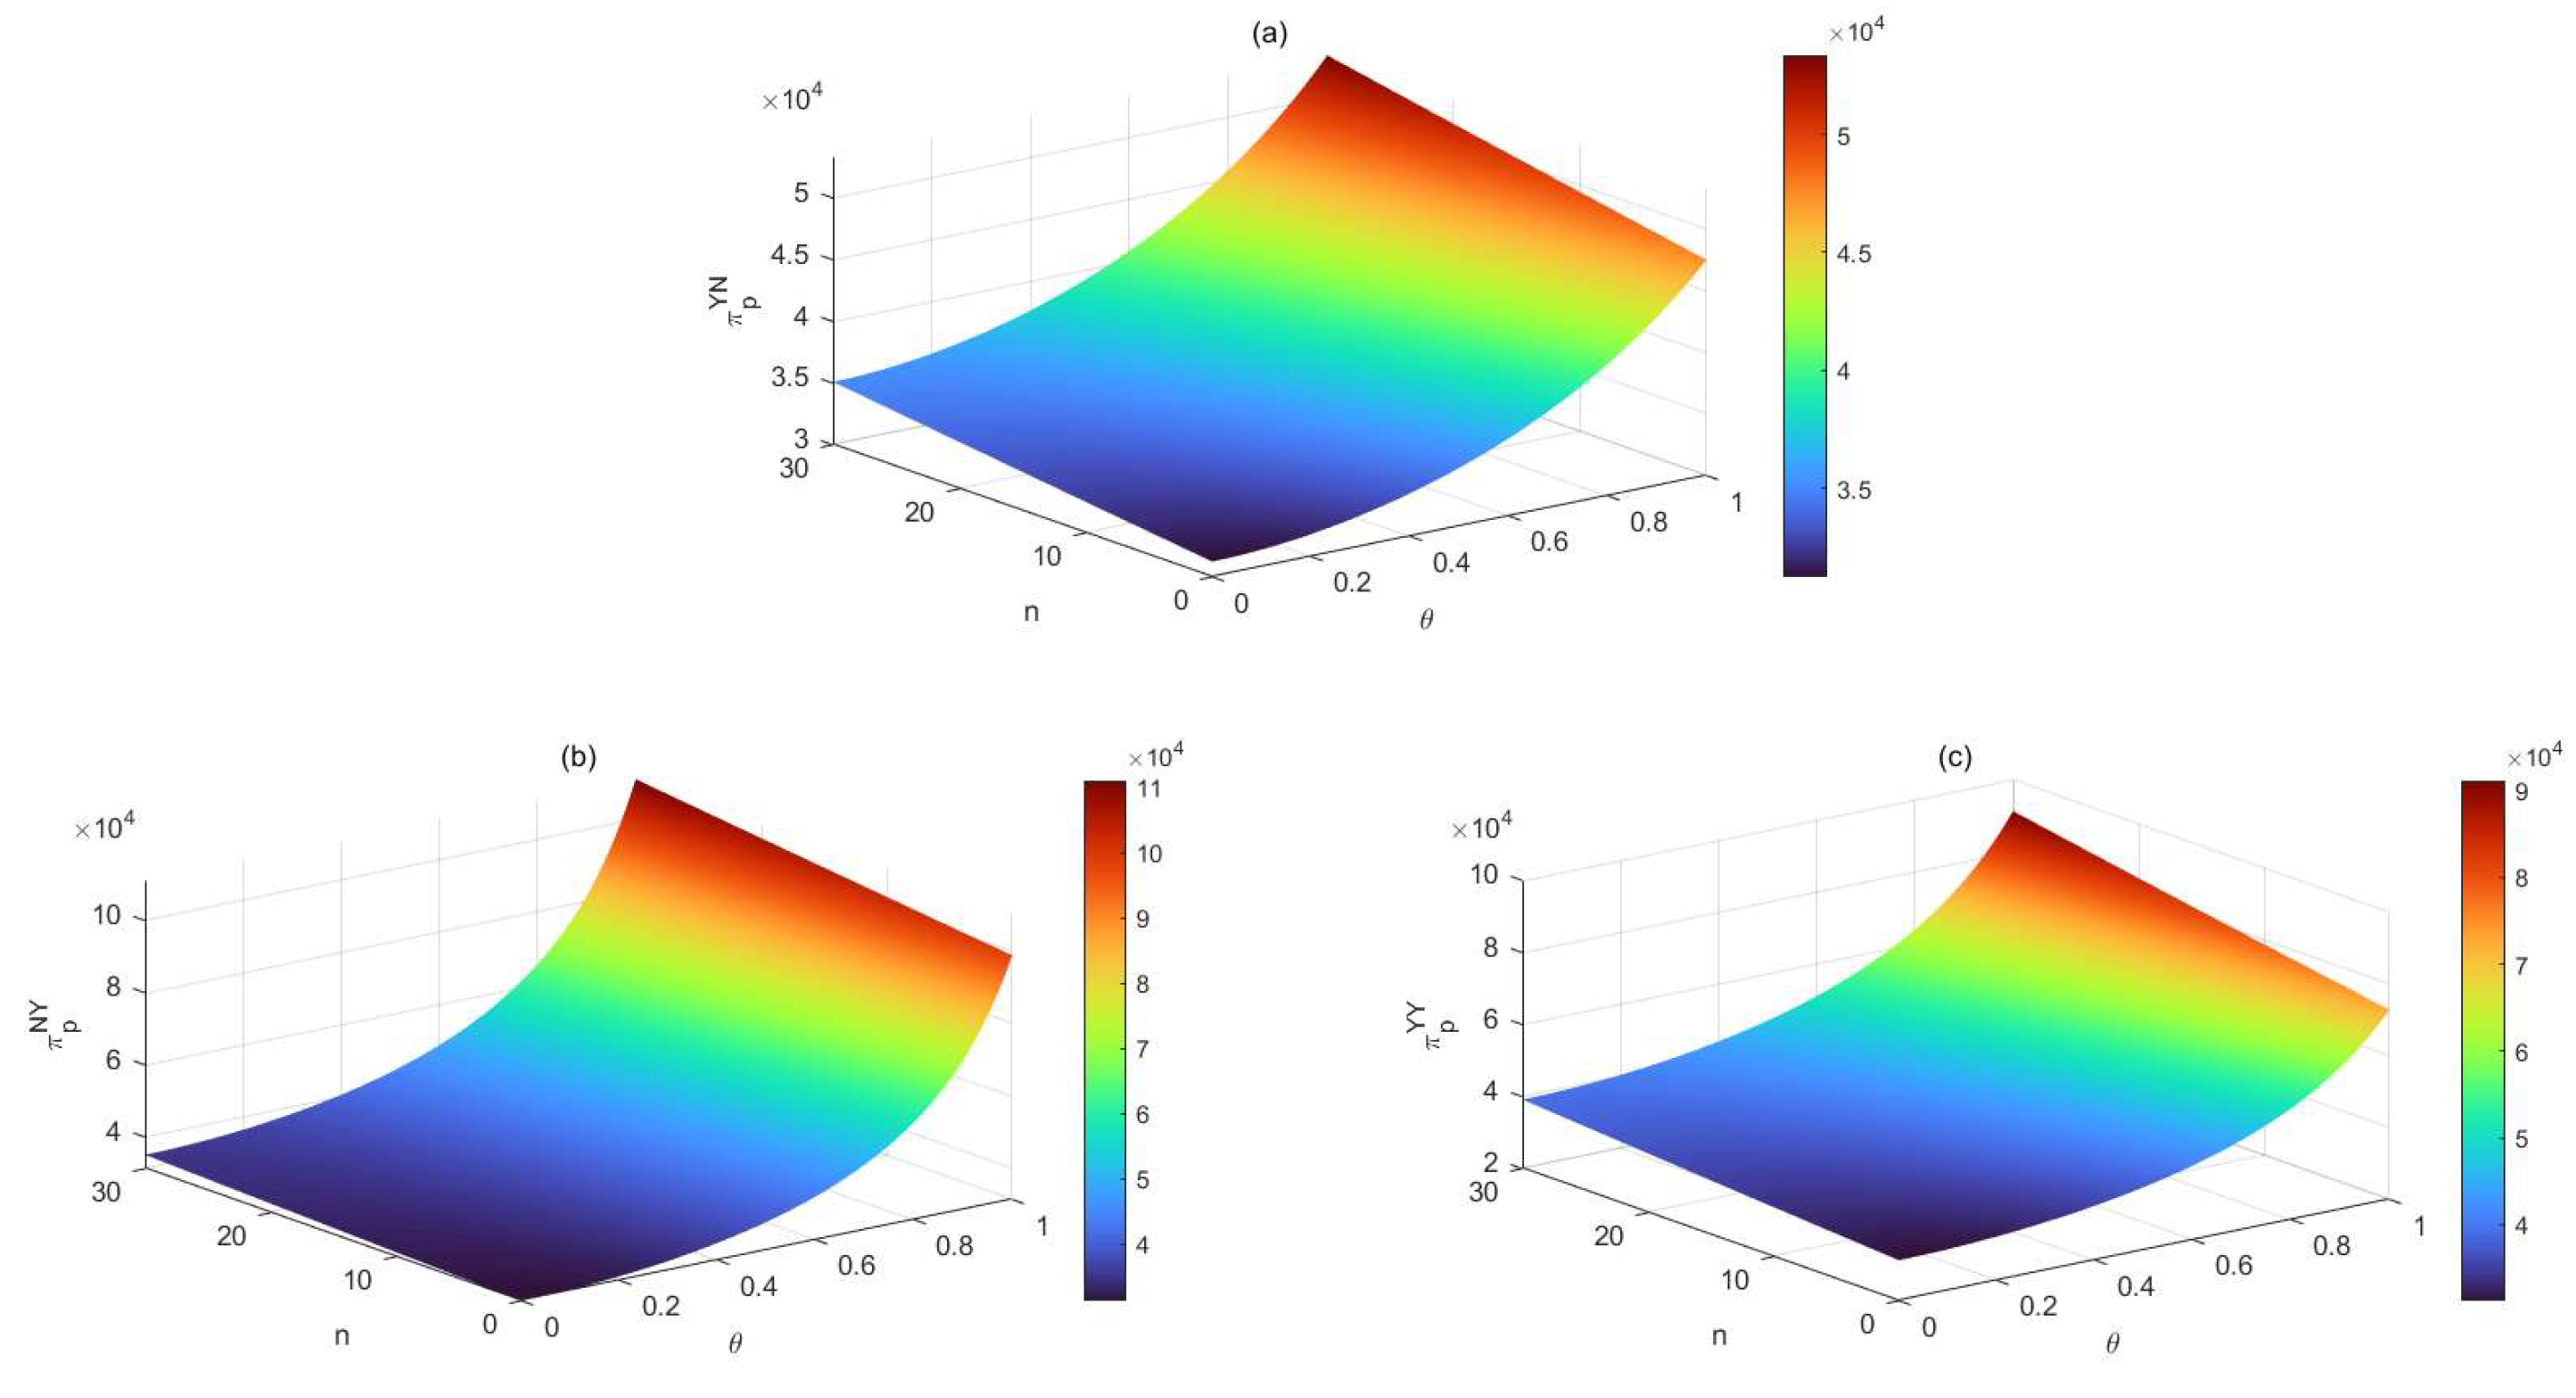
Figure 7 shows the trend of the port’s profit under the change of government subsidy and low-carbon preference, which can intuitively reveal that the dependent variable of the port’s profit is influenced by the two independent variables of government subsidy and low carbon preference. In Figure 7, it is easy to find that although the strategies represented by the three sub-figures are different, the trend of each figure is basically the same, which indicates that the trend of the port’s profit is the same regardless of which strategy, namely, the port’s profit will increase with the increase of the government subsidy and the rise of the low carbon preference, which is in fact a positive effect.Based on the results presented in Figure 7, it can be inferred that port profits are positively correlated with rising subsidies, as well as increasing consumer incline towards low-carbon alternatives.
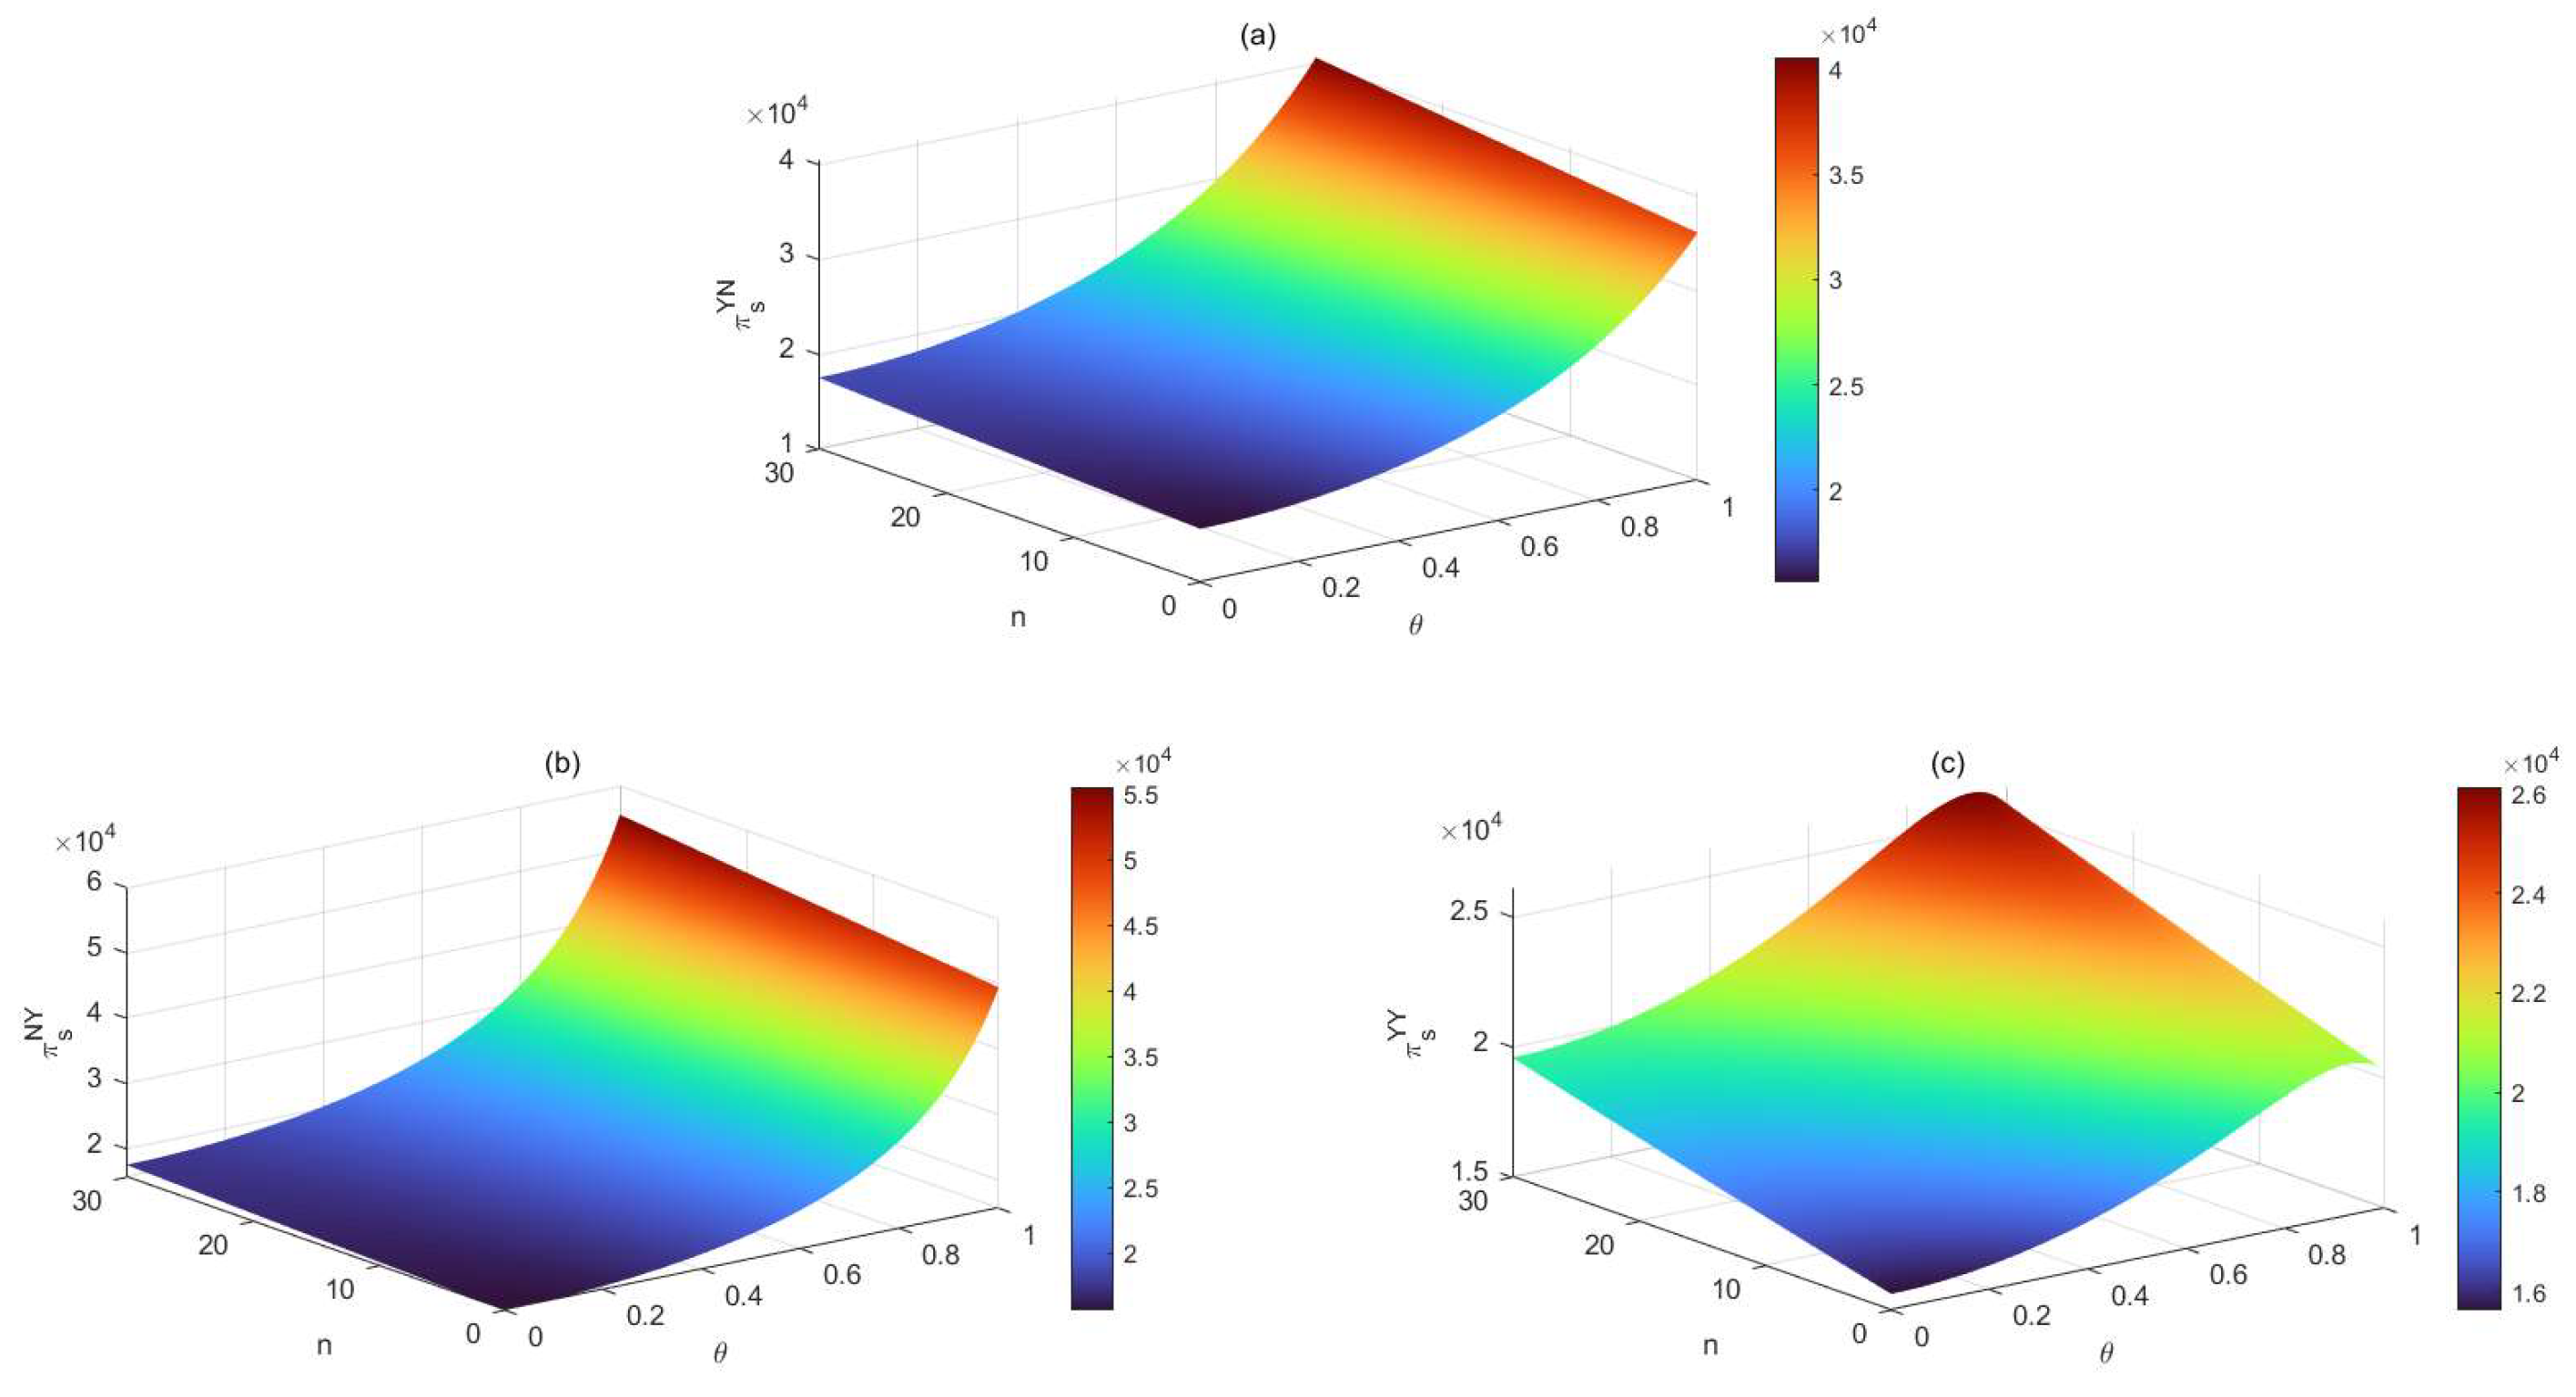
Similarly, Figure 8 offers a comprehensive insight into the nuanced dynamics shaping the profitability of shipping companies amidst variations in government subsidies and low-carbon preferences. Clearly, the interplay between the dependent variable of shipping company profit and the independent variables of government subsidies and low-carbon preference is visually elucidated. Notably, despite the distinct strategies delineated across the three sub-figures, a striking uniformity in trend emerges. This unanimity underscores a fundamental truth: irrespective of the chosen strategy, the trajectory of shipping company profit remains steadfast. Specifically, as discerned from the figures, the ascent of government subsidies and the elevation of low-carbon preferences invariably propel the profitability of shipping enterprises—a testament to the unequivocally positive impact of these factors. Figure 8 elucidates that the profits of shipping companies show an upward trend with augmenting subsidies and burgeoning low-carbon preferences of the market.
In summary, the sensitivity of pricing decisions of ports and shipping companies to government subsidies and low-carbon preferences varies under different strategies. Table 9 presents the relationship between the dependent variables, including port service cost q , shipping company marginal profit m , investment level e , profits of ports π p and profits of shipping companies π s , and the two independent variables, government subsidy n and low carbon preference θ under different strategies where “−” indicates a negative relationship, “+” indicates a positive relationship, and the “×” sign indicates no relationship between the variables.

4.4.2. Analysis of the Impact of Government Subsidies and Low-Carbon Preferences on the Decision

This section simulates the investment decision framework to analyse the investment strategy game between ports and shipping companies, based on Table 8 and the reality (in the initial stage of low-carbon port operations construction, the government has not yet intervened on a large scale because the market green preference is low, and the port is the dominant player in port operations). Therefore, this paper sets the initial parameter values of n = 0 , θ = 0.05 , α = 0.01 , X 0 = 0.5 , and Y 0 = 0.5 while satisfying the constraints mentioned earlier. The results are displayed in
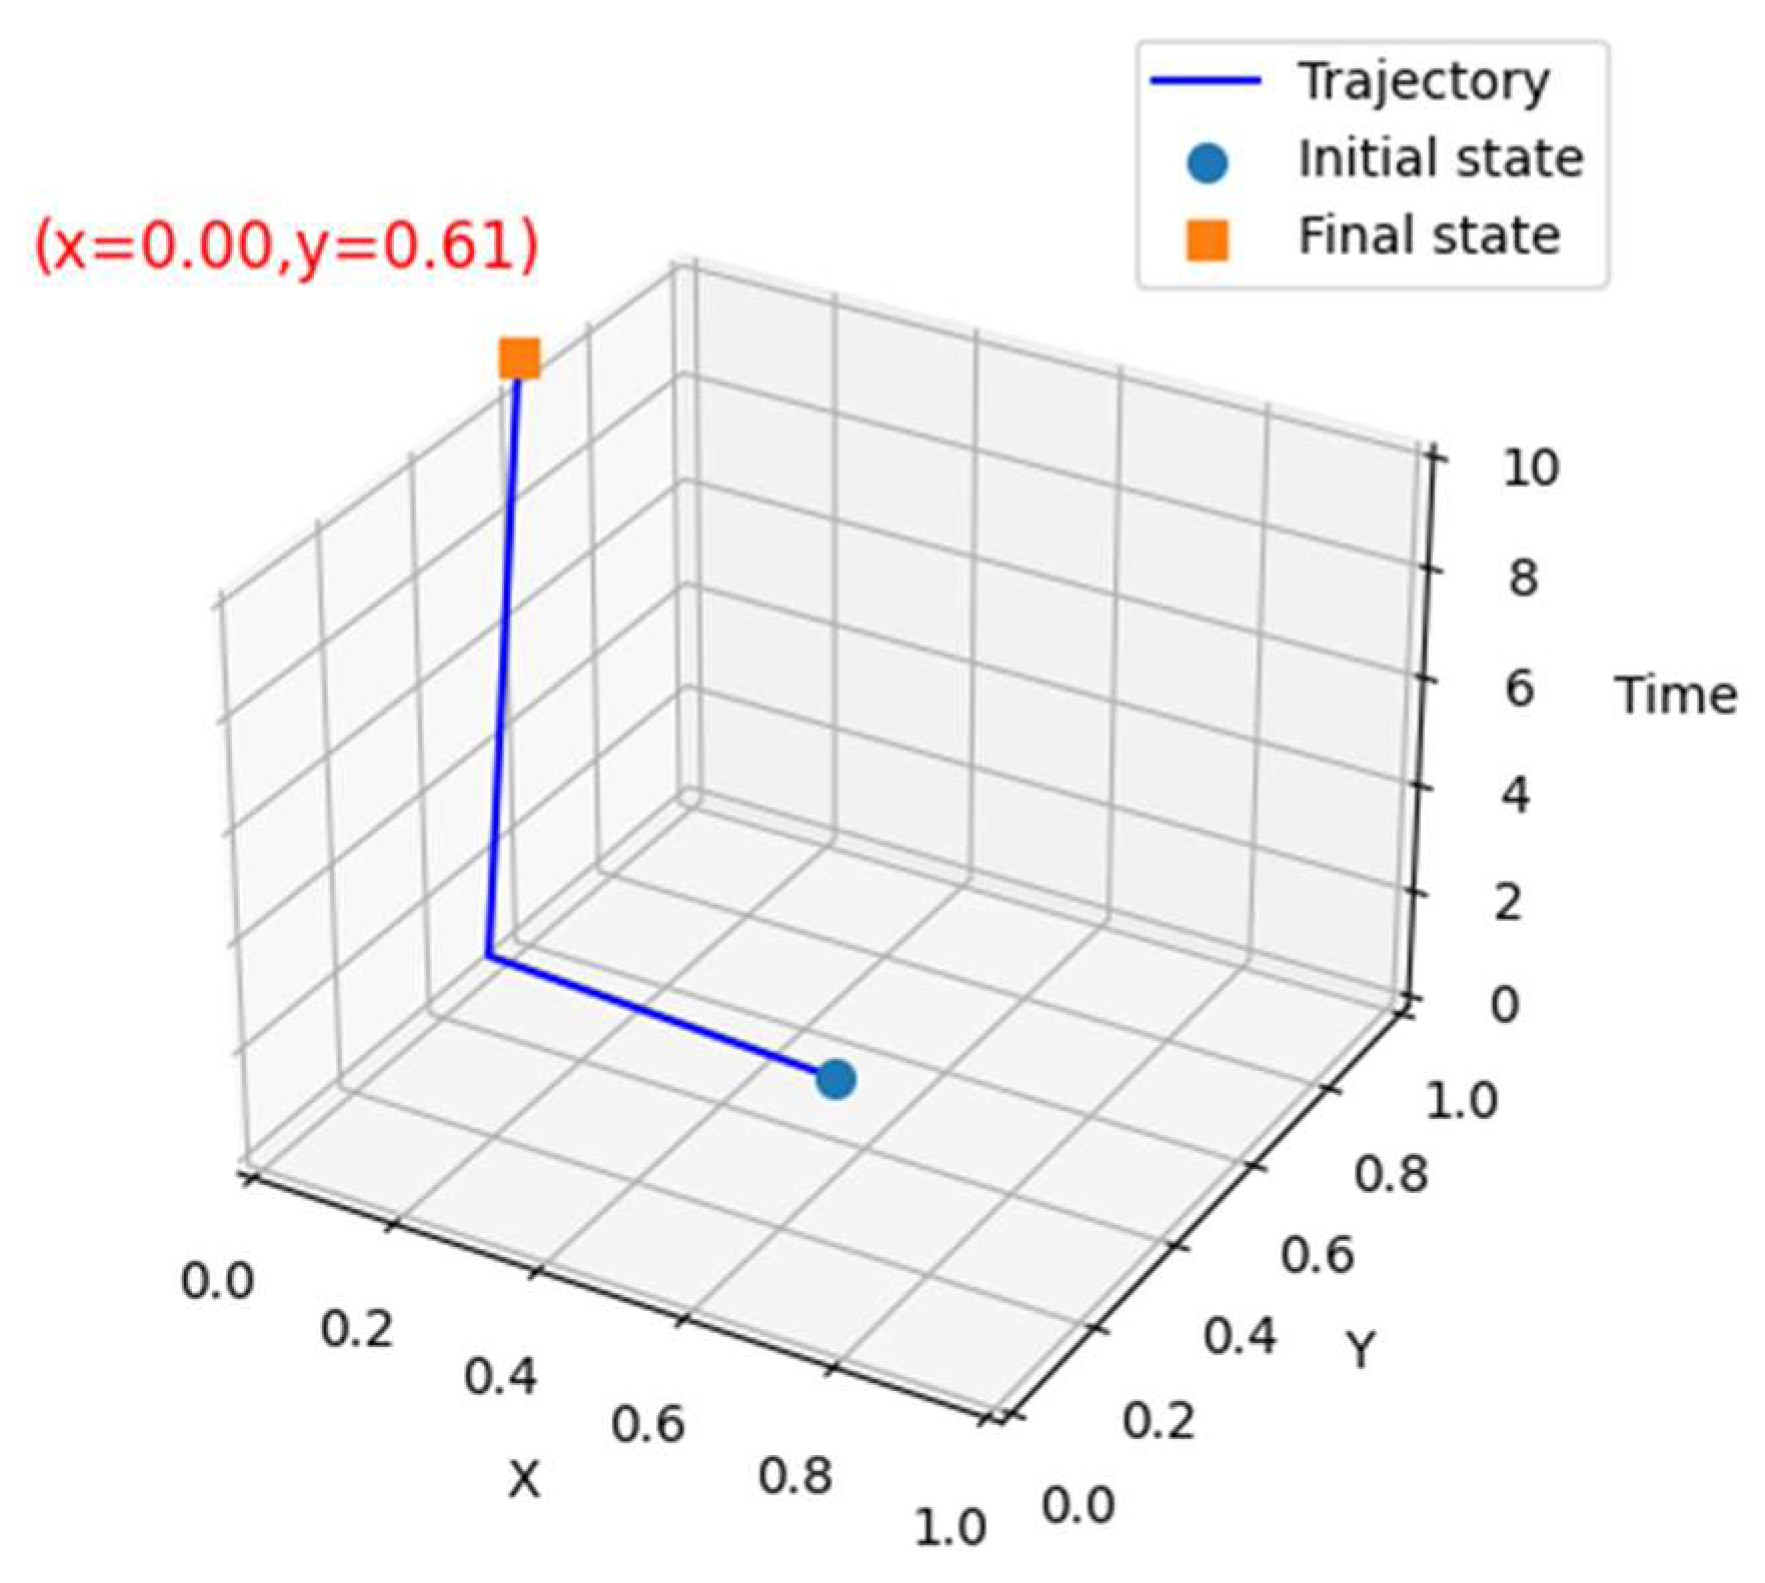
 Figure 9, where X = 0.00 , Y = 0.61 . This shows that in the early stage of the construction of low-carbon port operations, the port as the system leader will have the will to invest in emission-reduction technology, but at this stage, it will not put it into practice. The shipping companies, on the other hand, will gradually reduce their willingness to invest until it is 0. Therefore, it is necessary to investigate ways to improve the investment willingness of ports and shipping companies and promote the construction of low-carbon port operations.
To study the impact of government subsidies and low-carbon preferences on the decision to invest in carbon-reduction technologies in low-carbon port operations, we varied the values of n and θ in the model. We sought to achieve the goal of low-carbon port operations at the lowest cost for the government. Therefore, we still set the government subsidy at n = 0 , but α = 0.3 ,   θ 0 , 0.4 , respectively, while keeping other values constant. 
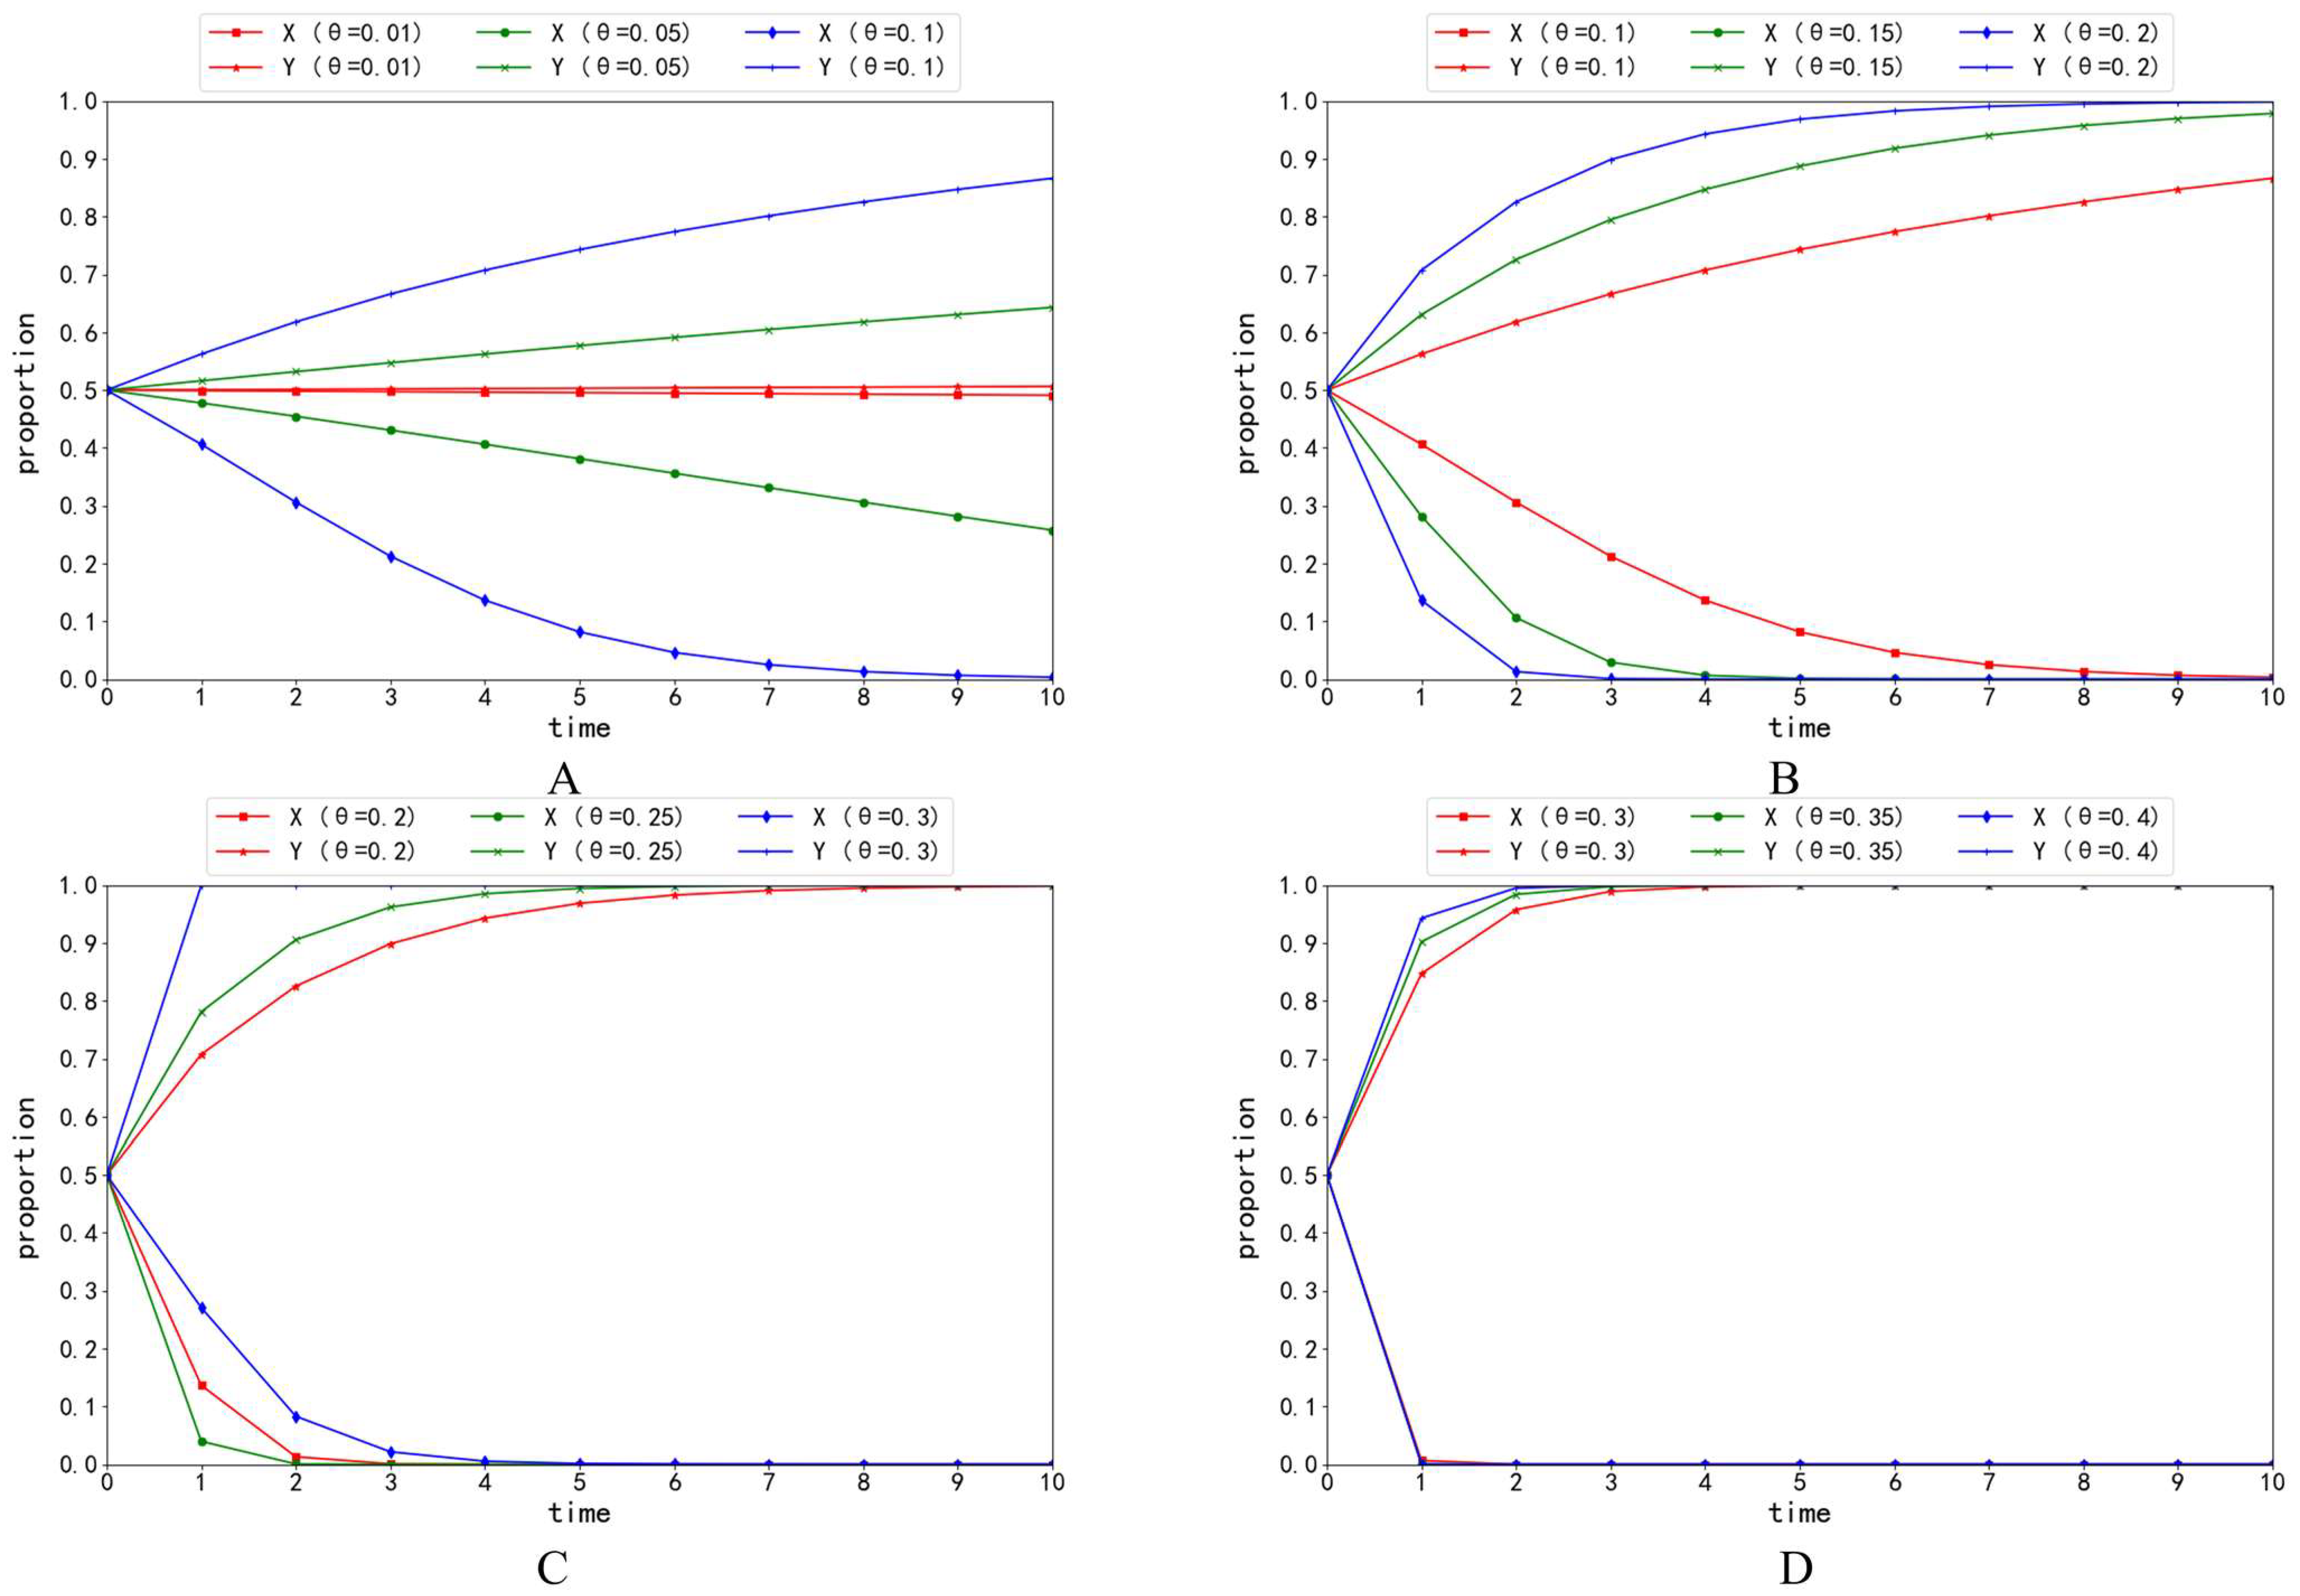
Figure 10 shows that as low-carbon preferences increase, the port gradually prefers to adopt emission-reduction technology to capture the green market demand. On the other hand, the shipping company, being a follower, does not invest in emission-reduction technology but rather benefits from the low-carbon operation implemented by the port to obtain the green market.
However, this evolutionary result is not the ideal state. Shipping companies rely on maintaining strong relationships with their shippers, and with an increasing preference for low-carbon and environmentally friendly approaches, there is a surge in demand for green practices. This means that shipping companies should proactively invest in carbon-reduction technologies to cater to this growing demand. It is worth noting that the port assumes a dominant position in the system, enabling it to hold decision-making authority over cost-sharing ratios. In the absence of government intervention, ports prioritise reducing their cost-sharing ratios and allocate more investment costs to shipping companies. With rising low-carbon preferences for environmentally friendly options, shipping companies are required to fight for a fair sharing ratio, which may discourage them from investing further in carbon-reduction technologies. As a result, it is reasonable to conclude that in the absence of government subsidies, increased market preference for low carbon can only promote ports to invest in carbon-reduction technologies and has no positive effect on shipping companies’ investment.
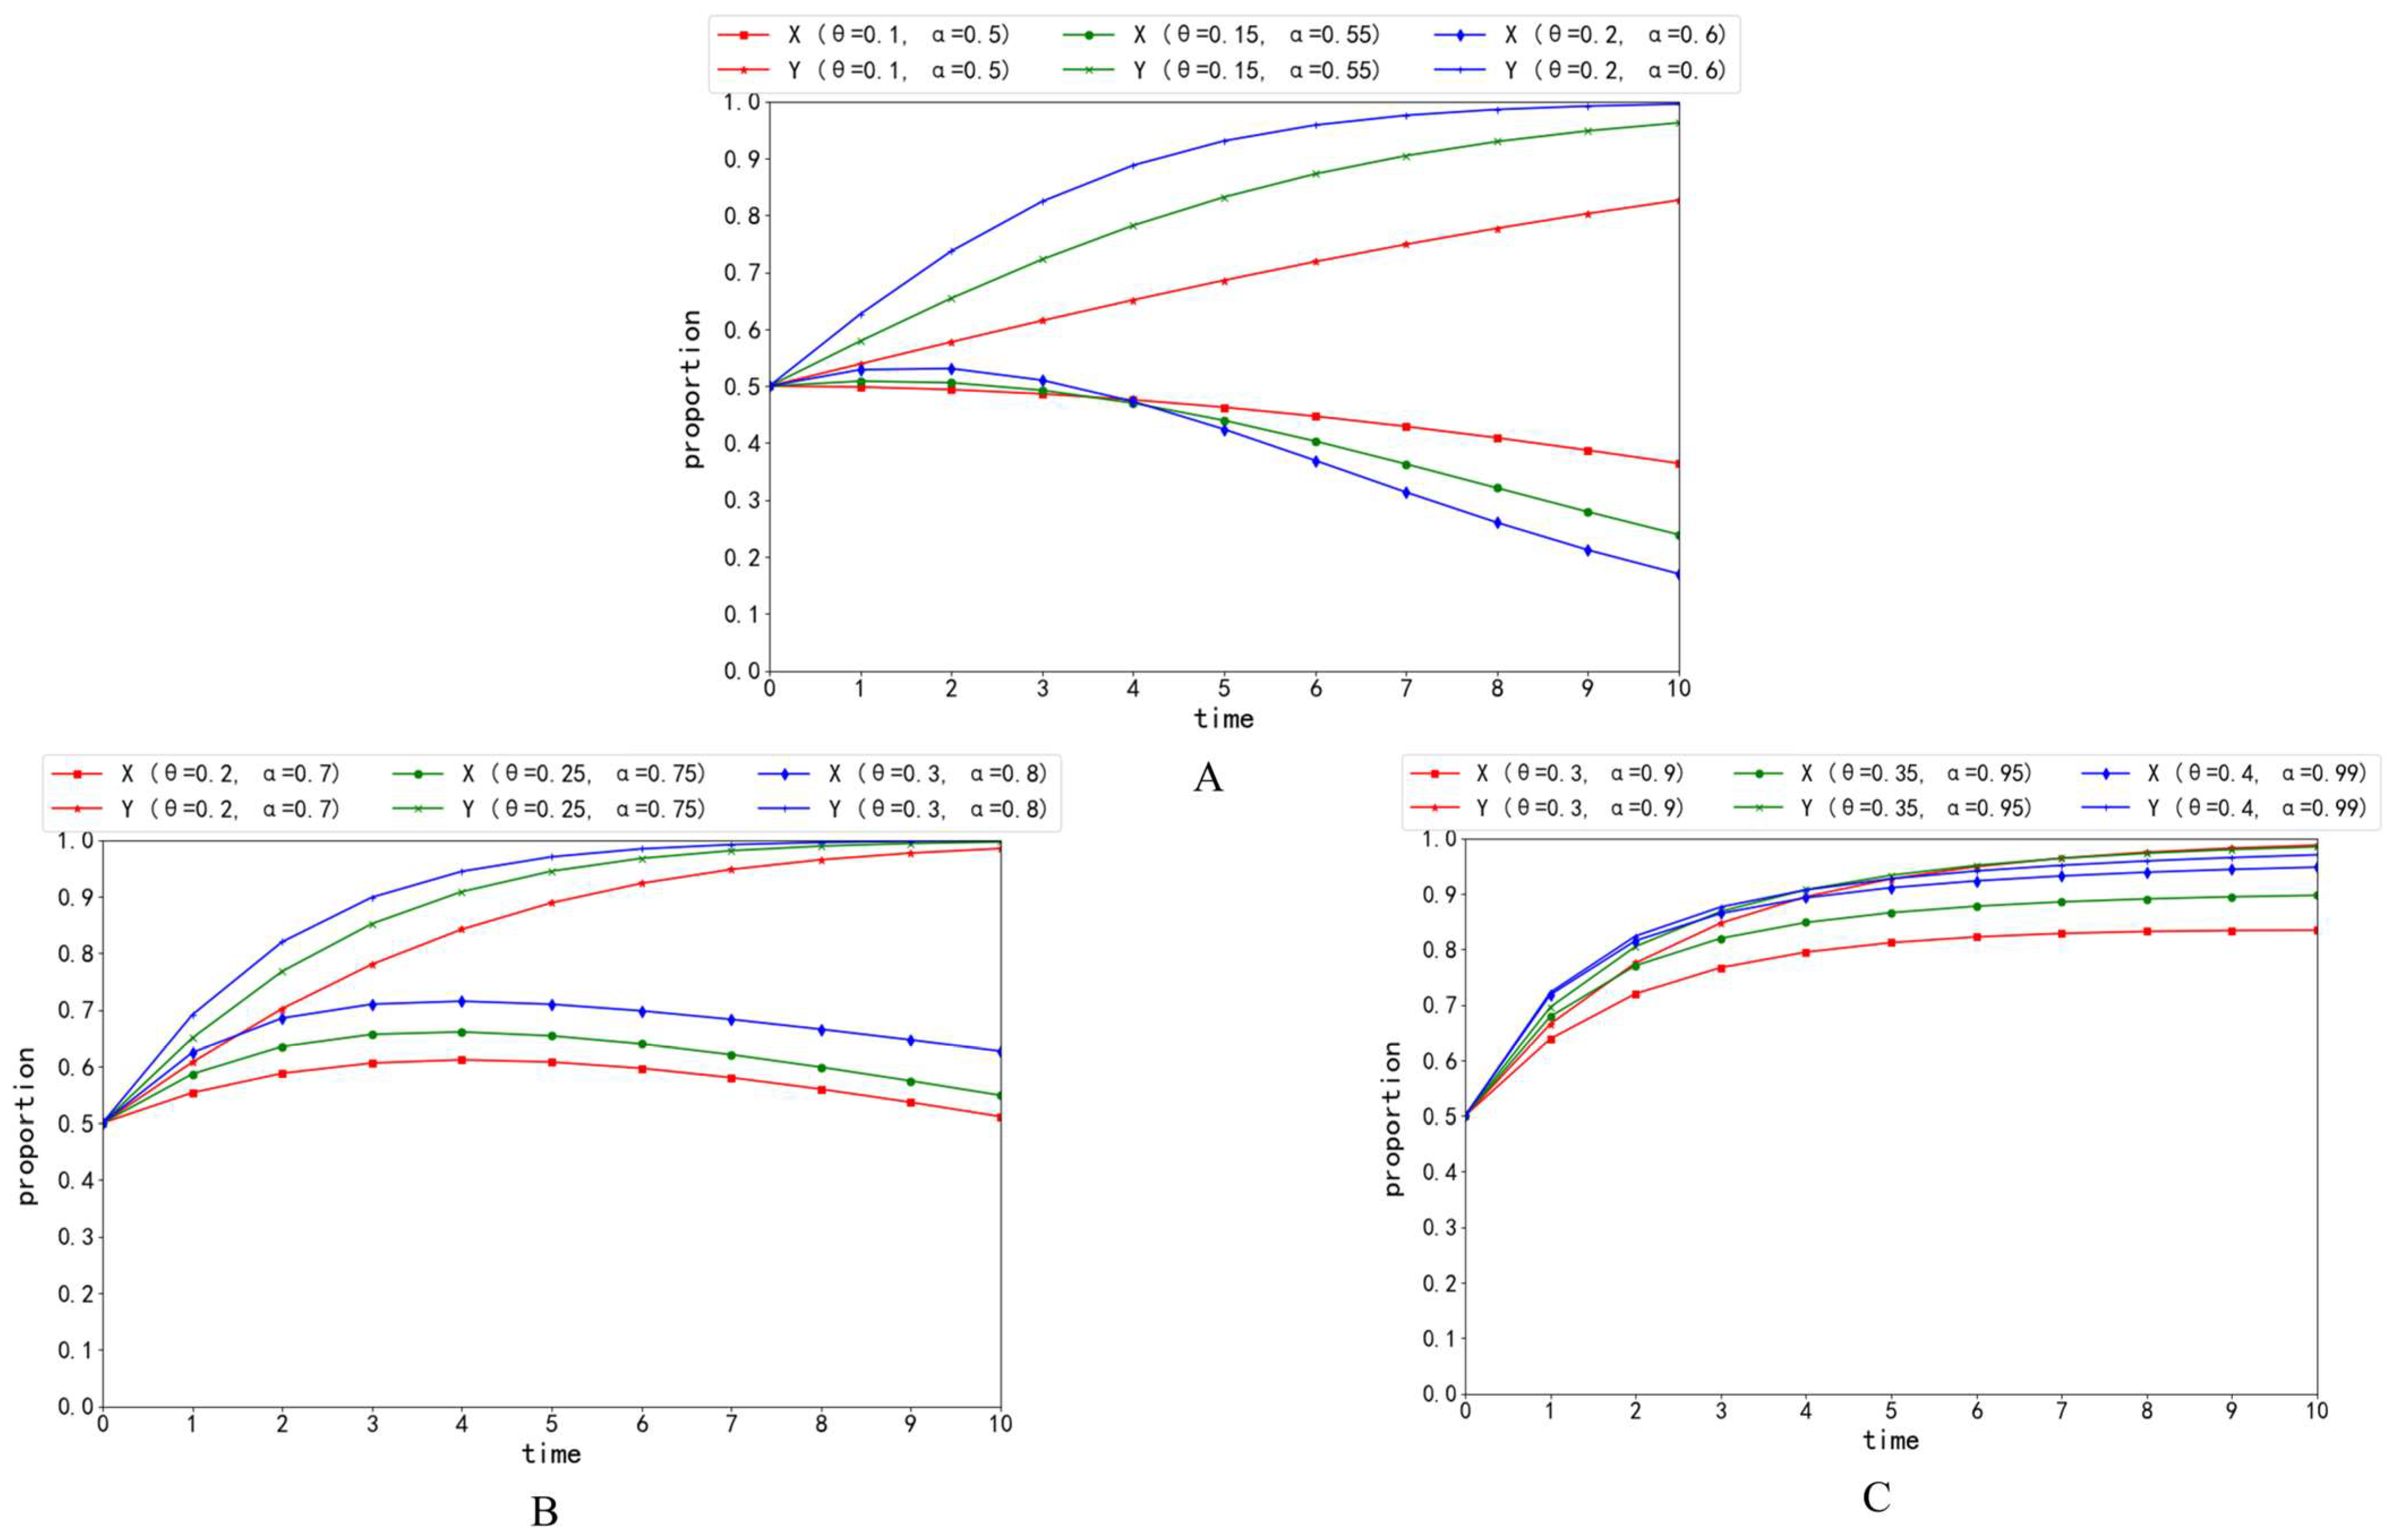
Then, the government will take measures to intervene to promote low-carbon port operations, based on Figure 10D, with n set as 0.02, 0.05, and 0.1, respectively. From Figure 11, we observe that when the government participates in subsidies, the final strategy for the evolution of ports and shipping companies is still (Y, N). However, the effect of government subsidies is immediately compared to low-carbon preferences, but the cost is also enormous.
In summary, the adoption of emission-reduction technology in low-carbon port operations systems is influenced by the interaction between government subsidies and low-carbon preferences. However, shipping companies, being followers in the port operations system, do not seem to invest in carbon-reduction technologies in this case. This suggests that factors beyond subsidies and low-carbon preferences also affect shipping companies’ investment strategies. Further investigation will be conducted based on this section to provide a more comprehensive analysis while maintaining the original meaning.

4.4.3. Analysis of the Effect of Cost Sharing on the Decision

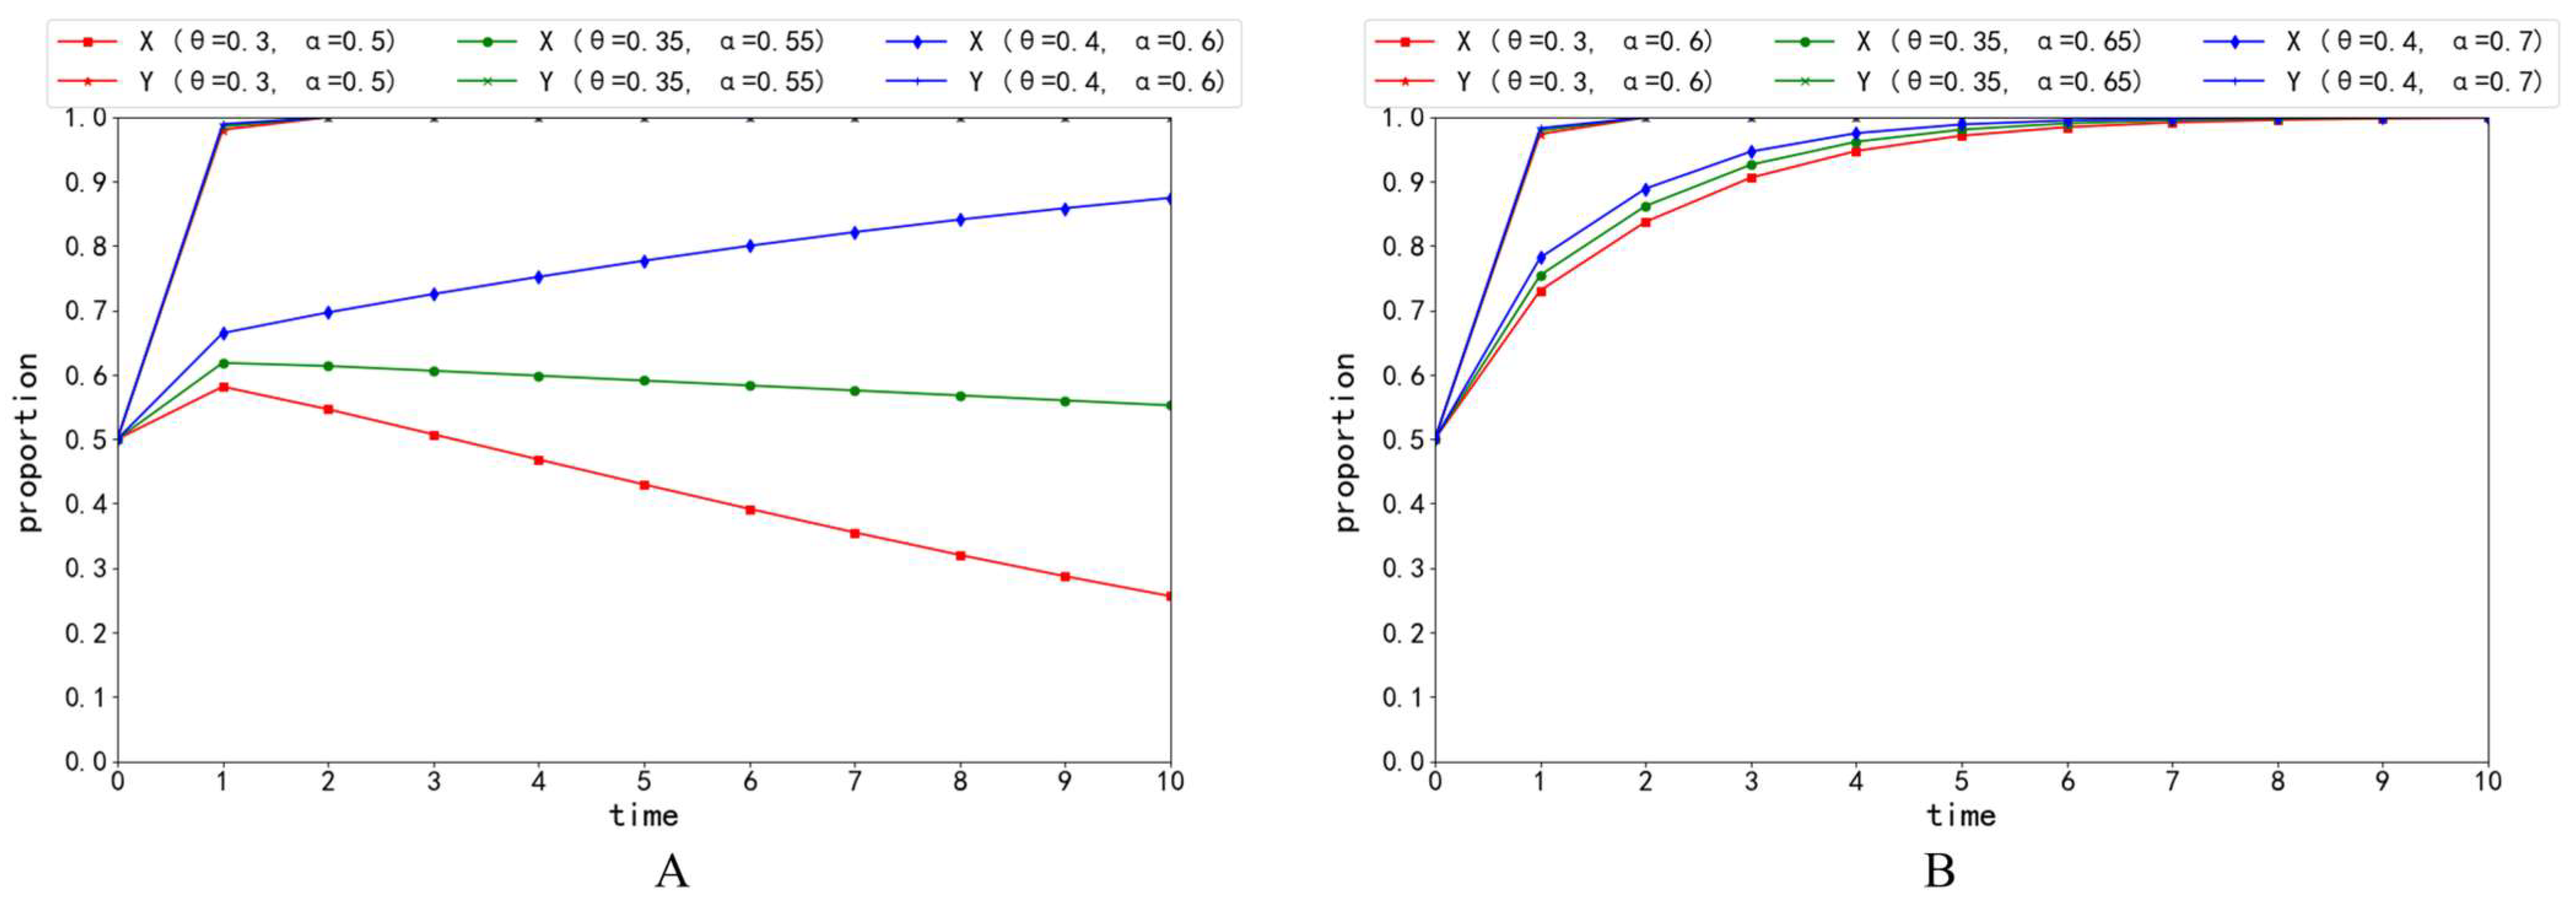
In this evolutionary model, we assume that when both parties are willing to invest in emission-reduction technology simultaneously, they will adopt a cost-sharing contract strategy. This means that they will negotiate and agree on sharing the cost of emission-reduction technology in different proportions. As the port is the dominant player in the system, it may reduce the sharing ratio to minimise the cost investment and maximise its interests, which could lead to losses for the shipping company. Therefore, setting the sharing ratio between the two sides is crucial to determining the low-carbon operations’ investment in emission-reduction technology. Based on Figure 10D, the setting is α 0.5 , 1 . As depicted in Figure 12, cost-sharing ratios affect the green emission-reduction investment strategy of the low-carbon operations. As the sharing ratio of the port increases, the shipping company is more likely to adopt emission-reduction technology. And, although the investment cost borne by the port has increased, its final evolutionary result is still an investment. This shows that under the development of green shipping, the port, as the dominant player in the system, gains more than the shipping company. Hence, promoting emission reduction in the shipping industry should focus on port emission reduction, while identifying the difficulties in shipping company emission reduction. And we can conclude that the key factor influencing shipping companies to invest in carbon-reduction technologies is cost-sharing ratios.
However, achieving the condition of making both parties invest in emission-reduction technology simultaneously without government subsidy is relatively difficult. Shipping companies will only invest when the sharing ratio of ports reaches 0.9, and the larger the ratio borne by ports, the more it affects their investment initiative.
Therefore, based on the findings illustrated in Figure 12, by setting the government subsidy n as 0.02 (as shown in Figure 13), the optimal evolutionary strategies of ports and shipping companies tend towards (Y, Y), indicating that both parties prefer to invest in emission-reduction technology with government subsidies. This strategy is an ideal solution, as it minimises the amount of government spending while enabling both ports and shipping companies to invest in carbon-reduction technologies. As shown in Figure 13B, the investment strategies of ports and shipping companies tend to shift towards (Y, Y) when cost-sharing ratios are 0.6. This is in contrast to Figure 12C, where both ports and shipping companies invest in carbon-reduction technologies only when cost-sharing ratios are 0.9. These findings suggest that government subsidies can play a crucial role in balancing cost-sharing ratios, thereby inducing both parties to invest in carbon-reduction technologies.

4.5. Management Insights

The findings derived from the numerical analysis can provide useful recommendations for governments, ports, and shipping companies to effectively reduce pollution emissions.
For the government, the ultimate goal is to reduce pollution emissions while minimising subsidy costs. Hence, the following recommendations are given: firstly, the government should focus on promoting low-carbon ports, starting with ports and treating the promotion of investment in carbon-reduction technologies by shipping companies as a difficult issue. To promote low-carbon port operations, it is crucial to adopt a targeted approach. Since the port has a massive impact on the entire system with its decisions. Therefore, using the port as an entry point to drive low-carbon investments by shipping companies can be an effective strategy. In this regard, the government can play a critical role in incentivizing and supporting the port to implement low-carbon initiatives, which also brings investments by shipping companies because of the stimulation from the port. This approach can also create a positive feedback loop, where shipping companies are encouraged to adopt low-carbon practices, leading to more significant reductions in emissions and a greener maritime supply chain. Overall, a targeted approach that leverages the port’s influence and the government’s support is necessary to promote low-carbon port operations and achieve a sustainable maritime industry.
Secondly, the government should adopt a “promotion-based, subsidy-based” approach to achieve the goal with minimal expenditure costs. The study conducted in this paper reveals that although low-carbon preferences of the market and government subsidies have different degrees of influence on port operation investment in emission-reduction technology, they are mutually substitutable. Specifically, the government’s promotion can increase the market’s low-carbon preferences, and the cost of promotion is smaller compared to direct subsidies. Therefore, the government can prioritise promotion as the main method, supplemented by subsidies. This approach can effectively promote the construction of low-carbon port operations while also reducing the government’s financial expenditure.
Thirdly, the government should intervene in the cost-sharing arrangements between ports and shipping companies to ensure the fairness of the green market. The willingness of ports and shipping companies to cooperate in promoting low-carbon port operations depends on cost-sharing ratios. If the parties cannot agree on cost-sharing ratios, the government needs to intervene to facilitate cooperation. Effective cooperation between ports and shipping companies is crucial in achieving low-carbon goals and promoting sustainable practices in the maritime industry. Therefore, it is necessary to develop clear guidelines and regulations that outline the roles and responsibilities of each party and facilitate a fair and equitable cost-sharing mechanism. This approach can encourage both ports and shipping companies to actively participate in promoting low-carbon port operations and achieve a sustainable maritime supply chain.
For ports and shipping companies, it is essential to abandon their previous focus on maximising individual interests and prioritise maximising the overall interests of the supply chain. Sustainable port operations in the maritime supply chain can only be achieved through effective cooperation between ports and shipping companies. Both parties must adopt a “holistic” approach and work together to promote the construction of a green maritime supply chain. This involves developing shared goals and objectives, transparent communication, and a fair and equitable distribution of costs and benefits so that ports and shipping companies achieve their respective goals while also contributing to the sustainability of the industry. Overall, a cooperative approach that prioritises the interests of the supply chain is necessary to promote sustainable practices in the maritime industry and achieve global climate goals.

5. Discussion

In addressing the imperative to foster environmentally sustainable practices within maritime supply chains, this study delves into the intricate dynamics of low-carbon port operations, recognising their pivotal role in mitigating pollution in harbourfront areas. The emphasis on constructing a green maritime supply chain underscores the significance of investing in low-carbon port operations as a linchpin in this transformative process. Utilising a game theory framework, this paper examines the impact of government subsidies and low-carbon preferences on port service price ( q ), shipping company marginal profits ( m ), investment levels ( e ), port profits ( π p ), and shipping company profits ( π s ) across various investment strategies.
Our analysis reveals the profound sensitivity of pricing decisions, investment levels, and profits of ports and shipping companies to government subsidies and market-driven low-carbon preferences. This aligns with the existing literature exploring the nexus between government incentives and low-carbon considerations in the maritime sector [14,16,17,18,28,29]. Notably, we extend this understanding by scrutinizing the repercussions of government subsidies under different investment strategies, revealing nuanced effects contingent on the adopted approach.
Furthermore, our study delves into the stability of investment strategies for ports and shipping companies, elucidating the intricate interplay between government subsidies, low-carbon preferences, and cost-sharing coefficients. Building upon the work of Huang et al. (2023) [24] and Meng et al. (2022) [56], we contribute a novel insight that government subsidies and low-carbon preferences act as substitutes, playing distinct roles in balancing cost-sharing ratios between ports and shipping companies. This finding introduces a nuanced perspective to the existing literature on the subject.
In presenting managerial insights for the operation and construction of low-carbon ports, our study acknowledges its limitations. The assumption of linear market demand, while a simplifying assumption, may not fully capture the complexity of real-world market dynamics characterised by uncertainty. Future research should explore the impact of stochastic demand on emission reduction in low-carbon port operations to enhance the robustness of decision outcomes.
Moreover, our focus on government subsidies as an intervention warrants consideration of potential counterbalancing policies, such as government penalty frameworks. Introducing government penalties in emission-reduction decisions could be a promising avenue for future research, offering a more comprehensive understanding of the dynamics involved.
In conclusion, this study contributes to the academic discourse on sustainable maritime practices by unraveling the intricate relationships between government interventions, market preferences, and the strategic decisions of ports and shipping companies. Our findings provide a foundation for further exploration into the complexities of low-carbon port operations, offering valuable insights for both researchers and practitioners navigating the evolving landscape of the green maritime supply chain.

6. Conclusions

As a key node in the maritime supply chain, the level of low-carbon port operations directly determines the construction and development of a green maritime supply chain. Therefore, this paper focuses on this important node and explores the key factors influencing the investment decision of carbon emission reduction of ports and shipping companies in port operations based on modelling the evolution of the decision process of both parties using a proposed game-based investment decision framework. The proposal is based on the Stackelberg game and evolutionary game. The decisions of ports and shipping companies in low-carbon port operations are analysed separately through numerical analysis, which reveals some valuable results and insights:
(1)
The pricing decisions, investment level, and profits of ports and shipping companies are sensitive to government subsidies and low-carbon preferences of the market; however, the influence of government subsidies and low-carbon preferences varies with different adopted strategies.
(2)
The investment strategies of ports and shipping companies are influenced differently by market green preferences, government subsidies, and cost-sharing ratios due to their different market positions. Ports are more sensitive to government subsidies and low-carbon preferences, and shipping companies are more sensitive to government subsidies and cost-sharing ratios; government subsidies and low-carbon preferences are substitutes for each other and balance cost-sharing ratios between ports and shipping companies.
(3)
To promote low-carbon port operations, the government should prioritise the promotion of low-carbon investments in ports and intervene in cost-sharing arrangements, while adopting a “publicity-based, subsidy-based” approach to minimise expenditure costs and address the challenges of promoting investment in carbon-reduction technologies by shipping companies. On the other hand, for ports and shipping companies, it is essential to abandon their previous focus on maximising individual interests and prioritise maximising the overall interests of low-carbon port operations.
This paper’s research on the gaming problem of ports and shipping companies’ investment in emission-reduction technology in the port operation system, on the one hand, can promote energy saving and emission reduction of ports and shipping companies and promote the green and sustainable development of the port operation system. On the one hand, it can optimise the cost-sharing mechanism of emission reduction of port and shipping company and promote the development of synergistic emission reduction of the port and shipping system; on the other hand, it can optimise the government subsidy and regulation policy, and explore the benign and reasonable government regulatory mechanism. In the future, in-depth research can also be expanded in the following areas: (1) exploring the interaction between government subsidies and other regulatory mechanisms in promoting low-carbon port operations; (2) incorporating a wider range of port and shipping company behavioural models, taking into account different degrees of rationality and different strategic focuses; and (3) exploring cost–benefit analyses of different types of emission-reduction technologies.

Author Contributions

Conceptualisation, M.L. and J.L.; methodology, M.L., J.L. and P.J.; software, M.L. and P.J.; validation, M.L. and J.L.; formal analysis, M.L.; investigation, M.L. and P.J.; resources, M.L. and P.J.; data curation, M.L. writing—original draft preparation, M.L.; writing—review and editing, M.L. and J.L.; visualisation, M.L.; supervision, X.L. and P.J. All authors have read and agreed to the published version of the manuscript.

Funding

This research was supported by the 2023 Liaoning Provincial Academic Public Welfare Research Fund (Soft Science Research Plan) (2023JH4/10700017).

Data Availability Statement

The data used to support the findings of this study are available from the corresponding author upon request.

Acknowledgments

The authors would like to thank the anonymous referees for their valuable comments and suggestions.

Conflicts of Interest

The authors declare no conflicts of interest.

Appendix A. Proof of the Existence of the Optimal Solution

Proof of the (Y, N) strategy:
Equation (A1) represents the equilibrium marginal profit of the shipping company, which is calculated by incorporating the demand function into the company’s profit function and solving for π s / m = 0 .
m Y N = a b q + θ e 2 b
By incorporating Equation (A1) into the port profit function, we can derive the Hessian matrix of π Y N p with respect to q and e , which is represented by Equation (A2).
H 1 = 2 π Y N p 2 q 2 2 π Y N p q e 2 π Y N p e q 2 π Y N p 2 e 2 = b θ 2 θ 2 η
For the (Y, N) strategy, there exists an optimal freight price p Y N * , an optimal service price q Y N * , and an optimal carbon emission-reduction investment level e Y N * that maximises the profit of the low-carbon port operations when the investment reduction cost factor η satisfies the inequality η > θ 2 4 b , which implies that b < 0 and b η θ 2 4 > 0 . In this case, the Hessian matrix is negative definite and takes on a significant value.
Proof of the (N, Y) strategy:
Equations (A3) and (A4) represent the equilibrium marginal profit of the shipping company, which is derived by incorporating the demand function into the company’s profit function and solving for π s / m = 0 and π s / e = 0 .
m N Y = a η b n + q η + n θ 2 2 b η θ 2
e = a + b n q θ 2 b η θ 2
By incorporating Equations (A3) and (A4) into the port profit function, we derive the Hessian matrix of π N Y p with respect to q, which is represented by Equation (A5).
H 2 = 2 π N Y s 2 m 2 2 π N Y s m e 2 π N Y s e m 2 π N Y s 2 e 2 = 2 b θ θ η
For the (N, Y) strategy, there exists an optimal freight price p N Y * , an optimal service price q N Y * , and an optimal carbon emission-reduction investment level e N Y * that maximises the profit of the low-carbon port operations when the investment reduction cost factor η satisfies the inequality η > θ 2 2 b , which implies that 2 b < 0 and 2 b η θ 2 > 0 . Under these conditions, the Hessian matrix is negative definite and takes on a significant value.
Proof of the (Y, Y) strategy:
Equation (A6) represents the equilibrium marginal profit of the shipping company, which is derived by incorporating the demand function into the company’s profit function and solving for π s / m = 0 .
m Y Y = a b n b q + e θ 2 b
By incorporating Equation (A6) into the port profit function, we derive the Hessian matrix of π Y Y p with respect to q and e , which is represented by Equation (A7).
H 3 = 2 π Y Y p 2 q 2 2 π Y Y p q e 2 π Y Y p e q 2 π Y Y p 2 e 2 = b θ 2 θ 2 α η
For the (Y, Y) strategy, there exists an optimal freight price p Y Y * , an optimal service price q Y Y * , and an optimal carbon emission-reduction investment level e Y Y * that maximises the profit of the low-carbon port operations when the investment reduction cost factor η satisfies the inequality η > θ 2 4 b , which implies that b < 0 and b α η θ 2 4 > 0 . Under these conditions, the Hessian matrix is negative definite and takes on a significant value.

References

  1. Marine Environment. Available online: https://www.imo.org/en/OurWork/Environment/Pages/Default.aspx (accessed on 11 June 2023).
  2. Liu, Y.; Xin, X.; Yang, Z.; Chen, K.; Li, C. Liner Shipping Network—Transaction Mechanism Joint Design Model Considering Carbon Tax and Liner Alliance. Ocean Coast. Manag. 2021, 212, 105817. [Google Scholar] [CrossRef]
  3. IMO 2020–Cutting Sulphur Oxide Emissions. Available online: https://www.imo.org/en/MediaCentre/HotTopics/Pages/Sulphur-2020.aspx (accessed on 11 June 2023).
  4. Homepage|GHG Protocol. Available online: https://ghgprotocol.org/ (accessed on 15 March 2024).
  5. Chang, Y.-T.; Song, Y.; Roh, Y. Assessing Greenhouse Gas Emissions from Port Vessel Operations at the Port of Incheon. Transp. Res. Part D Transp. Environ. 2013, 25, 1–4. [Google Scholar] [CrossRef]
  6. Zis, T.; North, R.J.; Angeloudis, P.; Ochieng, W.Y.; Harrison Bell, M.G. Evaluation of Cold Ironing and Speed Reduction Policies to Reduce Ship Emissions near and at Ports. Marit. Econ. Logist. 2014, 16, 371–398. [Google Scholar] [CrossRef]
  7. Sciberras, E.A.; Zahawi, B.; Atkinson, D.J.; Juandó, A.; Sarasquete, A. Cold Ironing and Onshore Generation for Airborne Emission Reductions in Ports. Proc. Inst. Mech. Eng. Part M J. Eng. Marit. Environ. 2016, 230, 67–82. [Google Scholar] [CrossRef]
  8. Awan, U.; Arnold, M.G.; Gölgeci, I. Enhancing Green Product and Process Innovation: Towards an Integrative Framework of Knowledge Acquisition and Environmental Investment. Bus. Strategy Environ. 2021, 30, 1283–1295. [Google Scholar] [CrossRef]
  9. Chen, J.; Xiong, W.; Xu, L.; Di, Z. Evolutionary Game Analysis on Supply Side of the Implement Shore-to-Ship Electricity. Ocean Coast. Manag. 2021, 215, 105926. [Google Scholar] [CrossRef]
  10. Cullinane, K.; Bergqvist, R. Emission Control Areas and Their Impact on Maritime Transport. Transp. Res. Part D Transp. Environ. 2014, 28, 1–5. [Google Scholar] [CrossRef]
  11. Zhu, L.; Qin, C.; Peng, C. Analysis on Energy Saving and Emission Reduction of Clean Energy Technology in Ports. In Proceedings of the International Conference on Energy Engineering and Environmental Protection (EEEP2017); Tang, W., Ed.; Iop Publishing Ltd.: Bristol, UK, 2018; Volume 121, p. 052060. [Google Scholar]
  12. Zhen, L.; Zhuge, D.; Wang, X. Researches on Green Ports and Shipping Management: An Overview. Xitong Gongcheng Lilun Yu Shijian/Syst. Eng. Theory Pract. 2020, 40, 2037–2050. [Google Scholar] [CrossRef]
  13. Li, X.; Kuang, H.; Hu, Y. Using System Dynamics and Game Model to Estimate Optimal Subsidy in Shore Power Technology. IEEE Access 2020, 8, 116310–116320. [Google Scholar] [CrossRef]
  14. Zhou, H.; Zhang, W. Choice of Emission Control Technology in Port Areas with Customers’ Low-Carbon Preference. Sustainability 2022, 14, 13816. [Google Scholar] [CrossRef]
  15. Innes, A.; Monios, J. Identifying the Unique Challenges of Installing Cold Ironing at Small and Medium Ports—The Case of Aberdeen. Transp. Res. Part D Transp. Environ. 2018, 62, 298–313. [Google Scholar] [CrossRef]
  16. Zhou, H. Decisions on Technologies for Emissions Control in Port Areas under Subsidy and Low-Carbon Preferences of Customers. Math. Probl. Eng. 2022, 2022, 2359911. [Google Scholar] [CrossRef]
  17. Wang, H.; Meng, Q.; Zhang, X. Game-Theoretical Models for Competition Analysis in a New Emerging Liner Container Shipping Market. Transp. Res. Part B Methodol. 2014, 70, 201–227. [Google Scholar] [CrossRef]
  18. Yang, L.; Cai, Y.; Wei, Y.; Huang, S. Choice of Technology for Emission Control in Port Areas: A Supply Chain Perspective. J. Clean. Prod. 2019, 240, 118105. [Google Scholar] [CrossRef]
  19. Chen, K.; Xin, X.; Niu, X.; Zeng, Q. Coastal Transportation System Joint Taxation-Subsidy Emission Reduction Policy Optimization Problem. J. Clean. Prod. 2020, 247, 119096. [Google Scholar] [CrossRef]
  20. Liu, J.; Lyu, Y.; Wu, J.; Wang, J. Adoption Strategies of Carbon Abatement Technologies in the Maritime Supply Chain: Impact of Demand Information Sharing. Int. J. Logist.-Res. Appl. 2022, 1–28. [Google Scholar] [CrossRef]
  21. Davarzani, H.; Fahimnia, B.; Bell, M.; Sarkis, J. Greening Ports and Maritime Logistics: A Review. Transp. Res. Part D Transp. Environ. 2016, 48, 473–487. [Google Scholar] [CrossRef]
  22. Agi, M.A.N.; Faramarzi-Oghani, S.; Hazır, Ö. Game Theory-Based Models in Green Supply Chain Management: A Review of the Literature. Int. J. Prod. Res. 2021, 59, 4736–4755. [Google Scholar] [CrossRef]
  23. Qu, G.; Wang, Y.; Xu, L.; Qu, W.; Zhang, Q.; Xu, Z. Low-Carbon Supply Chain Emission Reduction Strategy Considering the Supervision of Downstream Enterprises Based on Evolutionary Game Theory. Sustainability 2021, 13, 2827. [Google Scholar] [CrossRef]
  24. Huang, X.; Liu, G.; Zheng, P. Dynamic Analysis of a Low-Carbon Maritime Supply Chain Considering Government Policies and Social Preferences. Ocean Coast. Manag. 2023, 239, 106564. [Google Scholar] [CrossRef]
  25. Wang, Y.; Guo, S.; Dai, L.; Zhang, Z.; Hu, H. Shore Side Electricity Subsidy Policy Efficiency Optimization: From the Game Theory Perspective. Ocean Coast. Manag. 2022, 228, 106324. [Google Scholar] [CrossRef]
  26. Wang, Y.; Ding, W.; Dai, L.; Hu, H.; Jing, D. How Would Government Subsidize the Port on Shore Side Electricity Usage Improvement? J. Clean. Prod. 2021, 278, 123893. [Google Scholar] [CrossRef]
  27. Meng, L.; Wang, J.; Yan, W.; Han, C. A Differential Game Model for Emission Reduction Decisions between Ports and Shipping Enterprises Considering Environmental Regulations. Ocean Coast. Manag. 2022, 225, 106221. [Google Scholar] [CrossRef]
  28. Liu, B.; Li, T.; Tsai, S.-B. Low Carbon Strategy Analysis of Competing Supply Chains with Different Power Structures. Sustainability 2017, 9, 835. [Google Scholar] [CrossRef]
  29. Zou, H.; Qin, J.; Dai, B. Optimal Pricing Decisions for a Low-Carbon Supply Chain Considering Fairness Concern under Carbon Quota Policy. Int. J. Environ. Res. Public Health 2021, 18, 556. [Google Scholar] [CrossRef] [PubMed]
  30. Cui, H.; Notteboom, T. Modelling Emission Control Taxes in Port Areas and Port Privatization Levels in Port Competition and Co-Operation Sub-Games. Transp. Res. Part D Transp. Environ. 2017, 56, 110–128. [Google Scholar] [CrossRef]
  31. Pian, F.; Xu, L.; Chen, Y.; Lee, S.-H. Global Emission Taxes and Port Privatization Policies under International Competition. Sustainability 2020, 12, 6595. [Google Scholar] [CrossRef]
  32. Lai, X.; Tao, Y.; Wang, F.; Zou, Z. Sustainability Investment in Maritime Supply Chain with Risk Behavior and Information Sharing. Int. J. Prod. Econ. 2019, 218, 16–29. [Google Scholar] [CrossRef]
  33. Zhiwen, Z.; Yujun, X.; Junxing, L.; Limin, G.; Long, W. Supply Chain Logistics Information Collaboration Strategy Based on Evolutionary Game Theory. IEEE Access 2020, 8, 46102–46120. [Google Scholar] [CrossRef]
  34. Hu, Z.-H.; Wang, S.-W. An Evolutionary Game Model Between Governments and Manufacturers Considering Carbon Taxes, Subsidies, and Consumers’ Low-Carbon Preference. Dyn. Games Appl. 2022, 12, 513–551. [Google Scholar] [CrossRef]
  35. Gao, N.; Qu, L.; Jiang, Y.; Hou, J. Game Models for Ordering and Channel Decisions of New and Differentiated Remanufactured Products in a Closed-Loop Supply Chain with Sales Efforts. Systems 2024, 12, 67. [Google Scholar] [CrossRef]
  36. Gao, W.; Guo, W.; Zhou, S.; Wu, S.; Yang, Z. The Evolution of the Relationship among Stakeholders in Port Integration: Evidence from Tripartite Evolutionary Game Analysis. Ocean Coast. Manag. 2023, 240, 106628. [Google Scholar] [CrossRef]
  37. Jiao, Y.; Wang, C. Shore Power vs Low Sulfur Fuel Oil: Pricing Strategies of Carriers and Port in a Transport Chain. Int. J. Low-Carbon Technol. 2021, 16, 715–724. [Google Scholar] [CrossRef]
  38. Song, Z.; Tang, W.; Zhao, R.; Zhang, G. Implications of Government Subsidies on Shipping Companies’ Shore Power Usage Strategies in Port. Transp. Res. Part E Logist. Transp. Rev. 2022, 165, 102840. [Google Scholar] [CrossRef]
  39. Lin, D.-Y.; Juan, C.-J.; Ng, M. Evaluation of Green Strategies in Maritime Liner Shipping Using Evolutionary Game Theory. J. Clean. Prod. 2021, 279, 123268. [Google Scholar] [CrossRef]
  40. Long, Q.; Tao, X.; Shi, Y.; Zhang, S. Evolutionary Game Analysis Among Three Green-Sensitive Parties in Green Supply Chains. IEEE Trans. Evol. Comput. 2021, 25, 508–523. [Google Scholar] [CrossRef]
  41. Kang, K.; Zhao, Y.; Zhang, J.; Qiang, C. Evolutionary Game Theoretic Analysis on Low-Carbon Strategy for Supply Chain Enterprises. J. Clean. Prod. 2019, 230, 981–994. [Google Scholar] [CrossRef]
  42. Hafezalkotob, A.; Nersesian, L.; Fardi, K. A Policy-Making Model for Evolutionary SME Behavior during a Pandemic Recession Supported on Game Theory Approach. Comput. Ind. Eng. 2023, 177, 108975. [Google Scholar] [CrossRef]
  43. Chen, W.; Hu, Z.-H. Using Evolutionary Game Theory to Study Governments and Manufacturers’ Behavioral Strategies under Various Carbon Taxes and Subsidies. J. Clean. Prod. 2018, 201, 123–141. [Google Scholar] [CrossRef]
  44. Fu, M.; Wu, W.; Tian, L.; Zhen, Z.; Ye, J. Analysis of Emission Reduction Mechanism of High-Tiered Carbon Tax under Green and Low Carbon Behavior. Energies 2023, 16, 7555. [Google Scholar] [CrossRef]
  45. Zhou, Y.; Bao, M.; Chen, X.; Xu, X. Co-Op Advertising and Emission Reduction Cost Sharing Contracts and Coordination in Low-Carbon Supply Chain Based on Fairness Concerns. J. Clean. Prod. 2016, 133, 402–413. [Google Scholar] [CrossRef]
  46. Ni, D.; Li, K.W.; Tang, X. Social Responsibility Allocation in Two-Echelon Supply Chains: Insights from Wholesale Price Contracts. Eur. J. Oper. Res. 2010, 207, 1269–1279. [Google Scholar] [CrossRef]
  47. Carter, C.R.; Liane Easton, P. Sustainable Supply Chain Management: Evolution and Future Directions. Int. J. Phys. Distrib. Logist. Manag. 2011, 41, 46–62. [Google Scholar] [CrossRef]
  48. Ghosh, D.; Shah, J. Supply Chain Analysis under Green Sensitive Consumer Demand and Cost Sharing Contract. Int. J. Prod. Econ. 2015, 164, 319–329. [Google Scholar] [CrossRef]
  49. Yang, M.; Gong, X. Optimal Decisions and Pareto Improvement for Green Supply Chain Considering Reciprocity and Cost-Sharing Contract. Environ. Sci. Pollut. Res. 2021, 28, 29859–29874. [Google Scholar] [CrossRef] [PubMed]
  50. Wang, J.; Zhu, W. Analyzing the Development of Competition and Cooperation among Ocean Carriers Considering the Impact of Carbon Tax Policy. Transp. Res. Part E Logist. Transp. Rev. 2023, 175, 103157. [Google Scholar] [CrossRef]
  51. Xue, Y.; Lai, K.; Wang, C. How to Invest Decarbonization Technology in Shipping Operations? Evidence from a Game-Theoretic Investigation. Ocean Coast. Manag. 2024, 251, 107076. [Google Scholar] [CrossRef]
  52. Zhao, H.; Ye, Z.; Liu, C. Reducing the Bullwhip Effect to Enhance Maritime Service Resilience: The Power of Blockchain Technology for Cutting down the Market Uncertainty in the Maritime Supply Chain. Ocean Coast. Manag. 2023, 244, 106824. [Google Scholar] [CrossRef]
  53. Xu, L.; Di, Z.; Chen, J.; Shi, J.; Yang, C. Evolutionary Game Analysis on Behavior Strategies of Multiple Stakeholders in Maritime Shore Power System. Ocean Coast. Manag. 2021, 202, 105508. [Google Scholar] [CrossRef]
  54. Li, Z.; Wang, L.; Wang, G.; Xin, X.; Chen, K.; Zhang, T. Investment and Subsidy Strategy for Low-Carbon Port Operation with Blockchain Adoption. Ocean Coast. Manag. 2024, 248, 106966. [Google Scholar] [CrossRef]
  55. Wang, C.; Jiao, Y. Shipping Companies’ Choice of Low Sulfur Fuel Oil with Government Subsidy and Different Maritime Supply Chain Power Structures. Marit. Policy Manag. 2022, 49, 323–346. [Google Scholar] [CrossRef]
  56. Meng, L.; Liu, K.; He, J.; Han, C.; Liu, P. Carbon Emission Reduction Behavior Strategies in the Shipping Industry under Government Regulation: A Tripartite Evolutionary Game Analysis. J. Clean. Prod. 2022, 378, 134556. [Google Scholar] [CrossRef]
Figure 1. Relationship between key entities in emission reduction investment game in port operations.
Systems 12 00134 g001
Figure 2. Overview structure of the investment decision framework.
Systems 12 00134 g002
Figure 3. Evolutionary strategy phase diagram.
Systems 12 00134 g003
Figure 4. Effect of n and θ on the port service price when the carbon-emission reduction investment strategies are (a) (Y, N), (b) (N, Y) and (c) (Y, Y).
Systems 12 00134 g004
Figure 5. Effect of n and θ on marginal profits of the shipping company when the carbon-emission reduction investment strategies are (a) (Y, N), (b) (N, Y) and (c) (Y, Y).
Systems 12 00134 g005
Figure 6. Effect of n and θ on the investment level when the carbon-emission reduction investment strategies are (a) (Y, N), (b) (N, Y) and (c) (Y, Y).
Systems 12 00134 g006
Figure 7. The effect of n and θ on the profits of the port when the carbon-emission reduction investment strategies are (a) (Y, N), (b) (N, Y) and (c) (Y, Y).
Systems 12 00134 g007
Figure 8. The effect of n and θ on the profit of the shipping company when the carbon-emission reduction investment strategies are (a) (Y, N), (b) (N, Y) and (c) (Y, Y).
Systems 12 00134 g008
Figure 9. Initial evolutionary stabilisation strategy.
Systems 12 00134 g009
Figure 10. The evolutionary stability of emission reduction technology investment Strategies for ports and shipping companies when (A) θ 0.01 , 0.1 , (B) θ 0.1 , 0.2 , (C) θ 0.2 , 0.3 , (D) θ 0.3 , 0.4 .
Systems 12 00134 g010
Figure 11. The effect of n and θ on the evolutionary game.
Systems 12 00134 g011
Figure 12. The evolutionary stability of emission reduction technology investment Strategies for ports and shipping companies when (A) θ 0.1 , 0.2 , α 0.5 , 0.6 , (B) θ 0.2 , 0.3 , α 0.7 , 0.8 , (C) θ 0.3 , 0.4 , α 0.9 , 1 .
Systems 12 00134 g012
Figure 13. The evolutionary stability of emission reduction technology investment Strategies for ports and shipping companies when (A) n = 0.02 , θ 0.3 , 0.4 , α 0.5 , 0.6 , (B) n = 0.02 , θ 0.3 , 0.4 , α 0.6 , 0.7 .
Systems 12 00134 g013
Table 1. Comparison between this study and other relevant studies.
PaperGovernment SubsidyCost SharingResearch ContentLow-Carbon
Preference
Factors AnalysisStrategic
Analysis
[18,30,31]
[9,14,20]
[19,25]
[16]
[39]
[13,27,40]
[24]
[49,50,51]
This paper
Table 2. Notations of the framework.
NotationsDefinition
Decision variables m Marginal profit per unit of product for shipping companies
e Level of investment in emission-reduction technologies
q Port service price
Parameters a The potential shipping market size
b Price sensitivity coefficient
θ Low-carbon preferences ( 0 < θ < 1 )
p Market price for port service
Q Market demand
n Government unit price subsidies for companies’ investment in emission-reduction technology
η Investment cost coefficient
α Cost-sharing ratios ( 0 < α < 1 )
π p Port profit
π s Shipping company profit
Table 3. Profit function.
Strategies π p π s
(N, N) q Q m Q
(Y, N) n + q Q η e 2 2 m Q
(N, Y) q Q m + n Q η e 2 2
(Y, Y) n + q Q 1 2 α η e 2 m + n Q 1 2 η e 2 1 α
Table 4. Optimal solution for port and shipping profits.
Strategies π p π s
(N, N) a 2 8 b a 2 16 b
(Y, N) a + b n 2 η 8 b η 2 θ 2 b a + b n 2 η 2 θ 2 4 b η 2
(N, Y) a + b n 2 η 8 b η 4 θ 2 a + b n 2 η 16 b η 8 θ 2
(Y, Y) a + 2 b n 2 α η 8 b α η 2 θ 2 a + 2 b n 2 η 2 b α 2 η + α 1 θ 2 2 θ 2 4 b α η 2
Table 5. Optimal solution for decision variables.
Strategies m q e
(N, N) a 4 b a 2 b 0
(Y, N) a + b n η 4 b η θ 2 2 a η 2 b n η + n θ 2 4 b η θ 2 a + b n θ 4 b η θ 2
(N, Y) a η 3 b n η + 2 n θ 2 4 b η 2 θ 2 a + b n 2 b a + b n θ 4 b η 2 θ 2
(Y, Y) a α η 2 b n α η + n θ 2 4 b α η θ 2 2 a α η + n θ 2 4 b α η θ 2 a + 2 b n θ 4 b α η θ 2
Table 6. Revenue Matrix.
Shipping CompaniesInvestment ( x )Non-Investment ( 1 x )
Ports
Investment ( y )( π p Y Y ,   π s Y Y )( π p Y N , π s Y N )
Non-investment ( 1 y )( π p N Y , π s N Y )( π p N N , π s N N )
Table 7. Stability of the equilibrium point.
Equilibrium Points d e t   J t r   J Stable ConditionsStability
(0, 0) +-Unstable
(0, 1)+ π s Y Y π s Y N < 0 and π p N N π p Y N < 0 Stable
(1, 0)+ π s N N π s N Y < 0 and π p Y Y π p N Y < 0 Stable
(1, 1)+ π s Y N π s Y Y < 0 and π p N Y π p Y Y < 0 Stable
( x * ,   y * )00-Unstable
Table 8. The values of the relevant parameters.
ParametersValueData References
a 500[14,41]
b 1[42]
n 0 ,   30 [24,40]
η 500[24,29]
θ 0 ,   1 [24,39,41]
α 0 ,   1 [24,33]
Table 9. The sensitivity under different strategies.
StrategiesIndependent VariableDependent Variable
PortsShipping Companies q m e π p π s
YN n ++++
NY++++
YY×++++
YN θ ××++
NY×××++
YY++×++
Disclaimer/Publisher’s Note: The statements, opinions and data contained in all publications are solely those of the individual author(s) and contributor(s) and not of MDPI and/or the editor(s). MDPI and/or the editor(s) disclaim responsibility for any injury to people or property resulting from any ideas, methods, instructions or products referred to in the content.

