Article

Optimizing Maintenance Resource Scheduling and Site Selection for Urban Metro Systems: A Multi-Objective Approach to Enhance System Resilience

Department of Construction Management and Real Estate, School of Civil Engineering, Southeast University, Nanjing 211189, China
*
Author to whom correspondence should be addressed.
Systems 2024, 12(7), 262; https://doi.org/10.3390/systems12070262
Submission received: 30 May 2024 / Revised: 18 July 2024 / Accepted: 19 July 2024 / Published: 21 July 2024
(This article belongs to the Topic SDGs 2030 in Buildings and Infrastructure)

Abstract

:
This study developed an optimization model for the strategic location of maintenance resource supply sites and the scheduling of multiple resources following failures in urban metro systems, with the objective of enhancing system resilience. The model employs a multi-objective optimization framework, focusing primarily on minimizing resource scheduling time and reducing costs. It incorporates critical factors such as spatial location, network topology, station size, and passenger flow. A hybrid method, combining the non-dominated sorting genetic algorithm III and the technique for order of preference by similarity to ideal solution, is used to solve the model, with its effectiveness confirmed through a case study of the Nanjing Metro system. The simulation results yielded an optimal number of 21 maintenance resource supply stations and provided their placement. In the event of large-scale failures, the optimal resource scheduling strategy ensures demand satisfaction rates exceed 90% at critical stations, maintaining an overall rate of 87.09%, therefore significantly improving resource scheduling efficiency and the system’s emergency response capabilities and enhancing the physical resilience and recovery capabilities of the urban metro system. Moreover, the model accounts for economic factors, striving to balance emergency response capabilities with production continuity and cost efficiency through effective maintenance strategies and resource utilization. This approach provides a systematic framework for urban metro systems to manage sudden failures, ensuring rapid recovery to normal operations and minimizing operational disruptions in scenarios of limited resources.

1. Introduction

The urban metro system (UMS) is the primary form of urban rail transit. It plays a crucial role in improving urban traffic structures, alleviating traffic pressure, and promoting socio-economic development, making it an essential lifeline infrastructure for cities [1]. With the expansion of the UMS, the increase in complexity and interconnectivity, and the growing prominence of network effects [2,3], the number of sudden disasters and malfunctions faced during the operational phase of the UMS is also increasing. These sudden events not only cause significant social negative impacts but also lead to immeasurable economic losses. To address these challenges, the urban metro system must continuously enhance its resilience and emergency repair response capabilities.
A reasonable post-repair resource scheduling strategy can quickly and effectively repair damaged equipment and facilities, thereby restoring their normal functions and performance. This strategy reflects the recovery capability of the UMS’s physical resilience, that is, the system’s ability to return to normal operating status swiftly after suffering damage or malfunction. Through post-repair activities, the UMS can quickly respond to occurred malfunctions, reduce downtime and operational interruptions during the recovery process, and ensure continuous system operation and work efficiency. Post-repair, as a responsive activity, focuses on resolving already occurred malfunctions, damages, or anomalies. By mobilizing resources such as manpower and materials, and taking repair measures like fixing, replacing damaged components, and recalibrating, the repair strategy aims to restore the normal working state of UMS equipment or systems as quickly as possible to minimize system interruption time and losses. A reasonable post-repair resource scheduling strategy is an important component of enhancing the overall resilience of the UMS. It helps the system recover quickly from adverse states, reduces losses, and ensures the stability and sustainability of production and operations. During the post-repair process, economic considerations are also crucial, requiring a balance between repair costs and the continuity of system operation. By planning reasonable repair strategies, resource utilization can be maximized, ensuring that the UMS can be repaired in the most cost-effective way when facing malfunctions, thereby achieving a win–win situation between production continuity and cost efficiency.
Currently, research on UMS maintenance primarily focuses on maintenance techniques, equipment status [4] and reliability [5], system risk [6], and design and management models [7]. However, there is relatively little research on the application of maintenance resource supply station location and post-failure maintenance resource scheduling strategy models. With the continuous improvement of the UMS network, based on the concept of network-wide maintenance, which differs from the segmented and specialized maintenance models, constructing a comprehensive maintenance network for urban rail transit, and achieving rational distribution of comprehensive maintenance institutions and resource scheduling on the UMS network, has become a crucial aspect of urban rail transit network health management [8]. In existing research, classical location problems, such as those involving logistics institutions [9] and road institutions, primarily relate to scenarios where point-based service facilities provide services to point-based demand objects. However, the activities of UMS maintenance institutions occur on the metro network, with location decisions constrained by the metro network and its routes, and the coverage area needs to be continuous. Thus, UMS maintenance institution location problems differ from other studies in terms of location objects and coverage area requirements. Moreover, most studies adopt single-objective models or multi-objective models weighted into a single objective for solutions, which cannot directly reflect the impact of various factors on emergency resource scheduling [10]. Lu et al. [11] improved upon traditional facility location models by proposing a weight allocation algorithm based on the influencing factors of emergency resource distribution. The algorithm aims to minimize the number of maintenance resource supply points while ensuring complete coverage of emergency resources and meeting the minimum number of emergency points required by standards. To this end, they developed an optimization model for the location of subway maintenance resource supply points and implemented and solved the model using Lingo software. Although the model focuses on minimizing the number of maintenance supply points, multiple objectives such as cost, response time, and resource utilization rate often need to be considered in practice, making a single-objective optimization strategy potentially insufficient. For the purposes of minimizing rescue time and construction costs, Cao et al. [12] established an optimization model for emergency station location with the goal of minimizing the combined costs of time and emergency station construction, solving the optimal resource configuration using the dynamic programming backward method. Wang et al. [13] aimed to minimize construction, operational, and equipment costs in their optimization model for the location of high-speed railway infrastructure maintenance facilities, programming and computing the model with Lingo software. This approach has two shortcomings: firstly, the location of emergency stations only considered coverage of demand points and not the volume of demand, which should lead to a denser concentration of emergency stations near high-demand points; secondly, the model only considered the cost of resource storage and not the costs associated with dispatching and transporting resources. Li et al. [14] aimed to reduce customer waiting times, minimize excessive human resource usage, and maximize cost-effectiveness of resources, solving the model using the NSGA-II algorithm. Kim et al. [15] considered the weight of each demand point based on traffic load with the objective of minimizing the total weighted travel distance from each supply point to the nearest facility, solving the optimal maintenance resource supply location using a genetic algorithm. A limitation of their study is the assumption that each node can only be assigned to one hub, which may not reflect real-world scenarios where resources might need to be dynamically allocated based on available reserves. Additionally, their study did not determine a dispatch strategy from supply points to demand points, nor did it consider the costs of dispatching. Therefore, it is necessary to propose a computational model suitable for UMS maintenance resource supply station location and resource scheduling optimization, considering both maintenance efficiency and cost. This approach can not only enhance the emergency response capability of the UMS but also ensure rapid recovery of the system in case of failures, thereby reducing negative impacts on urban traffic and the economy. Through such a comprehensive optimization strategy, the maintenance needs of the UMS in a complex network environment can be better met, ensuring stable operation and efficient management of the metro system. This is of great significance for enhancing the overall resilience and reliability of urban rail transit systems. This study addresses the optimization problem of location selection and post-failure maintenance resource scheduling for UMS maintenance institutions by constructing a multi-objective optimization model. The model focuses on two main objectives: the shortest resource scheduling time and the lowest resource scheduling cost. Under the constraints of the number of maintenance resource supply institutions, coverage area, and allowable maximum resource scheduling time, this paper proposes an optimization model suitable for the location selection and resource scheduling of UMS maintenance resource supply sites after failures.
This study is divided into several parts. Section 2 provides an in-depth analysis of the characteristics, constraints, and objectives of the problem and constructs a corresponding multi-objective programming model. It also designs a strategy for solving the model. Section 3 validates the effectiveness of the model through case analysis. Section 4 offers a detailed analysis and discussion of the model results and conducts sensitivity analysis. Finally, this study provides a comprehensive summary of the entire paper.

2. Problem Description and Model Construction

2.1. Problem Description

This study primarily aims to optimize the site selection for UMS maintenance resource supply stations and the scheduling strategies for post-fault resource allocation, enhancing the system’s recovery capabilities. Each maintenance resource—encompassing acquisition, transportation, and storage—incurs specific costs. The site selection for different maintenance resource supply stations and their resource scheduling strategies significantly influences the dispatch time and the satisfaction of demand at various stations. Our optimization goals are twofold: minimize both the costs and time required while fulfilling the demand for maintenance resources at faulted stations as completely as possible. In achieving these goals, we must also adhere to several critical constraints. Firstly, the scheduling time for maintenance resources must meet the maximum time standards set by regulations, as delays in resource delivery can prolong system downtimes and exacerbate the impacts of faults. Secondly, the number of maintenance resource supply stations is not unlimited; it must be proportionate to the number of demand sites needing resources. Lastly, the quantity of maintenance resources dispatched from any given supply station must not exceed the station’s actual supply capacity, and, similarly, the resources delivered to a demand site must not exceed its actual needs. This research not only seeks to optimize operational efficiencies and cost-effectiveness but also aims to ensure compliance with regulatory constraints, maintaining a balance between resource availability and demand satisfaction. Through strategic site selection and resource scheduling, we aim to minimize the impact of faults and enhance the resilience of the UMS.
Maintenance resources, as an indispensable part of the maintenance system for the UMS’s physical facilities, encompass the human resources, physical resources, and time resources required for maintenance activities. The effective allocation and utilization of these resources form the material basis for maintenance support activities. Based on the characteristics of the UMS, maintenance resources can be categorized into three major types: maintenance personnel, maintenance equipment, and maintenance materials. Maintenance personnel refer to the technicians responsible for carrying out specific repair tasks, and the diversity of their skills and professional backgrounds is crucial for ensuring the efficient completion of maintenance tasks. Maintenance equipment includes all tools and devices needed for repair, maintenance, or inspection tasks, such as various manual and power tools and measurement and diagnostic instruments. Maintenance materials involve all the materials, replacement parts, and consumables used in maintenance activities, such as spare parts, lubricants, and cleaning agents. By classifying and allocating maintenance resources, UMS managers can gain deeper insights into the resource needs during the repair process, thereby optimizing resource allocation to effectively enhance the efficiency and quality of maintenance work, thus enhancing the resilience of the UMS to fault disturbances.
After an equipment failure occurs, rapid emergency response and rescue operations are crucial as they directly impact the efficiency of fault handling and the recovery of system performance. Therefore, the main indicators for measuring the effect of maintenance resource dispatch strategies on the physical resilience of the UMS include the resource dispatch time and the degree of demand satisfaction at resource demand sites. The maintenance resource supply station, as a crucial component of the emergency repair system, plays a decisive role in enhancing the efficiency of emergency repairs through the rationality of its location and the adequacy of its configuration. During emergency repairs, the dispatch time of maintenance resources is strictly limited. According to the “Safety Assessment Regulations during the Operation of Urban Rail Transit” [16], the response and handling range of the regional emergency center should ensure coverage of at least a 5 km radius of the network, and emergency response resources should be able to reach the fault site within 20 min. Therefore, a reasonable and effective plan is needed to allocate limited maintenance resources to ensure that resources are fully and rationally utilized. To meet these requirements, optimizing the location of UMS maintenance resource supply stations becomes a primary task, aiming to minimize the average dispatch time while ensuring that the dispatch time under the most adverse conditions does not exceed the prescribed 20 min. In the UMS, any station could potentially experience a fault disturbance; thus, all stations should be considered as potential demand sites. The resulting constraint is to ensure that each station can receive maintenance resources within the maximum allowed dispatch time. Therefore, the optimization goal is to minimize the average response time from the resource supply station to each demand station for maintenance personnel, equipment, and materials, thereby enhancing the overall system’s emergency response efficiency and rescue capability. The factors influencing the location of emergency maintenance resource supply sites mainly include the following four aspects:
(1)
Local Spatial Accommodation Factors
In planning emergency maintenance resource supply sites, the choice of spatial location is crucial. Supply sites should be reasonably and evenly distributed at key positions in the system or network to ensure timely coverage of all potential fault locations. By establishing these supply sites at critical locations, the efficiency and coverage of fault emergency responses can be maximized, ensuring rapid and effective repair and recovery work when problems occur, thereby minimizing the impact on the operation of the UMS system;
(2)
Network Topology Factors
The topology of the UMS system or network has a direct impact on the planning of emergency maintenance resources. Transfer stations, junctions, and stations with multiple lines are usually key nodes in the network, thus requiring more emergency resource support. These nodes play an important role in the network, and their failure could have a greater impact on the entire system. Therefore, when planning emergency maintenance resources, the location of these key nodes must be considered, and sufficient emergency resources must be reasonably deployed nearby to ensure a rapid and effective response to potential faults;
(3)
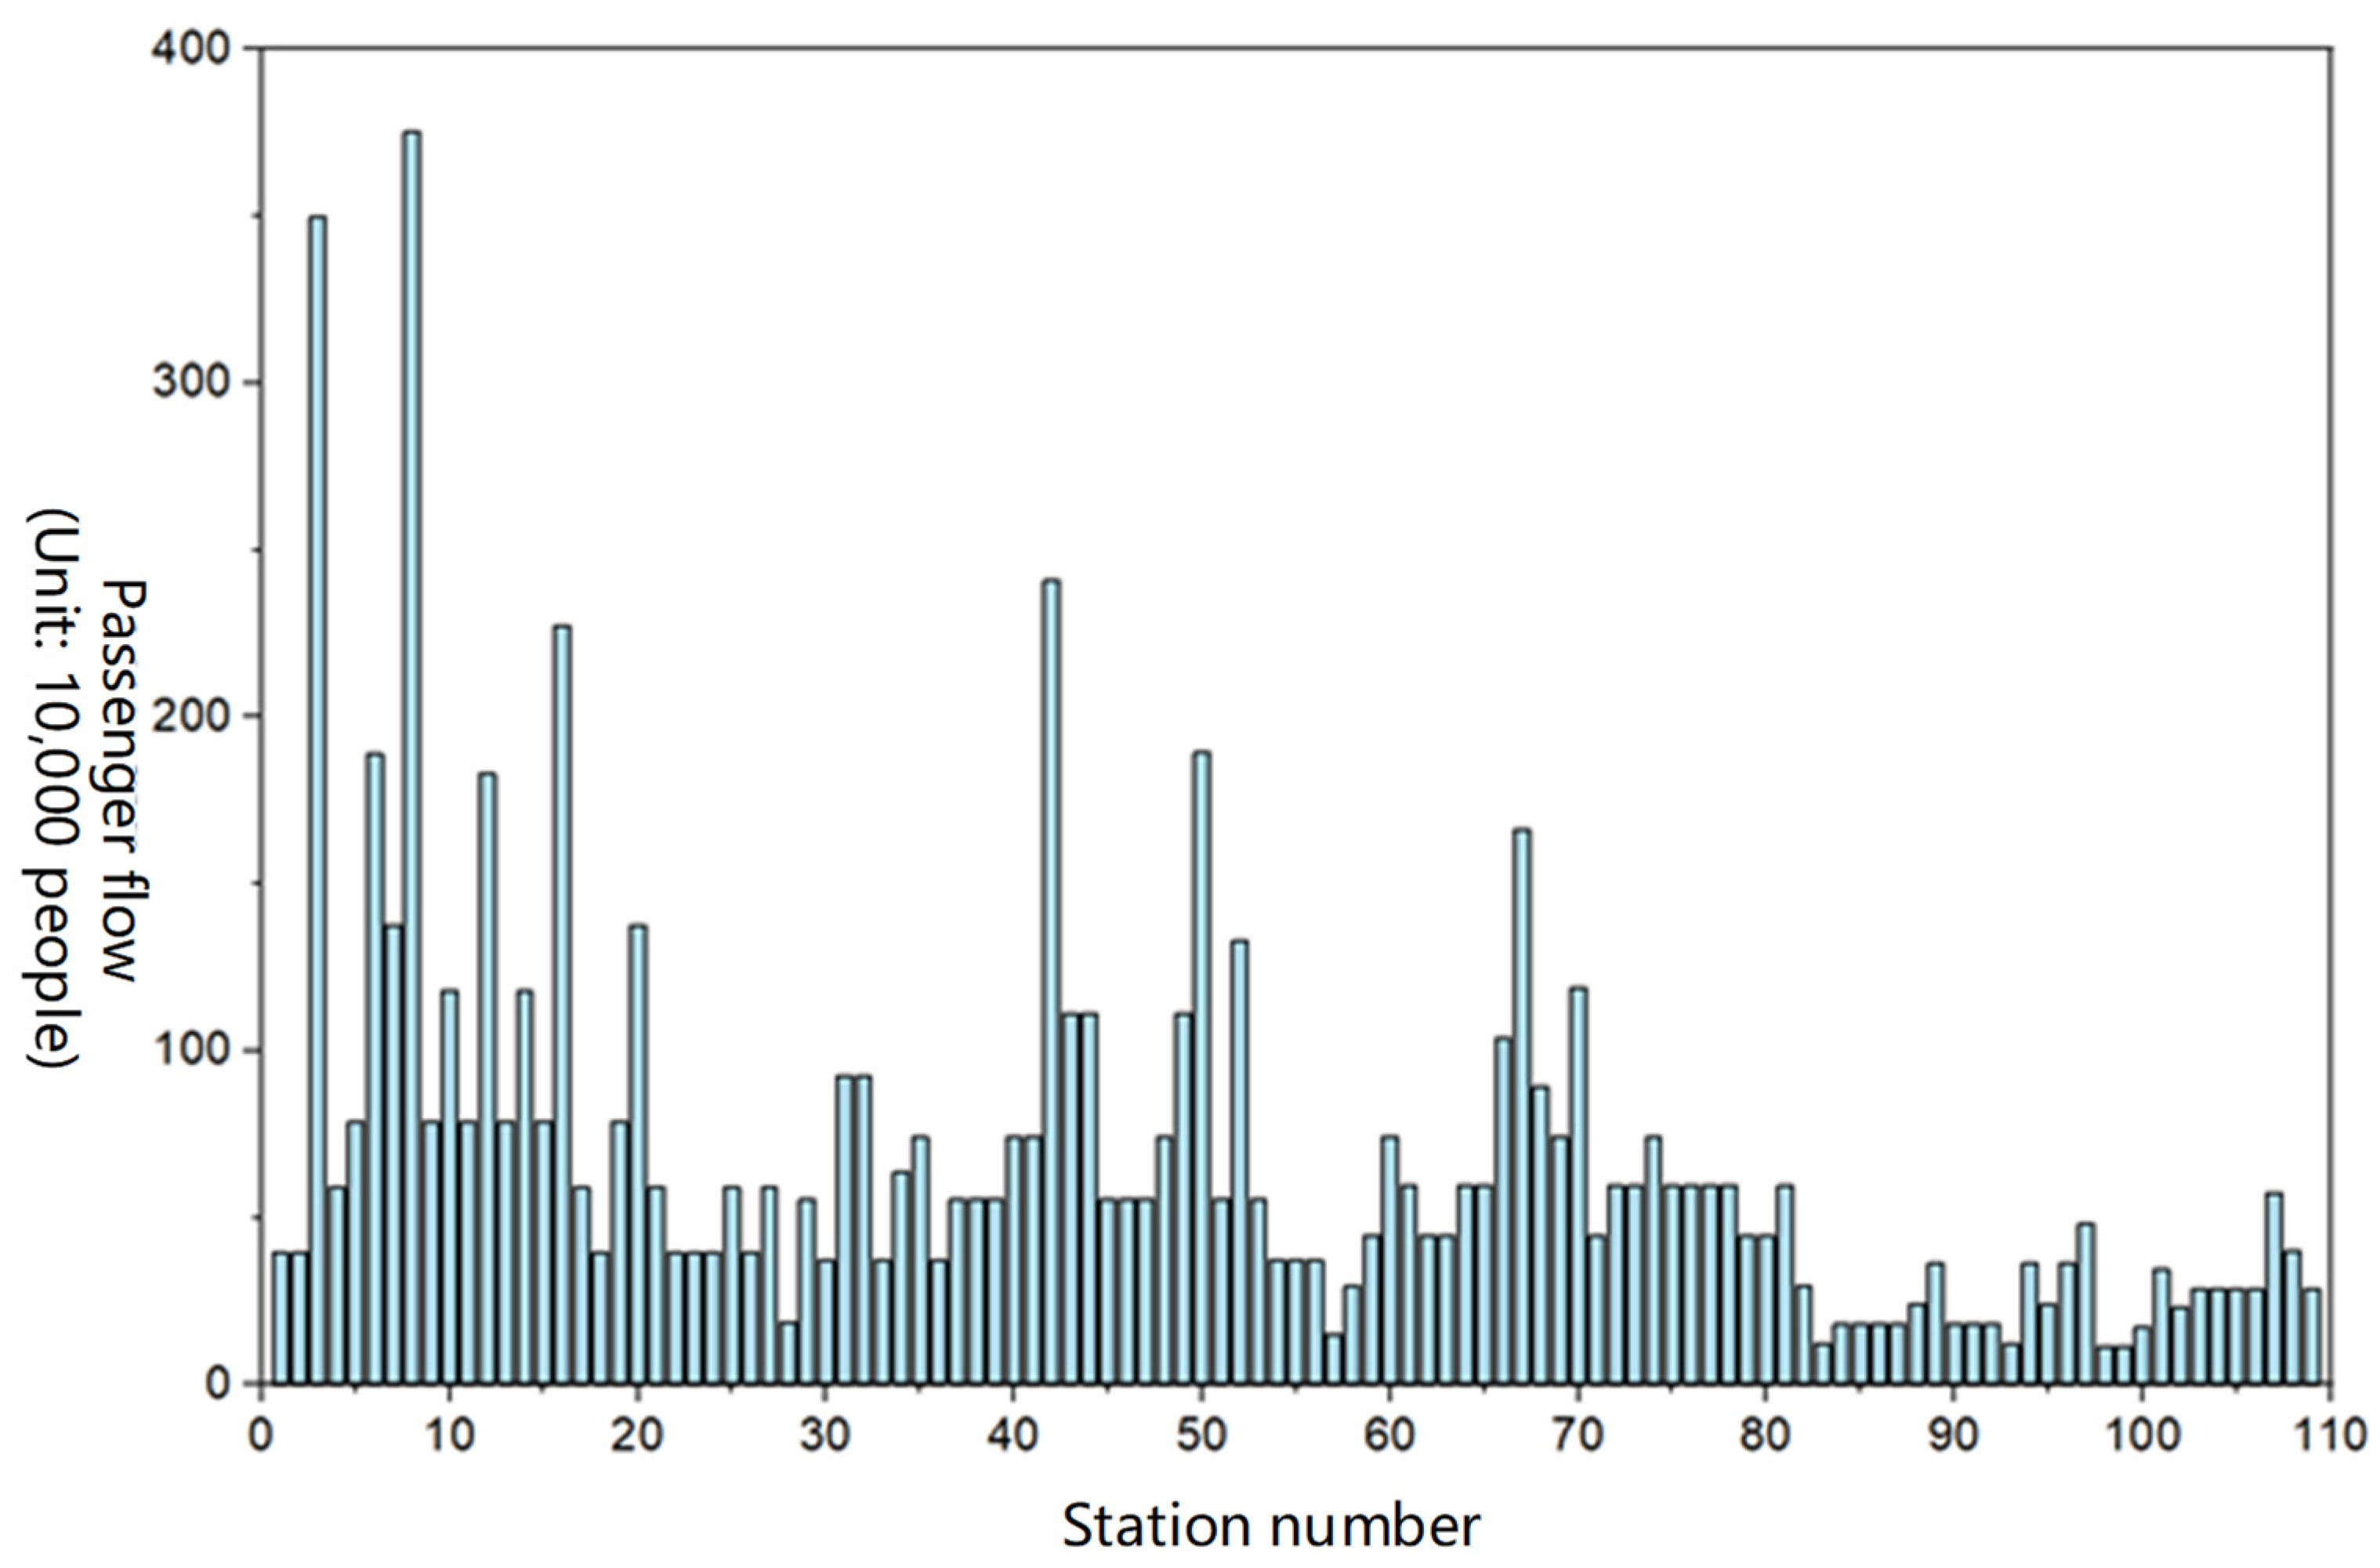
Station Size and Passenger Volume Factors
The larger the station, the more equipment and facilities it has and the higher the probability of faults. Similarly, larger stations generally mean busier traffic and higher passenger flow, which also increases the likelihood of equipment and facility failures. At the same time, the larger the station, the more passengers are affected by delays due to faults. To minimize the impact of sudden events on operations, emergency resource deployment should focus on very large and large stations. From the feasibility perspective of emergency point setup, larger stations are easier to equip because they usually have more space to accommodate emergency resource facilities and have a higher demand, thus more effectively responding to emergencies and reducing the impact on the entire system;
(4)
Economic Factors
Although deploying as many emergency maintenance resource supply sites as possible is beneficial for efficient and timely dispatch of post-fault repair materials, excessive deployment could lead to costs exceeding the financial capacity of the UMS operating units. Therefore, cost factors need to be considered comprehensively during the planning process to ensure effective resource deployment within an acceptable budget. This means balancing investment and outcomes to ensure optimal resource utilization, while ensuring that the quantity and location of emergency maintenance resources meet actual needs. Through careful cost analysis and budget planning, it is possible to effectively control operational costs while ensuring emergency response capabilities, thus ensuring the continuous and stable operation of the UMS system in emergencies.

2.2. Model Construction

Effectively addressing the challenges of shortages in maintenance support resources and time constraints is key to enhancing the resilience of the UMS physical systems to fault disturbances. Conventional emergency repair material dispatch strategies tend to choose the supply site closest to the demand site for material supply, requiring that the selected supply site’s storage meets or exceeds the material needs of the demand site [17]. However, when facing widespread emergency repair needs, this single-choice strategy often fails to meet actual demands, leading to the need for optimized scheduling of multiple supply sites. Additionally, it is essential to assess the importance of different fault points, prioritizing those that have a greater impact on the system and are of higher importance. Within this framework, the formulation of optimization strategies should unfold in two main aspects: first, defining the number and spatial locations of maintenance resource supply sites; second, devising an optimized scheduling plan for maintenance resources. The latter, based on the resource demands of the maintenance points and the resource reserves at the supply sites, ensures that maintenance resources are efficiently and reasonably allocated to each demand site, thereby achieving rapid and efficient deployment of maintenance resources [18,19]. Maintenance resources, including personnel, equipment, and materials, should be considered in the scheduling plan, taking into account the characteristics and needs of different resource types. The issue of maintenance resource supply site location is crucial to ensure the convenience and efficiency of resource supply. By designing scientific location and scheduling strategies, it is possible to effectively ensure the stability of system operations and the efficiency of maintenance operations under the dual challenges of resource scarcity and time pressure, thereby further enhancing the system’s overall resilience to various equipment faults.
Since equipment failures are random, any station can potentially be affected. Therefore, when planning for emergency maintenance resources, each station is considered a demand site for emergency maintenance resources, requiring the dispatch of maintenance personnel, equipment, and materials from a central supply center. In locating emergency maintenance resource supply sites and developing resource scheduling plans, it is crucial to consider each station comprehensively. Given the characteristics of emergency repair material dispatch for UMS equipment and facilities, the optimization goals of emergency repair time and transportation costs should be prioritized. Based on these goals and constraints, this study has developed an emergency resource scheduling model aimed at minimizing time and costs, as illustrated in Figure 1. This model addresses the issue of multi-supply-site-to-multi-demand-site transportation scheduling and location optimization for various materials.
As previously mentioned, the stochastic nature of equipment and facility failures means that any metro station could potentially be impacted. Consequently, this study identifies every station (including line intervals attributed to the management of metro stations) as a potential demand point for maintenance resources, denoted as A = { A 1 , A 2 , , A n } and indexed by i . Maintenance resource supply sites are selected from all stations and are denoted as V = { V 1 , V 2 , , V m } , indexed by j , and V A . When a fault occurs, various types of maintenance resources are required to support the repair of the fault node. The maintenance resource type set is denoted as K = { K 1 , K 2 , , K p } and is indexed by k . The optimization model aims to optimize the scheduling of maintenance resources after UMS equipment facility faults by determining the optimal number of maintenance resource supply sites m , the setting options for maintenance resource supply site y j , and the maintenance resource dispatch strategy x i , j k . Specifically, if a site j is selected as a maintenance resource supply site, then y j is set as 1; otherwise, y j is 0. The maintenance resource dispatch strategy x i , j k represents the number of units of resource type k dispatched from supply site V j to demand site A i . For example, if demand site A 4 receives 2 units of resource type K 3 dispatched from supply site V 1 , then it can be denoted as x 4 , 1 3 = 2 .

2.2.1. Resource Allocation Time Calculation

The distance from a maintenance resource demand site A i to a resource supply site V j is denoted as D i j , and the speed of transporting resource K k is denoted as v k . Therefore, the time required to dispatch resource K k from the supply site V j to the demand site A i is denoted as t i , j k , and can be calculated as follows:
t i , j k = D i j v k
Since each demand site may require resources from multiple emergency repair resource supply sites. The completion time for emergency response depends on the time taken to allocate resources from the repair resource supply point with the longest duration, denoted as t , which can be calculated as follows:
t = max ( ε t i , j k ) ,   i A , j V , k K
where ε is the judgment factor, where ε = { 0 ,   x i , j k = 0 1 ,   x i , j k 1 . If the repair resource demand point A i receives resources dispatched from the repair resource supply site V j , ε is 1, otherwise ε is 0. The average allocation time t a v e r a g e can be calculated as the sum of the times for each dispatch divided by the number of dispatches:
t a v e r a g e = i = 1 n j = 1 m k = 1 p ε t i , j k i = 1 n j = 1 m k = 1 p ε

2.2.2. Total Resource Allocation Cost Calculation

Total resource allocation costs include the total cost of resources C r e s o u r c e , the resource transportation C t r a n s p o r t , the resource storage C s t o r a g e , and the penalty for unmeet demands C p e n a l t y .
(1)
Resource Cost Calculation
Let the cost set for each unit resource K k be denoted as c k = { c 1 , , c p } , Then, the total cost of resources involved in the emergency repair C r e s o u r c e can be calculated as follows:
C r e s o u r c e = i = 1 n j = 1 m k = 1 p ( x i , j k c k )
(2)
Resource Transportation Cost Calculation
Let the set of transportation costs for each unit of resource type K k be denoted as c t k = { c t 1 , , c t p } . The total transportation cost C t r a n s p o r t of resources in emergency repair scheduling can be calculated as follows:
C t r a n s p o r t = i = 1 n j = 1 m k = 1 p ( x i , j k D i j c t k )
(3)
Resource Storage Cost Calculation
Let the storage cost for each unit of resource K k be denoted as c s k . The total storage cost C s t o r a g e of resources in emergency repair scheduling can be calculated as follows:
C s t o r a g e = j = 1 m k = 1 p c s k V K j k
(4)
Penalty costs calculation for unmet demand
Let the demand amount of demand site A i for resource K k be denoted as A K i k . The actual supply of resource K k received by demand site A i , A K i k * can be calculated as follows:
A K i k * = j = 1 m x i , j k , i A , j V , k K
Let the penalty cost for each unit resource K k that is not satisfied be denoted as p k , and the importance of demand node A i be denoted as ω i , where a higher importance leads to higher penalty costs if the demands of the node are not met. Thus, the penalty cost P i for the unmet demands of demand node A i can be calculated as follows:
P i = k = 1 p ( A K i , k A K i , k * ) ω i p k
The total penalty costs C p incurred due to unmet demands across all demand sites can be calculated as follows:
C p = i = 1 n P i

2.2.3. Multi-Objective Optimization Model and Related Parameters

As previously mentioned, after a UMS failure, the scheduling of maintenance resources faces the complexity of supplying repair materials with varying demands across multiple supply and demand sites. The location selection for emergency supply sites needs to consider factors such as the timeliness of resource scheduling and transportation costs. Under these constraints, the goal of emergency maintenance resource scheduling is to achieve the shortest possible scheduling time and the lowest scheduling costs. Therefore, the emergency supply transportation issue involves a complex multi-objective optimization problem that integrates multiple types of supplies and multiple start and end points.
(1)
Model assumptions:
(1)
After a failure, maintenance resource supply stations are selected within the stations themselves, and locations outside the UMS jurisdiction are not considered;
(2)
Resources dispatched from the supply sites are transported in one trip, without considering multiple transports;
(3)
Different types of resources dispatched from a maintenance resource supply site can depart simultaneously without interfering with each other;
(4)
A resource demand point can receive resources from one or multiple maintenance supply sites;
(5)
The mode of travel from the maintenance resource supply sites to the failure station is by car, with the speed calculated based on the travel time during peak hours on weekdays at 40 km/h as per Baidu Maps [11];
(2)
Model objective function
The first optimization goal is to minimize the average scheduling time:
F 1 = Min ( t a v e r a g e ) = Min ( i = 1 n j = 1 m k = 1 p ε t i , j k i = 1 n j = 1 m k = 1 p ε )
The second optimization goal is to minimize the costs associated with resource scheduling:
F 2 = Min ( C r e s o u r c e + C t r a n s p o r t + C p e n a l t y + C s t o r a g e ) = Min ( i = 1 n j = 1 m k = 1 p ( x i j k ( c k + D i j c t k ) ) + i = 1 n k = 1 p ( A K i , k A K i , k * ) ω i p k                           + j = 1 m k = 1 p c s k V K j k )
(3)
Model decision variables:
(1)
The number of emergency maintenance resource supply sites m ;
(2)
The siting options for maintenance resource supply site y j = { 0 , 1 } ;
y j = { 1 ,   A j   is   selected   as   emergency   maintenance   resource   supply   site 0 ,   Otherwise
(3)
The scheduling scheme for emergency repair resources x i , j k : the quantity of type k resources received at demand site A i from supply site V j ;
(4)
Model constraints
x i , j k , m
j = 1 m x i , j k A K i k ,   i { 1 , 2 , , n } ,   k { 1 , 2 , p }
i = 1 n x i , j k V K j k ,   j { 1 , 2 , , m } ,   k { 1 , 2 , p }
D i , j v k t max ,   i { 1 , 2 , , n } ,   j { 1 , 2 , m }
1 6 m n 1 4
t a v e r a g e t max
Equation (13) ensures that the number of emergency maintenance resource supply sites m and the amount of resources x i , j k dispatched from these supply sites V j to the demand sites A i are non-negative integers.
Equation (14) ensures that the resources transported to the demand sites A i do not exceed their required quantities A K i k .
Equation (15) ensures that the output of maintenance resources from the supply sites V j does not exceed their supply capacities V K j k .
Equation (16) ensures that the resource scheduling time from any demand site to the emergency maintenance resource supply site does not exceed the standard time. It is 20 min in China according to the ‘Urban Rail Transit Operation Period Safety Assessment Specifications’ issued by the China Ministry of Transport.
Equation (17) ensures that the ratio of emergency resource supply sites to demand sites is between 1:6 and 1:4, as proven in the literature [15,16].
Equation (18) ensures that the average scheduling time of emergency maintenance resources does not exceed the max time t max , which is 20 min as stipulated by the ‘Urban Rail Transit Operation Period Safety Assessment Specifications’ provided in [16].

2.3. Solution Method

2.3.1. Method Comparison and Selection

Traditional methods typically convert multi-objective optimization problems into single-objective problems using approaches such as the linear weighted sum method, constrained optimization method, or goal programming, and then solve them using single-objective optimization algorithms [20]. However, these methods are not suitable for this study. This is because the objective functions involved in the multi-objective optimization problem of preventative maintenance strategies in this research are nonlinear and exhibit nondeterministic polynomial-time hardness (NP-hard) characteristics. NP-hard problems require polynomial time to reduce to a specific problem, which means that preventative maintenance scheduling issues cannot be efficiently solved using traditional algorithms [21]. Additionally, the optimization must consider two distinct objectives simultaneously: scheduling time and scheduling costs. Each objective possesses unique attributes, units of measurement, and magnitudes, making direct comparison through weighting impractical. Traditional methods have limited search capabilities and global optimization power in the solution space. When dealing with multi-objective optimization problems with complex solution spaces and conflicting sub-goals, be aware that these problems might rely excessively on mathematical formalization and artificially set weights. That often leads to local optima and struggling to effectively find the optimal solution set, thus performing poorly in handling complex issues. In contrast, intelligent optimization algorithms, by simulating natural processes, possess adaptive search strategies, global optimization capabilities, and diversity maintenance mechanisms. Intelligent optimization algorithms can explore the solution space more efficiently and find high-quality optimal solution sets, and usually show stronger performance and robustness in complex multi-objective optimization problems Therefore, intelligent algorithms are a suitable choice for solving the problems of this research [22,23].
The goal of multi-objective optimization using intelligent algorithms is to find a Pareto-optimal solution set. A Pareto-optimal solution set consists of solutions where no single solution is completely superior across all objectives. In other words, each solution in this set represents a trade-off among various conflicting objectives, and improvement in one objective can only be achieved at the expense of another. In a Pareto-optimal set, each solution is non-dominated, meaning there is no other solution in the set that is better in all objectives. This concept is crucial in scenarios where it is impossible to simultaneously optimize all objectives to their fullest extent. By examining the Pareto-optimal solutions, decision-makers can understand the trade-offs involved and select a solution that best meets their specific criteria or preferences. As the number of objectives increases, the Pareto set evolves from a point to a curve or line segment and eventually to a surface with three objectives. Pareto solutions are optimal across multiple objectives and cannot be improved further. Srinivas and Deb [24] introduced the non-dominated sorting genetic algorithm (NSGA), which uses evolutionary processes to find Pareto-optimal solutions. The NSGA employs non-dominated sorting and crowding distance techniques to maintain diversity and ensure comprehensive solution sets. The NSGA is effective but can struggle with slow convergence and uneven solution distribution in complex scenarios. To address these issues, Deb et al. [25] developed the NSGA-II, which enhances algorithm performance and solution distribution. As the solution count grows, however, the NSGA-II may face reduced evolutionary pressure. For more than three objectives, Deb and Jain [26] proposed the NSGA-III, replacing crowding distance with reference points to better manage diversity and avoid local optima. Compared to other evolutionary algorithms such as the NSGA-I, NSGA-II, or SPEA2, the NSGA-III demonstrates superior performance in maintaining a diverse set of Pareto-optimal solutions across multiple objectives. It addresses the scalability issues encountered in its predecessor, the NSGA-II, by incorporating a reference point-based approach to preserve diversity. This is crucial for ensuring comprehensive coverage of the Pareto front in multi-objective scenarios, which are prevalent in complex systems like the UMS. The NSGA-III represents a significant advancement in evolutionary algorithms, specifically engineered to tackle the inherent challenges of complex multi-objective optimization problems that feature numerous conflicting objectives. We selected the NSGA-III for its robust capability to efficiently manage the high-dimensional objective space typical of multi-objective optimization in the UMS. This algorithm uses a reference point-based approach to maintain a diversity of solution populations, which is essential for ensuring a comprehensive exploration of the solution space. Furthermore, the NSGA-III employs an improved sorting mechanism that effectively differentiates solutions along complex Pareto fronts, thereby overcoming the limitations of earlier algorithm versions. This enhancement is pivotal for better convergence toward the optimal frontier, aligning with our research objectives where cost minimization and time minimization are often in conflict. The strength of the NSGA-III lies in its ability to balance these competing objectives, thus providing feasible, optimized solutions tailored to the complex dynamics of the UMS. Additionally, the NSGA-III is widely recognized for its proficiency in handling multi-objective problems with extensive objectives, as underscored in seminal studies [27,28]. By employing the NSGA-III, our study not only addresses the immediate challenges of maintenance resource scheduling but also aids in achieving broader goals of enhancing the resilience and efficiency of the UMS. This ensures that the systems can withstand operational disruptions and recover swiftly.
Machine learning models have been utilized to improve optimization processes by learning from data and making predictions that guide the search for optimal solutions. Techniques such as Gaussian Processes, Support Vector Machines, and Random Forests have been integrated into multi-objective optimization to predict and model objective functions efficiently. Liu et al. [27] improved the NSGA-III using genetic k-means clustering, demonstrating significant enhancements in convergence speed and solution diversity. Deep learning models, particularly neural networks, have shown promising results in handling complex, high-dimensional optimization problems. They can learn representations and capture intricate patterns that traditional optimization algorithms might miss. Zhao et al. [4] utilized a continuous wavelet transform and a Gaussian Convolutional Deep Belief Network for intelligent diagnosis in optimization, showcasing the effectiveness of deep learning in predictive maintenance and optimization tasks. Hybrid methods that integrate AI techniques with traditional optimization algorithms have proven effective. These approaches leverage the strengths of both paradigms to enhance performance. Awad et al. [28] combined the NSGA-III with clustering algorithms to address portfolio management issues, showing significant improvements in maintaining diversity and achieving high-quality solutions.
The primary goal of this study is to enhance the resilience of the UMS by developing an optimization model for the strategic location of maintenance resource supply points and the scheduling of various resources post failure. This study identified optimal locations and resource scheduling strategies, and the NSGA-III is well-suited to solving our problem due to several advantages compared to ML and DL methods. The NSGA-III, as an evolutionary algorithm, iteratively evolves a population of solutions and does not rely on large-scale training data, which is particularly important for metro systems where much of the relevant data are confidential and unreliable, making it difficult to gather the large datasets required for ML and DL models. Moreover, the NSGA-III is specifically designed for multi-objective optimization, effectively handling multiple conflicting objectives (such as time and cost) by using non-dominated sorting and reference points to find a balanced Pareto-optimal set of solutions. This generates a diverse set of solutions, offering decision-makers a wide range of choices for different scenarios. Additionally, evolutionary algorithms like the NSGA-III are highly adaptable and robust, capable of handling complex, non-linear, and constrained optimization problems without requiring assumptions about data distribution. This makes them suitable for varied metro system maintenance needs. In contrast, ML and DL methods often require complex designs, substantial computational resources, and domain expertise for model tuning. Furthermore, the NSGA-III can leverage parallel computing to enhance computational efficiency, incrementally approaching optimal solutions through generational evolution, allowing flexible allocation of computational resources. This makes the NSGA-III an ideal choice for solving the optimization problem of maintenance resource supply point location and resource scheduling in urban metro systems, given its low data requirements, strong multi-objective optimization capabilities, high adaptability, robustness, and computational efficiency.
TOPSIS is employed for its effectiveness in decision-making scenarios that require a clear ranking of multi-objective optimization results. This method is particularly advantageous due to its methodological simplicity and its capability to provide a straightforward computational approach for assessing the proximity of each solution to the ideal solution. Unlike other multi-criteria decision-making methods such as the Analytical Hierarchy Process (AHP) or VIKOR, TOPSIS does not necessitate the intensive pairwise comparison and consistency checks required with the AHP, nor does it solely rely on the compromise ranking strategy characteristic of VIKOR. This makes TOPSIS a more direct and computationally efficient choice for final decision-making within our study’s context. TOPSIS was strategically employed to rank the Pareto-optimal solutions derived from the NSGA-III. This method is highly effective in environments where decision-makers are tasked with selecting the optimal choice based on its closeness to an ideal solution. By complementing the NSGA-III, TOPSIS facilitates a coherent decision-making framework that aligns with our goal to not only identify optimal solutions but also to prioritize them according to practical operational metrics. This approach ensures that the most relevant and feasible solutions are recognized and highlighted for implementation.

2.3.2. Algorithm Process

The NSGA-III employed in this study involves several key steps as shown in Figure 2: initialization, non-dominated sorting, crowding distance maintenance, reference point setting, allocation schemes, selection of the next generation, and iteration. In its execution, the NSGA-III begins by initializing the population, followed by non-dominated sorting and crowding distance maintenance to generate the initial population’s Pareto front. Subsequently, reference points are set, and distances from each individual to these points are calculated to determine allocation schemes based on proximity. Within each scheme, the next generation is selected based on crowding distance and non-dominated sorting. The process repeats until termination criteria are met.
  • Step 1: Initialization
Define objective functions and constraints for decision variables and set key algorithm parameters like population size, crossover probability, mutation rate, and maximum iterations. The initial parent population is generated randomly, with each individual in the population representing a potential solution characterized by decision variables m , y j   and   x i , i k . This parent population serves as the foundational set of solutions from which offspring are generated. Each potential solution in this initial population is evaluated based on multiple objective functions, setting the stage for the evolutionary processes that follow. This initial random generation ensures a diverse pool of solutions, facilitating broad exploration of the solution space in subsequent phases of the algorithm [24].
  • Step 2: Evaluate Parent Population
Calculate the values of both objective functions for each individual in the parent population to assess their performance across different objectives.
  • Step 3: Non-dominated Sorting
  • Step 3.1: Initialize Parameters
The initialization of each individual i in the population involves setting two key parameters. The first parameter is the “dominance count” denoted as n i , which reflects the number of other individuals that dominate this particular individual based on the performance across the objective functions. The second parameter is the “dominance set” denoted as S i , which contains all the individuals that dominate the specified individual.
  • Step 3.2: Determine Dominance Relationships
For each pair of individuals i and j in the population, compare their performance on both objective functions to determine their dominance relationship. If j outperforms i on objective one without being worse on objective two, or j outperforms i on objective two without being worse on objective one, j is considered dominating i . Then, increase the dominance count n i of individual i by one, and add individual j to the dominance set S i .
  • Step 3.3: Construct Non-dominated Fronts
Identify all individuals with a dominance count of zero as they are not dominated by any other in the population. They form the first non-dominated front. Remove these individuals from the population and decrease the dominance count for those dominated by the removed individuals. Repeat this process until all individuals are assigned to a non-dominated layer.
  • Step 3.4: Complete Sorting
Assign a priority level to each individual based on their non-dominated layer; the first layer is allocated the highest priority, followed by the second and so on.
  • Step 4: Generate Reference Points
Reference points are used to guide the solution search process, ensuring a uniform distribution of solutions in the multi-objective solution space. These reference points are predefined through uniform distribution methods. Throughout each generation of the algorithm, every individual (both from the parent and the offspring generations) is associated with the nearest reference point by calculating the distance to all reference points. These reference points are strategically placed across the entire normalized hyperplane to assist in distributing the solutions widely [26]. This setup increases the likelihood that the solutions will be well-spread near or on the Pareto-optimal front. The Pareto front is a visual or mathematical representation of these optimal solutions in the objective space, highlighting the trade-offs that exist among the objectives. Preset reference points are essentially predefined coordinates in the objective space that guide the selection and maintenance of diversity among the solutions. In this study, there are two objective functions, which leads to the generation of reference points that are uniformly distributed across a line segment. The endpoints of this line segment represent the extreme values of each objective function. To construct this, first mark the endpoints corresponding to the maximum of each objective function, forming a line segment. Next, this line segment is divided into equal intervals to generate multiple reference points along it. For instance, if the line is divided into four equal segments, it results in five reference points, including the endpoints. Each of these points represents a combination of the two objectives, illustrating different trade-offs between them.
  • Step 5: Parent Population Selection
Individuals are selected based on their non-dominated ranking and their proximity to reference points, with priority allocated to those who are ranked higher in non-dominance and are closer to the reference points.
  • Step 6: Generation and Evaluation of Offspring Population
The offspring population refers to the new set of candidate solutions generated from the parent population through genetic operators [26]. In this step, offspring populations are generated from the filtered parent population through the crossover and mutation operations of traditional genetic algorithms. For each individual in the offspring population, the values of all objective functions are calculated to reflect each individual’s performance across different objectives.
  • Step 7: Merging of Offspring and Parent Populations
The current parent population and the newly generated offspring population are merged to form a larger population for the next round of selection.
  • Step 8: Elite Population Selection
The merged population undergoes non-dominated sorting and is layered according to dominance relationships. Individuals are selected based on their non-dominated ranking and their proximity to reference points, with priority allocated to those who are ranked higher in non-dominance and are closer to the reference points.
  • Step 9: Termination Condition Check
The algorithm checks if the maximum number of iterations has been reached. If not, the currently generated population is used as the parent population, and the process returns to Step 2 to continue; otherwise, it proceeds to the final step.
  • Step 10: Output of Final Solution Set
At the end of the algorithm, the non-dominated Pareto front contained in the last generation population is output, representing the optimal solution set evaluated based on multiple objective functions.
Based on the NSGA-III process, a set of Pareto-optimal solutions is obtained that simultaneously considers the shortest average scheduling time and lowest cost. Given the presence of multiple Pareto-optimal solutions in multi-objective optimization problems, it is often challenging to achieve optimal results in all sub-objectives simultaneously. Therefore, to determine an appropriate plan, a common approach is to consider the decision-maker’s preferences for various objectives, facilitating the selection of the most suitable solution. This study employs the TOPSIS method to further decide among the Pareto-optimal solutions derived from the NSGA-III. TOPSIS is a widely used multi-criteria decision-making method designed to identify solutions closest to the ideal positive solution (optimal values) and furthest from the negative ideal solution (least ideal values). It involves determining the weight of each objective to reflect its importance in decision-making. Each solution in the Pareto-optimal set is then compared with the ideal positive and negative solutions, calculating distances to obtain a comprehensive score for each solution, assessing its performance under various objectives. In this study, shorter maintenance resource scheduling times and reduced scheduling costs are set as the decision-making objectives. Using the TOPSIS method, which considers the decision-maker’s preferences and the weights of different objectives, multiple Pareto-optimal solutions obtained from an intelligent optimization algorithm are evaluated and ranked. Ultimately, a maintenance resource supply site selection and scheduling plan that best meets current management needs is chosen, thereby enhancing the efficiency and accuracy of management decisions.

3. Practical Applications

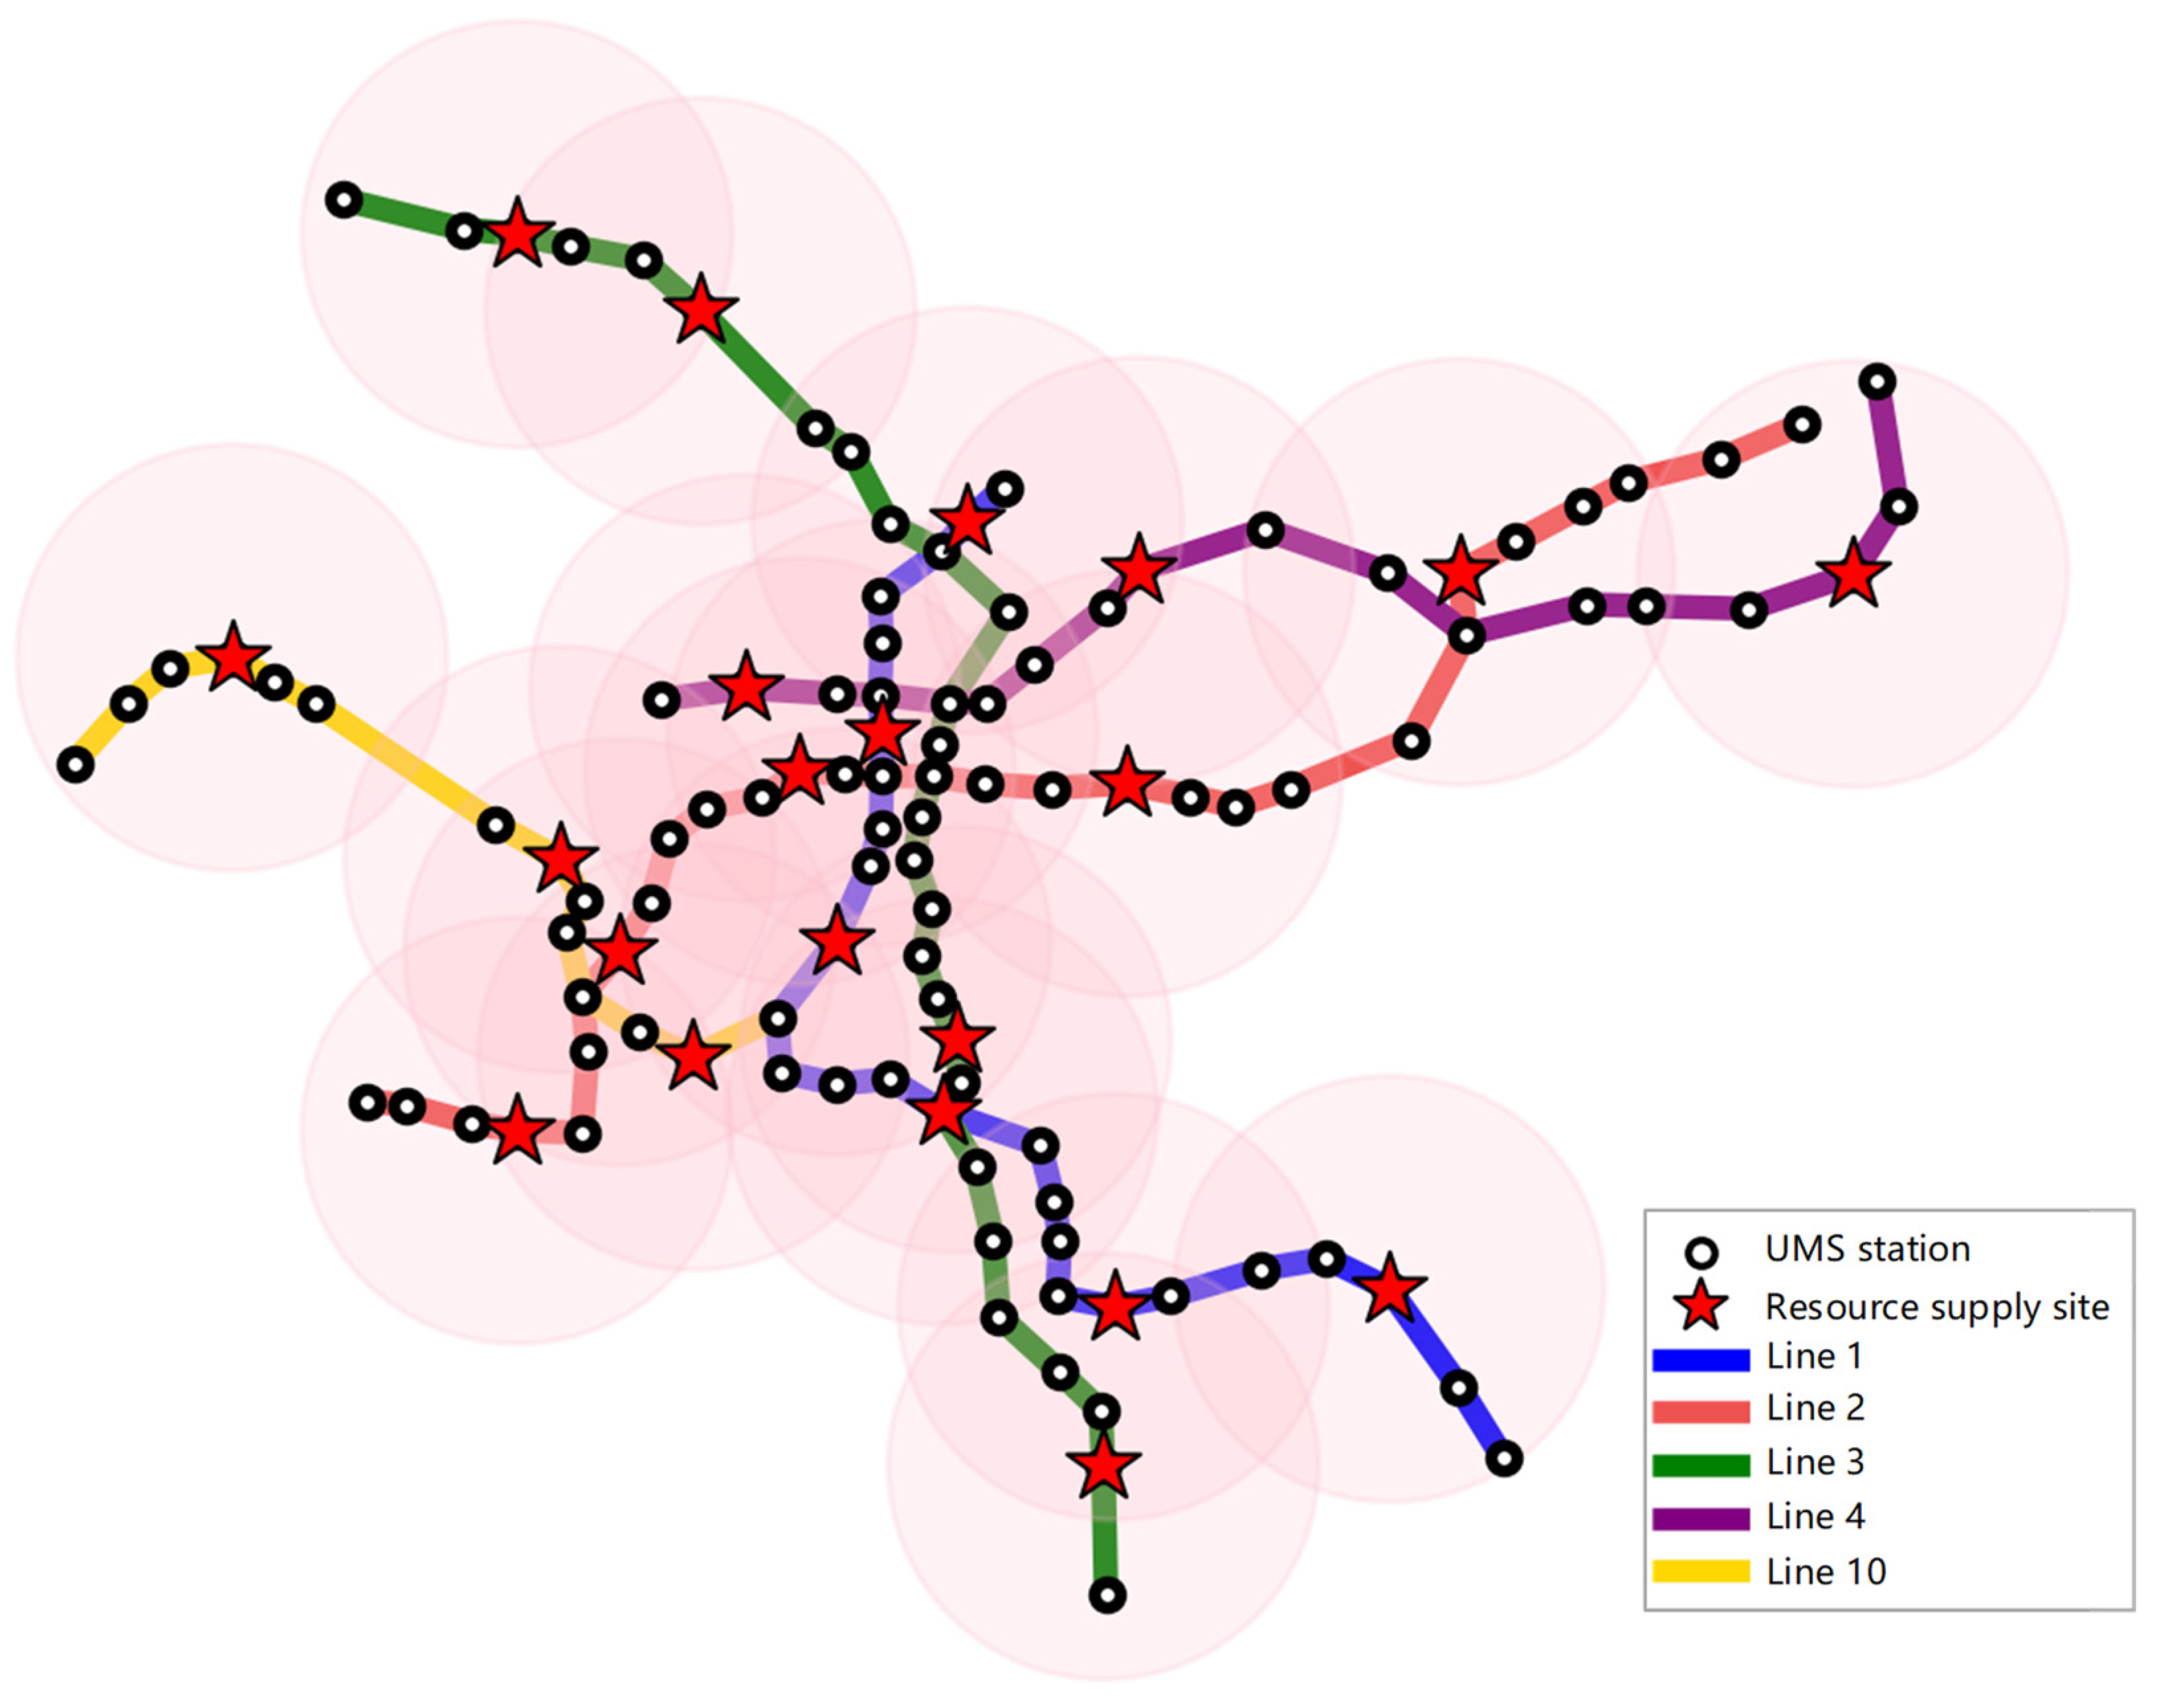
3.1. Case Background

To validate the effectiveness of the resilience enhancement model based on post-failure maintenance resource scheduling and emergency supply site optimization, the UMS in the main urban area of Nanjing (excluding the suburban lines starting with ‘S’) is used as a case study. The choice of this case is primarily based on computational considerations. As the number of stations increases, the volume of data that needs to be processed and stored grows significantly. Moreover, compared to suburban metro lines, the urban UMS lines in the city center exhibit distinct differences in operational modes, passenger flow characteristics, and service demands. The urban metro lines more centrally reflect the operational characteristics of city metro systems, including densely arranged station layouts, large daily passenger volumes, and complex network connections. Therefore, the metro lines within the city are more suitable as ideal cases to evaluate the effectiveness of the proposed resilience enhancement model. The data used include public data from the Nanjing Transportation Bureau, publicly available data from Nanjing Metro, internal training materials from Nanjing Metro Limited Liability Company, and field research on Nanjing Metro Company. Currently, the metro lines operating in the main urban area of Nanjing include Lines 1, 2, 3, 4, and 10, covering a total of 109 stations as shown in Figure 3.

3.2. Model Parameters

According to the mathematical model for post-failure maintenance resource scheduling and emergency supply site optimization designed in this study, it is necessary to establish the model parameter. We collected the names, latitudes, and longitudes of all stations in the Nanjing UMS, as well as the adjacency matrix between stations. The Space-L network modeling method reflects the true physical system and natural structural state of the UMS [29,30], providing a reliable basis for subsequent resource scheduling and emergency supply site selection. This study utilizes the Space-L modeling approach, treating each station in the Nanjing Metro system as a node, with direct segments between adjacent stations mapped as edges between nodes. The distance between any two nodes can be calculated using their local spatial coordinates defined within the Nanjing area. After eliminating duplicate stations due to shared lines, the total number of stations requiring maintenance resource supply due to potential equipment failures is 109. According to reference [31], the ratio of emergency maintenance resource supply sites to demand points should be between 1:6 and 1:4, suggesting that the number of emergency supply sites should range from 18 to 27.
Nodes in critical positions within the network and those with high passenger flows are more prone to equipment failures, necessitating more maintenance resources. Network indicators of nodes reflect their position within the network, the number of connected edges, and their importance in terms of network connectivity and traffic flow. The more critical a node’s position in the network, the greater its impact on the entire network, thus necessitating more attention and maintenance. Additionally, the number of edges connected to a node also indicates its importance within the network; nodes with more connections typically bear higher network loads and more complex transport tasks, requiring more maintenance resources to ensure their proper functioning. Passenger flow is another crucial indicator for assessing the importance of nodes. Nodes with high passenger traffic usually represent densely populated areas, which are essential for the smooth operation of the urban transportation system. Consequently, these nodes have a higher frequency of equipment and facility failures, necessitating a significant allocation of maintenance resources to maintain operational stability. Therefore, when calculating the importance of demand nodes, it is essential to consider both the network indicators and the passenger flow comprehensively.
(1)
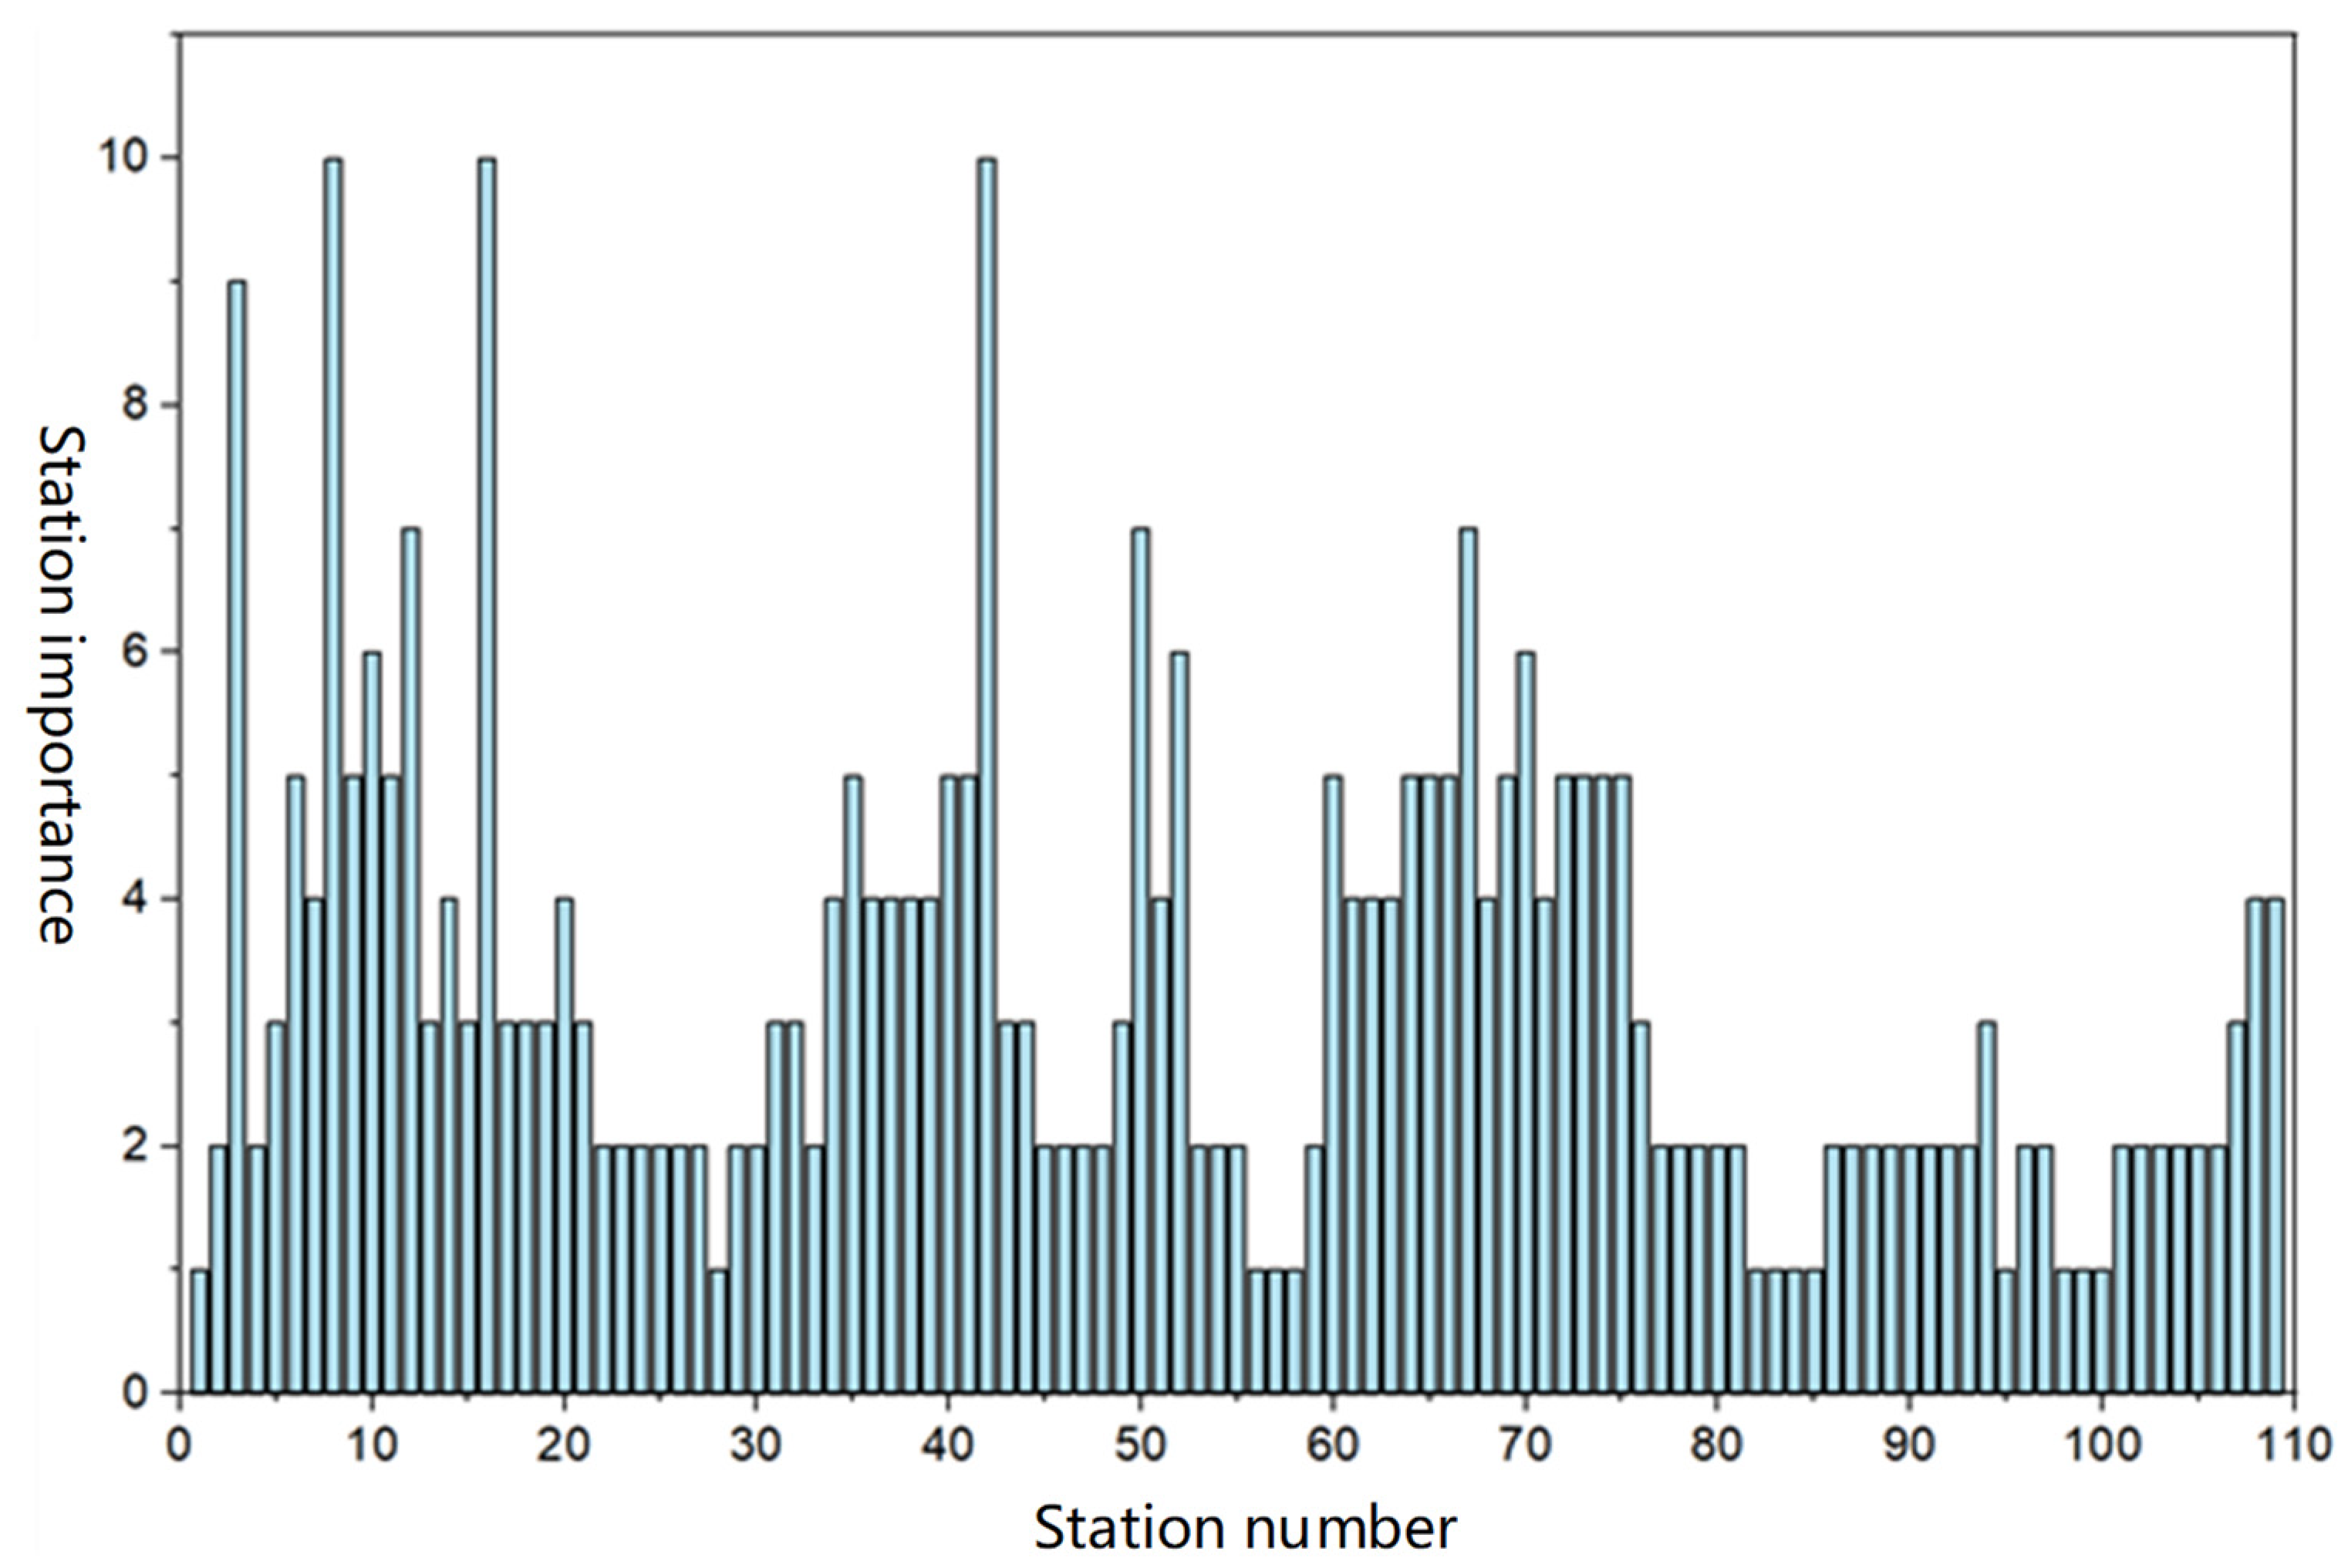
A Station Topological Importance Calculation
This study adopts betweenness centrality as the core metric to assess the topological importance of UMS stations. Betweenness centrality is a measure of a network’s centrality based on the shortest paths between pairs of nodes. For any pair of nodes, at least one shortest path exists such that the number of edges in the path is minimized. The betweenness centrality of a node is determined by the number of these shortest paths that pass through it. This metric helps identify nodes that act as bridges or critical points within the network. Calculating node importance using betweenness centrality identifies critical bridge nodes, accounts for the entire network structure, measures a node’s influence in connecting groups, and is applicable to various types of networks. Betweenness centrality illustrates the intermediary role of a station within the entire transport network, highlighting its hub function in connecting different UMS lines and stations [32]. In the UMS network layout, stations with high betweenness centrality are typically located at critical traffic flow nodes, significantly influencing the network’s stability and efficiency. Therefore, this research uses betweenness centrality as a measurement indicator to quantify the topological importance of UMS stations, aiming to deepen the understanding of the influence of key nodes on UMS network operations.
(2)
A Station Functional Importance Calculation
Passenger flow is selected as the core indicator for evaluating the functional importance of a UMS station. Passenger flow not only intuitively reflects the frequency of station usage, revealing the scale of economic and social activities it supports, but is also closely related to the maintenance needs of the station. High passenger traffic often leads to increased frequency of equipment use, which can accelerate equipment wear and even damage. Consequently, including the passenger flow in the assessment of station maintenance resource needs is particularly important. This approach effectively assists operators in optimizing resource allocation, ensuring the quality of service and operational efficiency at high-traffic area stations, and promoting the stable and reliable operation of the UMS system. According to the monthly report on major transport statistics released by the Nanjing Municipal Transportation Bureau, the total monthly passenger flow of all UMS lines in Nanjing in November 2023 was 87.87 million, with the five main urban lines accounting for 74.68 million or 84.989% of the total, as shown in Table 1.
According to the data from Table 1, there are significant differences in passenger traffic among different subway lines. Lines 1, 2, and 3, which cover the main commercial and residential areas of Nanjing, have higher passenger volumes, amounting to 24.17 million and 21.66 million, respectively. In contrast, Lines 4 and 10, which connect the urban and suburban areas of Nanjing, experience relatively lower passenger traffic, with 4.88 million and 4.23 million, respectively. Due to the unavailability of publicly available detailed passenger flow data for each station, the total passenger traffic for each line can be allocated to individual stations based on indicators such as the development level of the business district where the station is located, the overall development level of the region, and the intensity of pedestrian traffic. The results of this allocation are shown in Figure 4.
When calculating the comprehensive importance of nodes, since the betweenness centrality values of nodes range within a certain scale [ 0 , 1 ] , the passenger flow of each station is also normalized to ensure that both metrics are compared on the same scale. The importance of a node is calculated as the sum of its betweenness centrality and the normalized passenger flow of the station. To facilitate calculation, the resulting node importance values are mapped to a scale of 0 to 10 to obtain more readable and interpretable results. The final node importance values are presented as shown in Figure 5.
Due to the unavailability of direct data on the supply, demand, storage, and penalty costs of maintenance resources, this study makes reasonable assumptions based on the existing literature. The demand for maintenance resources at UMS stations is directly proportional to their importance. The higher the importance of a station, the greater its resource demand, and the higher the penalty cost when the resource demand is not met. Additionally, the speed of resource deployment is set based on the average speed on busy urban roads, which is 40 km per hour. Through these assumptions, this study aims to build a subway station maintenance resource scheduling model that is closer to real-world conditions, with parameters as shown in Table 2.

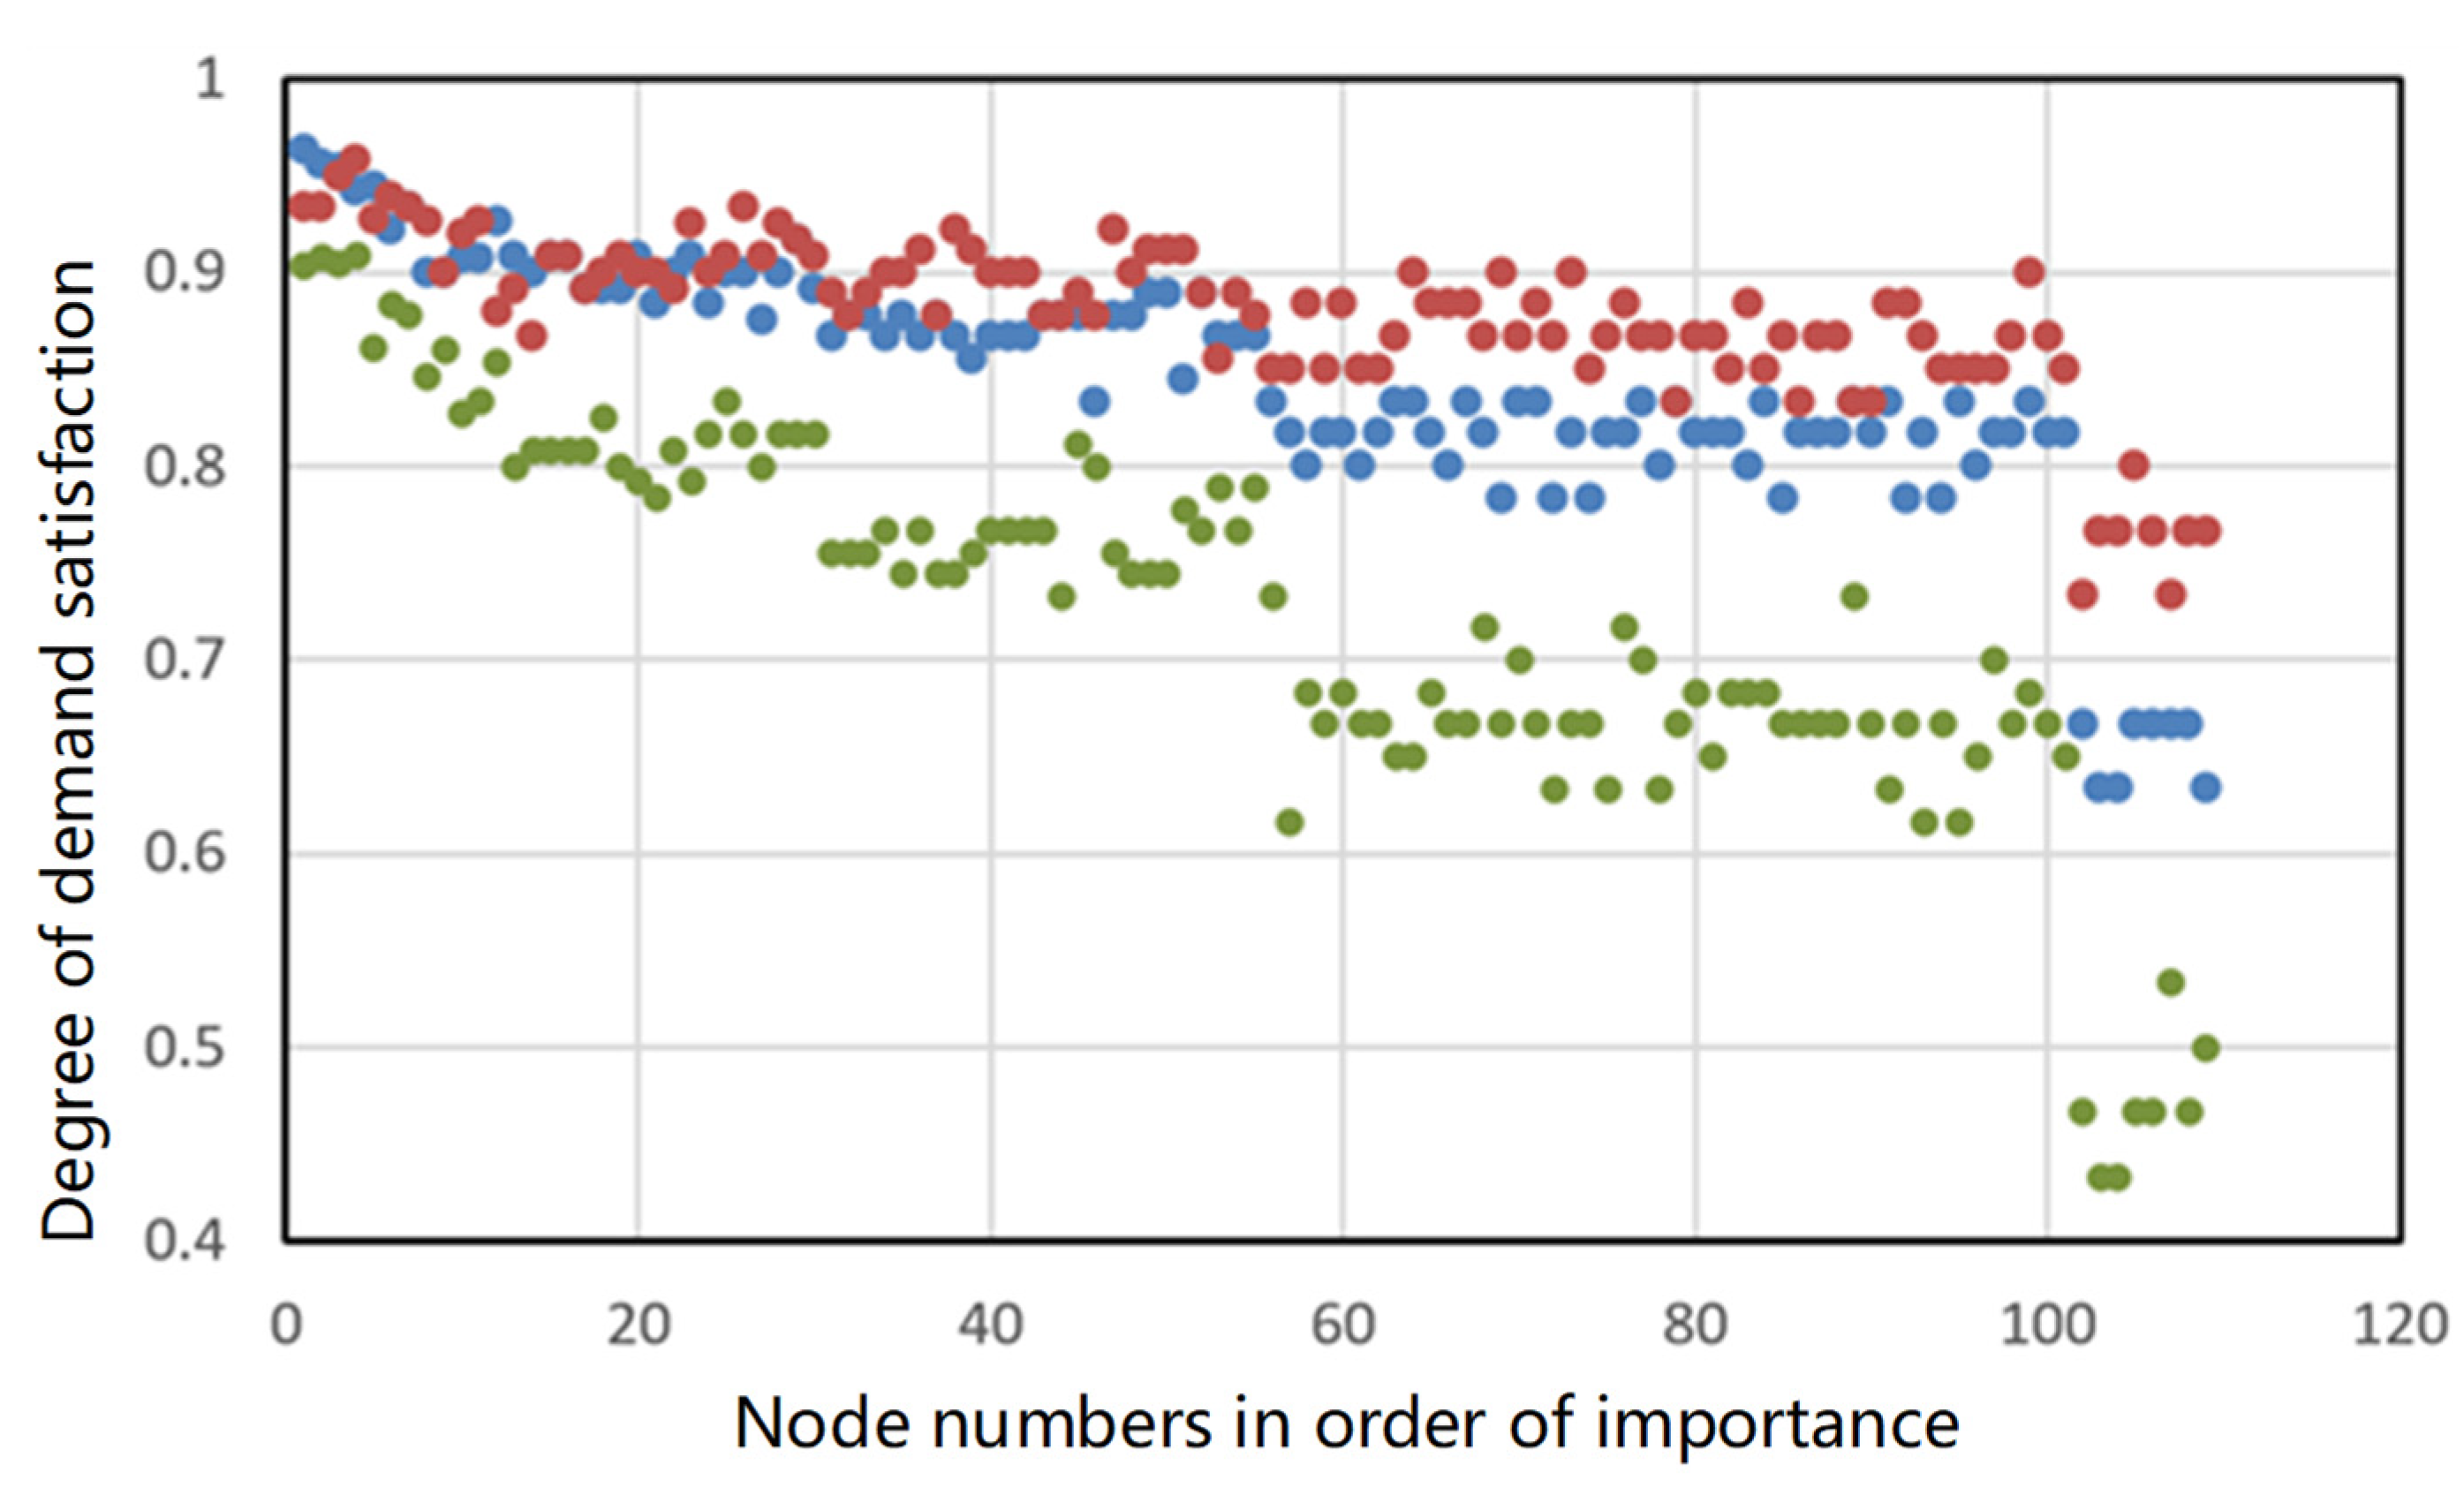
4. Results and Discussion

This study employs the NSGA-III and TOPSIS joint resolution method designed in Section 2.3 to solve the multi-objective optimization model for emergency supply site selection and emergency maintenance resource scheduling strategies. The obtained Pareto-optimal solution set is illustrated in Figure 6.
As depicted in Figure 6, accelerating the scheduling speed to respond to fault disturbances is often accompanied by higher costs. Conversely, as the scheduling time extends, the associated costs tend to decrease gradually. Hence, decision-makers need to balance time and economic costs when formulating resource scheduling strategies. In emergency maintenance resource allocation, rapid response is typically considered crucial. Therefore, when making decisions from the Pareto-optimal solution set generated with the NSGA-III algorithm using the TOPSIS method, this study assigns a weight of 80% to resource scheduling time and 20% to the cost of resource scheduling. This weighting emphasizes the importance of rapid response in emergencies over cost savings. In scenarios involving large-scale faults, where all stations require maintenance resource support, determining the optimal number of maintenance resource supply sites becomes particularly critical. Through the comprehensive evaluation and optimization modeling of station locations and resource scheduling efficiency conducted in this study, the ideal number of maintenance resource supply sites is determined to be 21. The corresponding site selections and names are illustrated in Figure 7 and listed in Table 3.
Table 3 displays the optimal locations for post-failure repair resource supply sites. The selection of maintenance resource supply stations as shown in the table reflects a strategic balance between sites with high and low comprehensive importance. High-importance stations like Nanjing Station and Xinjiekou, which have values of 9 and 10, respectively, are chosen due to their significant resource demands and strategic locations that help reduce delivery times and costs. Simultaneously, the inclusion of lower-importance sites such as Shuanglong Avenue and Zhushan Road, despite their lower scores of 3 and 2, ensures that maintenance resources are equitably distributed across the network. This strategy not only prioritizes efficiency and rapid response in critical areas but also ensures comprehensive coverage, maintaining network integrity and service quality even in less-frequented locations. Thus, the overall selection approach effectively balances operational efficiency with broad network coverage, enhancing the resilience and responsiveness of the service system. By comparing the maintenance resource supply station locations generated by our model with the 16 actual sites currently used by the Nanjing Metro, we found that 13 of our recommended sites coincide with the existing ones. This substantial overlap not only reinforces the credibility of our research results but also confirms that the current site selection strategy of the Nanjing Metro is scientifically sound and rational. However, it also highlights a deficiency in the number of sites, suggesting room for expansion to meet additional needs. Figure 7 displays the maintenance resource supply sites of the UMS and their service ranges. Maintenance resource supply sites are marked with red pentagrams, and the pink circles around them depict the 5 km service radius of each site. The map clearly demonstrates that the site selection strategy successfully covers all demand stations, ensuring comprehensive service accessibility. In the city center where Lines 1 and 2 intersect, due to the high passenger flow at stations, the maintenance resource supply sites are relatively concentrated, which aids in rapid response to emergency maintenance needs and minimizes operational disruptions. On the less crowded Lines 3, 4, and 10, although the supply sites are sparser, they are evenly distributed, showing a balance between cost control and service coverage, achieving reasonable coverage across all lines. A well-planned maintenance resource supply site selection strategy enhances the UMS’s resilience to disruptions. Should a failure occur in any area, the nearby supply sites can immediately mobilize maintenance resources. This not only ensures rapid repair of faulty equipment but also significantly reduces the potential cascading effects of failures, minimizing the impact of service interruptions to the lowest possible level.
The study results, as shown in Table 4, consider the optimal emergency maintenance resource scheduling strategy under scenarios of large-scale failures, where all stations require support from maintenance resources. Due to the extensive amount of data, only a partial result is displayed in Table 4. Under the optimal maintenance resource scheduling strategy, the average scheduling time is 16.54 min, which meets the 20 min requirement stipulated by the “Urban Rail Transit Operational Safety Assessment Specification”; the resource scheduling cost is CNY 3,875,697, and the degree of demand satisfaction at each demand station is as shown in Figure 8.
In the resilience enhancement model concerning post-failure repair resource depot location and resource dispatch optimization, the degree of resource demand satisfaction at demand sites—namely the ratio of the actual amount of resources received to the required resources—is a critical indicator of resilience enhancement effects. It reflects the system’s response and recovery capabilities to failures. A high satisfaction level means that resources can reach the demand points swiftly and effectively, thus rapidly restoring malfunctioning equipment, reducing downtime, and minimizing systemic performance losses. Accordingly, this study calculated the degree of demand satisfaction at various demand sites under the optimal resource scheduling and allocation strategies derived from the model. As indicated by Figure 9, demand satisfaction rates at stations of high importance are very high, exceeding 90%. The algorithm prioritizes the needs of important stations, allowing the UMS to recover as efficiently as possible in the shortest time. Moreover, even in extreme scenarios where all stations experience failures, the maintenance resource scheduling strategy proposed in this study still ensures an overall demand satisfaction rate of 87.09%, with the majority of demand stations having satisfaction rates above 85%. This outcome robustly demonstrates the efficiency of the proposed strategy in handling system failures. In the event of large-scale sudden failures at multiple stations, the system can quickly dispatch maintenance resources to ensure that the repair needs of the affected stations are promptly met and satisfied. To study the impact of different maintenance resource supply levels on average resource scheduling time and total scheduling costs, this research compares the differences arising from increasing the supply by 20% and decreasing it by 20%, considering the initial scenario.
The scatter plot as shown in Figure 8 indicates the demand satisfaction at maintenance resource demand sites under three supply conditions: initial, increased by 20%, and decreased by 20%. In the plot, blue dots represent the satisfaction under the initial supply, while red dots show the satisfaction when the supply is increased by 20%. It is evident that increasing the supply by 20% enhances the satisfaction level at almost all demand points; conversely, reducing the supply by 20% significantly lowers satisfaction, highlighting the negative impact on satisfaction, particularly at stations where initial satisfaction was already low. From Table 5, the consistency of the average scheduling time indicates that changes in supply do not affect the resource scheduling time. This phenomenon suggests that scheduling time is determined by factors such as the efficiency of the scheduling algorithm, the speed of resource allocation, and the optimization of scheduling routes, rather than the quantity of supply. The stability of scheduling times underlines the continuous efficiency of dispatching operations across different supply levels, which is crucial for responding to an emergency, ensuring that response times remain constant regardless of how resource levels change.
As the supply changes, resource scheduling costs exhibit significant fluctuations: with a 20% increase in supply, costs rise from the initial CNY 3,875,697.06 to CNY 4,224,497.06; conversely, a 20% decrease reduces costs to CNY 3,526,897. Changes in supply not only affect the cost of the resources themselves but also impact dispatching- and storage-related expenses. Therefore, facing a limited budget, decision-makers need to find a balance between the actual demand for resources and budget constraints to determine the appropriate supply level at maintenance resource supply sites. The fluctuations in demand satisfaction further prove the significant impact of supply changes on the ability to meet demands at repair points: with an increase in supply, satisfaction rises from 87.09% (blue dots in Figure 8) to 89.41% (red dots in Figure 8); with a decrease, satisfaction falls to 76.70% (green dots in Figure 8). This indicates that increasing the supply allows for the allocation of more resources to demand points, thereby improving satisfaction levels; however, reducing supply makes resources more scarce, leading to decreased satisfaction. Nevertheless, it is worth noting that higher demand satisfaction often comes with higher cost expenditures. Given that this study assumes an extreme scenario where all stations have resource needs, in practice, under non-extreme conditions, supply levels can be adjusted flexibly based on specific circumstances to achieve an optimal balance between cost and demand satisfaction.
Our research can be applied to urban metro systems globally by adopting a similar integrated resource scheduling framework that considers multi-objective optimization, such as cost and time, to enhance emergency response capabilities and system resilience. Policymakers should adapt the model parameters based on local conditions, including population density, passenger flow, and metro station distribution. The strategic distribution of maintenance resource supply sites is critical for improving emergency repair efficiency. Policymakers should consider network topology, station size, and passenger flow when planning and constructing maintenance resource supply sites to ensure rapid and effective resource deployment during large-scale failures. When formulating maintenance resource scheduling strategies, it is essential to balance cost and time. Our model demonstrates that accelerating resource scheduling speed improves fault recovery significantly, despite higher costs. Urban planners should select the optimal resource scheduling strategy based on economic conditions and actual needs to ensure a quick and efficient emergency response while controlling costs. Optimizing resource supply site selection and scheduling strategies significantly enhances the resilience and recovery capabilities of urban metro systems. This provides vital insights for policymakers and urban planners in developing long-term development plans and emergency response strategies, ensuring stable operations and rapid recovery during disruptions.

5. Conclusions

A rational post-failure maintenance resource scheduling strategy is crucial for quickly and effectively repairing damaged UMS equipment and restoring its normal functions and performance. This strategy demonstrates the recoverability of the UMS and its physical resilience, meaning the system can be swiftly and effectively repaired and returned to normal operation after damage or failure. Through post-failure maintenance activities, the UMS can rapidly address failures, reducing downtime and operational interruptions, thus ensuring continuous system operation and work efficiency. Therefore, a sensible post-failure maintenance resource scheduling strategy is an essential component of enhancing the overall resilience of the UMS, helping the system to recover quickly from adverse conditions, minimize losses, and ensure the stability and sustainability of production and operations. However, in practice, the repair and resilience enhancement of the UMS physical system are often constrained by resource limitations. This implies that, under limited resources, the most effective repairs must be achieved through a reasonable resource allocation strategy to maximize system resilience. This study aims to find the optimal resource allocation strategy for the emergency repair phase after failures, considering the cost and effectiveness of resilience enhancement under resource constraints, to better enable the system to handle disturbances and maximize resilience. By considering emergency repair time, transportation costs, resource supply and demand, and resource distribution in the network, a multi-objective optimization model for post-failure maintenance resource supply site location and resource scheduling has been developed. This model clarifies the optimal number of maintenance resource supply sites and their locations, as well as the best resource scheduling strategy in the event of large-scale failures, ensuring resources can be rapidly and effectively distributed to demand points, thereby swiftly restoring system functions and minimizing the impact of downtime and operational interruptions. We integrated the NSGA-III and TOPSIS methods to create the model, using the subway transit of Nanjing’s main urban area as an example, and validated the effectiveness of the proposed resilience enhancement model.
The research findings indicate that strategically placed supply sites and well-considered resource scheduling can significantly enhance the system’s resilience to disruptions. Optimized resource deployment ensures that maintenance personnel and materials can quickly reach needed locations, thereby minimizing downtime and maintaining operational continuity. This study also reveals that accelerating scheduling speed to address fault disruptions is often accompanied by higher costs. Conversely, as the scheduling time extends, the associated costs show a gradual decline. Therefore, decision-makers need to balance time costs and economic costs when formulating resource scheduling strategies. Additionally, this study underscores the importance of considering various supply and demand scenarios to further refine the resource allocation strategy. Observations from increasing the supply by 20% showed significant improvements in meeting the resource needs of the urban metro system, albeit at increased costs. Conversely, a reduction in supply markedly lowered satisfaction levels, highlighting the crucial balance between resource availability and budget constraints.
In summary, this research provides a robust framework for the ongoing efforts in urban infrastructure management for emergency maintenance planning which is both effective and economical. This model serves as a vital tool for decision-makers in enhancing the operational readiness of urban transportation systems against unforeseen failures, ensuring the provision of a resilient and reliable service to the public. Through this approach, not only is the efficiency of emergency responses enhanced, but it also provides scientific and technical support for the sustainable development and optimized operation of urban metro systems.
While our study provides a robust framework for optimizing maintenance resource scheduling and site selection in urban metro systems, several areas warrant further investigation. Future research could explore the integration of real-time data analytics and machine learning algorithms to continuously improve resource scheduling strategies based on evolving urban conditions and system demands. Additionally, investigating the impact of different types of failures and varying scales of disruptions on resource allocation and scheduling efficiency would provide deeper insights into system resilience. Scaling our findings to other urban systems presents a promising avenue for future research. Extending the optimization model to include other forms of urban transportation, such as bus networks or regional rail systems, could offer comprehensive strategies for enhancing the resilience of entire urban transportation ecosystems. Moreover, adapting the model to different urban contexts, considering unique geographic, demographic, and infrastructural characteristics, would validate its applicability and effectiveness across diverse settings. In conclusion, our study not only contributes to the optimization of maintenance resource scheduling and site selection for urban metro systems but also provides a foundation for future research aimed at enhancing urban transportation resilience. By exploring advanced data-driven approaches and expanding the model to other urban systems, we can develop more resilient, efficient, and sustainable urban transportation networks.

Author Contributions

Conceptualization, Q.L. and L.T.; methodology, L.T.; software, L.T.; validation, L.T. and S.C.; formal analysis, L.T.; investigation, L.T.; resources, Q.L.; data curation, S.C.; writing—original draft preparation, L.T.; writing—review and editing, S.C.; visualization, L.T.; supervision, Q.L.; project administration, Q.L.; funding acquisition, Q.L. All authors have read and agreed to the published version of the manuscript.

Funding

This research was funded by National Natural Science Foundation of China No. 5237083156 and No. 5197082168.

Data Availability Statement

Data will be made available on reasonable request to corresponding author.

Acknowledgments

The authors’ special thanks go to all participants and reviewers of this paper.

Conflicts of Interest

The authors declare no conflict of interest.

References

  1. Urban Rail Transit 2023 Annual Statistical and Analytical Report. China Urban Railway Transportation Association. 2024, Beijing, China.
  2. Ahmadi, S.; Saboohi, Y.; Vakili, A. Frameworks, Quantitative Indicators, Characters, and Modeling Approaches to Analysis of Energy System Resilience: A Review. Renew. Sustain. Energy Rev. 2021, 144, 110988. [Google Scholar] [CrossRef]
  3. Ding, L.; Xu, J. A review of metro construction in China: Organization, market, cost, safety and schedule. Front. Eng. Manag. 2017, 4, 4–19. [Google Scholar] [CrossRef]
  4. Zhao, H.; Liu, J.; Chen, H.; Chen, J.; Li, Y.; Xu, J.; Deng, W. Intelligent Diagnosis Using Continuous Wavelet Transform and Gauss Convolutional Deep Belief Network. IEEE Trans. Reliab. 2023, 72, 692–702. [Google Scholar] [CrossRef]
  5. Lin, S.; Li, N.; Feng, D.; Guo, X.; Pan, W.; Wang, J.; Yang, C. A Preventive Opportunistic Maintenance Method for Railway Traction Power Supply System Based on Equipment Reliability. Railw. Eng. Sci. 2020, 28, 199–211. [Google Scholar] [CrossRef]
  6. Consilvio, A.; Di Febbraro, A.; Sacco, N. A Rolling-Horizon Approach for Predictive Maintenance Planning to Reduce the Risk of Rail Service Disruptions. IEEE Trans. Reliab. 2021, 70, 875–886. [Google Scholar] [CrossRef]
  7. Lin, S.; Shang, C.; Li, N.; Sun, X.; Feng, D.; He, Z. An Optimization Method for Maintenance Resource Allocation in Electrified Railway Catenary Systems. IEEE Trans. Ind. Appl. 2023, 59, 641–651. [Google Scholar] [CrossRef]
  8. Jiang, Y.; Sun, B.; Zheng, L.; Cui, W.; Mao, X. Modified Maintenance Network Model for Urban Rail Transit Systems Based on the Variable Coverage Radius: Evidence from Changchun City in China. J. Adv. Transp. 2020, 2020, 1–11. [Google Scholar] [CrossRef]
  9. Feng, Z.; Li, G.; Wang, W.; Zhang, L.; Xiang, W.; He, X.; Zhang, M.; Wei, N. Emergency Logistics Centers Site Selection by Multi-Criteria Decision-Making and GIS. Int. J. Disaster Risk Reduct. 2023, 96, 103921. [Google Scholar] [CrossRef]
  10. Li, D.; Chen, Q.; Wang, M.; He, S.; Yang, D. Research on Location Selection of Distribution Network Repair Center Considering Loss of Load Level. In Proceedings of the 2019 IEEE 3rd International Electrical and Energy Conference (CIEEC), Beijing, China, 7–9 September 2019; IEEE: Beijing, China, 2019; pp. 1117–1121. [Google Scholar]
  11. Lu, Y.; Xie, Z.; Wang, X. Study on urban rail transit emergency point planning based on complex network. J. Saf. Sci. Technol. 2020, 16, 10–16. [Google Scholar]
  12. Cao, L.; Hu, Y.; Guo, Z.; Li, W. Emergency Resource Location and Distribution of Urban Rail Transit. Transp. Res. 2016, 2, 54–61. [Google Scholar] [CrossRef]
  13. Wang, X. Research on site selection model for maintenance and repair organizations of high-speed railway infrastructure. Mod. Manuf. Technol. Equip. 2019, 06, 115–118. [Google Scholar] [CrossRef]
  14. Li, H.; Mi, S.; Li, Q.; Wen, X.; Qiao, D.; Luo, G. A Scheduling Optimization Method for Maintenance, Repair and Operations Service Resources of Complex Products. J. Intell. Manuf. 2020, 31, 1673–1691. [Google Scholar] [CrossRef]
  15. Kim, E.W.; Kim, S. Optimum Location Analysis for an Infrastructure Maintenance Depot in Urban Railway Networks. KSCE J. Civ. Eng. 2021, 25, 1919–1930. [Google Scholar] [CrossRef]
  16. Specification for Safety Assessment during Urban Rail Transit Operations. The Ministry of Transportation and Communications of China. 2023. Available online: https://www.gov.cn/zhengce/zhengceku/202310/content_6909156.htm (accessed on 1 May 2024).
  17. Shi, X.; Zhao, Y. Research on Dispatch Model and Algorithm of Emergency Repair Supplies for Transmission Lines. J. Chang. Inst. Technol. 2022, 23, 104–107+112. [Google Scholar]
  18. Barzinpour, F.; Esmaeili, V. A Multi-Objective Relief Chain Location Distribution Model for Urban Disaster Management. Int. J. Adv. Manuf. Technol. 2014, 70, 1291–1302. [Google Scholar] [CrossRef]
  19. Shaw, L.; Das, S.K.; Roy, S.K. Location-Allocation Problem for Resource Distribution under Uncertainty in Disaster Relief Operations. Socio-Econ. Plan. Sci. 2022, 82, 101232. [Google Scholar] [CrossRef]
  20. Ebrie, A.S.; Kim, Y.J. Reinforcement Learning-Based Multi-Objective Optimization for Generation Scheduling in Power Systems. Systems 2024, 12, 106. [Google Scholar] [CrossRef]
  21. Zhou, C.; Ye, S.; Wang, H.; Cao, J.; Gao, Z. Maintenance Service Configuration Optimization for Complex Equipment. Systems 2023, 11, 32. [Google Scholar] [CrossRef]
  22. Sun, T.; Wang, W.; Wen, X. Optimal Operation Strategy of Wind-Hydrogen Integrated Energy System Based on NSGA-II Algorithm. J. Comput. Methods Sci. Eng. 2023, 23, 499–511. [Google Scholar] [CrossRef]
  23. Xue, F.; Wu, D. NSGA-III Algorithm with Maximum Ranking Strategy for Many-Objective Optimisation. Int. J. Bio-Inspired Comput. 2020, 15, 14–23. [Google Scholar] [CrossRef]
  24. Srinivas, N.; Deb, K. Muiltiobjective Optimization Using Nondominated Sorting in Genetic Algorithms. Evol. Comput. 1994, 2, 221–248. [Google Scholar] [CrossRef]
  25. Deb, K.; Pratap, A.; Agarwal, S.; Meyarivan, T. A Fast and Elitist Multiobjective Genetic Algorithm: NSGA-II. IEEE Trans. Evol. Comput. 2002, 6, 182–197. [Google Scholar] [CrossRef]
  26. Deb, K.; Jain, H. An Evolutionary Many-Objective Optimization Algorithm Using Reference-Point-Based Nondominated Sorting Approach, Part I: Solving Problems With Box Constraints. IEEE Trans. Evol. Comput. 2014, 18, 577–601. [Google Scholar] [CrossRef]
  27. Liu, Q.; Liu, X.; Wu, J.; Li, Y. An Improved NSGA-III Algorithm Using Genetic K-Means Clustering Algorithm. IEEE Access 2019, 7, 185239–185249. [Google Scholar] [CrossRef]
  28. Awad, M.; Abouhawwash, M.; Agiza, H. On NSGA-II and NSGA-III in Portfolio Management. Intell. Autom. Soft Comput. 2021, 32, 1893–1904. [Google Scholar] [CrossRef]
  29. Meng, Y.; Tian, X.; Li, Z.; Zhou, W.; Zhou, Z.; Zhong, M. Comparison Analysis on Complex Topological Network Models of Urban Rail Transit: A Case Study of Shenzhen Metro in China. Phys. A Stat. Mech. Its Appl. 2020, 559, 125031. [Google Scholar] [CrossRef]
  30. Li, M.; Yu, W.; Zhang, J. Clustering Analysis of Multilayer Complex Network of Nanjing Metro Based on Traffic Line and Passenger Flow Big Data. Sustainability 2023, 15, 9409. [Google Scholar] [CrossRef]
  31. Xu, L. Research on Optimization Method of Regional Railway Transportation Emergency Maintenance Resource Allocation. Doctor’s Thesis, Shandong University of Science and Technology, Qingdao, China, 2021. [Google Scholar] [CrossRef]
  32. Jing, W.; Xu, X.; Pu, Y. Route Redundancy-Based Approach to Identify the Critical Stations in Metro Networks: A Mean-Excess Probability Measure. Reliab. Eng. Syst. Saf. 2020, 204, 107204. [Google Scholar] [CrossRef]
Figure 1. Optimization model framework for post-failure maintenance resource siting and scheduling.
Systems 12 00262 g001
Figure 2. NSGA-III solution process.
Systems 12 00262 g002
Figure 3. Nanjing UMS line map (White dots are subway stations).
Systems 12 00262 g003
Figure 4. Monthly passenger traffic statistics.
Systems 12 00262 g004
Figure 5. UMS station node importance.
Systems 12 00262 g005
Figure 6. Pareto-optimal solution set for post-failure maintenance resource supply site location and scheduling strategy.
Systems 12 00262 g006
Figure 7. Optimal location of resource supply sites for post-failure maintenance.
Systems 12 00262 g007
Figure 8. Degree of demand satisfaction at maintenance resource demand sites under different supply conditions.
Systems 12 00262 g008
Figure 9. Degree of demand satisfaction at maintenance resource demand sites.
Systems 12 00262 g009
Table 1. Monthly passenger traffic statistics of Nanjing metro lines (Unit: 10,000 people).
Line number123410
Passenger flow241721661974488423
Table 2. Model parameter list.
Maintenance   Personnel   K 1 Maintenance   Equipment   K 2 Maintenance   Material   K 3
Supply site supply amount V K j k 200200400
Demand site demand amount A K i k 10 × ω i 10 × ω i 10 × ω i
Resource scheduling speed v k (km/h)404040
Cost per unit c k (CNY)100300100
Transportation cost per unit per kilometer c t k (CNY)105010
Storage cost per unit c s k (CNY)105010
Penalty charge per unit of unmet demand p k (CNY)500700600
Table 3. List of supply sites for post-failure repair resources.
NumberStationComprehensive ImportanceNumberStationComprehensive Importance
3Nanjing Station960Taifeng Road4
8Xinjiekou1063Shangyuanmen3
12Andemen675Mingfa Plaza4
17Shuanglong Avenue382Mozhou East Road2
22Zhushan Road286Dongliu2
26Nanjing Communications Institute292Jiangwang Temple2
34Jinma Road397Longjiang2
40Ming Imperial Palace4102Pukou Wanhui City2
45Mochou Lake2106Mengdu Avenue3
50Yuntong6109Xiaohang3
54Qinglian Street2
Table 4. Resource scheduling strategy x i , j k .
A1A2A3A4A108A109
K1K2K3K1K2K3K1K2K3K1K2K3K1K2K3K1K2K3
V1111111565112221121
V2101002428101002301
V3203201428223012014
V4215111123221414032
V5011111694101212312
V6000001570010010110
V7011100252000110200
V8221122237121112122
V9112111228012224022
V10112123236202133122
V11100000630000110211
V12011101153001011112
V13021121209111111024
V14020021256100323212
V15110111723011111211
V16000000202000010100
V17100110472101101011
V18000001854010011011
V19000001622001012211
V20101100351011100210
V21010101997111130101
Table 5. Resource scheduling time, cost, and demand satisfaction rate at demand sites under different maintenance supply conditions.
Initial Supply AmountIncreased Supply by 20%Decreased Supply by 20%
Average Scheduling Time16.54 min16.54 min16.54 min
Resource Scheduling Cost3,875,697.06 CNY4,224,497.06 CNY3,526,897 CNY
Demand Satisfaction Rate87.09%89.41%76.70%
Disclaimer/Publisher’s Note: The statements, opinions and data contained in all publications are solely those of the individual author(s) and contributor(s) and not of MDPI and/or the editor(s). MDPI and/or the editor(s) disclaim responsibility for any injury to people or property resulting from any ideas, methods, instructions or products referred to in the content.

