Article

Independent Effects of Dopant, Oxygen Vacancy, and Specific Surface Area on Crystal Phase of HfO2 Thin Films towards General Parameters to Engineer the Ferroelectricity

1
National Key Laboratory of Science and Technology on Micro/Nano Fabrication, Shanghai Jiao Tong University, Shanghai 200240, China
2
Department of Micro/Nano Electronics, Shanghai Jiao Tong University, Shanghai 200240, China
3
Department of Physics, Fudan University, Shanghai 200433, China
*
Author to whom correspondence should be addressed.
Electronics 2022, 11(15), 2369; https://doi.org/10.3390/electronics11152369
Submission received: 9 June 2022 / Revised: 13 July 2022 / Accepted: 21 July 2022 / Published: 28 July 2022
(This article belongs to the Special Issue Advanced CMOS Devices and Applications)

Abstract

:
Many factors have been confirmed to affect ferroelectric phase formation in HfO2-based thin films but there was still a lack of general view on describing them. This paper discusses the intrinsic parameters to stabilize the ferroelectric phase of HfO2 thin films to approach this general view by investigating the separate effects of dopant, oxygen vacancy (VO), and specific surface area on the crystal phase of the films. It is found that in addition to extensively studied dopants, the ferroelectric orthorhombic phase can also be formed in pure HfO2 films by only introducing sufficient VO independently, and it is also formable by only increasing the specific surface area. By analyzing the common physics behind these factors, it is found that orthorhombic phase formation is universally related to strain in all the above cases with a given temperature. To get a general view, a physical model is established to describe how the strain influences ferroelectric phase formation during the fabrication of HfO2-based films based on thermodynamic and kinetics analysis.

1. Introduction

HfO2-based high-k dielectrics have been applied as an alternative to thin SiO2 gate insulators in Si technology since 2007 [1]. Continuously, a ferroelectric property in Si-doped HfO2 thin films, which was not expected in the thermodynamic phase diagram of HfO2, was observed in 2011 [2]. As soon as it was discovered, it attracted great attention because the HfO2-based ferroelectrics with good CMOS compatibility and scalability are promising to overcome the critical obstacles in the application of conventional ferroelectric materials in memory and logic devices [3,4,5]. Clarification of fundamental material science essentially is critical to the device demonstration in the era beyond Moore’s Law. In the last decade, intensive studies on understanding the physical origin of ferroelectricity and controlling the fundamental properties of HfO2-based thin films have been carried out. It has been agreed that the metastable orthorhombic (O-phase) phase, which is formed during the transition from tetragonal (T-phase) to monoclinic (M-phase) phase, is the origin of ferroelectricity in HfO2 [1,6]. Additionally, many experimental factors, including doping concentration, oxygen vacancy (VO), film thickness, annealing conditions, and capping layers, have been confirmed to influence the stabilization of the O-phase [7,8,9,10,11,12,13,14,15,16,17]. However, a general model describing the intrinsic driving force to determine the stabilization of the O-phase from the T–M phase transition in HfO2 thin film has not been clarified clearly up to now.
It has been argued that defects and surface energy are two main categories of impact factors to help stabilize the O-phase [7,8]. The former refers to dopants and VO, while the latter is usually related to mechanical clamping of electrodes, substrate orientation, and film thickness [9,10,11,12,13,14,15,16,17]. However, in these studies, the above categories and factors are usually synergistic to affect the ferro-O phase formation. For example, ferroelectricity in undoped HfO2 films was usually observed in a sandwich structure with TiN or TaN as bottom and top electrodes followed by post metalization annealing. However, the top layer would not only introduce Vo through the scavenging effect but also bring extra stress into the films [15,16,17,18,19,20]. Additionally, thinner films with larger surface energies enable more ferro-O phase formation, while this effect was mostly demonstrated in doped films [13,14,15,16,17,18,19,20,21]. Therefore, it is difficult to discuss the effect of every single factor and to get the intrinsic parameters behind these factors for engineering the ferroelectricity of the HfO2-based films. It is even difficult to confirm whether the ferroelectric phase is formable or not in an undoped film.
In this study, we intend to approach a general view of phase formation in the films. For achieving reliable conclusions, we investigate the independent effect of dopants, VO, and specific surface area of HfO2-based thin films by carefully designing the experiment process. Our results show that all the above factors enable the formation of ferroelectric O-phase individually. By analyzing our results and the reported ones of other factors, it is found that most of the factors are related to strain universally. On the basis of this, a thermodynamic model is further proposed to give a universal description of the driving forces on the stabilization of the metastable O-phase.

2. Experimental

The 30 nm undoped and Si-doped HfO2 (HSO) films were fabricated by plasma-enhanced atomic layer deposition (PE-ALD) at 200 °C on p-Si substrates (HfO2/p-Si) and heavily doped p-Ge substrates (HSO/p+-Ge), respectively. Tetrakis-ethylmethylamino-hafnium (TEMAHf) and oxygen plasma were used as precursors for HfO2. Bis-terarybutylamino-silane (BTBAS) was used for silicon doping. Post-deposition annealing (PDA) was carried out in 0.005 atm O2 for HSO films and in 0.005 atm O2, 0.005 atm N2, and ultra-high vacuum (UHV, base pressure of 10−7 Pa) for undoped HfO2 films, respectively. The heating conditions were all set at 10 °C/s which began from 100 °C and all films were annealed at 650 °C for 30 s. A Premtek rapid thermal processing furnace was used for O2 or N2 annealing and a chamber of thermal desorption spectroscopy (EMD-WA1000S/W (ESCO, Ltd.)) was used for UHV annealing. Then, Au was deposited by thermal evaporation as the top electrode (TE). For some samples, films were etched into cuboid arrays by Ar+ plasma whose side lengths were set to 2 μm, 5 μm, and 10 μm before PDA.
Figure 1 shows the experiment process designed to control doping, VO, and specific surface area separately. For controlling doping singly, quadrivalent Si dopants were selected because they do not induce VO in the film like trivalent cation, and O2-PDA was carried out for eliminating the VO generated in film deposition. Meanwhile, employment of Ge substrate and PDA process help to minimize the interface effect such as inducing extra VO or stress. While for controlling Vo independently, undoped HfO2 films were annealed in O2, N2, or UHV respectively. Similarly, the PDA process was employed, but the Si substrate was selected because less leakage is induced on Si than on Ge in UHV-PDA. While for the individual control of the specific surface area, undoped HfO2 films were etched into different sizes before annealing to explore its impact, while Ge substrate and PDA were also employed for the reasons stated above.
Film thickness was measured by spectroscopic ellipsometry (Filmetrics F50). Doping concentration, defined as dop% = Si/(Si + Hf), was confirmed by X-ray photoelectron spectroscopy (XPS, AXIS-ULTRADL DLD). Grazing incidence X-ray diffraction (GIXRD) was used to detect phase composition by a Riguaku D/max 2500 V (Cu-Kα radiation, λ = 0.154 nm). The incidence angle was fixed at 1° and the emergence angle varied from 27° to 33°. An atomic force microscope (AFM, Bruker ICON, Billerica, MA, USA) was utilized for detecting surface morphologies. Polarization-electric field (P-E) properties were measured by semiconductor parameter analyzer (Keithley 4200, Cleveland, OH, USA) and triangular voltage pulse was set at 10 KHz. Positive-up-negative-down (PUND) measurement was carried out to check the ferroelectricity of samples with UHV annealing.

3. Results

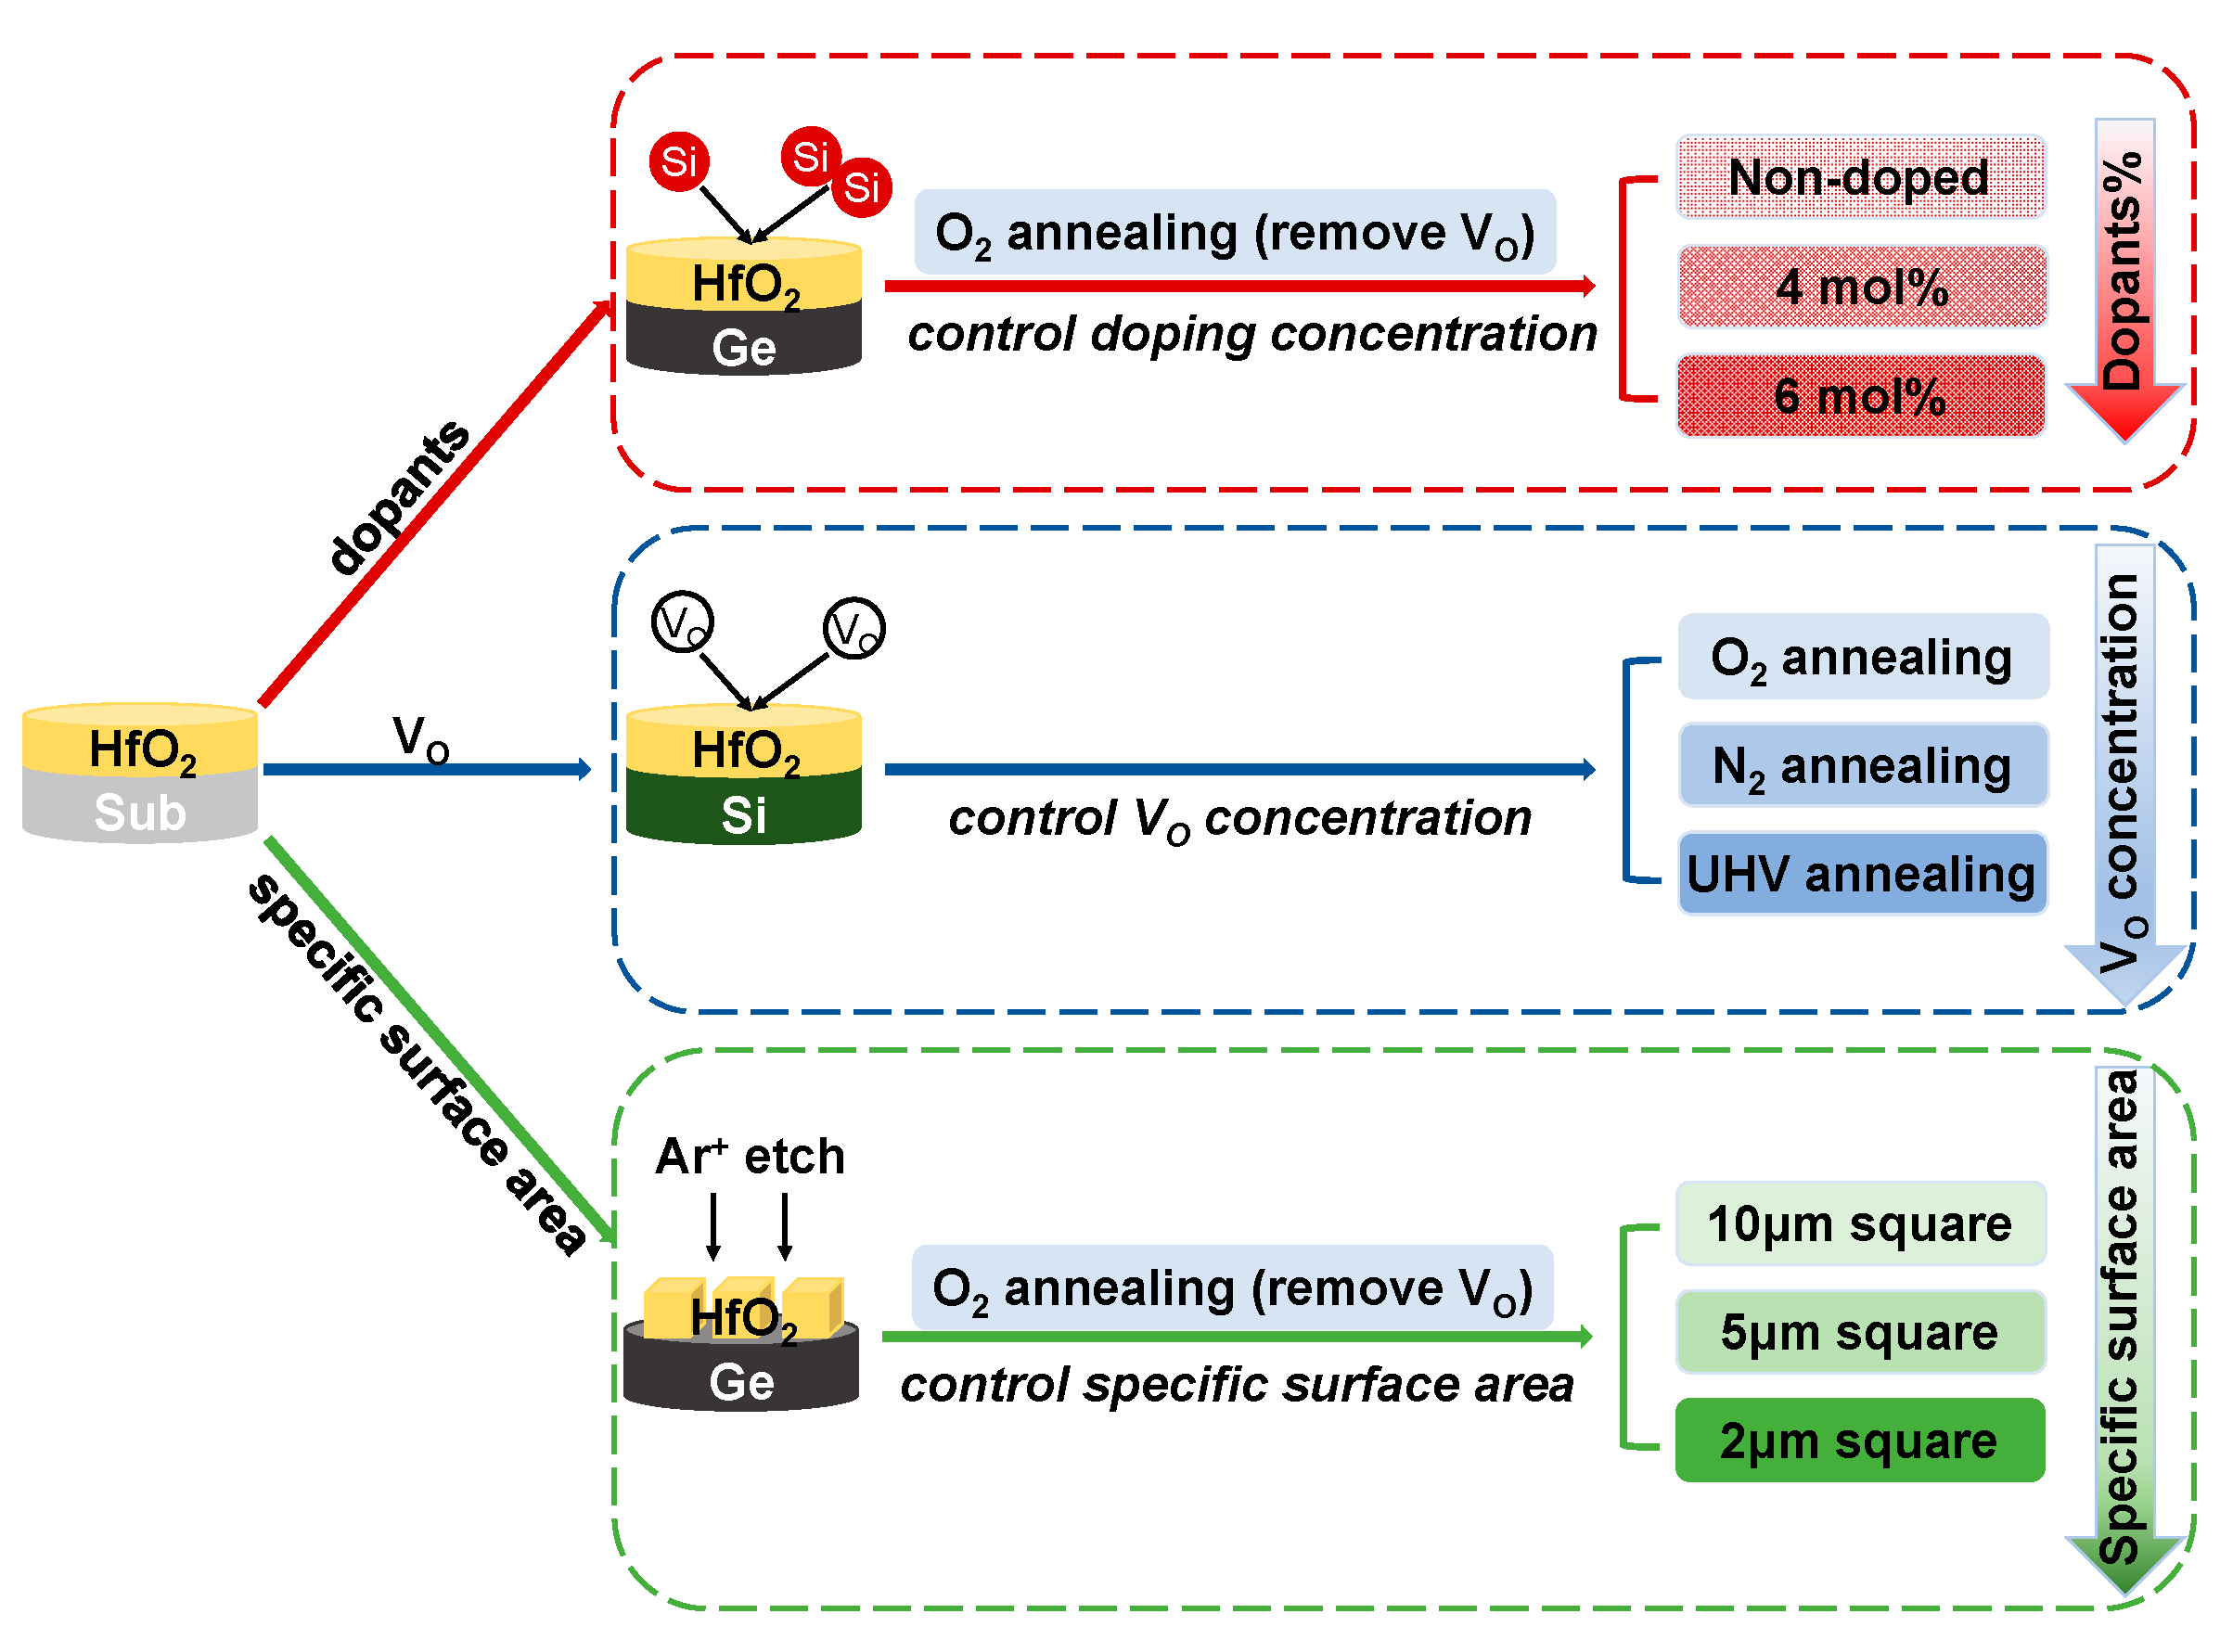
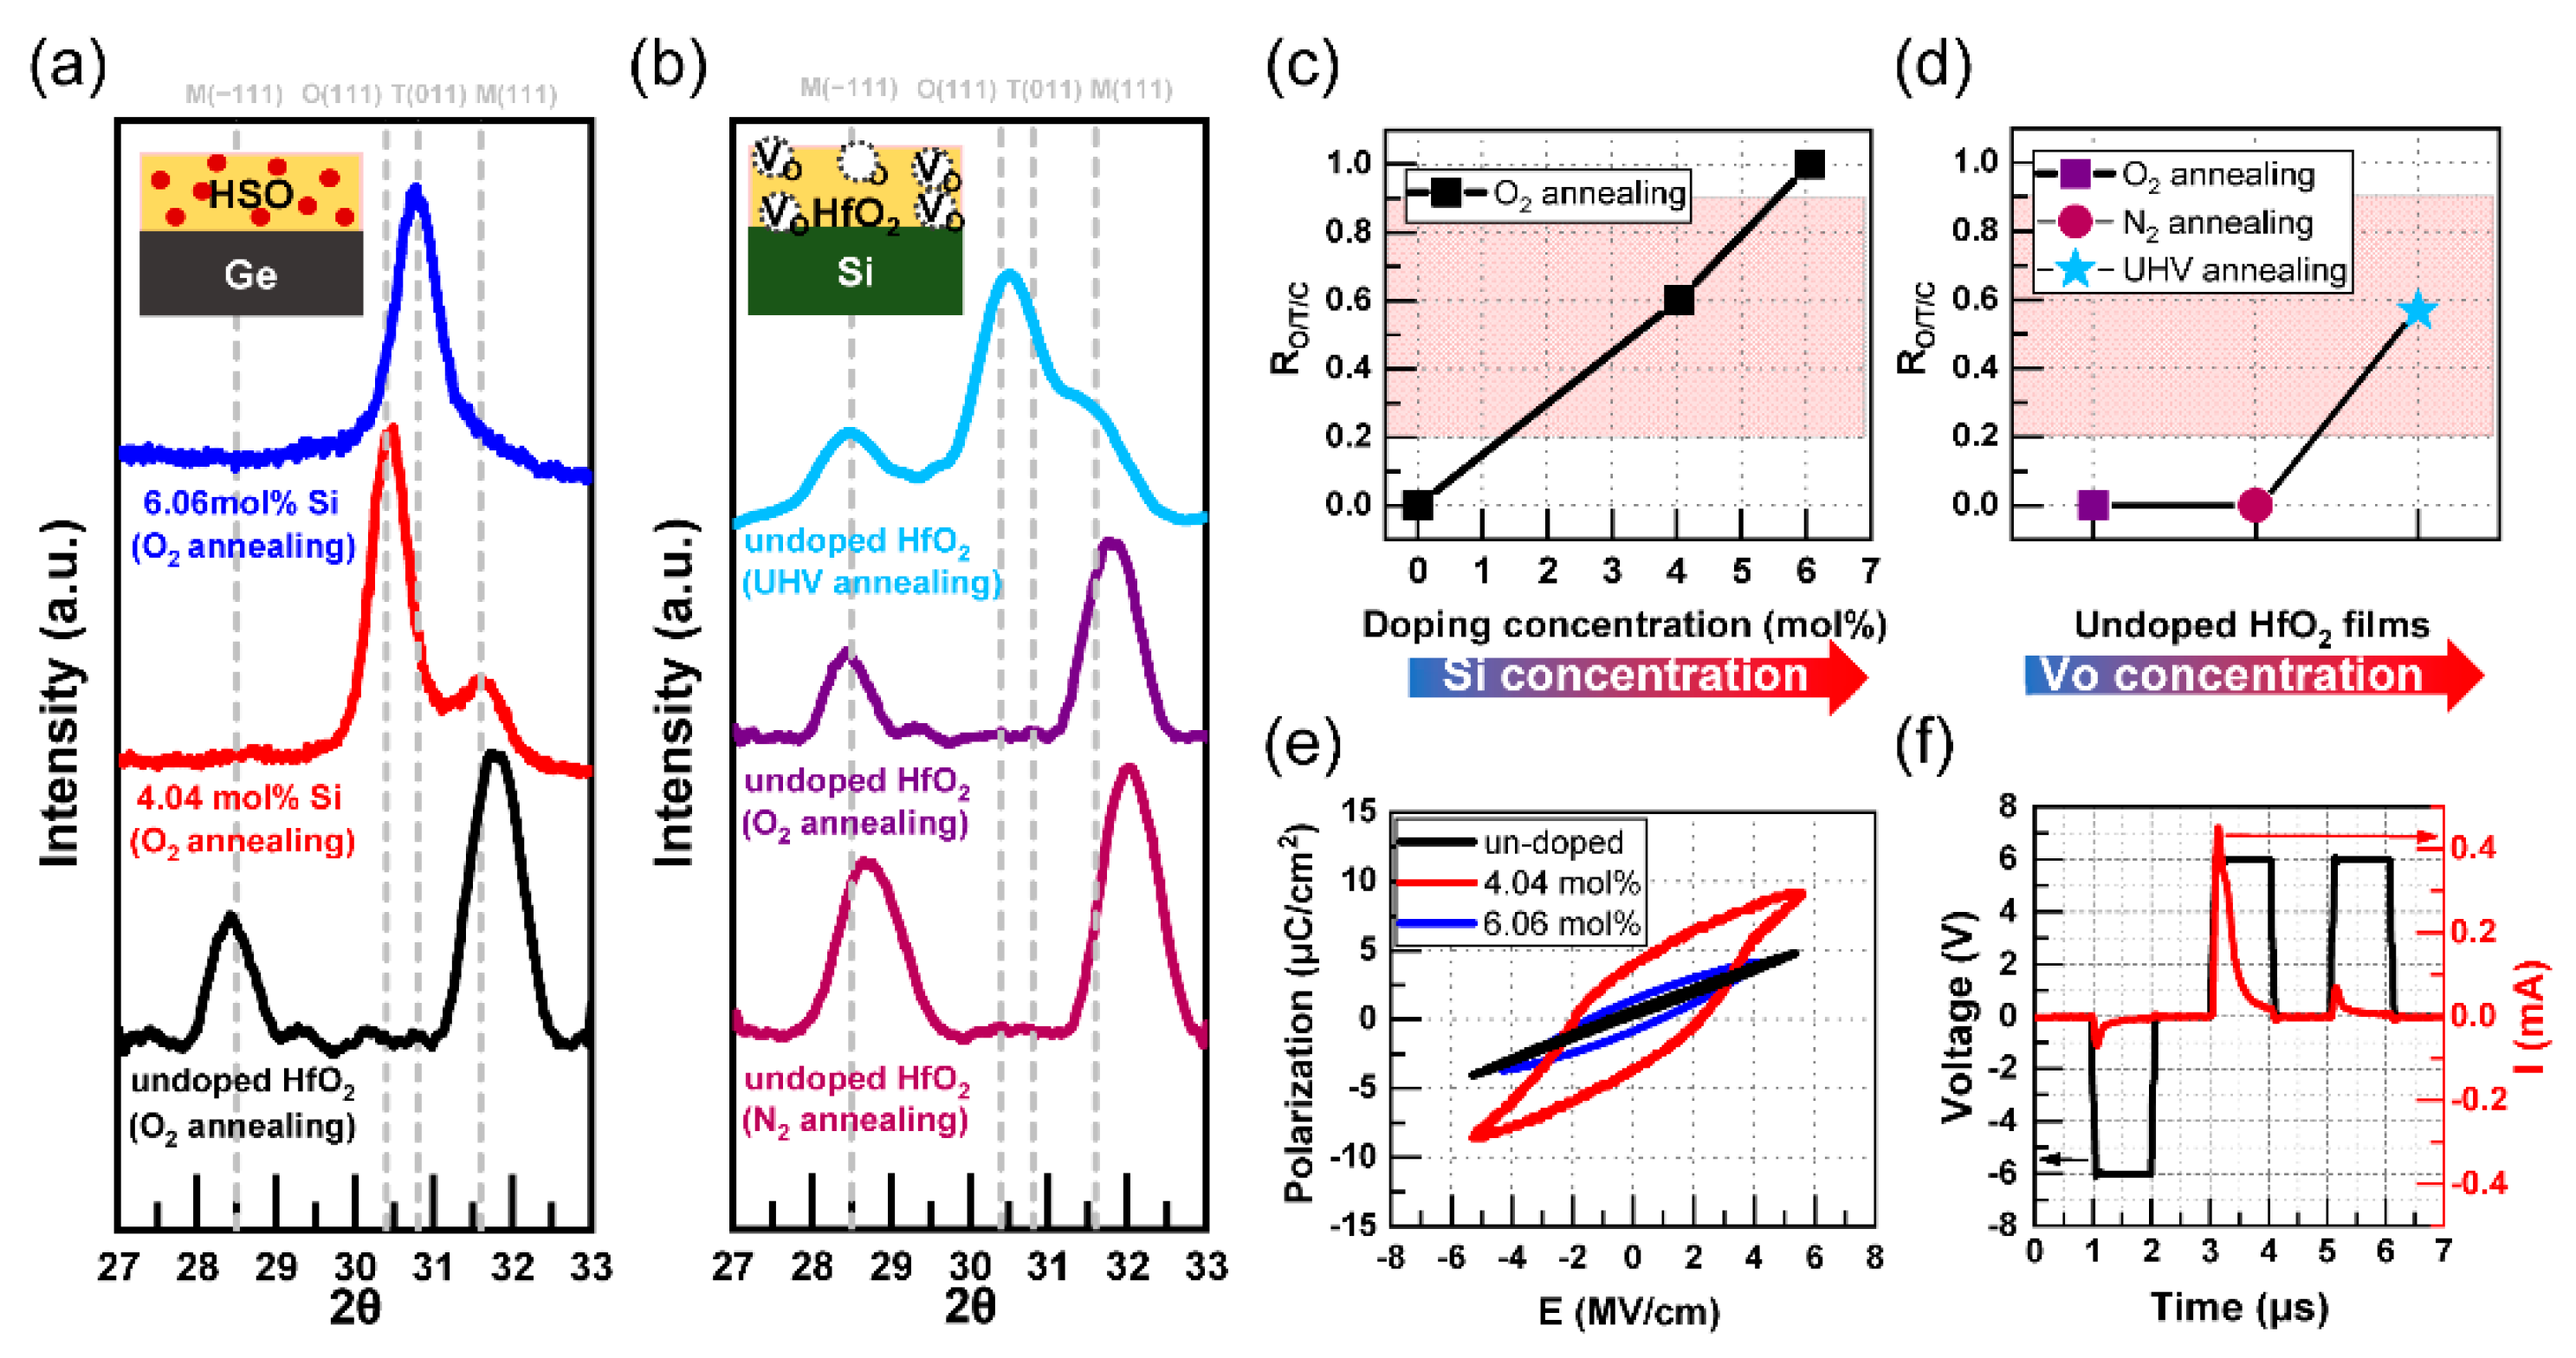
3.1. Independent and Common Effects of Dopants and VO

Firstly, we consider the independent effect of doping concentration and VO on the ferroelectric phase of HfO2 thin films. GIXRD patterns of doped films with different doping concentrations and undoped-HfO2 films with different annealing conditions are summarized in Figure 2a,b. The M-phase appears at both 28.5° and 31.6°, while the peak around 30.5° is attributed to T-, O-, or cubic phases (C-phase) whose difference is difficult to distinguish solely. Therefore, it is referred to as the O/T/C phase hereafter [22]. In order to clarify the impact quantitatively, we extracted the O/T/C phase fraction (RO/T/C) by Gaussian peak splitting. RO/T/C is defined as the ratio of O/T/C phase peak intensity to the total intensity (I), expressed as
RO/T/C = (IO/T/C/(IM(−111) + IO/T/C + IM(111))),
Based on the literature, ferroelectricity in HfO2 is observed with RO/T/C of 20–90% [23]. The effect of doping concentration and VO on RO/T/C are summarized in Figure 2c,d where the red regions are those with ferroelectricity. As for the doped films, 60% of the O/T/C phase was stabilized with a suitable doping concentration (~4 mol%) without other effects. The M-phase tends to form with lower doping concentrations while the T-phase with higher ones. The P-E characteristics in Figure 2e confirm ferroelectricity in ~4 mol% HSO films and non-ferroelectricity in ~6 mol% or undoped ones. This is consistent with reported data [1]. As for undoped HfO2 films, a pure M-phase is formed with N2- or O2-PDA as expected. Interestingly, ~60% of the O/T/C phase is formed with UHV-PDA. This indicates the formation of ferroelectric O-phase with this condition. In Figure 2f, the ferroelectricity of the film with UHV-PDA is further confirmed by PUND measurement. These results clearly suggest that either sufficient VO or sufficient dopants enable the stabilization of the O-phase in HfO2 thin film independently. Although the effect of dopants and VO on phase formation have been investigated widely, previous studies neglected to separate the effect of these two parameters, thus making it difficult to get the intrinsic and general view. Here, we clearly show their independent effect and amply confirm that the ferroelectric phase can be formed in really undoped HfO2 films with an amount of Vo. However, it should be noticed that introducing too much VO into the films will arouse large leakage which brings negative effects from the perspective of application engineering.
In addition to the independent effect of Si dopants and VO on promoting O/T/C phase stabilization, the combined effect of two factors was further considered. Figure 3a shows P−E results of low doped HSO films (~2.5 mol%) with N2- or O2-PDA, respectively. As expected, no obvious polarization is observed in ~2.5 mol% HSO with O2-PDA. However, the polarization of ~2.5 mol% HSO films with N2-PDA increases rapidly which even becomes greater than that of 4 mol% HSO films. Figure 3b,c shows the surface topography of the films with N2- and O2-PDA respectively. Both films have excellent uniformity, while films with O2-PDA have larger grains (RMS = 0.158) compared to that of N2-PDA (RMS = 0.203). It is well known that the T-phase has smaller grains than the M-phase [24]. Thus, these results suggest that a certain amount of O/T phase can also be formed if the additive concentration of Vo and Si is sufficient, though the individual concentrations of them are not enough. Namely, VO plays a similar role as a dopant.

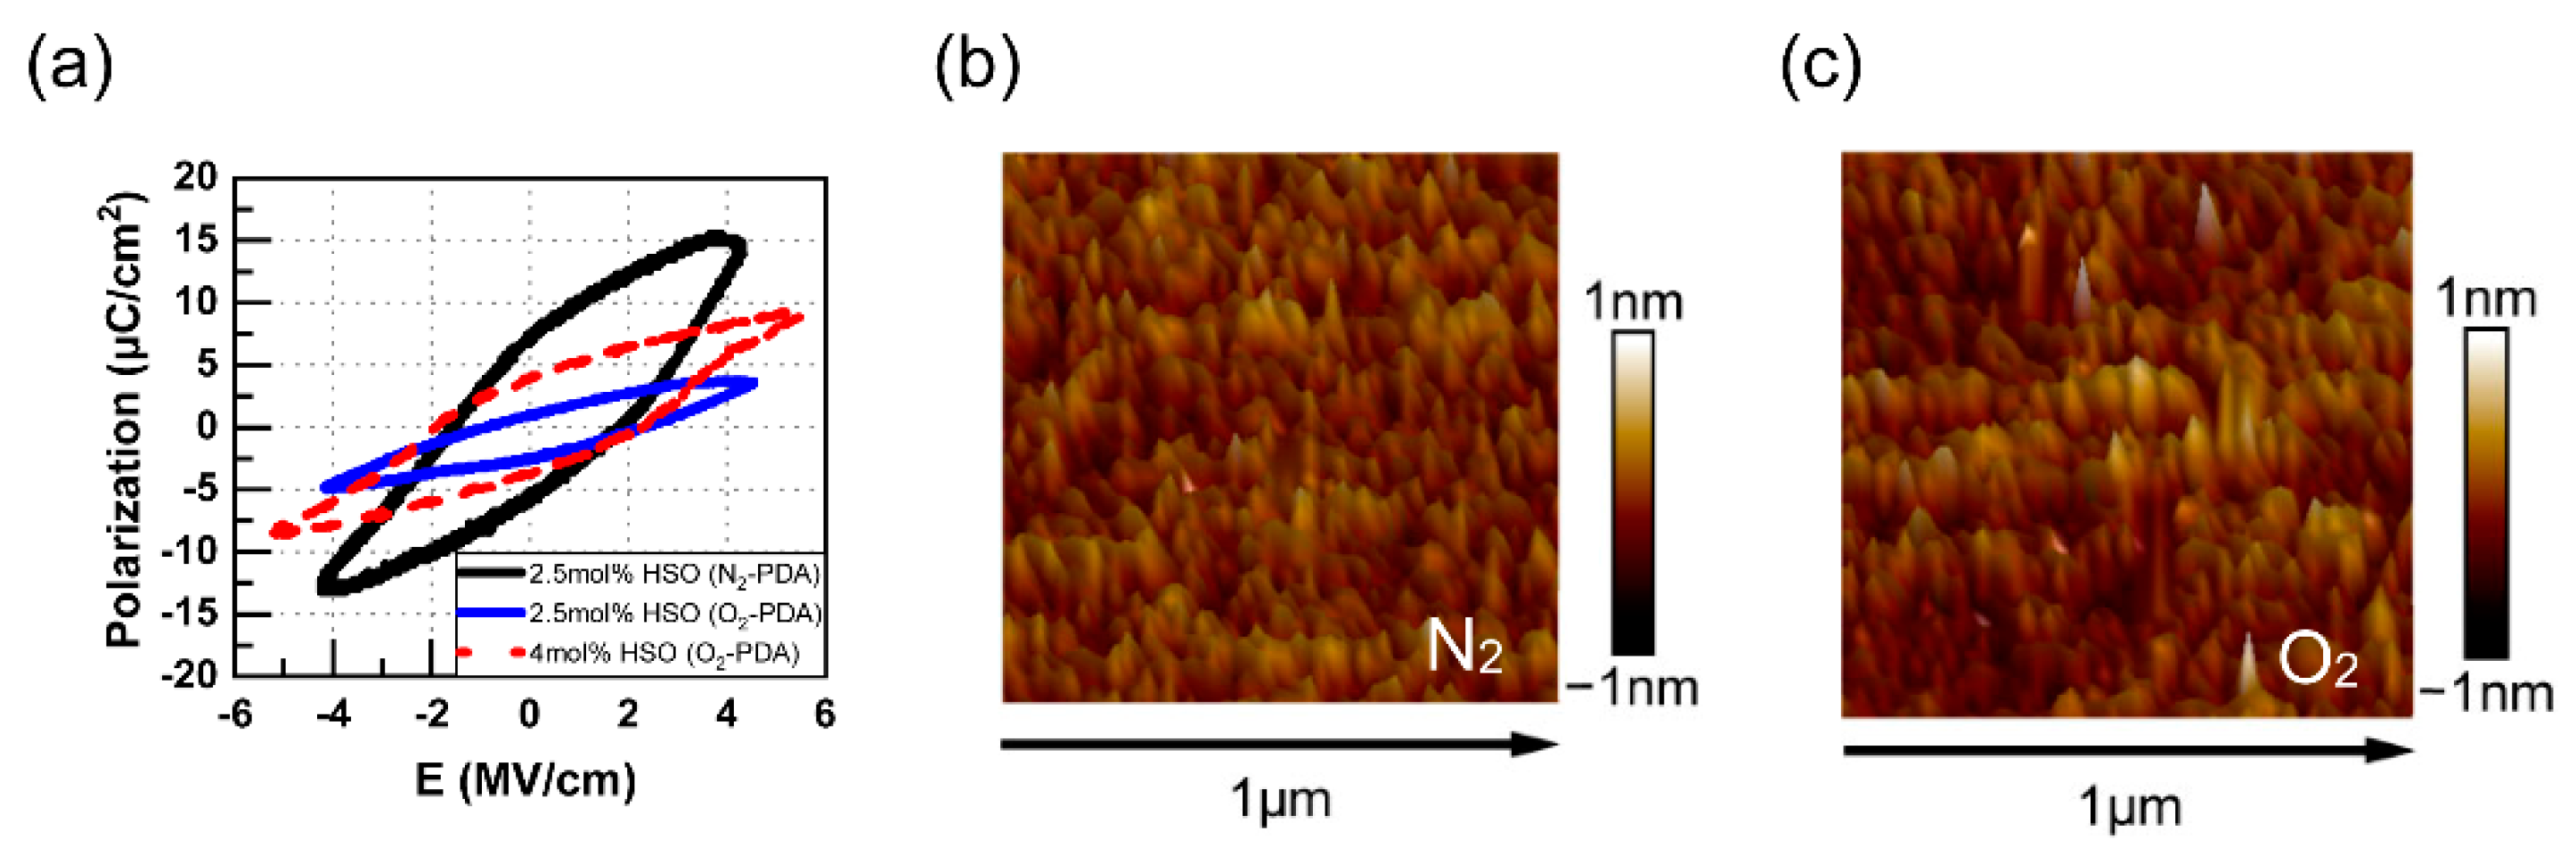
3.2. Effect of Specific Surface Area
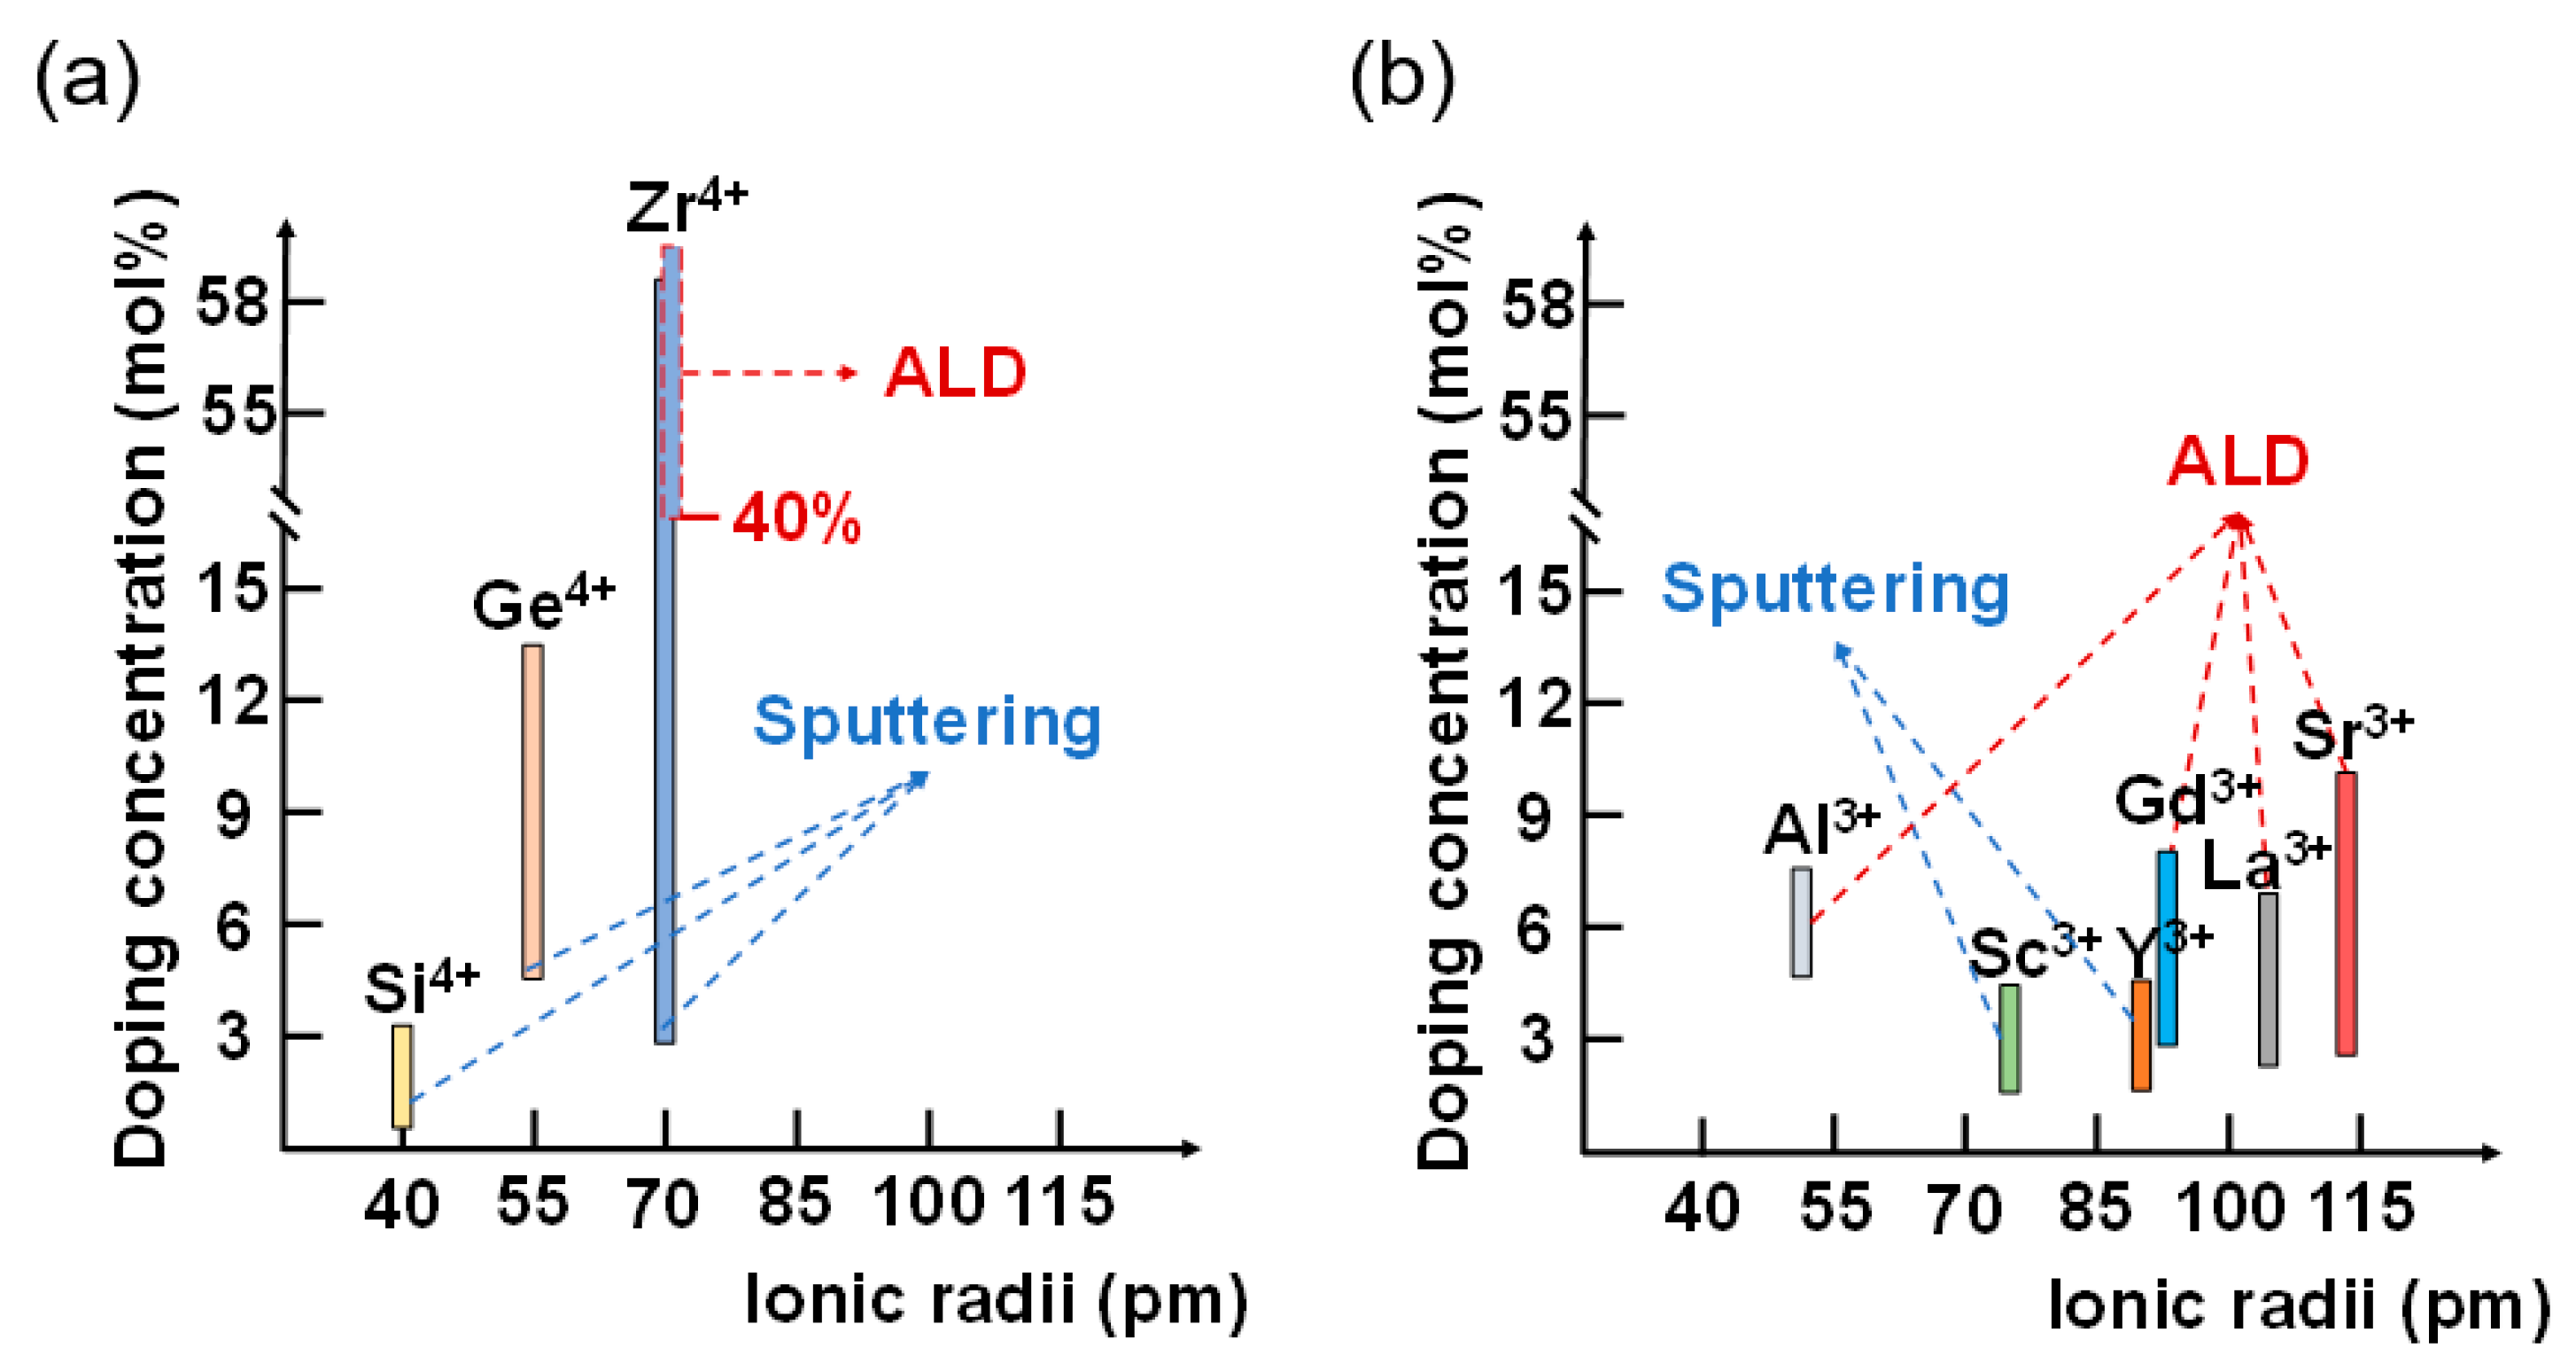
Next, we investigate the independent effect of surface area. The effect of reducing the planar size of the film is very important to device performance when the technology node is within a nanometer. To get a clear view experimentally, we etched 30 nm ~4 mol% Si-doped and 10 nm undoped HfO2 films into cuboids with different sizes, followed by O2-PDA to study the influence of the specific surface area. Figure 4a shows the morphology diagram of the cuboid arrays and Figure 4b shows the AFM analysis of a cuboid with a length of 10 μm. The etching depth is about 30 nm, indicating that HfO2 films are removed without residual. Figure 5a,b show GIXRD patterns of doped and undoped HfO2 cuboid arrays with a length of 2 μm, 5 μm, and 10 μm, respectively. The signal of the undoped HfO2 cuboid array with a length of 2 μm is too weak to analyze, so we did not show the result. Similarly, we extracted RO/T/C from the curves and plotted them in Figure 5c. It is shown that more O/T/C phases tend to be stabilized as the length of the cuboid decrease, namely the specific surface area increases, regardless of doping. In particular, the emergency of the O/T/C phase in the undoped HfO2 array with a length below 10 μm suggests that the O-phase could be formable by only increasing the specific surface area largely. RO/T/C of 25% is reached in our results for undoped films with a length of 5 μm. Although it is still relatively small for getting enough polarization, we believe that it can be optimized by further decreasing the size of the film to the nanoscale. These results clearly show the enhanced effect of specific surface area on the ferroelectric phase formation. Moreover, decreasing film thickness is another common way to increase specific surface area and it has been intensively investigated in previous studies. It has been shown a similar result that thinner HfO2 films tend to form T-phase while thicker films tend to form M-phase. In general, our results provide an approach to controlling the properties of HfO2-based devices in size scaling. This is quite valuable for the demonstration of nanoscale devices.

4. Discussion

Finally, we discuss the intrinsic parameters for controlling ferroelectric O-phase formation in HfO2 films by combining the above results with those published previously. Apart from Si, which was discussed in our study, quadrivalent cation dopants, including Ge, Si, Zr, and various trivalent ones, including Y, Al, La, Gd, Sc, and Sr have been confirmed to stabilize the O-phase in HfO2 films by sputtering or ALD [1,25,26]. However, quinquevalent cations, such as Nb, do not show such an effect [23]. To get a general view, the radii, and the concentration for the ferro-O phase stabilization of these dopants are summarized in Figure 6a,b. It is found that all the quadrivalent dopants with smaller radii than Hf (~71 pm) and lower doping concentrations are needed for smaller radii dopants. This indicates that the tensile strain caused by dopants with smaller radii than Hf is likely to make HfO2 films ferroelectric. These quadrivalent dopants will cause lattice to shrinkage, and the smaller the dopant radius is (shorter bond length), the larger the strain is. Thus, it can be understood that a lower doping concentration is needed for dopants with smaller radii to get the same strain as dopants with larger radii. As for trivalent dopants, interestingly, all of them work with similar doping concentrations for O-phase stabilization but the radii vary from 53 pm (<Hf) to 115 pm (>Hf). It has been proposed that trivalent dopants introduce VO into HfO2 [25]. In addition, anion dopant N has been reported to have a similar effect [27]. Additionally, our results also confirm that even the pure VO is able to stabilize the O-phase in HfO2 thin film. Therefore, we consider that all the trivalent dopants, anion N dopant works in the same manner as VO. It is well known that VO also induces tensile strain into HfO2 [28]. Thus, the intrinsic effect of all the dopants including VO can be understood as inducing tensile strain. Meanwhile, we noted that the doping concentration to achieve ferroelectricity in HfO2 by SPD was slightly lower than that by the ALD process even for the same dopants. This may be because the sputtering process induces more Vo additionally than ALD which affects the ferroelectricity with dopants commonly as mentioned above [20]. Therefore, it is worth noting that the tensile strain is related to dopants and VO, and tensile stress is associated with the direction of the in-plane. It is different if the direction is changed.
Considering the effect of specific surface area, it is well known that the increase in surface area is a kind of increase in surface tension. Surface tension can be regarded as tensile stress from the surface and enables the distortion of crystalline lattice [29]. In addition, there is also other external stress acting on the surface to promote the formation of the O-phase, such as mechanical capping or selecting the substrate [2,8,9,30]. Moreover, an early paper found that ferroelectricity in HfO2 can be observed on substrates inducing tensile stress in the film but not on those inducing compressive stress [31]. Therefore, the effect of specific surface area may also be originated from the effect of tensile strain from the surface.
To sum up, in controlling phase composition in HfO2 thin films, all the effects of the dopants, VO, and specific surface area, which are investigated in this work, as well as other factors reported in the literature can be generalized to be a strain effect. To understand this more deeply, we further consider it from a thermodynamic view. The change in Gibbs free energy of an elastic dielectric with fixed pressure is given by
dG = −SdT − εii − DidEi,
where S is entropy, T is temperature, ε is strain, σ is stress, D is electric displacement, E is the electric field, and i is the coordinates (i = 1, 2, 3). Therefore, in the process of HfO2-based film fabrication, two parameters, temperature and strain, affect the phase formation intrinsically as E = 0. Since the O-phase is thought to be stabilized in the phase transition from T- to M-phase, we will only discuss the M-, O-, and T-phases in the following [32]. It is well known that T-phases are generally under high temperature while M is for the reverse case [2]. Based on Equation (2), it is understandable that strain has a similar effect to temperature, that is, the T-phase is more stable with larger strain and the M-phase is more stable with lower strain, which is consistent with our results. Thus, the phase formation and transition with different strains and given annealing temperature (<700 °C) are discussed as follows. For the film with relatively small strain, namely, the film with low doping concentration, no VO, or small specific surface area, the M-phase is the most stable. Thus, the M-phase is nucleated and dominant after annealing which behaves as non-ferroelectric (first panel of Figure 7a). When sufficient strain is induced in the film by any method, the free energy of the T-phase is lowered relative to the M-phase, which makes it possible for the T-phase to be stabilized. Especially in the stage of initial nucleation, the tiny crystallite (radius ~2 nm) with larger surface energy promotes the nucleation of the T-phase [33]. As the grain grows and the thermal process continues in annealing, part of the strain may be released and the T-phase may become less stable than the M-phase. It has been studied that the activation energy of the T–O phase transition (~30 meV f.u.−1) is lower than that of the T–M phase transition (~300 meV f.u.−1) due to the similar crystal structure between T- and O-phases [11,34]. Thus, T–O–M phase transition may occur and a metastable O-phase is formed transitionally (second panel of Figure 7a). When the strain in the film is further increased, corresponding to high doping concentration in our experiments, the T-phase keeps being the most stable even with partial strain releasing [13,30]. In this case, there is only the T-phase in the films (third panel in Figure 7a). The schematics of phase concentration in HfO2-based film with strain increases at a given temperature are shown in Figure 7b.

5. Conclusions

In conclusion, the separate effects of dopant, VO, and specific surface area on O-phase formation in ferroelectric HfO2 films have been demonstrated experimentally. It has been confirmed that in addition to sufficient dopants, only sufficient VO or specific surface area enables us to stabilize the ferroelectric O-phase in HfO2 films independently. By summarizing the results, a strain effect is considered to be the origin of these factors and this view is applicable for interpreting most of the results reported to date. The strain effect has also been understood from a thermodynamic view. T-phase nucleation with sufficient strain and its transition to the M-phase through a T–O–M pathway is a key to the formation of a ferroelectric O-phase. Thus, engineering the strain in HfO2-based films is critical for controlling the ferroelectricity of HfO2 thin films.

Author Contributions

Conceptualization, T.C. and X.L.; formal analysis, T.C. and X.L.; investigation, T.C., L.Z., D.C. and Y.F.; resources, J.L. and X.L. writing—original draft preparation, T.C.; writing—review and editing, X.L. All authors have read and agreed to the published version of the manuscript.

Funding

This research was funded by the National Natural Science Foundation of China (91964110, 61904103, 62111540163), Natural Science Foundation of Shanghai (19ZR1475300, 19JC1416700), and partly by the Interdisciplinary Program of Shanghai Jiao Tong University (project number ZH2018QNA09).

Institutional Review Board Statement

Not applicable.

Informed Consent Statement

Not applicable.

Data Availability Statement

Not applicable.

Acknowledgments

We would like to thank Emeritus Akira Toriumi, Koji Kita, and Nishimura from the University of Tokyo for discussions and thank Liying Wu from the Center of Advanced Electronic Materials and Devices (AEMD) of Shanghai Jiao Tong University for supporting plasma enhanced atomic layer deposition.

Conflicts of Interest

The authors declare no conflict of interest.

References

  1. Bohr, M.; Chau, R.; Ghani, T.; Mistry, K. The High-K Solution. IEEE Spectr. 2007, 44, 29. [Google Scholar] [CrossRef]
  2. Böscke, T.S.; Müller, J.; Bräuhaus, D.; Schröder, U.; Böttger, U. Ferroelectricity in hafnium oxide thin films. Appl. Phys. Lett. 2011, 99, 102903. [Google Scholar] [CrossRef]
  3. Müller, J.; Polakowski, P.; Müller, S.; Mikolajick, T. Ferroelectric Hafnium Oxide Based Materials and Devices: Assessment of Current Status and Future Prospects. ECS J. Solid State Sci. Technol. 2015, 4, N30–N35. [Google Scholar] [CrossRef]
  4. Park, M.H.; Lee, Y.H.; Mikolajick, T.; Schroeder, U.; Hwang, C.S. Review and perspective on ferroelectric HfO2-based thin films for memory applications. MRS Commun. 2018, 8, 795. [Google Scholar] [CrossRef] [Green Version]
  5. Park, M.H.; Lee, Y.H.; Kim, H.J.; Kim, Y.J.; Moon, T.; Kim, K.D.; Müller, J.; Kersch, A.; Schroeder, U.; Mikolajick, T.; et al. Ferroelectricity and Antiferroelectricity of Doped Thin HfO2-Based Films. Adv. Mater. 2015, 27, 1811. [Google Scholar] [PubMed]
  6. Sang, X.; Grimley, E.D.; Schenk, T.; Schroeder, U.; Lebeau, J.M. On the structural origins of ferroelectricity in HfO2 thin films. Appl. Phys. Lett. 2015, 106, 162905. [Google Scholar] [CrossRef]
  7. Park, M.H.; Lee, D.H.; Yang, K.; Park, J.-Y.; Yu, G.T.; Park, H.W.; Materano, M.; Mittmann, T.; Lomenzo, P.D.; Mikolajick, T.; et al. Review of defect chemistry in fluorite-structure ferroelectrics for future electronic devices. J. Mater. Chem. C 2020, 8, 10526. [Google Scholar] [CrossRef]
  8. Shiraishi, T.; Katayama, K.; Yokouchi, T.; Shimizu, T.; Oikawa, T.; Sakata, O.; Uchida, H.; Imai, Y.; Kiguchi, T.; Konno, T.J. Impact of mechanical stress on ferroelectricity in (Hf0.5Zr0.5)O2 thin films. Appl. Phys. Lett. 2016, 108, 262904. [Google Scholar] [CrossRef]
  9. Park, M.H.; Kim, H.J.; Kim, Y.J.; Moon, T.; Kim, K.; Hwang, C.S. Study on the degradation mechanism of the ferroelectric properties of thin Hf0.5Zr0.5O2 films on TiN and Ir electrodes. Appl. Phys. Lett. 2014, 105, 072901. [Google Scholar]
  10. Batra, R.; Tran, H.D.; Ramprasad, R. Stabilization of metastable phases in hafnia owing to surface energy effects. Appl. Phys. Lett. 2016, 108, 172902. [Google Scholar]
  11. Park, M.H.; Lee, Y.H.; Kim, H.J.; Schenk, T.; Lee, W.; Kim, K.D.; Fengler, F.P.G.; Mikolajick, T.; Schroeder, U.; Hwang, C.S. Surface and grain boundary energy as the key enabler of ferroelectricity in nanoscale hafnia-zirconia: A comparison of model and experiment. Nanoscale 2017, 9, 9973. [Google Scholar] [CrossRef] [Green Version]
  12. Kim, K.D.; Park, M.H.; Kim, H.J.; Kim, Y.J.; Moon, T.; Lee, Y.H.; Hyun, S.D.; Gwon, T.; Hwang, C.S. Ferroelectricity in undoped-HfO2 thin films induced by deposition temperature control during atomic layer deposition. J. Mater. Chem. C 2016, 4, 6864. [Google Scholar] [CrossRef]
  13. Materlik, R.; Künneth, C.; Kersch, A. The Origin of Ferroelectricity in Hf1−xZrxO2: A Computational Investigation and a Surface Energy Model. J. Appl. Phys. 2015, 117, 134109. [Google Scholar] [CrossRef] [Green Version]
  14. Hamouda, W.; Pancotti, A.; Lubin, C.; Tortech, L.; Richter, C.; Mikolajick, T.; Schroeder, U.; Barrett, N. Physical chemistry of the TiN/Hf0.5Zr0.5O2 interface. J. Appl. Phys. 2020, 127, 064105. [Google Scholar] [CrossRef]
  15. Schroeder, U.; Materano, M.; Mittmann, T.; Lomenzo, P.D.; Mikolajick, T.; Toriumi, A. Recent progress for obtaining the ferroelectric phase in hafnium oxide based films: Impact of oxygen and zirconium. Jpn. J. Appl. Phys. 2019, 58, SL0801. [Google Scholar] [CrossRef]
  16. Szyjka, T.; Baumgarten, L.; Mittmann, T.; Matveyev, Y.; Schlueter, C.; Mikolajick, T.; Schroeder, U.; Müller, M. Chemical Stability of IrO2 Top Electrodes in Ferroelectric Hf0.5Zr0.5O2-Based Metal–Insulator–Metal Structures: The Impact of Annealing Gas. Phys. Stat. Solidi Rapid Res. Lett. 2021, 15, 2100027. [Google Scholar] [CrossRef]
  17. Mittmann, T.; Michailow, M.; Lomenzo, P.D.; Gärtner, J.; Falkowski, M.; Kersch, A.; Mikolajick, T.; Schroeder, U. Stabilizing the ferroelectric phase in HfO2-based films sputtered from ceramic targets under ambient oxygen. Nanoscale 2021, 13, 912. [Google Scholar] [CrossRef] [PubMed]
  18. Lomenzo, P.D.; Takmeel, Q.; Zhou, C.; Fancher, C.M.; Lambers, E.; Rudawski, N.G.; Jones, J.L.; Moghaddam, S.; Nishida, T. TaN interface properties and electric field cycling effects on ferroelectric Si-doped HfO2 thin films. J. Appl. Phys. 2015, 117, 134105. [Google Scholar] [CrossRef]
  19. Nishimura, T.; Xu, L.; Shibayama, S.; Yajima, T.; Migita, S.; Toriumi, A. Ferroelectricity of nondoped thin HfO2 films in TiN/HfO2/TiN stacks. Jpn. J. Appl. Phys. 2016, 55, 08PB01. [Google Scholar] [CrossRef]
  20. Mittmann, T.; Materano, M.; Lomenzo, P.D.; Park, M.H.; Stolichnov, I.; Cavalieri, M.; Zhou, C.; Chung, C.C.; Jones, J.L.; Szyjka, T.; et al. Origin of Ferroelectric Phase in Undoped HfO2 Films Deposited by Sputtering. Adv. Mater. Interfaces 2019, 6, 1900042. [Google Scholar] [CrossRef] [Green Version]
  21. Tian, X.; Shibayama, S.; Nishimura, T.; Yajima, T.; Migita, S.; Toriumi, A. Evolution of ferroelectric HfO2 in ultrathin region down to 3 nm. Appl. Phys. Lett. 2018, 112, 102902. [Google Scholar] [CrossRef]
  22. Mueller, S.; Mueller, J.; Singh, A.; Riedel, S.; Sundqvist, J.; Schroeder, U.; Mikolajick, T. Incipient Ferroelectricity in Al-Doped HfO2 Thin Films. Adv. Funct. Mater. 2012, 22, 2412. [Google Scholar] [CrossRef]
  23. Xu, L.; Shibayama, S.; Izukashi, K.; Nishimura, T.; Yajima, T.; Migita, S.; Toriumi, A. General relationship for cation and anion doping effects on ferroelectric HfO2 formation. In Proceedings of the 2016 IEEE International Electron Devices Meeting (IEDM), San Francisco, CA, USA, 3–7 December 2016; p. 25. [Google Scholar]
  24. Garvie, R.C. The occurrence of metastable tetragonal zirconia as a crystallite size effect. J. Phys. Chem. 1965, 69, 1238–1243. [Google Scholar] [CrossRef]
  25. Xu, L.; Nishimura, T.; Shibayama, S.; Yajima, T.; Migita, S.; Toriumi, A. Kinetic pathway of the ferroelectric phase formation in doped HfO2 films. J. Appl. Phys. 2017, 122, 124104. [Google Scholar] [CrossRef]
  26. Schroeder, U.; Yurchuk, E.; Muller, J.; Martin, D.; Schenk, T.; Polakowski, P.; Adelmann, C.; Popovici, M.I.; Kalinin, S.V.; Mikolajick, T. Impact of different dopants on the switching properties of ferroelectric hafnium oxide. Jpn. J. Appl. Phys. 2014, 53, 08LE02. [Google Scholar] [CrossRef]
  27. McBride, J.R.; Hass, K.C.; Poindexter, B.D.; Weber, W.H. Raman and x-ray studies of Ce1−xRexO2−y, where Re = La, Pr, Nd, Eu, Gd, Tb. J. Appl. Phys. 1994, 76, 2435. [Google Scholar] [CrossRef]
  28. Jena, S.; Tokas, R.B.; Misal, J.S.; Rao, K.D.; Udupa, D.V.; Thakur, S.; Sahoo, N.K. Effect of O2/Ar gas flow ratio on the optical properties and mechanical stress of sputtered HfO2 thin films. Thin Solid Film. 2015, 592, 135. [Google Scholar] [CrossRef]
  29. Lukyanchuk, I.A.; Schilling, A.; Gregg, J.M.; Catalan, G.; Scott, J.F. Origin of ferroelastic domains in free-standing single-crystal ferroelectric films. Phys. Rev. B 2009, 79, 144111. [Google Scholar] [CrossRef]
  30. Park, M.H.; Kim, H.J.; Kim, Y.J.; Moon, T.; Hwang, C.S. The effects of crystallographic orientation and strain of thin Hf0.5Zr0.5O2 film on its ferroelectricity. Appl. Phys. Lett. 2014, 104, 072901. [Google Scholar] [CrossRef]
  31. Katayama, K.; Shimizu, T.; Sakata, O.; Shiraishi, T.; Nakamura, S.; Kiguchi, T.; Akama, A.; Konno, T.J.; Uchida, H.; Funakubo, H. Orientation control and domain structure analysis of {100}-oriented epitaxial ferroelectric orthorhombic HfO2-based thin films. J. Appl. Phys. 2016, 119, 134101. [Google Scholar] [CrossRef]
  32. Kisi, E.H. Influence of Hydrostatic Pressure on the t→o Transformation in Mg-PSZ Studied by In Situ Neutron Diffraction. J. Am. Ceram. Soc. 1998, 81, 741–745. [Google Scholar] [CrossRef]
  33. Park, M.H.; Lee, Y.H.; Kim, H.J.; Kim, Y.J.; Moon, T.; Kim, K.D.; Hyun, S.D.; Mikolajick, T.; Schroeder, U.; Hwang, C.S. Understanding the formation of the metastable ferroelectric phase in hafnia–zirconia solid solution thin films. Nanoscale 2018, 10, 716. [Google Scholar] [CrossRef] [PubMed] [Green Version]
  34. Park, M.H.; Lee, Y.H.; Mikolajick, T.; Schroeder, U.; Hwang, C.S. Thermodynamic and Kinetic Origins of Ferroelectricity in Fluorite Structure Oxides. Adv. Electron. Mater. 2019, 5, 1800522. [Google Scholar] [CrossRef]
Figure 1. The process for independent control of doping concentration, VO concentration, and specific surface area in HfO2 thin film.
Electronics 11 02369 g001
Figure 2. Summarized GIXRD patterns of (a) HSO films with different doping concentrations and (b) undoped HfO2 films with different annealing atmospheres. (c,d) Extracted RO/T/C by fitting curves from (a,b). (e) PE curves of undoped, ~4% and ~6% HSO films with O2 annealing. Only ~4% of doped HfO2 films show ferroelectricity. (f) The difference in current measured by PUND measurement demonstrates that undoped HfO2 films with UHV annealing are ferroelectric.
Electronics 11 02369 g002
Figure 3. (a) P-E curves of 2.5 mol% HSO films with N2- and O2-PDA, and 4 mol% HSO films with O2-PDA. AFM results of 2.5 mol% HSO films which were annealed in (b) N2 and (c) O2, respectively.
Electronics 11 02369 g003
Figure 4. (a) Graphical presentation of cuboid array films whose side lengths were set to 2 μm, 5 μm, and 10 μm before PDA. (b) AFM diagram of one cuboid in a 10 μm array, showing that HfO2-based films were all etched.
Electronics 11 02369 g004
Figure 5. GIXRD results of (a) HSO (~4 mol% of Si) cuboid array films and (b) undoped HfO2 cuboid array films. The peak] intensity of the O/T/C phase increases with the decrease of array size. (c) Extracted RO/T/C by fitting GIXRD results in (a,b). O-phase seems formable in undoped films only by decreasing the side length.
Electronics 11 02369 g005
Figure 6. (a) Summarized doping concentration and ionic radii of (a) quadrivalent (Si, Ge, Zr) and (b) trivalent (Al, Sc, Y, Gd, La, Sr) dopants that make HfO2 films ferroelectric [22,23].
Electronics 11 02369 g006
Figure 7. (a) Free energy diagram with different strains at a given temperature which determines phase composition in HfO2 film. (b) The schematic diagram of the mechanism for general parameters influencing phase stability in HfO2 films.
Electronics 11 02369 g007
Publisher’s Note: MDPI stays neutral with regard to jurisdictional claims in published maps and institutional affiliations.

