Abstract
The Industrial Internet of Things (IIoT) is used in various industries to achieve industrial automation and intelligence. Therefore, it is important to assess the network security situation of the IIoT. The existing network situation assessment methods do not take into account the particularity of the IIoT’s network security requirements and cannot achieve accurate assessment. In addition, IIoT transmits a lot of heterogeneous data, which is subject to cyber attacks, and existing classification methods cannot effectively deal with unbalanced data. To solve the above problems, this paper first considers the special network security requirements of the IIoT, and proposes a quantitative evaluation method of network security based on the Analytic Hierarchy Process (AHP). Then, the average under-/oversampling (AUOS) method is proposed to solve the problem of unbalance of network attack data. Finally, an IIoT network security situation assessment classifier based on the eXtreme Gradient Boosting (XGBoost) is constructed. Experiments show that the situation assessment method proposed in this paper can more accurately characterize the network security state of the IIoT. The AUOS method can achieve data balance without generating too much data, and does not burden the training of the model. The classifier constructed in this paper is superior to the traditional classification algorithm.
1. Introduction
The Internet of Things (IoT) is one of the fastest-growing technologies. With the development of IoT technology, information from various fields can be integrated into comprehensive applications [1]. The IIoT combines the emerging technologies of the IoT with industrial control systems (ICS) to enable an intelligent industrial ecosystem by providing potential solutions for automating manufacturing processes and effectively controlling production chains, significantly increasing manufacturing efficiency, improving product quality, and reducing costs and resource consumption. However, web-dependent IIoT faces huge challenges in terms of cybersecurity [2]. By the end of 2022, the China National Vulnerability Database (CNVD) had recorded 3141 industrial system vulnerabilities and 1443 IoT end device vulnerabilities. According to the “2019 China Internet Network Security Situation Overview” released by the National Computer Network Emergency Response Technical Team/Coordination Center of China (CNCERT/TT), about 41% of the existing IIoT devices in China have high-risk vulnerabilities in their systems. The most serious problems are exposed in electric power systems and urban rail transportation industries.
In 1988, Endsley [3] proposed situation awareness as acquiring and understanding environmental factors and predicting future states under certain spatial and temporal conditions. Cyberspace situational awareness (CSA) was first proposed by Tim Bass [4] in 1999. Network situation awareness is to determine the current network security states and predict its future state trends by analyzing the environmental factors of the system [5]. The process can be divided into four steps: data collection, situation understanding, situation assessment, and situation prediction. Network security situation assessment (NSSA) is the core of network situation awareness, which can analyze the current network security states in real time [6]. NSSA enables early detection of security risks and threats in the network so that measures can be taken to stop these threats before they occur [7]. The research of NSSA for the IIoT is very important to ensure the stable operation, data confidentiality, and environmental security of the IIoT.
There have been relatively few NSSA studies on IIoT. IIoT systems have different requirements for information confidentiality, system availability, and data security than information systems. The NSSA of traditional information systems does not take into account its particularities, and is therefore not well suited to assessing the network condition of the IIoT. IIoT integrates various networks and devices, and the network environment is complex, so the amount of data collected by IIoT is large and the data distribution is uneven. Large-scale network data cannot be directly used as NSSA, which will affect the efficiency of evaluation [8]. Both undersampling and oversampling can only deal with the data imbalance problem of binary classification, and cannot realize the balanced sampling of multi-class data [9]. Aiming at the above problems, this paper first studies NSSA for the IIoT based on the AHP. Then, the average under-/oversampling method is proposed to deal with the imbalance of different attack data volumes. Finally, the IIoT network security situation assessment classifier is constructed based on the XGBoost to improve the effectiveness of the model. A ToN-IoT dataset was used in the experiment. The dataset is derived from a test bench created for the Industry 4.0 network.
The major contributions of this paper are as follows:
- (1)
- An NSSA method for the IIoT is proposed, which uses binary classification and multi-classification results of attack traffic to quantify the network situation and uses the AHP to obtain influence weights of each attack type for the IIoT.
- (2)
- Using the XGBoost algorithm to build a classification model to judge whether the IIoT has been attacked, and what the type of attack is. An average under-/oversampling method is proposed to solve the problem of attack data imbalance, and the sampling method used for a certain type of attack data is determined by the ratio of its data volume to the average value of the total data volume.
- (3)
- Experiments show that the NSSA method proposed in this paper is more suitable for industrial control systems, and the attack classification model constructed in this paper has high accuracy under the condition of a large amount of data and imbalance of various types of data, laying a foundation for effective network security situation assessment.
The rest of this article is organized as follows. Section 2 gives an overview of some related work. Section 3 describes the theory related to the construction of an IIoT network situational assessor. Section 4 details the quantification and evaluation methods of NSSA for the IIoT. The experimental results are presented in Section 5. Finally, Section 6 summarizes this paper and discusses future work.
2. Related Works
Today, a number of prominent studies on network security situational assessment techniques for traditional security areas have been performed, and the assessment methods are relatively mature, but the research on situational assessment for the IIoT is still in the development stage.
Liu et al. [10] studied the characteristics of wireless networks and proposed an NSSA method based on BIPMU to improve the performance and accuracy of NSSA. Zhao et al. [11] analyzed NSSA in the big data environment, selected multi-source data in the big data environment, proposed a parallel reduction algorithm based on an attribute importance matrix to reduce the number of attributes of data sources, and used the particle swarm optimization algorithm to calculate the situation value of a wavelet neural network. Nikoloudakis et al. [12] proposed a situation awareness framework based on machine learning to handle heterogeneous attack data. This framework used the real-time awareness function provided by the SDN paradigm to detect network entities and evaluate known vulnerabilities. Experiments showed that this framework improved the accuracy of threat detection. Zhang et al. [13] used a combination of long- and short-term memory networks and decision tree algorithms to assess the time series problem of security posture. The method improved the accuracy of the algorithm, but without taking into account the existence of data category imbalance, meaning that the experimental results were not well optimized. Chen et al. [14] used SVM and gravitational search algorithms to design an NSSA method with better global optimization function. Han et al. [15] designed a quantitative NSSA method for wirelessly connected intelligent robot clusters using convolutional neural networks.
Khaleghi et al. [16] built a three-layer SMM by embedding context-dynamic quantitative security measures (QSM) into the security measurement model (SMM). The model considered the network’s deterrence against threats, resilience against attacks, and ability to withstand shocks, and accurately measured the security effectiveness of the entire network and its context components. Cai et al. [17] established a three-layer distribution Internet of Things (PDIoT) security evaluation index system and used the entropy weight method and cloud model theory to evaluate the security risks of PDIoT. Venkataramanan et al. [18] proposed a model for detecting the resistance of microgrids to attacks. The model considered all cyber-physical layers of the microgrid and quantified the state of cyber-physical security using theories such as graph theory analysis, availability probability models, and attack graph metrics. The model was used experimentally to assess the resilience of the microgrid after an attack. Basumallik et al. [19] studied the state of large-scale power system outages caused by coordinated attacks and evaluated the state of the power grid after attacks by using the semi-Markov method and defined three indicators. Sarkar et al. [20] proposed a power system framework consisting of a computing system, a SCADA system, and other software systems and created a concrete example based on this framework, for use in evaluating the cyber-physical impact of the power system under different cyber attacks. Zhang et al. [21] used a fuzzy reasoning algorithm to mine and identify network attack correlation, and realized the perception and control of network security situation. Li et al. [22] combined the entropy weight method and grey correlation analysis method to put forward the ADN situation assessment index systems and assessment method considering network attack. This method avoided the dependence of traditional assessment on expert experience and took into account the differences in assessment in different scenarios. Umunnakwe et al. [23] proposed a model for ranking the importance of multiple components, which integrated industry vulnerabilities into the network risk assessment of power systems. Experiments showed that the model provided operators with different system protection strategies. Fan et al. [24] used the multi-observation Hidden Markov Model (HMM) based on the attack characteristics to quantify the network state and obtain the security status evaluation value of the software-defined network. Liu et al. [25] used the D-S evidence theory to fuse the measured indicators and obtain the device threat value. Then, AHP was used to calculate the weights of different devices, and finally, the network threat situation value was obtained using a weighted method. Based on fuzzy AHP, Zheng et al. [26] conducted hierarchical modeling of industrial control system equipment and attack behavior, carried out security risk assessment and analysis, calculated system risk value, and deployed more effective defense measures. Shang et al. [27] adopted a method based on the attack tree model to model the industrial control system, calculated the node interval probability by fuzzy reasoning, and obtained the probability of each attack path in the system. Spyridon et al. [28] adopted the method of fuzzy probabilistic Bayesian networks to conduct the dynamic security risk assessment of industrial control systems from the perspective of dynamic characteristics, which is more in line with the application of actual systems. Dong et al. [29] used object-oriented Bayesian networks (OOBN) for structural modeling and designed a prototype of the power information test systems. Experiments showed that this method could be effectively applied to the security risk assessment of the power systems network.
Bhandari et al. [30] proposed feature selection during the data preprocessing stage, combining sequencer search and Chi-square attribute evaluation, and then using Bayesian networks to identify attack types. Yang et al. [31] proposed an NSSA method for network attack behavior classification, aiming at the problems whereby it is difficult to extract features using traditional network security situation assessment methods, and with poor timeliness. Sen et al. [32] proposed a multi-stage network attack detection framework. Introducing the DOMCA correlation method constructs a multi-source intelligence knowledge base for use in reconstructing complex attack activities, improving detection accuracy. Experiments demonstrated that DOMCA could reliably detect multi-stage network attacks. Al Ghazo et al. [33] studied the interdependencies between vulnerabilities, proposed an automatic attack graph generator, and conducted experiments in a SCADA network. The experiments showed that the attack graph generator was able to take into account the vulnerability exploitation conditions and other security properties in detail. Based on the idea of artificial immunity, Wang et al. [34] proposed a dynamic network intrusion detection and prediction model based on a fuzzy fractional ordinary differential equation. Tian et al. [35] proposed a network attack detection method based on URL analysis to address the problem whereby there are increased numbers of attacks on network servers in the case of cloud Internet of Things systems. This method normalizes the URLs of edge devices, integrates multiple concurrent depth models to analyze URLs, and performs web attack detection. Experiments showed that this method was able to effectively improve the accuracy of network attack detection. Tang et al. [36] proposed an optimized cloud model based on the impact function to evaluate DDoS attacks. In this method, a V support vector machine (V-SVM) was established to identify DDoS attacks. Xi et al. [37] proposed a framework for NSSA by analyzing three dimensions: threat, vulnerability, and stability, in which the decision layer incorporated the results of the sub-assessments and quantified impact factors such as threats based on CVSS. The experiments demonstrated the effectiveness of the framework using alert information.
In summary, although existing IIoT network security situation assessment methods have achieved certain results, the following problems are still present:
- NSSA methods based on machine learning usually feature high precision, but existing situation assessment models based on machine learning do not fully consider the industrial characteristics of the IIoT systems, and their assessment results are not applicable to IIoT systems.
- The IIoT network connects a variety of heterogeneous networks with complex structures and a huge amount of data. The modeling of industrial control systems, and then the analysis of the model from different angles to evaluate the network security of the system, required a lot of logical and mathematical operations, resulting in the efficiency of NSSA realization being low, and possessing certain limitations. In addition, system modeling relies on expert experience, and there is a lack of reasonable quantitative standards, meaning that there is a certain subjectivity to the process of evaluation.
- In some studies analyzing network security from threat detection, the researchers did not process the unbalanced sample data in the industrial control dataset, resulting in a small number of samples with low extraction accuracy, thus affecting the overall effect.
Based on the existing research on industrial control system network risk assessment methods, this paper considers the impact of the confrontation between attackers and defenders on industrial control system network security, and further studies risk assessment methods. Considering the unbalanced characteristics of industrial control data samples, this paper proposes a multi-class sampling method.
3. Theoretical Research on NSSA for the IIoT
3.1. Design of the AHP for the IIoT
The IIoT has many features that are different from those of information systems. In information systems, the key assets to be protected include information, such as bank account data, credit card records, customer records, and so on. The security of information systems mainly refers to the confidentiality of data, and sometimes it may be necessary to shut down the network for hours, no matter the cost, in order to protect data security. In contrast, the key asset of the IIoT is the availability of the plant or infrastructure. For example, the plant must run continuously without shutting down the network.
Confidentiality (C), Integrity (I), and Availability (A) are three basic attributes of network security. Availability has the highest priority in the IIoT [38,39]. Considering the differences in cybersecurity characteristics between the IIoT and information systems, Table 1 shows the different rankings of CIA between the IIoT and information systems.

Table 1.
CIA Ranking.
AHP is a subjective evaluation method suitable for analyzing multi-factor and multi-level problems [40]. This paper uses AHP and IIoT security features to determine the CIA weight coefficients of various attack impact values. The operation steps of this method can be divided into four aspects, as follows:
- Establishment of hierarchical structure model: The purpose of decision making, and decisive factors are analyzed, and a hierarchical structure diagram is constructed according to the relationship between them.
- Construction of a judgment matrix: The decision factors are compared in pairs to determine the value of the relatively important factors among them, which is generally determined using the nine-point method.
- Hierarchical sorting: The weight of each decision factor is solved by the sum-product method using the judgment matrix.
- Each column of the judgment matrix B is normalized;
- The values of each column of the normalized judgment matrix are added to obtain a one-dimensional vector;
- The one-dimensional vector is normalized to obtain the approximate solution W of the desired feature vector. The maximum characteristic root λmax of the judgment matrix is calculated according to (1), where n is the dimension of the judgment matrix, and wi is the weight of the ith decision factor.
- 4.
- Consistency check: The CR value is calculated to determine whether the values of paired decision factors in the judgment matrix have been correctly defined.
- The calculation of CI is shown in (2);
- The random consistency RI values are listed in Table 2;
Table 2. Random consistency, RI.
- CR is calculated as shown in (3). Smaller values of CR indicate better consistency of the judgment matrix. Generally, if the CR value is less than 0.1, the judgment matrix meets the consistency test.
3.2. Average Under-/Oversampling (AUOS)
IIoT systems in different industries are subject to different types of attacks. When studying attack traffic, it is common to encounter unbalanced data distributions. When training models using multiple types of data, if the amount of data in a particular category is too small, the model cannot fully learn the characteristics of that type of data, which leads to a decrease in model accuracy. If the amount of data of a certain type is too large, the model may be over-fitted, and the learning ability of the model will be weakened.
The traditional multiclass data undersampling method reduces the number of other classes based on the class with the smallest amount of data. If the amount of data in a category is extremely small, the total data volume will drop dramatically, which is not conducive to model learning. The traditional multiclass data oversampling method increases the number of other categories according to the category with the largest data volume, resulting in a sharp increase in the total data volume, causing difficulties in model learning, and a decrease in the operation rate. To solve this problem, an average under-/oversampling method is proposed in this paper to balance the data. The steps of the method are as follows:
- Calculate the threshold value.
- Suppose that the size of the dataset S is m, there are j types, and the data size of each class is xj;
- Calculate the average data volume average of the dataset according to (4).
- 2.
- Perform data sampling.
- The data of type are extracted from S and denoted as Si, and the remaining dataset is S1−i;
- The train–test–split method is used in Python to divide the dataset S1−i and extract the average size of the dataset, denoted as ;
- All types of data in are converted into the same label, and the label is not i;
- and Si are combined into . The sampling method of the dataset is judged according to step 3, and the data of type i in the sampled are extracted and recorded as Sdeal.
- 3.
- Judge the sampling methods with the threshold: If wi > 2, undersampling is used for this type. if wi < 0.5, oversampling is used for this type. If wi = average, no processing is performed for this type of data;
- The coefficient factor wi of each class is calculated according to (5);
- The random undersampling method is used for undersampling;
- The SMOTE (Synthetic Minority Oversampling Technique) method is used for oversampling
- 4.
- Merge the datasets: The unprocessed categories of data in S keep their original labels and quantities, and the label of Sdeal is restored to i. The unprocessed data in S and Sdeal are combined as the training set Strain.
The AUOS algorithm is shown in Algorithm 1.
| Algorithm 1: AUOS algorithm pseudo code |
| Input: original train dataset S |
| Output: resampled dataset Strain |
| 1 m, j, ← S; |
| 2 average = m/j; |
| 3 for (i = 1; i ≤ j; i++) do |
| 4=/average |
| 5 if ≠1 then |
| 6 , S1−i ← S; //The data of type i is extracted from S. |
| 7 ← ; //S1−i size is average extracted from S1−i using the |
| 8 //train-test-split method. |
| 9 ← ; |
| 10 ← + ; |
| 11 if wi > 2 then |
| 12 Sdeal ← ; |
| 13 end if |
| 14 if wi < 0.5 then |
| 15 Sdeal ← ; |
| 16 end if |
| 17 end if |
| 18 if = 1 then |
| 19 ← ; |
| 20 end if |
| 21 Strain← Si, Sdeal; |
| 22 end for |
| 23 return Strain |
3.3. Construction of NSSA Classifier for the IIoT
The IIoT combines the emerging technologies related to the IoT with ICS, and while it greatly improves the efficiency and automation of production, it also increases its potential to be attacked. Given the characteristics of high-dimensional attack data and large sample size, in this paper, the XGBoost strong classifier is designed to improve the accuracy of NSSA.
XGBoost is characterized by high accuracy, strong flexibility, and prevention of overfitting. It is often used in data mining [41]. XGBoost belongs to the ensemble learning boosting algorithms, and is composed of multiple Gradient Boosting Decision trees (GBDT).
The algorithm structure of XGBoost is shown in Figure 1. XGBoost is a boosted tree model. The idea of the XGBoost algorithm is to keep adding trees and to keep splitting features to grow a tree. Each time a tree is added, a new function is learned to fit the residuals of the last prediction. The parameters of the nodes of the already-trained tree remain unchanged, and a new tree is added. The features of a sample fall to a corresponding leaf node in each tree, each leaf node corresponds to a score, and finally, the scores corresponding to each tree are added to the predicted value of the sample.
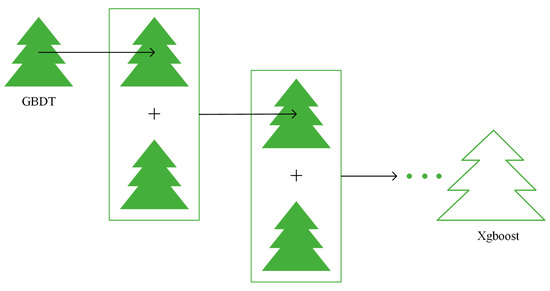
Figure 1.
Algorithm structure of XGBoost.
Assume that the collected data sample is . There are n samples, each of which has m-dimension characteristics, and the predicted value of a single sample is:
where is the fraction of sample xi in a leaf node represents the leaf node of sample after judgment, and represents the leaf node values of kth regression tree in a single sample .
XGBoost adopts a greedy algorithm to perform optimization tree by tree. Supposing the current regression tree has T base learners in total, then the objective function of the XGBoost will be:
The first half of (8) represents the error between the predicted values and the true values, and the second half is the increased regularization term, as specified in (9).
γ is the penalty parameter for controlling the depth of the tree, and λ controls the leaf node score to prevent overfitting. The optimization objective of a single tree is as follows:
Bring Formulas (6) and (7) into Formula (8) to expand:
The loss function is obtained by Taylor second-order expansion:
where is the first step gradient and is the second step gradient, both of which are constants. The optimization objective at this time is:
Calculating the quadratic Equation (15) yields:
The objective function of XGBoost can be divided into two parts. The first half is the error between the predicted and true values, and the second half is the regularization term, which controls the complexity of the model. By transforming the objective function, a quadratic function about the fraction of a leaf node can be obtained, and the optimal w and the objective function value can be solved.
When XGBoost is used to implement classification, the selection of the decision tree number, maximum tree depth, and learning rate has an important influence on the classification effect.
- The number of decision trees refers to the maximum number of iterations. The larger the value, the stronger the learning ability of the model and the easier it is to overfit;
- The maximum tree depth is used to control model overfitting;
- The learning rate determines the step size when iterating the decision tree and controls the iteration rate. The slower the rate, the more likely the model is to find the best value more accurately.
4. Proposed NSSA Model for the IIoT
4.1. NSSA Framework
The NSSA model designed for the IIoT in this paper is shown in Figure 2. The model can be divided into three parts.
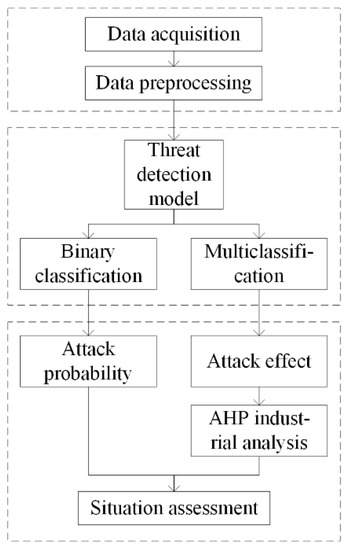
Figure 2.
NSSA model for the IIoT.
- Situation acquisition.
Traffic acquisition modules are deployed in the control layer, information management layer, and Internet edge of the IIoT, respectively, to collect normal and attack events. The collected traffic is processed by removing redundancy, simplifying features, filling defaults, converting data formats, and so on.
- 2.
- Situation understanding.
The threat detection model is used to train the dataset. Binary classification is used to determine whether each piece of data constitutes external attack traffic in order to determine attack probability, and multiple classification is used to determine the attack type in order to determine attack influence. The combination of the two is used to calculate the network security situation value.
- 3.
- Situation quantitative assessment.
The AHP is used, in combination with the characteristics of the IIoT, to determine the influence weight coefficients of various attacks. The classification results of the detection model are combined in order to quantify the cybersecurity situation of the IIoT. Network security situation assessment is performed by dividing the network risk level.
4.2. Network Situation Quantification
In this paper, the network security situation of the IIoT is studied, and the threat severity and influence of network attacks arising from attack traffic are determined.
- Severity of threat:
The threat severity is determined by the attack probability within a time, as shown in (17). If the data in clause i is normal traffic, is marked with 0; otherwise, it is marked with 1; M represents the total network traffic within a time.
- 2.
- Threat influence.
Due to the differences in structural characteristics and security requirements between IIoT and information systems, quantitative assessments of threat influence used in information systems networks cannot be fully applied to IIoT networks. Therefore, the formula for calculating the IIoT network threat influence in this paper is as follows:
where C, I and A represent the CIA scores of specific attack types, and x, y and z are determined by the AHP analysis of the IIoT characteristics. Since the scores of C, I, and A are all reduced after multiplying by their weights, in order to control the security situation value to within the interval [0, 1], is expanded ε times. ε is the reciprocal value of the maximum value of cumulative CIA score.
This paper focuses on the security of the IIoT network environment represented by ToN-IoT dataset. Different types of attack have different impacts on the system. The ToN-IoT dataset contains nine types of attack traffic. Table 3, below, presents an overview of the nine types of attack and determines the CIA rating of each attack based on its characteristics. The specific levels and scoring settings are shown in Table 3 [42], where h represents high impact, l represents low impact, and n represents no impact.
Table 3.
Attack characteristics.
- 3.
- Network security situation value.
The IIoT network security situation value calculation is shown in (19) [43].
where m indicates the normal traffic within this period, n indicates the attack type within this period, indicates the influence score of a specific attack type, and indicates the duration of a specific attack.
4.3. Network Situation Severity Levels
The security risks faced by IIoT networks are divided into five levels, as shown in Table 4. When the quantitative security situation value is 0, the network has no attack traffic and is in a secure condition. The higher the situation value, the worse the network security condition.
Table 4.
Network security situation evaluation level.
5. Experiment and Result Analysis
5.1. Simulation Environment
Most of the research on NSSA has focused on datasets such as NSL-KDD, CICIDS2017, KDDCup-99, and UNSW_NB15. These datasets are huge and redundant and do not come from industrial control system networks.
The ToN_IoT dataset was collected from a large-scale network of Industry 4.0 testbeds designed by Cyber Range and IoT LABS in collaboration with others. The Industry 4.0 testbed is deployed using multiple virtual machines and hosts with the Windows, Linux, and Kali operating systems to simulate the interconnect between the Internet of Things, the cloud, and Edge/Fog three-tier systems. The data in ToN_IoT are collected from network traffic, the Windows audit trail, the Linux audit trail, and telemetry data from IoT services, and can be used to test AI for a variety of cybersecurity applications, such as in intrusion detection systems, threat intelligence, and threat search. In this experiment, ToN_IoT’s Train_Test_Network traffic packet is used, which has a file size of 66.6 MB and contains 400,000 pieces of data, including nine types of common industrial network attack traffic and normal traffic.
PyCharm Community Edition 2021 is used to simulate the experiment. The hardware environment consisted of a 3 GHz CPU and 16 GB memory, and the operating system was Windows 10.
5.2. Data Preprocessing
- Feature numeralization and default processing.
In the Train_Test_Network packet, some of the classification features are in the form of characters, and there are a large number of default values in the data. In the experiment, the LabelEncoder package of scikit-learn is used to quickly convert each feature into 0, 1, 2, …, and the default value is set to 0.
- 2.
- Data sampling and partitioning.
The Train_Test_Network packet contains more than 400,000 pieces of traffic, which is a huge amount of data. To speed up model training, in this experiment, the data are simplified to 165,976 pieces through stratified sampling according to attack categories. The raw data distribution is shown in Figure 3.
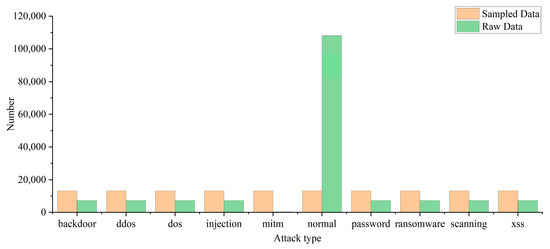
Figure 3.
Distribution of the dataset.
In a binary classification, the ratio of normal traffic to attack traffic is about 2:1. The difference between the two does not cause huge errors in model classification. In multiple classification, by observing the original data distribution in Figure 3, it can be found that the amount of mitm attack traffic data is too small and the amount of normal traffic data is too large. Therefore, the average undersampling method proposed in this paper is adopted to balance the various kinds of data, and the data distribution after processing is shown in Figure 3.
In this experiment, the Python package train_test_split is used to divide the dataset into the training set and the test set according to a ratio of 0.2. The training set contains 132,780 pieces of data, and the test set contains 33,196 pieces of data.
- 3.
- Feature normalization.
To avoid there being a large gap between the maximum value and the minimum value of some classification features, which would affect the classification effect of the model, Equation (20) is used in the experiment to normalize each feature data and summarize it within the interval [0, 1].
where , are the maximum and minimum values of this feature, respectively.
5.3. Binary Classification
Binary classification can be used to determine whether the traffic is attack traffic. In this experiment, four indexes, including recall rate, precision rate, F1, and training duration T, are used to judge the efficiency of a binary classification model. The higher the value of recall rate, precision rate, and F1, the better the training effect of the model; and the shorter the training duration, the higher the efficiency of the model.
The recall rate refers to the probability of all samples being correctly predicted from among the actual positive samples, calculated as shown in (21).
The precision rate refers to the probability of all samples predicted to be positive being positive, calculated as shown in (22).
The recall rate and precision rate are inversely proportional to each other. To synthesize the performance of the two, a balance point should be found between them. F1 can be used to evaluate the performance of them both together. It can be calculated as shown in (23).
TP (True Positive): indicates the amount of normal traffic that was judged to be normal traffic.
FN (False Negative): indicates the amount of normal traffic that was judged to be attack traffic.
TN (True Negative): indicates the amount of actual attack traffic that was judged to be attack traffic.
FP (False Positive): indicates the amount of attack traffic that was judged to be normal traffic.
In this paper, the effectiveness of four classification algorithms—Support Vector Machine (SVM), K-Nearest Neighbour (KNN), Random Forest (RF) and XGBoost—is compared using the ToN_IoT dataset. For each model, we empirically selected the parameters that had the greatest impact on its classification effectiveness for tuning, using a mesh search combined with cross-validation to determine the optimal parameters for each model. The optimal parameter settings for each model are shown in Table 5. The binary classification results for the four models are shown in Table 6.
Table 5.
Optimal parameters for each model.
Table 6.
Results of model binary classification.
From Table 6, it can be seen that SVM has the worst binary classification effect. SVM involves the calculation of a matrix of the order M (where m is the number of samples) when solving for the support vector. As this experiment adopts big data training, SVM classification consumes a large amount of memory space, the training time is too long, and the training accuracy is poor. The shortest time required for big data classification can be seen for KNN, while XGBoost achieves the best classification effect. Compared with RF, which is also composed of decision trees, the time required is also relatively short.
5.4. Multiple Classification
The model can use multiple classification to determine the specific attack type of attack traffic. In this experiment, the recall rate, precision rate, and F1 of each attack type are used to judge the multi-classification efficiency of each model. The multi-classification effects of the four models are shown in Figure 4, Figure 5 and Figure 6. The confusion matrix generated by using XGBoost combined with the average under-/oversampling method designed in this paper for processing multiple classifications is shown in Figure 7.
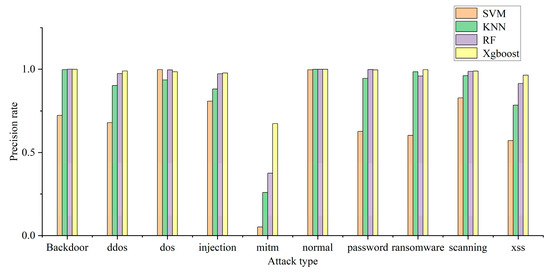
Figure 4.
Model precision rate of multiple classification.
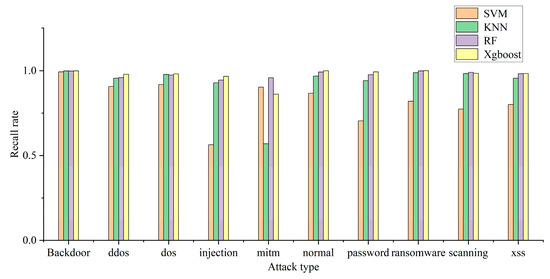
Figure 5.
Model recall rate of multiple categories.
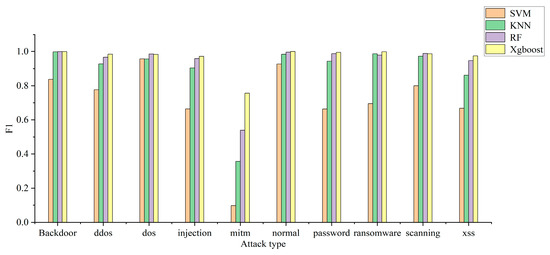
Figure 6.
Model F1 of multiple classification.
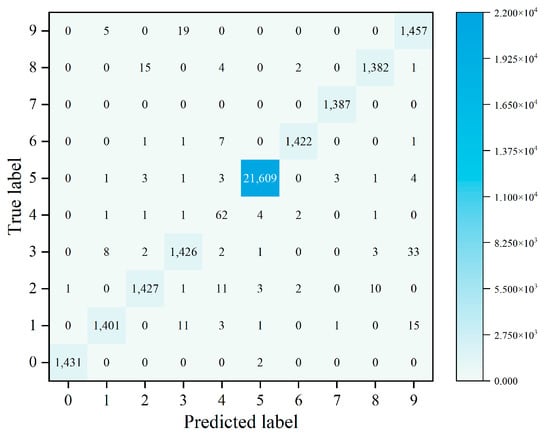
Figure 7.
Confusion matrix of the XGBoost + AUOS.
Figure 4, Figure 5 and Figure 6 describe the precision rates, recall rates, and F1 scores for each of the four models. As can be seen from the figures, the SVM model has a low detection precision for small data, where the precision for mitm-type attacks is only 5.2%, and the F1 score is 9.7%. Due to the lack of available training data, SVM models are not sensitive to such attacks. Compared with the other three classification models, the XGBoost model built in this paper demonstrates improved detection precision for mitm-type attacks, reaching 67%. In addition, when detecting normal traffic, it achieves high scores of 99% for precision, recall and F1. Compared with the SVM, KNN and RF models, the proposed model improves the F-score by 26%, 8% and 3%, respectively.
The experimental results show that the proposed model is superior to the other models in terms of precision rate, recall rate and F1 score, and the detection precision of small-data attack categories is improved without decreasing the detection performance for most attack categories.
After performing sampling using the AUOS method proposed in this paper, the data volume for nine types of attack attains a balance. This is because a large number of samples in the dataset used in this paper have a portion of their features missing, and the sparse perception algorithm adopted by XGBoost is able to automatically learn the splitting direction of the sample. XGBoost adds a regular term to the objective function and performs second-order Taylor expansion to improve the classification effect of the model.
5.5. NSSA Results
- Quantification of NSSA for the IIoT
The judgment matrix is determined by combining Table 1 and the nine-point scale method of the AHP. The weight value of CIA is generated using the sum-product method. The results are shown in Table 7.
Table 7.
CIA weighting factors.
In this experiment, the data in the training and testing package are reduced to 300,000 pieces and divided into 60 groups, on average. The data distribution of some of the groups is shown in Figure 8. In combination with the CIA weighting generated in Table 7, Formulas (17)–(19) are used to calculate the situation value of each group. The security situation curves are shown for each stage of the IIoT, as well as for information systems, in Figure 9.
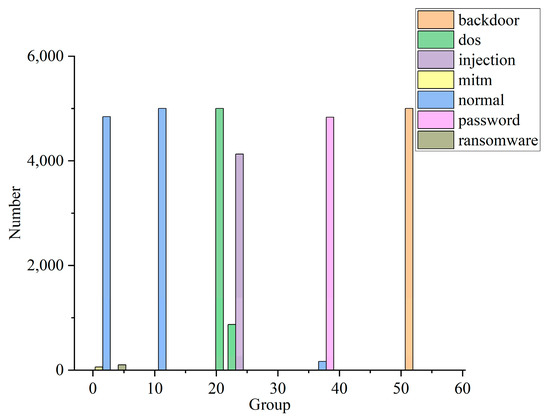
Figure 8.
Partial data distribution.
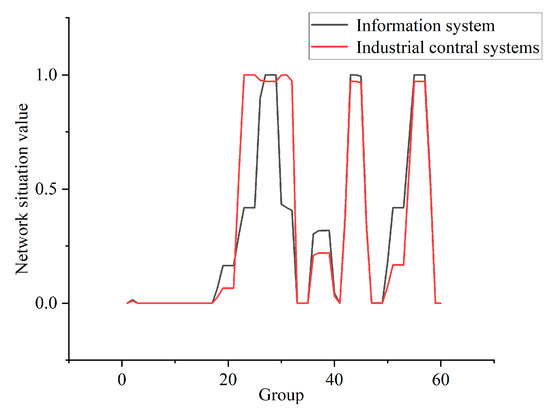
Figure 9.
Network security situation curve.
From the analysis presented in Figure 8 and Figure 9, it can be seen that most of the data in the first group represent normal traffic, with only a small number of mitm and ransomware attacks, and the security risk of this group is very low. All of the data of the 10th group represent normal traffic, and so its security status is good. The traffic in group 23 all represents dos attacks, so the security risk faced by IIoT is much higher than in the case of information systems. In group 25, most of the traffic represents injection attacks, while a small amount represents dos attacks. In this case, information systems face a higher level of risk. The traffic in group 36 mainly comprises password attacks, but a small portion is normal traffic. Password attacks do not affect the availability of the attacked host, but the information integrity and confidentiality of the host are affected. Therefore, the security risk of the system is lower at this time, and the level of risk faced by the IIoT is lower than in the case of information systems. The traffic in group 55 consists entirely of backdoor attacks. The successful use of backdoor attacks can seriously affect the integrity and confidentiality of the host’s information, and can also impact the availability of the host. At this point, the system faces a high level of risk, and the level of risk faced by information systems is higher than that faced by the IIoT.
From the above analysis, it can be seen that the method of NSSA for the IIoT based on AHP proposed in this study has good application value. Compared with the quantitative evaluation method for the traditional network situation, this method considers the network characteristics of the IIoT and can more fully describe the network security situation of the IIoT.
- 2.
- Quantification of NSSA for each classification model
In this experiment, the test set data are divided into 43 groups. The IIoT network situation curve drawn using the classification results of different models is shown in Figure 10. Each dataset in the test set uniformly contains a very small number of different attacks. In this case, the network security status value is very low, and the risk to the network is very low. Compared with each curve, the NSSA results obtained using the XGBoost model designed in this paper are closest to the real values, while the evaluation effect of SVM is the worst.
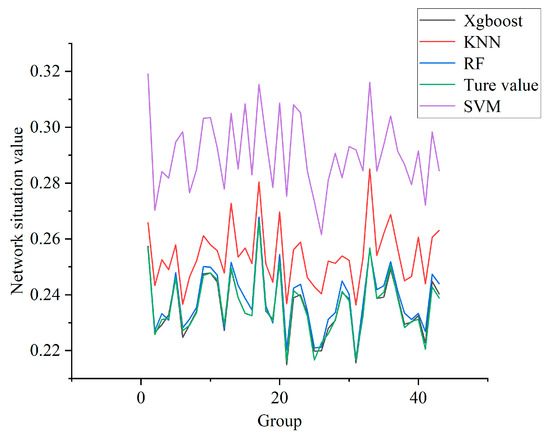
Figure 10.
Network security situation curve of each model for the IIoT.
6. Conclusions
To date, many studies have been performed on NSSA, including attack detection and situation assessment. However, there are relatively few studies on IIoT network posture. On the one hand, the complexity of the IIoT networks makes it difficult to obtain posture elements. On the other hand, IIoT has extensvie requirements in terms of achieving real-time performance. Because IIoT networks connect a variety of heterogeneous networks, there are a lot of logical and mathematical operations required in order to perform network security situation assessment based on knowledge-based reasoning, leading to low efficiency and certain limitations when implementing NSSA. In addition, in some industrial system situation acquisition studies, unbalanced data samples in industrial control datasets are not balanced, leading to there being a small number of samples with low extraction accuracy, thus affecting the overall effect. This paper undertakes further research on existing risk assessment methods for industrial control systems.
First of all, in this paper, the characteristics of the IIoT were analyzed, the AHP method was used to analyze the impact factors of the IIoT systems with respect to network security requirements, and the situation assessment results were quantified. Then, XGBoost was used to build a classification model to judge whether the IIoT has been subject to attack, and to determine the category of the attack. In order to solve the problem of unbalanced attack data, an average under-/oversampling method was proposed. The average data volume is taken as the threshold to determine the sampling method for different categories of data, so that the sample data volume will not have too much influence on the efficiency of the model. The experimental results showed that the NSSA method proposed in this paper is able to improve the accuracy of the IIoT network security situation assessment. Under conditions including unbalanced data categories and large sample sizes, the attack classification model constructed in this paper has high accuracy, thus laying a foundation for effective network security situation assessment.
At present, our analysis of the IIoT features only addresses the security of information assets. Using the NSSA model in this paper, it is possible to better understand the destructive power of cyber attacks on IIoT information assets that threaten their stable operation. In the future, we will study the characteristics of the IIoT more comprehensively, optimize its quantitative security metrics, and integrate various factors in order to determine the overall security of the IIoT networks. In addition, the complete dataset of ToN_IoT is used in this paper, and the data volume is large. Reducing the dimensionality of the data will be considered in the future, and the use of other advanced deep learning algorithms, such as CNN, will be continued for conducting experiments and optimizing the threat detection model.
Author Contributions
Conceptualization, J.Y.; Methodology, J.Y. and L.G.; Software, L.G.; Formal analysis, J.Y. and L.G.; Writing—original draft, L.G. All authors have read and agreed to the published version of the manuscript.
Funding
This research received no external funding.
Data Availability Statement
Files—CloudStor (aarnet.edu.au).
Conflicts of Interest
The authors declare no conflict of interest.
References
- Qiu, J.; Tian, Z.; Du, C.; Zuo, Q.; Su, S.; Fang, B. A Survey on Access Control in the Age of Internet of Things. IEEE Internet Things J. 2020, 7, 4682–4696. [Google Scholar] [CrossRef]
- Berger, S.; Buerger, O.; Roeglinger, M. Attacks on the Industrial Internet of Things—Development of a multi-layer Taxonomy. Comput. Secur. 2020, 93, 101790. [Google Scholar] [CrossRef]
- Endsley, M.R. Design and Evaluation for Situation Awareness Enhancement. In Proceedings of the Human Factors and Ergonomics Society Annual Meeting, Chicago, IL, USA, 5–9 October 1988; Sage Publications: Los Angeles, CA, USA, 1988; Volume 32, pp. 101–197. [Google Scholar]
- Bass, T.; Gruber, D. A glimpse into the future of ID. Mag. Usenix Sage 1999, 24, 40–49. [Google Scholar]
- Tadda, G.P.; Salerno, J.S. Overview of Cyber Situation Awareness. In Advances in Information Security; Springer: Boston, MA, USA, 2009; pp. 15–35. [Google Scholar] [CrossRef]
- Leau, Y.-B.; Manickam, S.; Chong, Y.-W. Network Security Situation Assessment: A Review and Discussion. In Lecture Notes in Electrical Engineering; Springer: Berlin/Heidelberg, Germany, 2015; pp. 407–414. [Google Scholar] [CrossRef]
- Cheng, X.R.; Lang, S. Research on Network Security Situation Assessment and Prediction. In Proceedings of the 2012 Fourth International Conference on Computational and Information Sciences, Chongqing, China, 17–19 August 2012; pp. 864–867. [Google Scholar]
- Zhang, J.; Feng, H.; Liu, B.; Zhao, D. Survey of Technology in Network Security Situation Awareness. Sensors 2023, 23, 2608. [Google Scholar] [CrossRef] [PubMed]
- Wei, W.; Chen, Y.; Lin, Q.; Ji, J.; Wong, K.-C.; Li, J. Multi-objective evolving long–short term memory networks with attention for network intrusion detection. Appl. Soft Comput. 2023, 139, 110216. [Google Scholar] [CrossRef]
- Liu, Z.; Yang, C.; Liu, Y.; Ding, Y. A BIPMU-based network security situation assessment method for wireless network. Comput. Stand. Interfaces 2023, 83, 103661. [Google Scholar] [CrossRef]
- Zhao, D.; Liu, J. Study on network security situation awareness based on particle swarm optimization algorithm. Comput. Ind. Eng. 2018, 125, 764–775. [Google Scholar] [CrossRef]
- Nikoloudakis, Y.; Kefaloukos, I.; Klados, S.; Panagiotakis, S.; Pallis, E.; Skianis, C.; Markakis, E.K. Towards a Machine Learning Based Situational Awareness Framework for Cybersecurity: An SDN Implementation. Sensors 2021, 21, 4939. [Google Scholar] [CrossRef]
- Zhang, H.; Kang, C.; Xiao, Y. Research on Network Security Situation Awareness Based on the LSTM-DT Model. Sensors 2021, 21, 4788. [Google Scholar] [CrossRef]
- Chen, Y.; Yin, X.; Sun, A.; Destech, P.I. Network Security Situation Assessment Model Based on GSA-SVM. In Proceedings of the 2018 International Conference on Computer, Communication and Network Technology (CCNT), Bengaluru, India, 10–12 July 2018; Book Network Security Situation Assessment Model Based on GSA-SVM, Series Network Security Situation Assessment Model Based on GSA-SVM 291. pp. 414–420. [Google Scholar]
- Han, W.; Tian, Z.; Huang, Z.; Huang, D.; Jia, Y. Quantitative Assessment of Wireless Connected Intelligent Robot Swarms Network Security Situation. IEEE Access 2019, 7, 134293–134300. [Google Scholar] [CrossRef]
- Khaleghi, M.; Aref, M.R.; Rasti, M. Context-Aware Ontology-based Security Measurement Model. J. Inf. Secur. Appl. 2022, 67, 103199. [Google Scholar] [CrossRef]
- Cai, S.; Wei, W.; Chen, D.; Ju, J.; Zhang, Y.; Liu, W.; Zheng, Z. Security Risk Intelligent Assessment of Power Distribution Internet of Things via Entropy-Weight Method and Cloud Model. Sensors 2022, 22, 4663. [Google Scholar] [CrossRef] [PubMed]
- Venkataramanan, V.; Hahn, A.; Srivastava, A. CP-SAM: Cyber-Physical Security Assessment Metric for Monitoring Microgrid Resiliency. IEEE Trans. Smart Grid 2020, 11, 1055–1065. [Google Scholar] [CrossRef]
- Basumallik, S.; Eftekharnejad, S.; Johnson, B.K. The impact of false data injection attacks against remedial action schemes. Int. J. Electr. Power Energy Syst. 2020, 123, 106225. [Google Scholar] [CrossRef]
- Sarkar, S.; Teo, Y.M.; Chang, E.-C. A cybersecurity assessment framework for virtual operational technology in power system automation. Simul. Model. Pract. Theory 2022, 117, 102453. [Google Scholar] [CrossRef]
- Zhang, R.; Hu, Z. Access control method of network security authentication information based on fuzzy reasoning algorithm. Measurement 2021, 185, 110103. [Google Scholar] [CrossRef]
- Li, J.; Liang, J.; Liu, Q.; Qi, D.; Zhang, J.; Chen, Y. Research on situation assessment of active distribution networks considering cyberattacks. Front. Energy Res. 2022, 10, 971725. [Google Scholar] [CrossRef]
- Umunnakwe, A.; Sahu, K. Davis, and IEEE, Multi-Component Risk Assessment Using Cyber-Physical Betweenness Centrality. In Proceedings of the 2021 IEEE Madrid PowerTech, Madrid, Spain, 28 June–2 July 2021. Book Multi-Component Risk Assessment Using Cyber-Physical Betweenness Centrality, Series Multi-Component Risk Assessment Using Cyber-Physical Betweenness Centrality. [Google Scholar]
- Fan, Z.; Xiao, Y.; Nayak, A.; Tan, C. An improved network security situation assessment approach in software defined networks. Peer-to-Peer Netw. Appl. 2019, 12, 295–309. [Google Scholar] [CrossRef]
- Liu, Z.H.; Zhang, B.; Zhu, N.; Li, L.X. Hierarchical network threat situation assessment method for DDoS based on D-S evidence theory. In Proceedings of the 2017 IEEE International Conference on Intelligence and Security Informatics (ISI), Beijing, China, 22–24 July 2017; pp. 49–53. [Google Scholar]
- Zheng, Y.; Zheng, S. Cyber Security Risk Assessment for Industrial Automation Platform, Book Cyber Security Risk Assessment for Industrial Automation Platform. In Proceedings of the 2015 International Conference on Intelligent Information Hiding and Multimedia Signal Processing (IIH-MSP), Adelaide, SA, Australia, 23–25 September 2015; Series Cyber Security Risk Assessment for Industrial Automation Platform. pp. 341–344. [Google Scholar]
- Shang, W.; Gong, T.; Chen, C.; Hou, J.; Zeng, P. Information Security Risk Assessment Method for Ship Control System Based on Fuzzy Sets and Attack Trees. Secur. Commun. Netw. 2019, 2019, 3574675. [Google Scholar] [CrossRef]
- Spyridon, V.G.; Stefanos, N.M. A Systematic Power-Quality Assessment and Harmonic Filter Design Methodology for Variable-Frequency Drive Application in Marine Vessels. IEEE Trans. Ind. Appl. 2015, 51, 1909–1919. [Google Scholar]
- Dong, Y.; Sun, B.; Wang, G. Research on modeling method of power system network security risk assessment based on object-oriented Bayesian network. Energy Rep. 2021, 7, 289–295. [Google Scholar] [CrossRef]
- Bhandari, P. Novel technique of extraction of principal situational factors for NSSA. Int. J. Eng. Sci. 2014, 1, 48–56. [Google Scholar]
- Yang, H.; Zhang, Z.; Xie, L.; Zhang, L. Network security situation assessment with network attack behavior classification. Int. J. Intell. Syst. 2022, 37, 6909–6927. [Google Scholar] [CrossRef]
- Sen, O.; van der Velde, D.; Wehrmeister, K.A.; Hacker, I.; Henze, M.; Andres, M. On using contextual correlation to detect multi-stage cyber attacks in smart grids. Sustain. Energy Grids Netw. 2022, 32, 100821. [Google Scholar] [CrossRef]
- Al Ghazo, A.T.; Ibrahim, M.; Ren, H.; Kumar, R. A2G2V: Automatic Attack Graph Generation and Visualization and Its Applications to Computer and SCADA Networks. IEEE Trans. Syst. Man Cybern. Syst. 2020, 50, 3488–3498. [Google Scholar] [CrossRef]
- Wang, Z.; Chen, L.; Song, S.; Cong, P.X.; Ruan, Q. Automatic cyber security risk assessment based on fuzzy fractional ordinary differential equations. Alex. Eng. J. 2020, 59, 2725–2731. [Google Scholar] [CrossRef]
- Tian, Z.; Luo, C.; Qiu, J.; Du, X.; Guizani, M. A Distributed Deep Learning System for Web Attack Detection on Edge Devices. IEEE Trans. Ind. Inform. 2020, 16, 1963–1971. [Google Scholar] [CrossRef]
- Tang, X.; Zheng, Q.; Cheng, J.; Sheng, V.S.; Cao, R.; Chen, M. A DDoS Attack Situation Assessment Method via Optimized Cloud Model Based on Influence Function. Comput. Mater. Contin. 2019, 60, 1263–1281. [Google Scholar] [CrossRef]
- Xi, R.R.; Yun, X.C.; Hao, Z.Y. A Framework for Risk Assessment in Cyber Situational Awareness. IET Inf. Secur. 2019, 13, 149–156. [Google Scholar]
- Dsouza, J.; Elezabeth, L.; Mishra, V.P.; Jain, R. Security in Cyber-Physical Systems. In Proceedings of the 2019 Amity International Conference on Artificial Intelligence (AICAI), Dubai, United Arab Emirates, 4–6 February 2019; pp. 840–844. [Google Scholar]
- Swessi, D.; Idoudi, H. A Survey on Internet-of-Things Security: Threats and Emerging Countermeasures. Wirel. Pers. Commun. 2022, 124, 1557–1592. [Google Scholar] [CrossRef]
- Wang, H.; Chen, Z.; Feng, X.; Di, X.; Liu, D.; Zhao, J.; Sui, X. Research on Network Security Situation Assessment and Quantification Method Based on Analytic Hierarchy Process. Wirel. Pers. Commun. 2018, 102, 1401–1420. [Google Scholar] [CrossRef]
- Yang, C.-T.; Chan, Y.-W.; Liu, J.-C.; Kristiani, E.; Lai, C.-H. Cyberattacks detection and analysis in a network log system using XGBoost with ELK stack. Soft Comput. 2022, 26, 5143–5157. [Google Scholar] [CrossRef]
- Peter, M.; Karen, K.; Sasha, R. Common Vulnerability Scoring System. IEEE Secur. Priv. 2006, 4, 85–89. [Google Scholar]
- Yang, H.; Zeng, R.; Xu, G.; Zhang, L. A network security situation assessment method based on adversarial deep learning. Appl. Soft Comput. 2021, 102, 107096. [Google Scholar] [CrossRef]


Disclaimer/Publisher’s Note: The statements, opinions and data contained in all publications are solely those of the individual author(s) and contributor(s) and not of MDPI and/or the editor(s). MDPI and/or the editor(s) disclaim responsibility for any injury to people or property resulting from any ideas, methods, instructions or products referred to in the content. |
© 2023 by the authors. Licensee MDPI, Basel, Switzerland. This article is an open access article distributed under the terms and conditions of the Creative Commons Attribution (CC BY) license (https://creativecommons.org/licenses/by/4.0/).