Article

Evolutionary Competition Multitasking Optimization with Online Resource Allocation for Endmemeber Extraction of Hyperspectral Images

1
School of International Engineering College, Xi’an University of Technolgy, Xi’an 710048, China
2
School of Electrical Engineering, Xi’an University of Technology, Xi’an 710048, China
3
State Grid Shaanxi Power Company Xi’an Power Supply Bureau, Xi’an 710032, China
4
Academy of Advanced Interdisciplinary Research, Xidian University, Xi’an 710071, China
5
Xi’an Key Laboratory of Human–Machine Integration and Control Technology for Intelligent Rehabilitation, Xijing University, Xi’an 710123, China
*
Authors to whom correspondence should be addressed.
Electronics 2024, 13(8), 1424; https://doi.org/10.3390/electronics13081424
Submission received: 28 February 2024 / Revised: 31 March 2024 / Accepted: 3 April 2024 / Published: 10 April 2024

Abstract

:
Hyperspectral remote sensing images typically have mixed rather than pure pixels. Endmember extraction aims to find a group of endmembers to represent the original image. In fact, the amount of endmembers is not easily determined in the existing endmember extraction studies.It requires several separate and laborious runs in order to produce results for endmember extraction with varying numbers of endmembers. There is also a correlation between the individual runs, which should be taken into account to accelerate algorithm convergence and improve accuracy. In this paper, an evolutionary competition multitasking optimization method (CMTEE) is proposed to achieve endmember extraction. In the proposed method, endmember extraction problems with different numbers of endmembers are considered as a group of optimization tasks. Specially, these tasks are assumed to be competitive. Then, online resource allocation is employed to assign suitable computational resources to the considered tasks. Experiments on simulated and real hyperspectral datasets demonstrated the effectiveness of the proposed evolutionary competition multitasking optimization method for endmember extraction.

1. Introduction

Exploiting a collection of images acquired over hundreds of contiguous spectral bands, hyperspectral remote sensing aims to enhance the recognition of various land cover classes [1,2,3]. The abundance of spectrum data obtained by hyperspectral imaging devices have sparked broad interest, due to their numerous applications in a variety of fields, including military surveillance, environmental monitoring, and mineral extraction [4,5]. One of the main issues impeding the advancement of remote sensing technology is mixed pixel decomposition, which can be resolved with the spectral unmixing technique [6,7,8,9]. Mixed rather than pure pixels are common in hyperspectral remote sensing photographs. A mixed pixel contains multiple different kinds of material. Consequently, the measured spectrum of a single pixel contains a mixture of many ground cover spectra, referred to as endmembers.
Among the crucial steps in spectral unmixing is endmember extraction. Endmember extraction has grown in significance in hyperspectral image processing as a result of the greatly enhanced spatial and spectral resolution offered by hyperspectral imaging sensors [10,11]. An idealized pure signature for a class is called an endmember. Numerous endmember extraction algorithms have been proposed for analyzing hyperspectral images, such as the pixel purity index (PPI) [12,13,14], N-FINDR [15,16], vertex component analysis (VCA) [17], convex cones analysis (CCA) [18], the simplex growing algorithm (SGA) [19], and others. These algorithms are based on a linear spectral mixture model (LSMM) and assume the existence of pure pixels. These algorithms fall into two classes: sequential endmember extraction methods like VCA and SGA, and simultaneous endmember extraction algorithms like PPI, N-FINDR, and CCA. One of the most well-known and frequently applied endmember extraction techniques is the pixel purity index (PPI) [12]. This process involves repeatedly projecting data onto random unit vectors in order to determine the purity of each pixel. The fast iterative PPI method (FIPPI), which was suggested in [13], aims to enhance PPI in multiple ways. These algorithms demand a large degree of human intervention throughout the endmember selection phase. With a specified number of vertices, Winter’s [16] N-FINDR algorithm finds a simplex with the largest volume. A first random pick of pixels is made at the start of the process. The new pixel is recognized as a new endmember if the simplex’s volume increases with it. Based on the idea that endmembers are simplex vertices and that the affine transformation of a simplex is also a simplex, the vertex component analysis (VCA) proposed in [17] is an unsupervised endmember extraction method that projects data onto a direction orthogonal to the subspace spanned by the endmembers already determined.
These techniques produce accurate extraction results, with minimal computing cost. Regretfully, these algorithms have a number of drawbacks. One is that if the real data do not match the simplex structure’s assumptions, the extraction accuracy will be decreased [20,21,22]. Another is that they do not have information on the feedback mechanism, and [23] the number of spectral bands determines the number of endmembers. Moreover, these algorithms produce the first endmember randomly, which is a laborious and inefficient method of initialization until the point when the required set of endmembers has been found [19]. Several evolutionary algorithms, including adaptive differential evolution (ADEE) [21], ant colony optimization (ACO) [23], and discrete particle swarm optimization (DPSO) [20], have been presented as innovative algorithms to handle these challenges. In order to increase the accuracy of the extracted endmembers and lessen the impact of data errors on endmember extraction outcomes, DPSO, as proposed in [20], uses PSO in discrete space by defining the position and velocity of particles. For endmember extraction, two ant colony optimization algorithms have been established, as suggested in [23]. In order to assess the objective function’s practical importance, the method converts the endmember extraction problem of the decomposition of mixed pixels into an optimization problem and constructs a workable solution space. Zhong [21] recently presented an adaptive differential evolution (ADEE) for endmember extraction. The DE operators use differential evolution (DE) to find the best endmember combination in the viable solution space. The parameter selection issue is then avoided by employing an adaptive technique. Moreover, determining how many endmembers to produce is a challenging task [19]. Many endmember extraction techniques have successfully used virtual dimensionality (VD) [24] and signal subspace estimation (SSE) [25] to estimate the number of endmembers.
In fact, it is difficult to determine the number of endmembers in current endmember extraction research. In general, the results for endmember extraction with different numbers of endmembers are obtained by running a number of distinct, time-consuming runs. Additionally, a correlation exists between the individual runs, which merits consideration in order to expedite algorithm convergence and enhance accuracy. It is obvious that endmember extraction can be solved though evolutionary multitasking optimization. A group of endmember extraction tasks can be established based on the number of endmembers. Evolutionary multitasking optimization was proposed in [26]. This study was fundamental to the research community as it established the fundamental ideas that have directed all of subsequent years’ research.In addition to this significant and groundbreaking contribution, a number of outstanding theoretical works on evolutionary multitasking have been published [27,28], exploring a variety of topics such as the impact of complementarities between function landscapes on search performance [29], or simply outlining the key components that draw interest from the research community in this area of knowledge [30,31,32]. Furthermore, evolutionary multitasking optimization has been applied in the field of remote sensing. Li et al. proposed a a novel evolutionary multitasking cooperative transfer framework for multiobjective hyperspectral sparse unmixing [33]. An evolutionary multitask ensemble learning model was proposed to deal with hyperspectral image classification problems in [34].
Recently, Li et al. proposed a new multitasking optimization paradigm called evolutionary competitive multitasking optimization [35,36]. Its unique features included that the goals of every task were similar, and its optimal solution was the best one among all individual problem optimal solutions. To address endmember extraction, an evolutionary competition multitasking optimization method (CMTEE) is presented in this study. Endmember extraction issues with varying numbers of endmembers are treated as a collection of optimization tasks in the suggested method. In particular, it is considered that these tasks are competitive. Then, to provide appropriate computational resources for the tasks under consideration, online resource allocation is used. Tests conducted on both synthetic and actual hyperspectral datasets showed that the evolutionary competition multitasking optimization technique suggested for endmember extraction worked well.
The organization of this paper is as follows: Section 2 introduces the related background on endmember extraction of hyperspectral images. The background on evolutionary multitasking optimization is described in Section 2. Section 3 describes the framework of competitive multitasking endmember extraction. The experiments on simulated and real datasets are shown in Section 4. The concluding remarks are given in Section 5.

2. Background and Related Works

In this section, background knowledge about endmember extraction of hyperspectral images is introduced. Then, the concepts of evolutionary multitasking optimization and some related works are described.

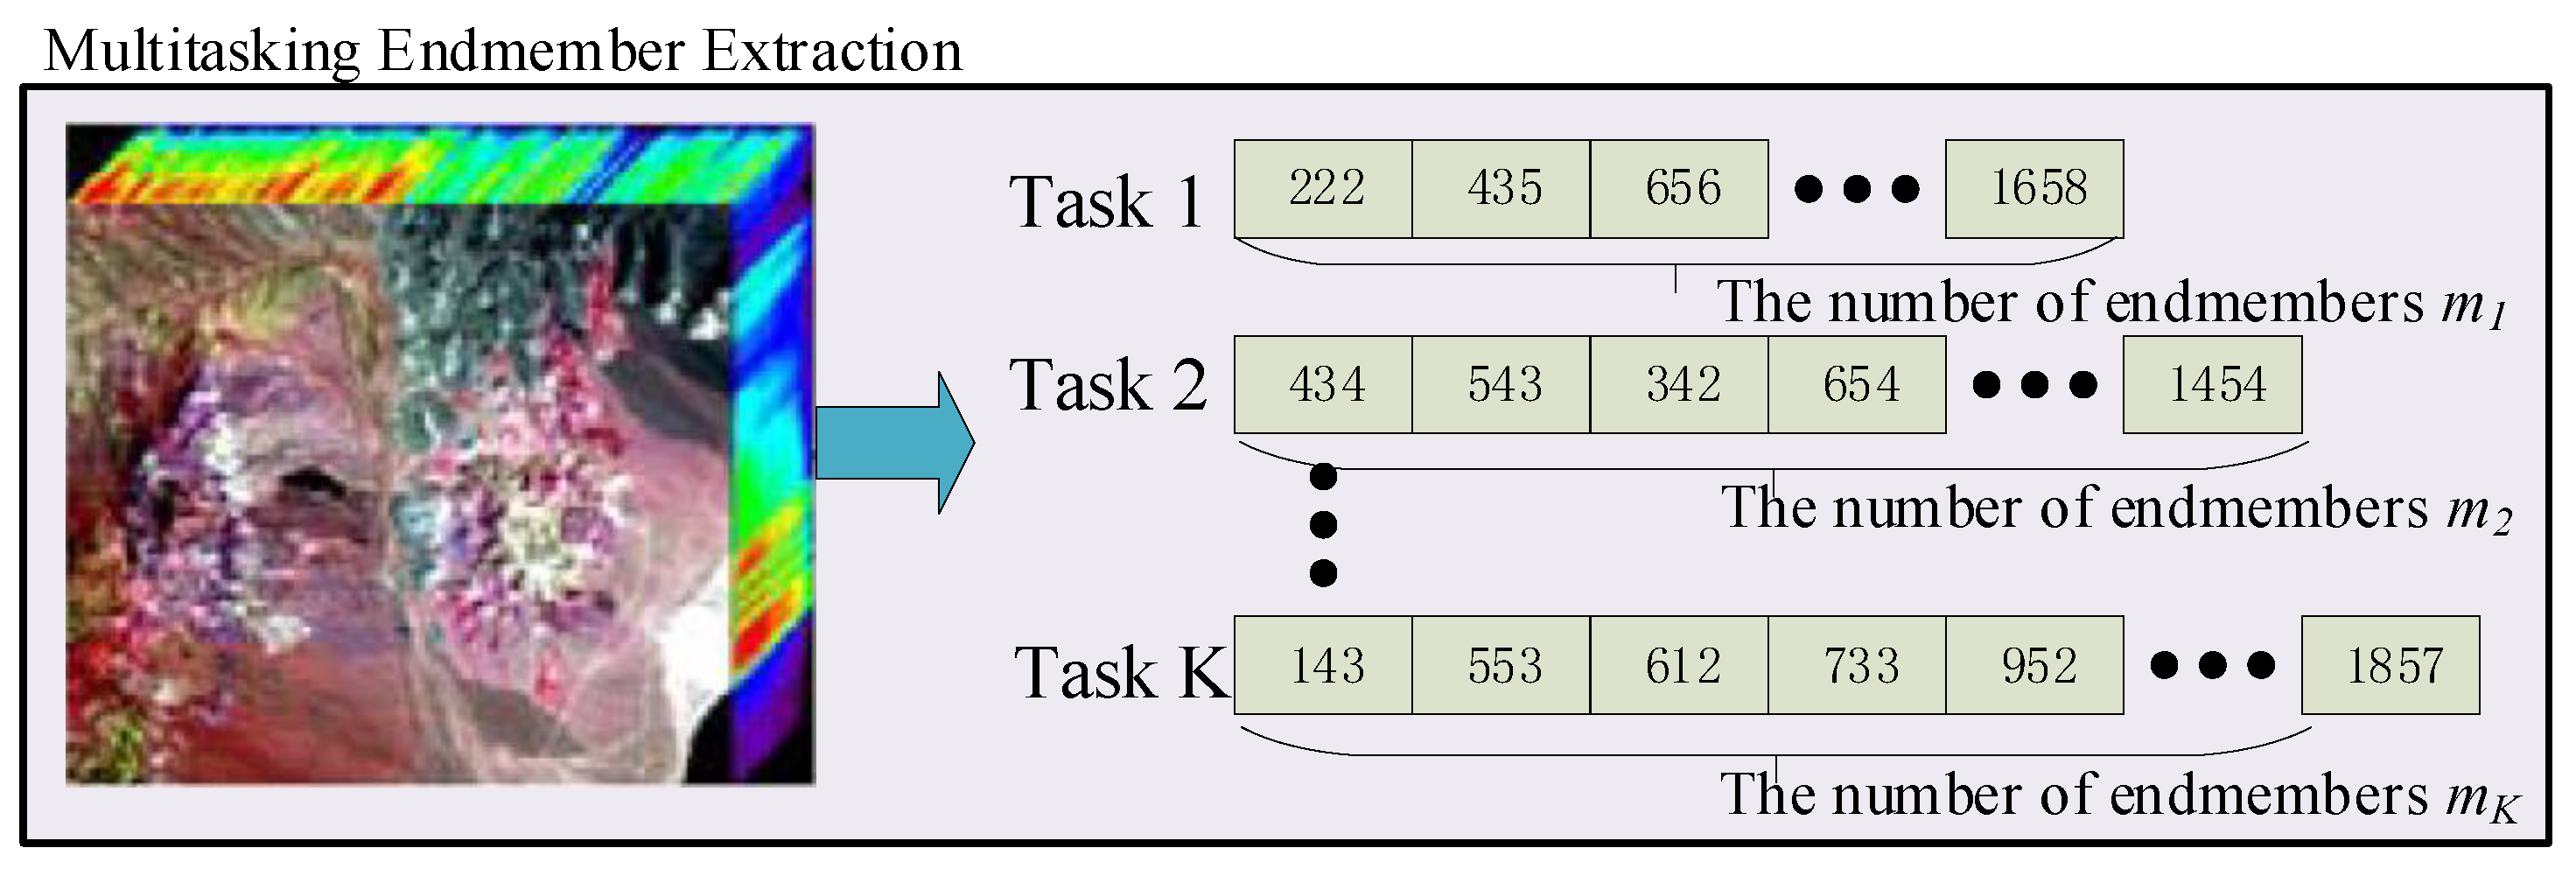
2.1. Endmember Extraction

Because of its simplicity and efficacy, the linear spectral mixture model (LSMM) is the method of choice for endmember extraction problems. The spectral response of a pixel in the LSMM is the linear sum of all of its pure spectral endmembers. The LSMM is valid and distinct endmembers do not interfere with one another [37]. A remote sensing image with L bands and n pixels is represented by { r i } i = 1 n , where r i is the column vector that represents the spectrum of the ith pixel. One way to express the LSMM is as follows:
r i = j = 1 m α i j e j + ε i ,
where the number of endmembers is m, the endmember set ( L m 1 ) is denoted by { e j } j = 1 m , the abundance of the jth endmember in the ith pixel is α i j , and errors (such as noise and modeling mistakes) are represented by ε i . { e j } j = 1 m { r i } i = 1 n is typically assumed.
The fraction abundances of the endmembers are often subject to two constraints: the abundances sum to one (also known as the ASC constraint) and the abundances are non-negative (also known as the ANC constraint) [38]. The following requirements are satisfied by the fractional abundance α i j :
ANC : α i , j 0 , i ,
and
ASC : j = 1 m α i j = 1 , i , j .
Following endmember extraction, the abundance { α i j } n × m is estimated using the least squares technique on the original image { r i } i = 1 n and the endmembers { e j } j = 1 m . The least squares approach can be divided into four groups based on the constraint conditions: completely constrained least square (FCLS), non-negatively constrained least square (NCLS), sum-to-one constrained least square (SCLS), and unconstrained least square (UCLS). In FCLS, the endmembers e j and the abundance α i j yield the estimate pixel r ^ i :
r ^ i = j = 1 m α i j e j .
When comparing an original image r i to its remixed image r ^ i , the root mean square error (RMSE) is expressed as
R M S E ( r i i = 1 n , { r ^ i } i = 1 n ) = 1 n i = 1 n 1 L r i r ^ i 2 2 .
The quality of the endmember extraction result increases with decreasing RMSE. An effective method for comparing the effectiveness of various endmember extraction methods is to use RMSE. Determining the objective function in evolutionary algorithms is also crucial. Numerous endmember extraction algorithms also employ the RMSE as their objective function [20,21].

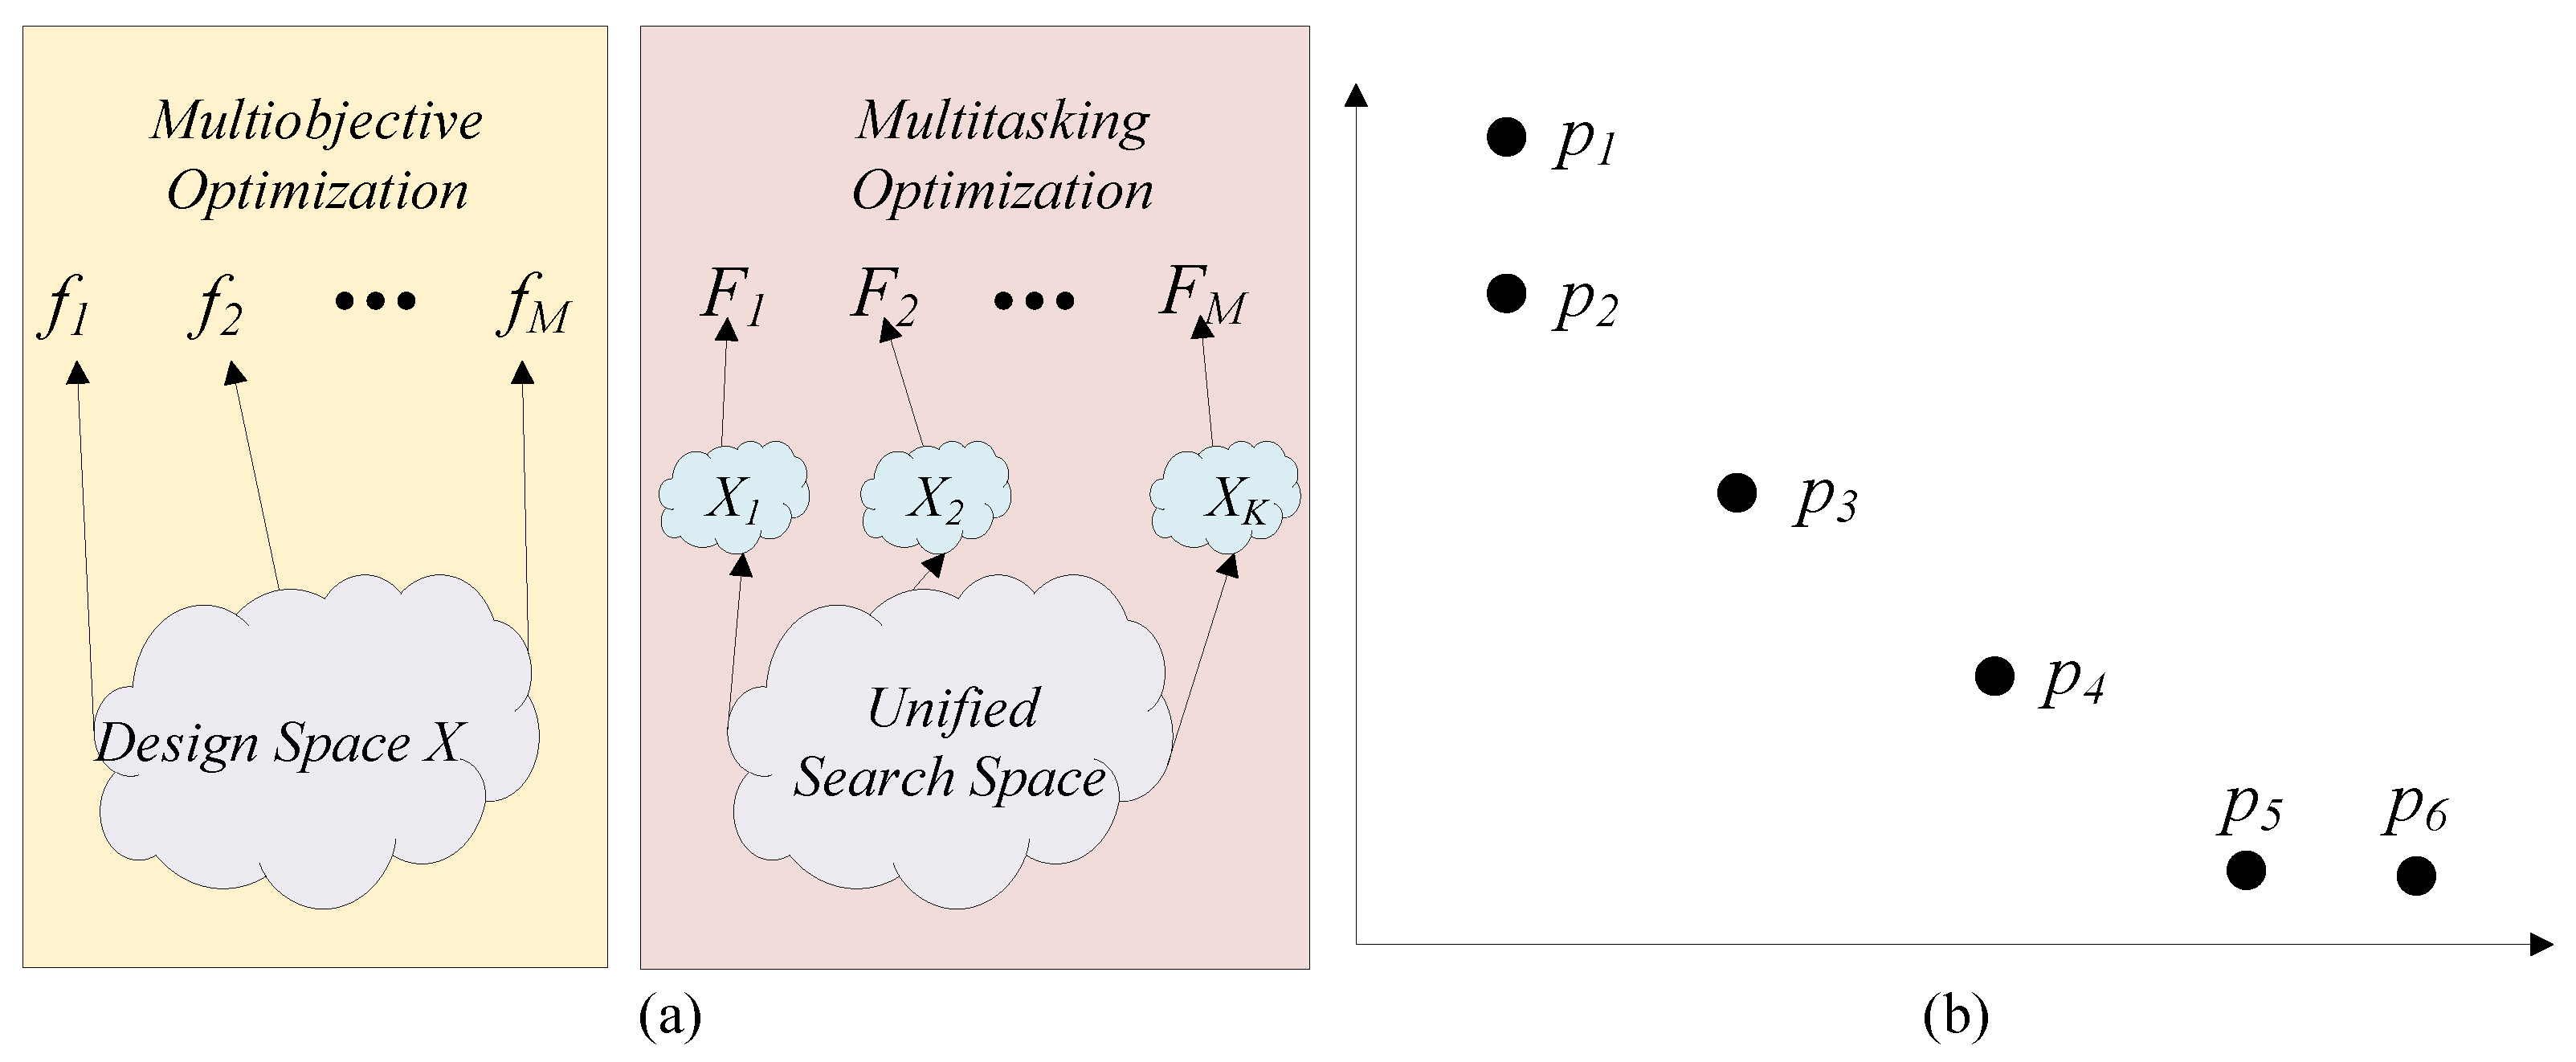
2.2. Evolutionary Multitasking Optimization

Specifically, the activities of interest could be independent parts of a multitasking problem, or they could be separate tasks. However, in this study, we only address the first scenario, which is when there is no prior awareness of any inter-task relationships. We take into account multitasking across optimization problems that are often considered separately. The following is a statement of the evolutionary multitasking paradigm with K optimization tasks:
{ x 1 , x 2 , , x K } = arg min F 1 ( x ) , F 2 ( x ) , . . . , F K ( x ) } s . t . x i Ω i , i = 1 , 2 , . . . , K .
The search spaces for each task in evolutionary multitasking are uniformly encoded into a single search space Y, which is represented by a population. To elucidate the differences between the multitask optimization paradigm and the extensively researched subject of multi-/many-objective optimization [39,40,41], the reader is directed to Figure 1. As a result, this study introduces evolutionary multitasking, or multitask optimization, as a novel paradigm in the field of evolutionary computation. Multitask optimization contains several distinct search spaces corresponding to the different self-contained optimization tasks, whereas multi-objective optimization usually has a single search space containing all objectives. Therefore, for multitask optimization to be effective, one more unification step is required.
We make reference to the objective space of a fictitious two-factorial issue shown in Figure 1b to highlight this distinction even more. The individuals p 2 , p 3 , p 4 , p 5 belong to the first nondominated front, while p 1 , p 6 belong to the second nondominated front, according to the nondominated sorting principles utilized in multi-objective optimization. Put otherwise, p 2 , p 3 , p 4 , p 5 are dissimilar to one another and are always favored over p 1 , p 6 . But according to the definitions in evolutionary multitasking, p 1 and p 2 (as well as p 5 and p 6 ) are considered strong counterparts. Put differently, p 1 , p 2 , p 5 , p 6 are invariably favored over p 3 , p 4 and are deemed incomparable to one another in the multitasking process. As a result, there is debate over the individual performance as inferred from the multi-objective optimization and multitask optimization principles.

3. Methodology

In this section, the framework of competition multitasking endmember extraction is first introduced. Next, the genetic transfer based differential evolution is described, to transfer information within and between tasks. Finally, the online resource allocation strategy with competition reward is shown in detail.

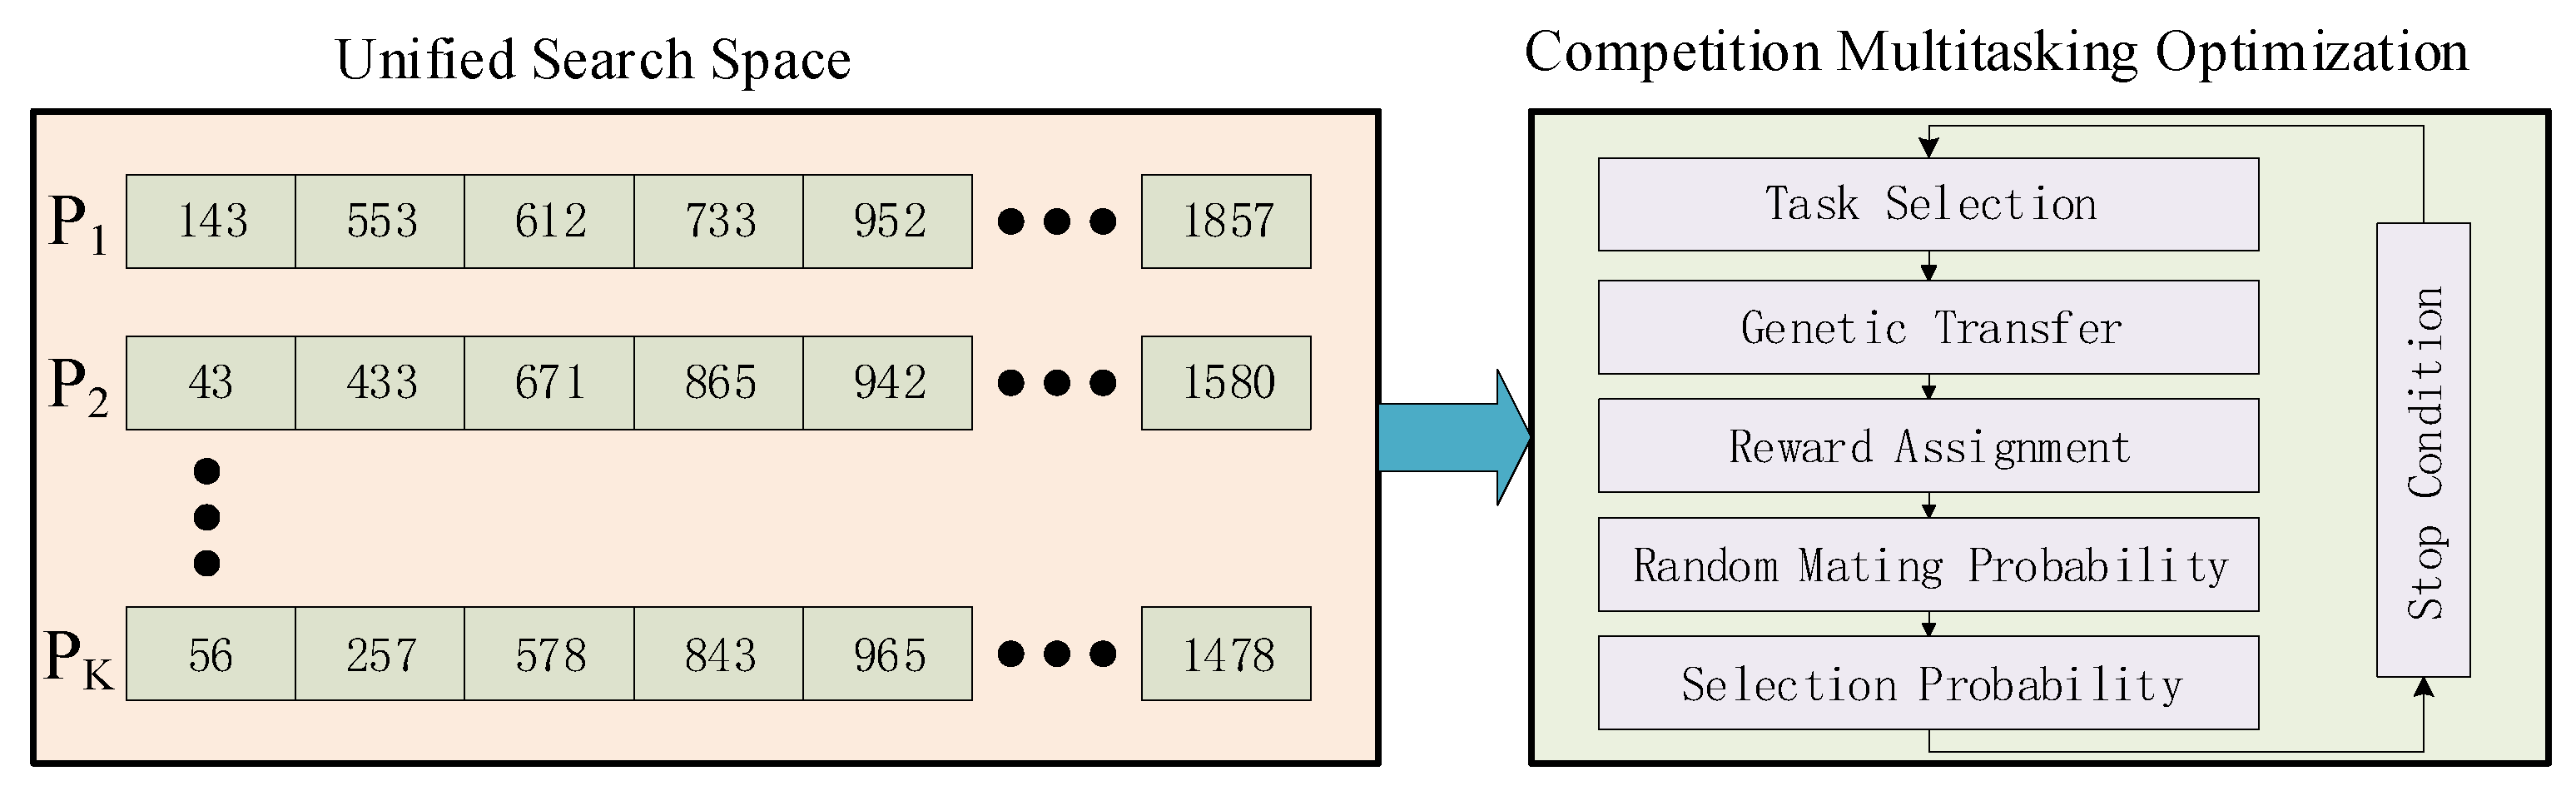
3.1. Framework of Competition Multitasking Endmember Extraction

The framework of competition multitasking endmember extraction is shown in Figure 2. As previously mentioned, the presence of noise and outliers makes it challenging for EA-based endmember extraction algorithms to calculate the number of endmembers in the majority of practical cases. In general, these algorithms change the number of endmembers for extraction iteratively. It is obvious that endmember extraction with different numbers of endmembers can be considered as a series of optimization tasks. These tasks can be solved by evolutionary multitasking optimization, to acquire a group of solutions. Finally, the solution of the optimal number of endmembers is the final output of the utilized multitasking optimization algorithms. It can be observed that these tasks are competitive. This paper tries to utilize evolutionary competition multitasking optimization to solve the above endmember extraction problems. The RMSE between the original and its remixed images is selected as the objective. In the proposed method, we formulate the competition multitasking endmember extraction problem as the following optimization problem:
min { R M S E ( r , r ^ ( x 1 ) ) , R M S E ( r , r ^ ( x 2 ) ) , , R M S E ( r , r ^ ( x K ) ) } ,
where x k ( k = 1 , , K ) is a solution vector containing an extracted endmember subset. One popular method for solving the above problems is to utilize an optimizer to solve each task independently, finding the best answer for each component task before selecting the best one as the optimal solution. The algorithm for competition multitasking endmember extraction is shown in Algorithm 1. Using a multitasking optimization technique to handle all separate tasks at once makes sense as well, since there may be correlations between the multiple activities. During the optimization process, information sharing between the various tasks can increase the effectiveness of completing each task separately. Some important components are described as follows:
Algorithm 1 Algorithm of Competition Multitasking Endmember Extraction.
Input: N: the population size; m a x g e n : max generation number.
Output: The endmember extraction result with best objective function value.
1:
Step (1) Initialization
2:
Step (1.1) Generate an initial population P.
3:
Step (1.2) Evaluate the population P.
4:
Step (2) set t = 0 .//the number of cycles
5:
Step (3) Cycling
6:
Step (3.1) Task Selection: Select a task based on the selection probabilities { p 1 , , p K } .
7:
if  t β · m a x g e n  then
8:
    Randomly select a task k.
9:
else
10:
    Choose a task by the roulette wheel method based on the selection probabilities.
11:
end if
12:
Step (3.2) Genetic Transfer: Optimize the selected task based on the genetic transfer introduced in Section 3.2.
13:
Step (3.3) Reward Assignment: Assign rewards to each task based on the online resources allocation introduced in Section 3.3.
14:
Step (3.4) Update the random mating probability matrix.
15:
Step (3.5) Update the selection probabilities.
16:
Step (4) Stopping criteria:
17:
if  t < m a x g e n  then
18:
     t + + and go to step 3
19:
else
20:
    Stop the algorithm and output.
21:
end if

3.1.1. Representation and Initialization

In this paper, x k = { x k 1 , x k 2 , x k m } is a solution vector containing a extracted endmember subset. x k 1 is the position of the pixel in the hyperspectral images. For the k task, as shown in Figure 3, the number of endmembers is m and the positions of these m endmembers are recorded in x k = { x k 1 , x k 2 , x k m } . It can be observed that the K endmember extraction tasks have different numbers of decision variables. It is necessary to search these solutions to different endmember extraction tasks in a unified search space Ω = [ 0 , 1 ] m m a x . m m a x is defined as
m m a x = m a x { m 1 , , m K } .
As a result, in the initialization, the unified search space is randomly generated as K populations, each of which has N solutions.

3.1.2. Task Selection

In order to distribute computational resources among the tasks in a dynamic manner, the proposed method chooses one task to optimize per generation. Due to insufficient data, it chooses a task at random for the first T generations, in order to assess whether or not each task should be optimized. T is defined as
T = β · m a x g e n
where m a x g e n is the maximum number of generations and β is the control parameter, in order to prevent a cool start. Next, using the roulette wheel method, a task is chosen based on the probability distribution.

3.2. Genetic Transfer Based Differential Evolution

Any EAs with a particular information transfer mechanism can be utilized to optimize the chosen task. The optimizer used in this work is the differential evolution (DE) algorithm. In order to change the population P k of task k, differential evolution uses the crossover, selection, and mutation operators to update the population. The following mutation operator first creates a mutation vector v i = ( v i , 1 , , v i , m ) T for each unique x i :
v i = x r 1 i + F · ( x r 2 i x r 3 i ) ,
where x r 2 i and x r 3 i are randomly chosen from the population P k , and F is the scaling factor that regulates the amplification of the difference vector.
The algorithm for the genetic transfer is shown in Algorithm 2. The efficiency of optimization may be improved by information exchange between tasks. The base vector x r 1 i is randomly chosen from the population, which is established via the roulette wheel approach based on random mating probabilities, in order to transmit knowledge across the tasks. Following the mutation, the binary crossover operator o i = ( o i , 1 , , o i , m ) T generates the offspring o i :
o i j = v i , j if r a n d j ( 0 , 1 ) C R or j = = j r a n d x i , j otherwise ,
where r a n d j ( 0 , 1 ) is a random number in the range of [0, 1], and j r a n d is an integer that is randomly chosen from { 1 , , m } . C R is the crossover rate.
Transferring genetic information between related processes can help with optimization. However, if the component tasks are uncorrelated, this can also have unfavorable impacts. Adaptive direct transfer and indirect transfer can be used to categorize methods for lessening the detrimental consequences of genetic information transfer. Genetic information is transferred using adaptive direct transfer in the initial search areas of the tasks, and during the optimization process, the transfer frequency is adaptively learned. Indirect transfer first converts the task’s original search space into a new one, and then it transfers information within the new space.
Algorithm 2 Algorithm of Genetic Transfer.
1:
x r 1 i is randomly chosen from the population P r , which is established via the roulette wheel approach based on the random mating probabilities R M P .
2:
x r 2 i and x r 3 i are randomly chosen from the population P k .
3:
if  r = = k  then
4:
    Conduct within-task genetic transfer.
5:
else
6:
    Conduct between-task genetic transfer.
7:
end if
8:
v i = x r 1 i + F · ( x r 2 i x r 3 i ) .
A direct information transfer is carried out in this paper, and the frequency of information transfer between tasks is controlled via the employment of a random mating probability matrix R M P . R M P is dynamically changed in order to increase positive transfers and decrease negative transfers. It is assumed that task k is chosen for optimization at the gth generation. The algorithm for defining the random mating probability matrix is shown as follows:
R M P ( k , j ) = m i n { R M P ( k , j ) + δ , 1 } , i f R g ( j ) R g ( k )
R M P ( k , k ) = m a x { R M P ( k , k ) δ , 0 } , i f R g ( j ) R g ( k )
R M P ( k , j ) = m i n { R M P ( k , j ) δ , 0 } , i f R g ( j ) < R g ( k )
R M P ( k , k ) = m a x { R M P ( k , k ) + δ , 1 } , i f R g ( j ) < R g ( k )
where δ is a small value, which is defined as
δ = 1 m a x g e n .
Evidently, the reward of the primary task k and supporting tasks dynamically adjusts the random mating probability matrix R M P . R M P ( k , j ) should increase to promote information transfer if the reward of the auxiliary task j is equal to or greater than the reward of the primary task k. This is because the information from task j is useful for optimizing task k. If not, it ought to drop, in order to lessen the detrimental impacts of information sharing.

3.3. Online Resource Allocation with Competition Reward

It is assumed that the endmember extraction task k is chosen for gth generation optimization. We refer to the chosen task, k, as the primary task for the sake of description, with the remaining tasks as auxiliary tasks. Both the primary task and auxiliary tasks ought to be rewarded in every generation. The objective function value of the population of task k is denoted by f k . g = { f k , g , 1 , , f k , g , N } . f g * = { f 1 , g * , , f K , g * } represents the ideal objective value of all tasks, where f g * * = m i n { f 1 , g * , , f K , g * } is the current global best objective function value.
If the freshly created solution for a problem proves to be superior to the current best solution, more computational resources will be allocated to it. The benefit of making improvements to the present best solution is described as
R g b ( k ) = m a x f g 1 * * f g , k * f g 1 * * , 0 .
It is obvious that the existing global best solution will benefit if it can be made better by making the primary task more efficient. If not, it receives no benefits. The amount of computational costs devoted to the primary task should be decreased if its population has reached a point of convergence or stagnation. Even though its current solutions are not as good as the best solution, the population of the main task should still be rewarded if it can be made even better, because it could yield better results in the future. In light of this, the benefit of increasing the population is described as
R g p ( k ) = 1 N i = 1 N I R g ( k , i ) ,
where
I R g ( k , i ) = m a x f k , g 1 , i f k , g , i f k , g 1 , i , 0 .
The relative improvement rate of the ith individual of task k at the gth generation is denoted as I R g ( k , i ) . The benefit of population improvement is represented by R g p ( k ) , which is equal to the population’s average relative improvement. It goes without saying that improving a person will benefit R g p ( k ) . R g p ( k ) equals 0 if no solution is improved. One can calculate the reward for optimizing the main job by combining R g b ( k ) and R g p ( k ) as
R g ( k ) = α R g b ( k ) + ( 1 α ) R g p ( k ) ,
where the coefficient for adjusting the weights of R g b ( k ) and R g p ( k ) is 0 α 1 . The ratio of exploration to exploitation can be managed by α . For tasks that currently have the best global solution, a large value of α is advantageous; on the other hand, tasks with smaller values of α benefit from solutions that can be greatly improved. Setting a suitable value for α is a complex task that depends on both the problem and the optimizer. In this piece, we keep α at 0.5 for simplicity’s sake.
Auxiliary tasks should receive rewards in addition to the primary tasks in each generation, since their solutions may aid in the optimization of the primary task. The concept of reward for auxiliary tasks in this paper is the same as that of the reward for the main task; that is,
R g ( j ) = α R g b ( j ) + ( 1 α ) R g p ( j ) ,
Following the assignment of awards, the historical reward matrix contains all of the task rewards. It should be noted that the information transfer technique affects the auxiliary task’s reward. Different optimizers may require different reward definitions for the auxiliary task and may have different information transfer protocols. Generally speaking, supplementary activities should be awarded if they improve the main task’s optimization.

4. Experimental Study

This section tested the benefits of the suggested strategy using simulated and real hyperspectral remote sensing photos. Six other representative endmember extraction methods were compared with the suggested MOEE in our trials. In the proposed method, the population size N, scaling factor F, and crossover rate C R were set to 100, 0.5, and 0.9, respectively. These algorithms are described as follows:
(1)
N-FINDER [16]: This method is based on the observation that the N-volume enclosed by a simplex made of the purest pixels is greater than any other volume made of any other combination of pixels in N spectral dimensions. A single realization is defined as a single run with a single set of random beginning endmembers.
(2)
VCA [17]: This procedure takes advantage of two facts: (1) the vertices of a simplex are its endmembers; and (2) the simplex that results from an affine translation is likewise a simplex.
(3)
PPI [13]: This algorithm expedites its procedure by generating a suitable initial set of endmembers. To become better at each iteration until it reaches a final set of endmembers, an iterative rule is designed.
(4)
DPSO [20]: In order to decrease the impact of data mistakes on endmember extraction results and increase endmember extraction accuracy, this algorithm expends PSO in discrete space during endmember extraction.
(5)
ADEE [21]: With the introduction of a self-adaptive mechanism to adaptively modify the DE parameters, this approach no longer relies on the theory of convex geometry and allows for the acquisition of optimal values, without the need for a user-defined process.
(6)
MFEA [26]: This method was implemented within the proposed framework. Endmember extractions with different numbers of endmembers were considered as multiple tasks. However, these tasks were not competitive.

4.1. Experiment on Simu-5 Data

In this experiment, we created a simulated hyperspectral image of 80 × 100 pixels covering 224 bands using a subset of five endmembers from the USGS spectral collection. The middle of the scene seen in Figure 4a is where the twenty synthetic pictures were placed in a 4 × 5 matrix. The first row was made entirely of pixel panels, whereas mixes of two to four endmembers were used to make the last three rows. A mixture of 20% of each of the five mineral fingerprints was used to replicate the background [42]. The genuine fractional abundances for each of the five endmembers are displayed in Figure 4b–f. The five signatures, Alunite AL706 (A), Buddingtonite GDS85 (B), Calcite CO2004 (C), Kaolinite CM3 (K), and Muscovite GDS107, were selected from the USGS library, as Figure 5 illustrates.
One significant factor that affects the accuracy of endmember extraction results is noise. Simulated white Gaussian noise was applied to the artificial image in Figure 4a that included 20 implanted panels, in order to obtain signal-to-noise ratios (SNR) of 10:1, 20:1, and 30:1. The errors determined by each of the five methods with varying numbers of endmembers are displayed in Table 1.
The accuracy of endmember extraction results is significantly impacted by noise. To produce signal-to-noise ratios (SNR) of 10:1, 20:1, and 30:1, a simulated white Gaussian noise was applied to the artificial image in Figure 4a that had 20 implanted panels. The errors determined by each of the seven methods with varying numbers of endmembers are displayed in Table 1. It is evident that the suggested MFEA and CMTEE performs better than N-FINDR, VCA, PPI and DPSO. Based on Table 1, the suggested approach outperforms competing methods by a significant margin for SNR=10. The computational complexity of N-FINDR and VCA is less than that of DPSO and the suggested approach. Nonetheless, CMTEE can achieve improved endmember extraction outcomes by exchanging information among the multiple tasks. As previously said, there are several benefits to applying the proposed approach. Initially, distinct endmember extraction outcomes are acquired during a solitary run. Second, by exchanging knowledge through the genetic transfer, the suggested strategy performs better than the others.

4.2. Experiment on Simu-10 Data

The USGS ground-truth mineral spectra served as the basis for the construction of the simulated image (Simu-10). Figure 6 displays both the true abundance images and the simulated image. Based on the ten spectra of the following minerals (Figure 5): Alunite, Buddingtonite, Calcite, Halloysite, Illite, Jarosite, Kaolinite, Muscovite, Nontronite, and Pyrophyllite, this image (160 × 160) with 224 bands was simulated. Both the prior experiment and this one using the Simu-10 image are displayed. To produce signal-to-noise ratios (SNR) of 10:1, 20:1, and 30:1, a simulated white Gaussian noise was applied to the synthetic image shown in Figure 6.
The errors determined by the seven methods with varying numbers of endmembers are displayed in Table 2. Higher SNR for the synthetic image allows us to acquire reduced error. According to Table 2, CMTEE produced superior outcomes than the other six algorithms. To obtain distinct endmember extraction outcomes with a predetermined quantity of endmembers, DPSO executes independent runs. With only one run, the suggested CMTEE performs better and yields a set of solutions.

4.3. Experiment on Real Data

An airborne visible infrared imaging spectrometer provided the hyperspectral image that we employed in our tests (AVIRIS). The AVIRIS Cuprite image (400 × 350) with 50 bands ranging from 1.9908 µm (Band 172) to 2.4790 µm (Band 221) was taken in the vicinity of Cuprite, Nevada, US in 1995, as depicted in Figure 7. A lot of work has gone into endmember extraction from hyperspectral remote sensing photos using this typical dataset. This region has a wide variety of complex minerals, such as calcite, alunite, kaolinite, chalcedony, muscovite, montmorillonite, jarosite, and calcite, as discussed in Section 2. Additionally, some chert, illite, and buddingtonite are present [43]. Verifying the precise estimates of the mineral types at the Cuprite mining site is obviously a challenging undertaking. The majority of other approaches limit the number of end members in their tests to 5, 10, 15, and 20. Therefore, altering the experiment’s endmember count is inappropriate. Here, the number of endmembers was limited as in [5,20] for all trials.
The suggested technique could obtain endmember extraction results after 300 iterations if the number of endmembers was set to [5,20]. The spatial locations of the retrieved endmembers generated by the proposed algorithm are displayed in Figure 8. The endmembers in the figure are the pixels with open circles around them. The suggested approach performed well for endmember extraction, as seen from a visual examination of Figure 8. The accuracy of the sequential endmember extraction algorithms, which located endmembers one at a time in accordance with the increasing strategy, was influenced by the other tasks. The results were typically inconsistent, yielding a different number of endmembers with a different initialization, because they extracted endmembers from the images after they had been converted by the MNF algorithm. The accuracy of each of the seven endmember extraction algorithms was assessed by calculating the difference between the original and remixed images. As seen in Table 3, CMTEE outperformed N-FINDR, VCA, and PPI for every endmember number. The suggested approach appeared to produce more appropriate endmember extraction results. The suggested CMTEE could produce superior endmember extraction outcomes as compared to MFEA.

5. Concluding Remarks

Images from hyperspectral remote sensing usually contain mixed, and not pure, pixels. Finding a set of endmembers to represent the original image is the goal of endmember extraction. In actuality, it is difficult to estimate the number of endmembers in endmember extraction investigations. To generate results for endmember extraction with different numbers of endmembers, multiple tedious runs are needed. To address endmember extraction, an evolutionary competition multitasking optimization method was proposed in this study. The solution that was suggested treats endmember extraction problems that have varying numbers of endmembers as a collection of optimization tasks. It was specifically anticipated that these duties are competitive. Then, online resource allocation was used to allocate the appropriate computational resources to the tasks under consideration. The efficacy of the evolutionary competition multitasking optimization approach for endmember extraction was shown through experiments conducted on both simulated and actual hyperspectral datasets. In the future, we hope to investigate multitasking multiobjective optimization for multiple competitive tasks where the endmember extraction task is modeled as a multiobjective optimization problem.

Author Contributions

Conceptualization, Q.W. and F.X.; methodology, Y.S.; software, Y.S. and W.Z.; validation, F.X., H.W. and L.L.; formal analysis, Y.S.; investigation, Y.S.; resources, Y.S.; data curation, Y.S.; writing—original draft preparation, Y.S. and Q.W.; writing—review and editing, Y.S., Q.W. and W.Z.; visualization, F.X.; supervision, Q.W. and F.X.; project administration, F.X.; funding acquisition, Y.S., Q.W., W.Z., F.X., H.W. and L.L. All authors have read and agreed to the published version of the manuscript.

Funding

This research was funded by the National Natural Science Foundation of China under Grant no. 61973249, 62003279, the Key R&D programs of Shaanxi Province under Grant no. 2021ZDLGY02-06, 2023-YBGY-132, 2024GX-YBXM-134, Qin Chuangyuan project under Grant no. 2021QCYRC4-49, Qinchuangyuan Scientist+Engineer under Grant no. 2022KXJ-169, National Defense Science and Technology Key Laboratory Fund Project under Grant no. 6142101210202, the Basic Research Program of Natural Science in Shaanxi Province under Grant no. 2024JC-YBMS-558, Youth New Star Project of Shaanxi Province under Grant no. 2023KJXX-136, Shaanxi Association for Science and Technology Young Talent Lifting Program under Grant no. XXJS202242.

Data Availability Statement

Data available on request due to restrictions privacy. The data presented in this study are available on request from the corresponding author.

Conflicts of Interest

Wenbo Zhu is employed by State Grid Shaanxi Power Company. The remaining authors declare that the research was conducted in the absence of any commercial or financial relationships that could be construed as a potential conflict of interest.

References

  1. Ross, B.J.; Gualtieri, A.G.; Fueten, F.; Budkewitsch, P. Hyperspectral image analysis using genetic programming. Appl. Soft Comput. 2005, 5, 147–156. [Google Scholar] [CrossRef]
  2. Bioucas-Dias, J.M.; Plaza, A.; Camps-Valls, G.; Scheunders, P.; Nasrabadi, N.; Chanussot, J. Hyperspectral remote sensing data analysis and future challenges. IEEE Geosci. Remote Sens. Mag. 2013, 1, 6–36. [Google Scholar] [CrossRef]
  3. Bai, Y.; Xu, M.; Zhang, L.; Liu, Y. Pruning Multi-Scale Multi-Branch Network for Small-Sample Hyperspectral Image Classification. Electronics 2023, 12, 674. [Google Scholar] [CrossRef]
  4. Hennessy, A.; Clarke, K.; Lewis, M. Hyperspectral classification of plants: A review of waveband selection generalisability. Remote Sens. 2020, 12, 113. [Google Scholar] [CrossRef]
  5. Liu, X.; Kou, Y.; Fu, M. Hyperspectral Image Shadow Enhancement Using Three-Dimensional Dynamic Stochastic Resonance and Classification Based on ResNet. Electronics 2024, 13, 500. [Google Scholar] [CrossRef]
  6. Feng, D.; Zhang, M.; Wang, S. Multipopulation Particle Swarm Optimization for Evolutionary Multitasking Sparse Unmixing. Electronics 2021, 10, 3034. [Google Scholar] [CrossRef]
  7. Deng, C.; Chen, Y.; Zhang, S.; Li, F.; Lai, P.; Su, D.; Hu, M.; Wang, S. Robust dual spatial weighted sparse unmixing for remotely sensed hyperspectral imagery. Remote Sens. 2023, 15, 4056. [Google Scholar] [CrossRef]
  8. Gong, M.; Li, H.; Luo, E.; Liu, J.; Liu, J. A multiobjective cooperative coevolutionary algorithm for hyperspectral sparse unmixing. IEEE Trans. Evol. Comput. 2016, 21, 234–248. [Google Scholar] [CrossRef]
  9. Li, H.; Li, D.; Gong, M.; Li, J.; Qin, A.; Xing, L.; Xie, F. Sparse Hyperspectral Unmixing With Preference-Based Evolutionary Multiobjective Multitasking Optimization. IEEE Trans. Emerg. Top. Comput. Intell. 2024, 8, 1922–1937. [Google Scholar] [CrossRef]
  10. Brezini, S.E.; Deville, Y. Hyperspectral and Multispectral Image Fusion with Automated Extraction of Image-Based Endmember Bundles and Sparsity-Based Unmixing to Deal with Spectral Variability. Sensors 2023, 23, 2341. [Google Scholar] [CrossRef]
  11. Wang, Z.; Wei, J.; Li, J.; Li, P.; Xie, F. Evolutionary Multiobjective Optimization with Endmember Priori Strategy for Large-Scale Hyperspectral Sparse Unmixing. Electronics 2021, 10, 2079. [Google Scholar] [CrossRef]
  12. Boardman, J.W.; Kruse, F.A.; Green, R.O. Mapping Target Signatures via Partial Unmixing of AVIRIS Data. In Proceedings of the Summaries of the Fifth Annual JPL Airborne Earth Science Worksho, Pasadena, CA, USA, 4–8 March 1995; pp. 23–26. [Google Scholar]
  13. Chang, C.I.; Plaza, A. A fast iterative algorithm for implementation of pixel purity index. IEEE Geosci. Remote Sens. Lett. 2006, 3, 63–67. [Google Scholar] [CrossRef]
  14. Kalaivani, S.; Vimaladevi, M. Enhancing Endmember Extraction using K-Means Clustering and Pixel Purity Index. In Proceedings of the 2023 2nd International Conference on Vision Towards Emerging Trends in Communication and Networking Technologies (ViTECoN), Vellore, India, 5–6 May 2023; pp. 1–6. [Google Scholar]
  15. Winter, M.E. N-FINDR: An Algorithm for Fast Autonomous Spectral End-Member Determination in Hyperspectral Data. In Proceedings of the SPIE, Newport Beach, CA, USA, 2–4 March 1999; pp. 266–275. [Google Scholar]
  16. Chang, C.I.; Wu, C.C.; Tsai, C.T. Random N-finder (N-FINDR) endmember extraction algorithms for hyperspectral imagery. IEEE Trans. Image Process. 2010, 20, 641–656. [Google Scholar] [CrossRef] [PubMed]
  17. Nascimento, J.; Bioucas Dias, J. Vertex component analysis: A fast algorithm to unmix hyperspectral data. IEEE Trans. Geosci. Remote Sens. 2005, 43, 898–910. [Google Scholar] [CrossRef]
  18. Ifarraguerri, A.; Chang, C.I. Multispectral and hyperspectral image analysis with convex cones. IEEE Trans. Geosci. Remote Sens. 1999, 37, 756–770. [Google Scholar] [CrossRef]
  19. Chang, C.I.; Wu, C.C.; Liu, W.m.; Ouyang, Y.C. A new growing method for simplex-based endmember extraction algorithm. IEEE Trans. Geosci. Remote Sens. 2006, 44, 2804–2819. [Google Scholar] [CrossRef]
  20. Zhang, B.; Sun, X.; Gao, L.; Yang, L. Endmember Extraction of Hyperspectral Remote Sensing Images Based on the Discrete Particle Swarm Optimization Algorithm. IEEE Trans. Geosci. Remote Sens. 2011, 49, 4173–4176. [Google Scholar] [CrossRef]
  21. Zhong, Y.; Zhao, L.; Zhang, L. An Adaptive Differential Evolution Endmember Extraction Algorithm for Hyperspectral Remote Sensing Imagery. IEEE Geosci. Remote Sens. Lett. 2014, 11, 1061–1065. [Google Scholar] [CrossRef]
  22. Cheng, F.; Chen, N.; Wang, C.; Wang, Q.; Du, B. A Global-to-Local Evolutionary Algorithm for Hyperspectral Endmember Extraction. IEEE Trans. Geosci. Remote Sens. 2023, 61, 1–17. [Google Scholar] [CrossRef]
  23. Zhang, B.; Sun, X.; Gao, L.; Yang, L. Endmember Extraction of Hyperspectral Remote Sensing Images Based on the Ant Colony Optimization (ACO) Algorithm. IEEE Trans. Geosci. Remote Sens. 2011, 49, 2635–2646. [Google Scholar] [CrossRef]
  24. Chang, C.I.; Du, Q. Estimation of number of spectrally distinct signal sources in hyperspectral imagery. IEEE Trans. Geosci. Remote Sens. 2004, 42, 608–619. [Google Scholar] [CrossRef]
  25. Dias, J.; Nascimento, J. Estimation of Signal Subspace on Hyperspectral Data. In Proceedings of the SPIE, San Diego, CA, USA, 31 July–4 August 2005; Volume 5982, pp. 191–198. [Google Scholar]
  26. Gupta, A.; Ong, Y.S.; Feng, L. Multifactorial evolution: Toward evolutionary multitasking. IEEE Trans. Evol. Comput. 2015, 20, 343–357. [Google Scholar] [CrossRef]
  27. Zhao, H.; Ning, X.; Liu, X.; Wang, C.; Liu, J. What makes evolutionary multi-task optimization better: A comprehensive survey. Appl. Soft Comput. 2023, 145, 110545. [Google Scholar] [CrossRef]
  28. Li, H.; Wan, F.; Gong, M.; Qin, A.; Wu, Y.; Xing, L. Privacy-Enhanced Multitasking Particle Swarm Optimization based on Homomorphic Encryption. IEEE Trans. Evol. Comput. 2023. [Google Scholar] [CrossRef]
  29. Gupta, A.; Ong, Y.S.; Da, B.; Feng, L.; Handoko, S.D. Landscape Synergy in Evolutionary Multitasking. In Proceedings of the 2016 IEEE Congress on Evolutionary Computation (CEC), Vancouver, BC, Canada, 24–29 July 2016; IEEE: Piscataway, NJ, USA, 2016; pp. 3076–3083. [Google Scholar]
  30. Cheng, F.; Shu, S.; Zhang, L.; Tan, M.; Qiu, J. An Evolutionary Multitasking Method for High-Dimensional Receiver Operating Characteristic Convex Hull Maximization. IEEE Trans. Emerg. Top. Comput. Intell. 2024, 8, 1699–1713. [Google Scholar] [CrossRef]
  31. Li, H.; Ong, Y.S.; Gong, M.; Wang, Z. Evolutionary multitasking sparse reconstruction: Framework and case study. IEEE Trans. Evol. Comput. 2018, 23, 733–747. [Google Scholar] [CrossRef]
  32. Li, H.; Luo, T.; Liu, L.; Gong, M.; Qiao, W.; Xie, F.; Qin, A. Selective Transfer Based Evolutionary Multitasking Optimization for Change Detection. IEEE Trans. Emerg. Top. Comput. Intell. 2024, 1–16. [Google Scholar] [CrossRef]
  33. Li, J.; Gong, M.; Wei, J.; Zhang, Y.; Zhao, Y.; Wang, S.; Jiang, X. Evolutionary multitasking cooperative transfer for multiobjective hyperspectral sparse unmixing. Knowl.-Based Syst. 2024, 285, 111306. [Google Scholar] [CrossRef]
  34. Shi, J.; Shao, T.; Liu, X.; Zhang, X.; Zhang, Z.; Lei, Y. Evolutionary multitask ensemble learning model for hyperspectral image classification. IEEE J. Sel. Top. Appl. Earth Obs. Remote Sens. 2020, 14, 936–950. [Google Scholar] [CrossRef]
  35. Li, G.; Zhang, Q.; Wang, Z. Evolutionary competitive multitasking optimization. IEEE Trans. Evol. Comput. 2022, 26, 278–289. [Google Scholar] [CrossRef]
  36. Li, Y.; Gong, W.; Li, S. Evolutionary competitive multitasking optimization via improved adaptive differential evolution. Expert Syst. Appl. 2023, 217, 119550. [Google Scholar] [CrossRef]
  37. Settle, J.; Drake, N. Linear mixing and the estimation of ground cover proportions. Int. J. Remote Sens. 1993, 14, 1159–1177. [Google Scholar] [CrossRef]
  38. Heinz, D.C.; Chang, C.I. Fully constrained least squares linear spectral mixture analysis method for material quantification in hyperspectral imagery. IEEE Trans. Geosci. Remote Sens. 2001, 39, 529–545. [Google Scholar] [CrossRef]
  39. Li, H.; Gong, M.; Wang, Q.; Liu, J.; Su, L. A multiobjective fuzzy clustering method for change detection in SAR images. Appl. Soft Comput. 2016, 46, 767–777. [Google Scholar] [CrossRef]
  40. Liang, Z.; Zhu, Y.; Wang, X.; Li, Z.; Zhu, Z. Evolutionary multitasking for multi-objective optimization based on generative strategies. IEEE Trans. Evol. Comput. 2022, 27, 1042–1056. [Google Scholar] [CrossRef]
  41. Liu, R.; Wang, P.; Du, B.; Qu, B. Endmember Bundle Extraction Based on Improved Multi-objective Particle Swarm Optimization. IEEE Geosci. Remote Sens. Lett. 2023, 20, 5506405. [Google Scholar]
  42. Xu, M.; Du, B.; Zhang, L. Spatial-Spectral Information Based Abundance-Constrained Endmember Extraction Methods. IEEE J. Sel. Top. Appl. Earth Obs. Remote Sens. 2014, 7, 2004–2015. [Google Scholar] [CrossRef]
  43. Rezaei, Y.; Mobasheri, M.; Zoej, M.; Schaepman, M. Endmember Extraction Using a Combination of Orthogonal Projection and Genetic Algorithm. IEEE Geosci. Remote Sens. Lett. 2012, 9, 161–165. [Google Scholar] [CrossRef]
Figure 1. Multiobjective and multitasking optimization. (a) The search space in multiobjective and multitasking optimization. (b) Objective space in multiobjective and multitasking optimization. The best solutions for multiobjective optimization are { p 2 , p 3 , p 4 , p 5 } and the best solutions for multitasking optimization are { p 1 , p 2 , p 5 , p 6 } .
Electronics 13 01424 g001
Figure 2. Framework of Competition Multitasking Endmember Extraction.
Electronics 13 01424 g002
Figure 3. Unified Search Space and Evolutionary Search.
Electronics 13 01424 g003
Figure 4. Abundance maps of Simu-5 data. (a) Synthetic image; (bf) Abundance of the five endmembers.
Electronics 13 01424 g004
Figure 5. Signatures of the simulated data chosen from the USGS library.
Electronics 13 01424 g005
Figure 6. Abundance maps of Simu-10 data. (a) Synthetic image; (bk) Abundance of the ten endmembers.
Electronics 13 01424 g006
Figure 7. Three-dimensional cube form of the Cuprite image. (R: Band 183, 2.1010 µm. G: Band 193, 2.2008 µm. B: Band 207, 2.3402 µm).
Electronics 13 01424 g007
Figure 8. Endmembers extracted by the proposed algorithm with (a) 5, (b) 6, (c) 7, (d) 8, (e) 9, (f) 10, (g) 11, (h) 12, (i) 13, (j) 14, (k) 15, (l) 16, (m) 17, (n) 18, (o) 19, (p) 20 endmembers.
Electronics 13 01424 g008
Table 1. Results on Simu-5 data with seven endmember extraction algorithms.
SNRTaskN-FINDRVCAPPIDPSOADEEMFEACMTEE
1030.27210.27140.30890.27280.27490.27510.2649
40.26340.26100.32590.26520.26340.26410.2543
50.25670.25830.26370.25520.25800.25830.2521
60.25160.25050.25590.25230.25650.25520.2487
2030.09050.09050.20560.09270.09110.09490.0892
40.08520.08520.20410.08760.08770.08740.0826
50.08120.08120.09300.08490.08160.08490.0812
60.07970.08020.08740.08470.08010.08170.0789
3030.03950.03910.04550.03890.03980.03990.0388
40.02870.02820.04490.03840.03660.02820.0275
50.02590.02590.04430.03060.02600.02560.0251
60.02570.02550.04440.03010.02570.02520.0249
Table 2. Results on Simu-10 data with seven endmember extraction algorithms.
SNRTaskN-FINDRVCAPPIDPSOADEEMFEACMTEE
1020.28740.28740.30950.41430.31770.30690.2796
30.27380.26900.28320.28260.30010.27040.2676
40.25970.26320.42910.27670.26110.25700.2409
50.24650.24690.26350.26280.25260.25180.2411
60.24310.24400.40990.25740.24310.24660.2358
70.24090.24130.42000.24610.24110.24480.2286
80.23720.24110.24190.24180.23940.24040.2213
90.23620.23500.30260.23730.23600.24050.2205
100.23320.23720.23950.23620.23710.23710.2171
2020.11880.11880.11200.10540.17660.11850.0985
30.10690.10020.11390.09820.17320.10770.0977
40.09670.09670.11560.09670.17310.09810.0881
50.08450.08430.11550.09020.08500.09740.0841
60.08450.08400.11940.08840.08600.08970.0815
70.08220.08070.11690.08770.08220.08890.0789
80.08040.08060.11390.08480.08110.08830.0780
90.08020.08510.11480.08370.07970.08780.0778
100.08080.07870.10980.08010.07960.08720.0772
3020.08630.08630.08120.08020.15420.07690.0713
30.07030.07030.08090.06550.15320.06020.0572
40.05630.05770.07980.06200.05590.04630.0425
50.03500.03580.07970.06200.03630.04620.0343
60.03430.03320.08410.06190.04420.04540.0314
70.03040.03580.07940.06170.03040.04530.0275
80.02990.03780.08380.06150.03000.04500.0274
90.03820.03260.08360.06150.03150.04490.0271
100.03150.03250.08320.06140.03180.04470.0268
Table 3. Results on real data with the seven endmember extraction algorithms.
TaskN-FINDRVCAPPIDPSOADEEMFEACMTEE
56.06116.201616.36069.73116.07255.65235.2366
65.00025.131916.20416.86915.90885.99384.9047
74.54314.80486.95536.53805.70935.22854.5731
84.04944.48606.86156.39175.86094.92554.2613
95.67545.14326.74026.32565.60774.29324.0963
105.930610.16506.65988.77725.65154.26323.9851
114.03594.34215.12788.62974.04114.03713.7638
123.97314.83115.11915.18014.67534.24233.7474
134.36154.02564.95584.86394.19494.12873.4663
143.75153.61425.09716.28884.49344.08043.4071
153.31833.45315.01727.52954.44593.75113.1989
163.26593.36164.63654.62693.68653.29943.1068
173.90593.83674.69184.57093.64533.22873.1962
183.49093.37144.32714.46483.70643.22173.0987
193.57073.09104.12994.42763.52803.13382.9892
203.16293.51174.95824.34343.71543.13012.8980
Disclaimer/Publisher’s Note: The statements, opinions and data contained in all publications are solely those of the individual author(s) and contributor(s) and not of MDPI and/or the editor(s). MDPI and/or the editor(s) disclaim responsibility for any injury to people or property resulting from any ideas, methods, instructions or products referred to in the content.

