

Pushing the Boundaries of Solar Panel Inspection: Elevated Defect Detection with YOLOv7-GX Technology

1
College of Electronic Information Engineering, Taiyuan University of Science and Technology, Taiyuan 030024, China
2
The University of Sydney Engineering and Computer Science, Sydney 2006, Australia
*
Author to whom correspondence should be addressed.
Electronics 2024, 13(8), 1467; https://doi.org/10.3390/electronics13081467
Submission received: 25 March 2024
/
Revised: 9 April 2024
/
Accepted: 10 April 2024
/
Published: 12 April 2024
(This article belongs to the Topic Computer Vision and Image Processing, 2nd Edition)
Abstract
:During the maintenance and management of solar photovoltaic (PV) panels, how to efficiently solve the maintenance difficulties becomes a key challenge that restricts their performance and service life. Aiming at the multi-defect-recognition challenge in PV-panel image analysis, this study innovatively proposes a new algorithm for the defect detection of PV panels incorporating YOLOv7-GX technology. The algorithm first constructs an innovative GhostSlimFPN network architecture by introducing GSConv and depth-wise separable convolution technologies, optimizing the traditional neck network structure. Then, a customized 1 × 1 convolutional module incorporating the GAM (Global Attention Mechanism) attention mechanism is designed in this paper to improve the ELAN structure, aiming to enhance the network’s perception and representation capabilities while controlling the network complexity. In addition, the XIOU loss function is introduced in the study to replace the traditional CIOU loss function, which effectively improves the robustness and convergence efficiency of the model. In the training stage, the sample imbalance problem is effectively solved by implementing differentiated weight allocations for different images and categories, which promotes the balance of the training process. The experimental data show that the optimized model achieves 94.8% in the highest mAP value, which is 6.4% higher than the original YOLOv7 network, significantly better than other existing models, and provides solid theoretical and technical support for further research and application in the field of PV-panel defect detection.
1. Introduction
As the heart of a solar photovoltaic (PV) system, the performance and durability of PV panels are directly related to the energy efficiency and stability of the entire system [1]. Despite the rapid development of photovoltaic (PV) technology globally and its emergence as an important part of the green-energy sector, the maintenance and operational issues of PV panels during their lifecycle are still significant factors affecting their efficacy and longevity. There is a wide variety of faults and defects that PV panels may encounter during actual operation, including but not limited to hot spots, physical fragmentation, surface shading, etc. These problems not only lead to an effective loss of energy, but also may cause an overall decrease in system efficiency or even lead to system failure, thus impacting the reliability and economy of PV-power generation [2].
In the traditional mode, the detection of defects in PV panels mainly relies on manual inspection and the use of specific inspection equipment, such as visual inspection, thermal imager scanning, electrical performance analysis, and optical methods to identify faults. Although these means are able to identify some common problems of PV panels to some extent, they generally suffer from low efficiency and high cost, and due to the limitations of the technical means, it is often difficult to achieve the accuracy required for industrialized large-scale applications. With technological advances, especially the wide application of convolutional neural networks (CNNs) and deep learning techniques in the field of image processing, image-based deep learning defect-detection methods have begun to receive attention [3]. Such methods are able to achieve more accurate and efficient fault detection by automatically learning and recognizing feature patterns in PV-panel images. Compared with traditional methods, deep learning can not only significantly improve the accuracy of defect detection, but also show higher efficiency in processing large-scale data, providing new solutions for PV-panel maintenance and fault prevention.
Deep learning techniques have demonstrated significant advantages in processing complex images and recognizing subtle differences, which is particularly important for maintaining robustness in the defect detection of photovoltaic panels under variable environmental conditions. Although deep learning-based methods have achieved significant advances in recognizing specific types of defects, existing methods still exhibit significant shortcomings when faced with challenges such as multiple fault recognition, environmental changes, and small-size defect detection and defect recognition in complex backgrounds; for example, defect detection in complex backgrounds. Photovoltaic panels are installed in a variety of environments, from deserts to rooftops, and different backgrounds interfere with defect detection in different ways. In desert environments, sand and dust may cover the PV panels, blurring the real defect features, while in rainy regions, the reflection of water droplets may mislead the defect-detection algorithm. These factors greatly increase the difficulty of detection, requiring detection algorithms to not only recognize defects but also resist interference from complex backgrounds. Recently, research on applying deep learning to PV-panel defect detection has gained widespread attention, and numerous studies have made significant progress by adopting diverse network structures and data-processing strategies. For example, one study proposed an effective solution strategy for the surface-defect-detection problem under limited sample conditions by erasure-filling data enhancement, showing its exploitation of data-enhancement potential [4]. Another study significantly improved the recognition rate of surface defects on steel plates by utilizing an attention mechanism and a multilevel feature-fusion network [5].
In the research area of PV-panel defect detection, Latoui A [6] used an innovative approach to extract features from a two-dimensional (2-D) scale map by means of a pre-trained AlexNet Convolutional Neural Network (CNN) in order to predict whether or not a PV panel is in a partial-shading (PS) condition. This approach utilizes 2-D scale maps generated in real-time from photovoltaic (PV) data-acquisition systems to effectively identify the shading problem of solar panels. Although this technique performs well in shading detection, its application is limited to a single type of detection, and thus has limitations in the widespread deployment of large-scale PV power plants. Menghao Guo [7] successfully developed a hot-spot defect-detection model based on the Faster RCNN framework and combining image preprocessing, migration learning, and the improvement of the feature-extraction-network model to deeply analyze infrared images. The model achieves a high accuracy of 97.34% in hot-spot detection, showing excellent performance. However, just like Latoui A’s study, Menghao Guo’s approach also focuses on a single fault type, limiting its utility in a wider range of fault-detection applications.
The study by Winston et al. [8] introduces an innovative approach that combines feed-forward back-propagation neural network and support vector machine (SVM) techniques dedicated to accurately identifying photovoltaic (PV) modules affected by microcracks and hot spots. This approach looks at the problem of defect detection in PV panels from a new perspective. However, despite its excellent performance under specific conditions, the method is not as robust in the face of environmentally induced variations in the color deviation of infrared images. This limits its adaptability and wide application in changing real-world-application environments. Chen Z [9] proposed a novel deep residual network model trained using an adaptive moment-estimation algorithm, which aims to enhance the intelligence of PV-array fault detection and diagnosis. This model supports the accuracy of fault diagnosis by deeply analyzing the operating state of the PV system. However, despite the theoretical innovativeness of this approach, it still faces challenges in practical applications such as high data requirements, long training times, and a high demand for computational resources, which may limit its feasibility in resource-constrained environments. In addition, the model may need to be further optimized when dealing with multiple fault types in order to improve its generalization ability and robustness to changes in complex environments. The study by Vega Díaz J J [10], on the other hand, focuses on the use of images trained with three different preprocessing operations to infer the location of undetected panels from detected panels through postprocessing techniques. This method works by analyzing the area and the rotation angle of the panels in order to select appropriate contour lines and locate new panel positions by extrapolating these contour lines.
These deep learning-based defect detection algorithms have made significant progress in improving detection accuracy, but most of them focus on the detection of single faults, which somewhat limits their ability to recognize multiple faults, to cope with robustness under different environmental conditions, and to detect dense and very small targets. Therefore, although these algorithms have shown potential in theoretical and experimental tests, they still face certain challenges and limitations in practical industrial applications, particularly in scenarios that require the identification of multiple types of faults and high adaptability.
In order to further improve the model’s detection accuracy and robustness to small targets, this paper chooses to adopt YOLOv7 [11] as the baseline of the study, and based on it, we propose our YOLOv7-GX algorithm (the name of YOLOv7-GX is taken from the initial G of the GAM attention mechanism and the initial X of the XIOU loss). YOLOv7, as the current leading technology in the field of target detection, has been highly recognized by the industry for its excellent performance and wide range of application scenarios. The model demonstrates excellent target-recognition and localization capabilities through multi-scale feature fusion and advanced convolutional neural network design. Especially in practical applications such as intelligent surveillance and autonomous driving, YOLOv7 proves its efficiency and reliability.
The main contributions of this paper are as follows. (1) GSConv and depth-separable convolution techniques are introduced to optimize the traditional neck network structure and construct an innovative GhostSlimFPN network architecture. This structural optimization helps to solve the problems of excessive semantic differences and the loss or degradation of feature information that may occur between different levels of features in the original model, and effectively improves the efficiency of feature extraction and fusion. (2) A 1 × 1 convolutional block with GAM attention mechanism is proposed: this attention mechanism can automatically learn and select key features in the image to improve the model’s ability to perceive and recognize defects in PV panels. Compared with the traditional attention mechanism, the method in this paper avoids increasing the complexity of the network structure and ensures the efficiency and practicality of the model. (3) The XIOU loss function is used to replace the traditional CIOU loss function. The XIOU loss function can more accurately measure the accuracy of target detection and localization accuracy. By using the XIOU loss function, this paper enhances the robustness and convergence speed of the model, further improving the performance of target detection. (4) To address the problem of uneven sample distribution, this paper incorporates a weight-adjustment strategy. By giving different weights to different images and categories, it balances the impact of uneven sample distribution on model training and improves the detection performance of the algorithm in various categories.
2. Materials and Methods
2.1. YOLOv7-GX Model
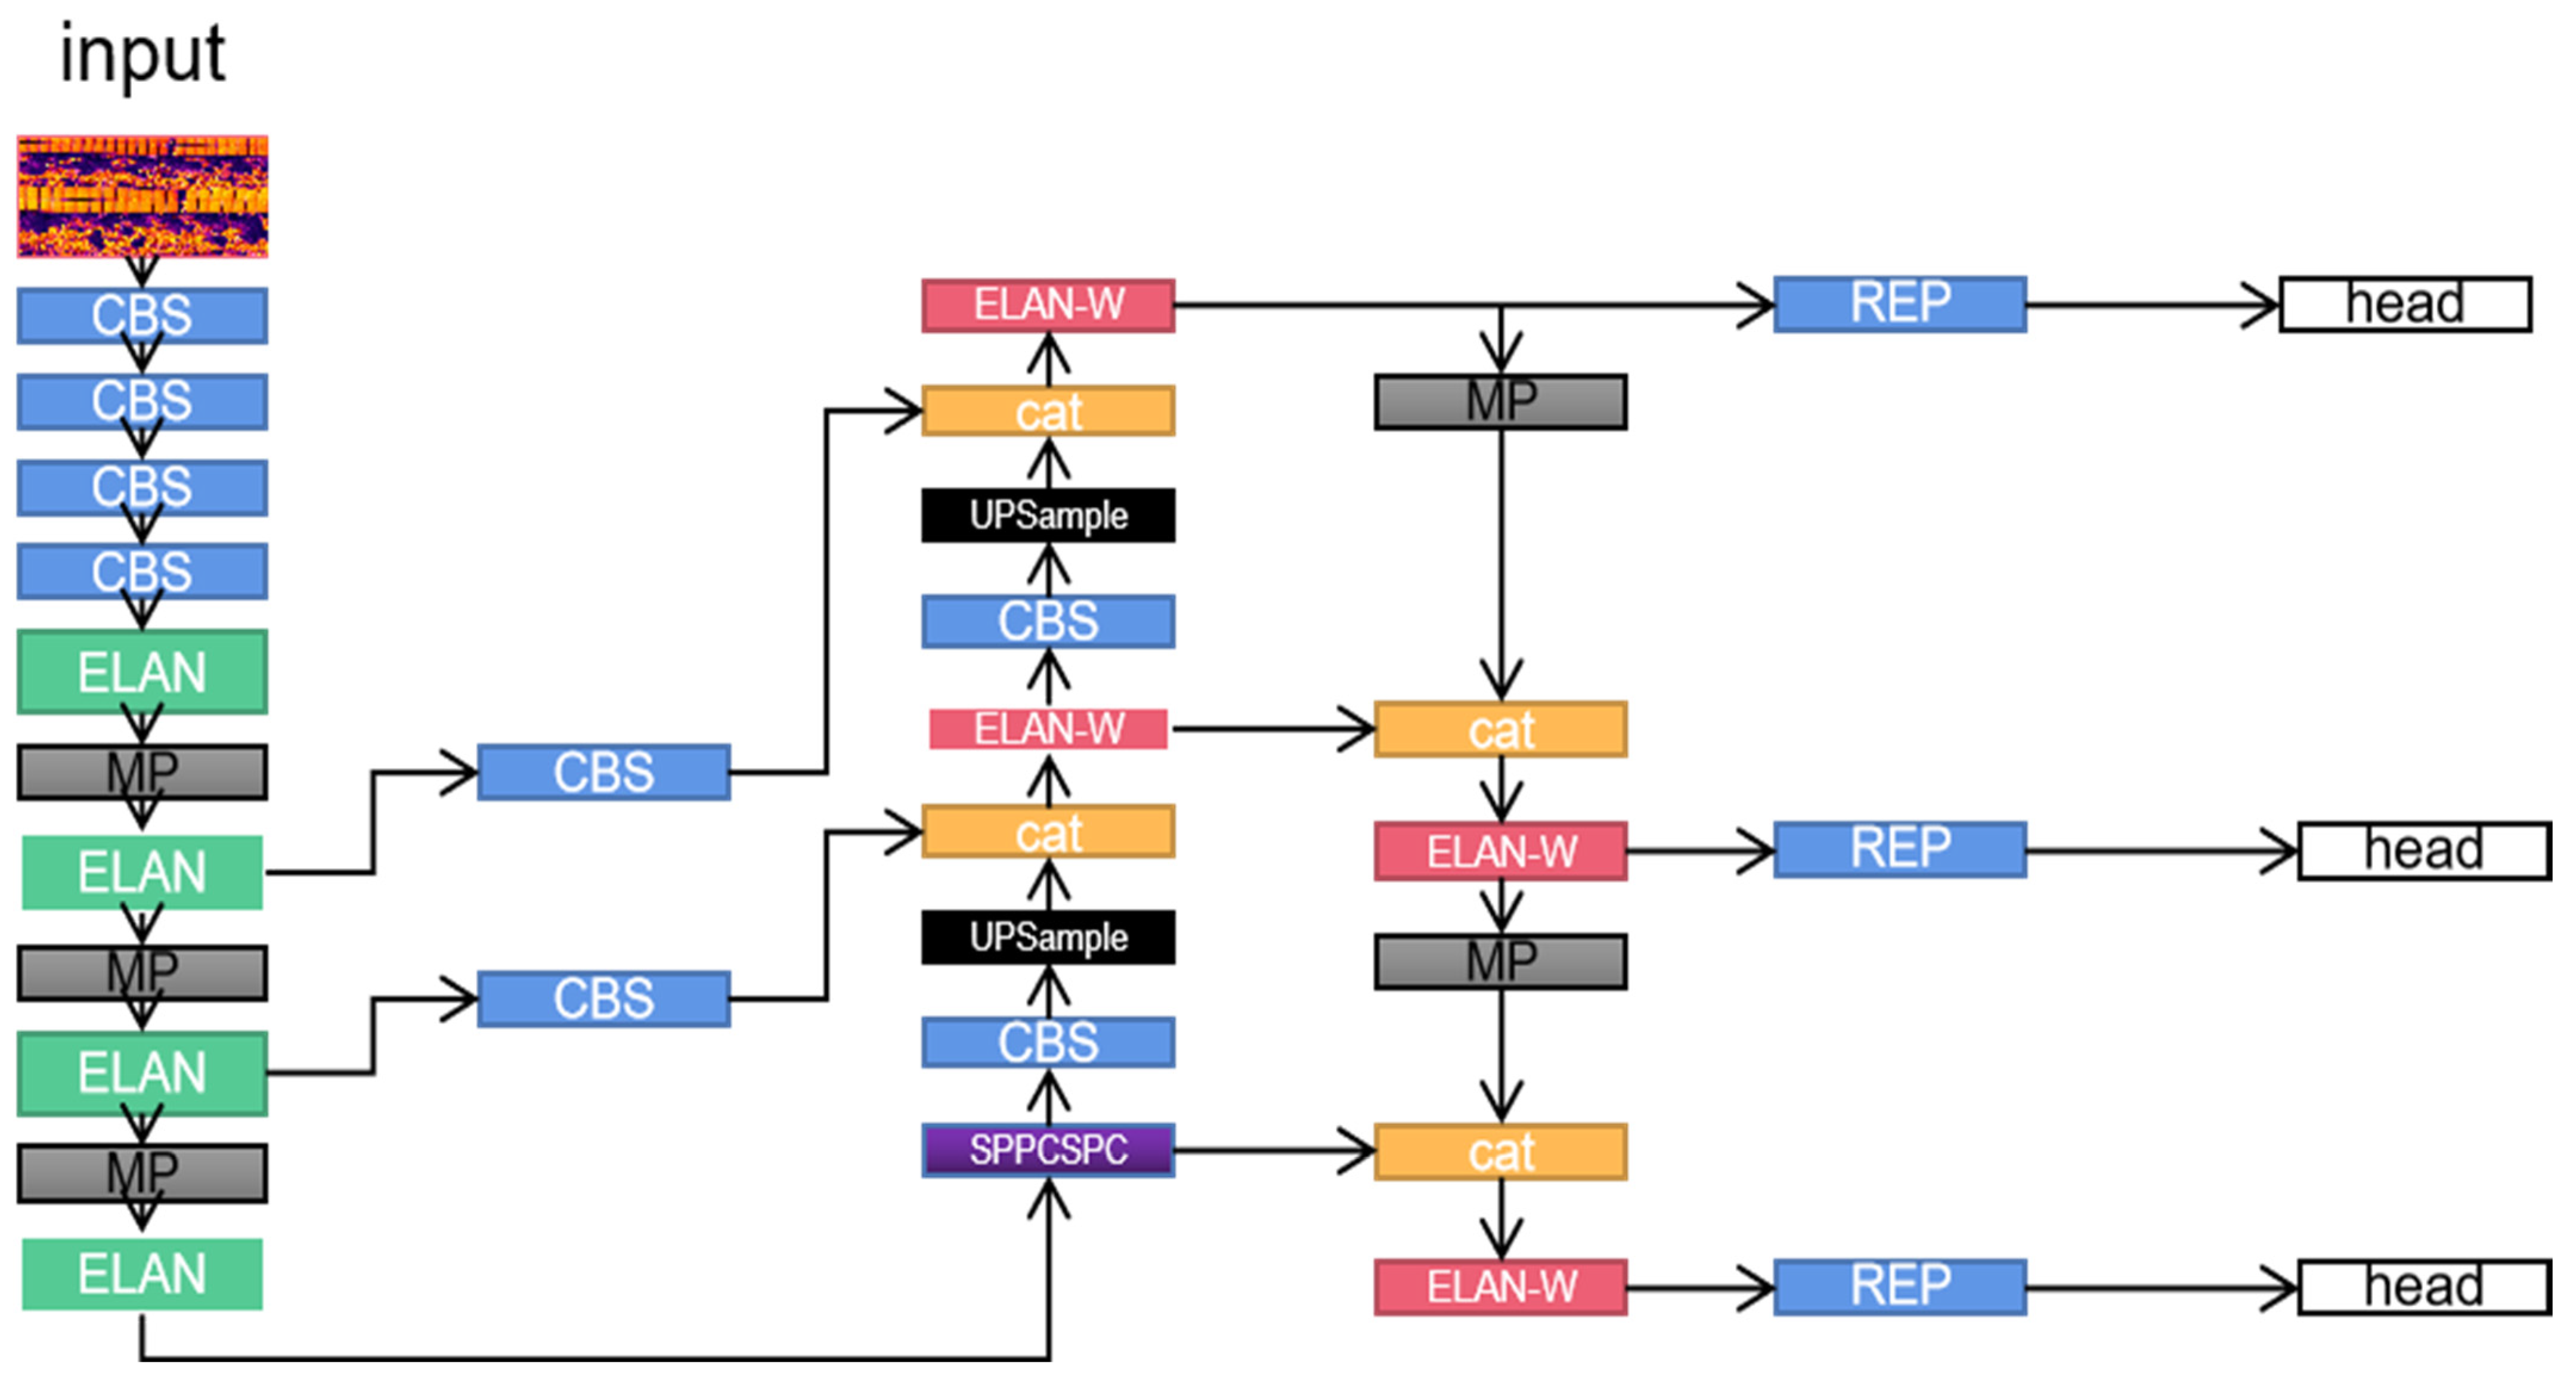
The YOLOv7 algorithm, as a typical representative of one-stage target detection algorithms, is based on deep neural networks for object recognition and localization, and has a fast running speed for real-time systems. YOLOv7 performs well in the range from 5FPS to 160FPS, and outperforms in both speed and accuracy YOLOR, YOLOX, Scaled-YOLOv4, YOLOv5, DETR, deformable DETR, DINO-5scale-R50, and many other object detectors. The main contributions of YOLOv7 include the introduction of model reparameterization into the network architecture, the adoption of the cross-grid search label-assignment strategy of YOLOv5, and the adoption of the matching strategy of YOLOX [12]. In addition, a more efficient ELAN network architecture is introduced. Meanwhile, YOLOv7 proposes an auxiliary head-training method, which improves the accuracy by increasing the training cost without affecting the inference time, since the auxiliary head only appears during the training process, as shown in Figure 1 for the model structure of YOLOv7.
Although the YOLOv7 algorithm has achieved remarkable success in terms of speed and accuracy and has become an important milestone in the field of one-stage target detection, it still faces certain challenges when dealing with a large number of dense and very small-sized targets. Especially in the defect detection dataset of photovoltaic panels involved in this study, the feature information of dense and small targets is often severely lost after the multilayer convolutional network of YOLOv7, which directly affects the model’s ability to detect tiny defects, such as hot spots.
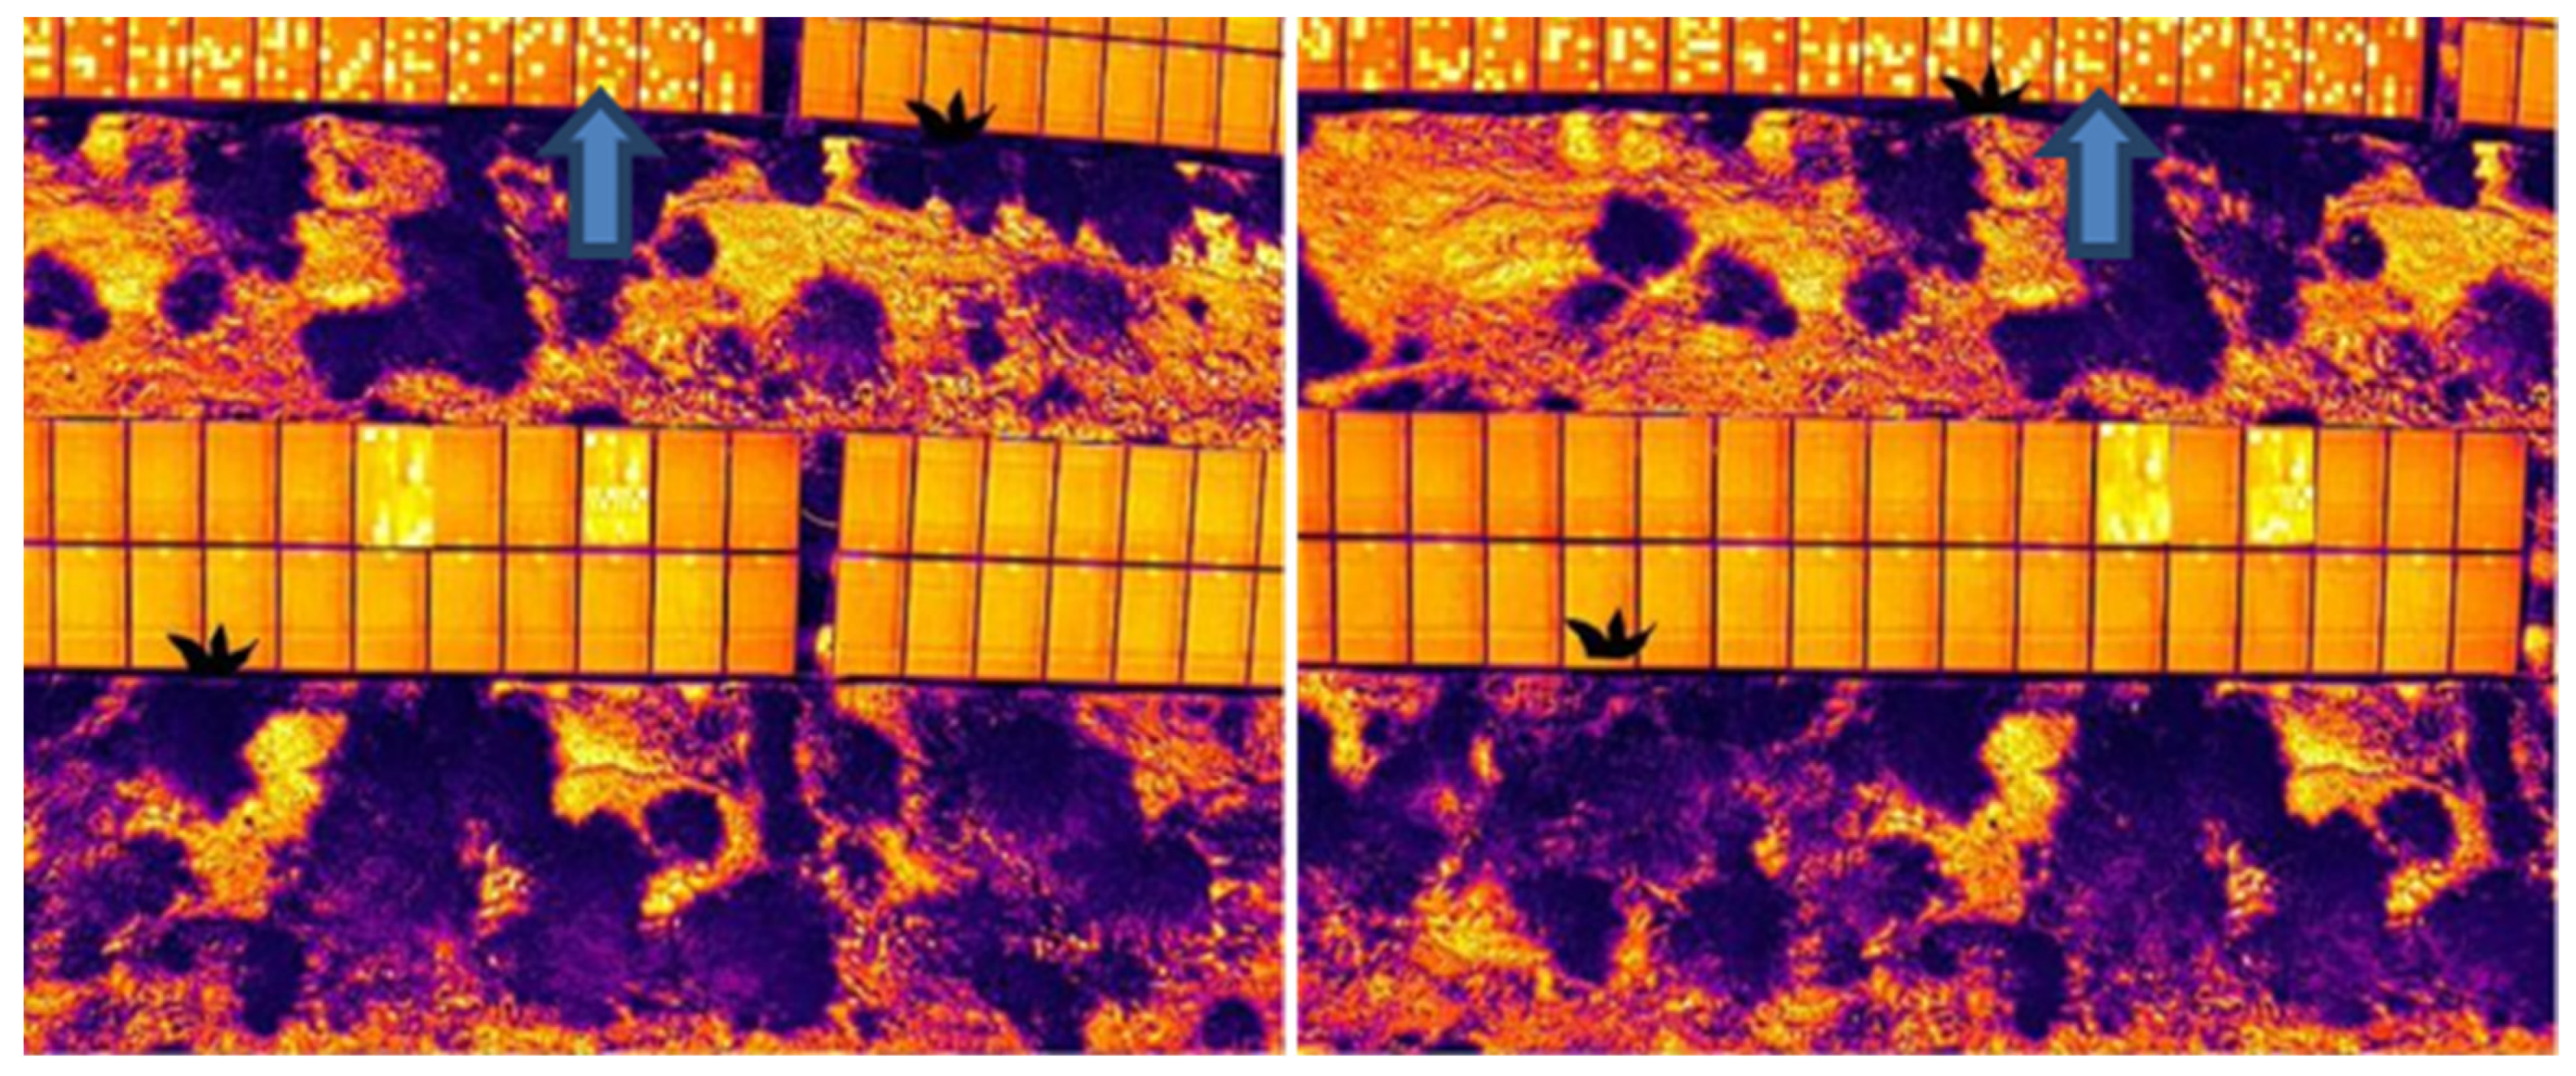
As a typical fault type in PV panels, hot spots appear as tiny bright spots in the original image, occupying a very limited number of pixels. As demonstrated by the area indicated by the blue arrow in Figure 2, these tiny bright spots represent the presence of hot-spot faults. Under the original YOLOv7 architecture, since its design focuses on balancing the detection speed and the overall target-recognition accuracy, it is easy to ignore or lose the feature information of this type of very small target when performing the deep convolutional processing, which leads to the omission of small-sized faults, such as hot spots.
To address this problem, the improved algorithm needs to enhance its ability to capture small target features while maintaining the original advantages of YOLOv7 to ensure accurate recognition of dense small targets. This involves adjusting the network architecture, optimizing the feature-fusion strategy, or introducing a more refined feature extraction mechanism. The sensitivity of the network to small-sized targets can be improved by tuning the parameters of the convolutional layers or introducing special attention mechanisms. In addition, the optimization of the feature-fusion strategy, such as the use of multi-scale feature fusion, can also effectively enhance the model’s ability to detect dense small targets.
In summary, although the YOLOv7 algorithm performs well in many aspects, it still has some limitations when dealing with specific types of dense-small-target-detection tasks. Therefore, targeted improvements to YOLOv7 to enhance its performance in specific application scenarios such as the defect detection of PV panels is an important direction of research in this paper. Through these improvements, the applicability and effectiveness of the YOLOv7 algorithm in practical applications can be further extended, especially in occasions where the accurate detection of dense small targets is required.
Standard convolution (SConv) is commonly used in deep learning models to extract image features by applying different convolution kernels to multiple channels at the same time, thus enabling the model to capture rich spatial information. However, the number of parameters required for standard convolution increases rapidly with the increase in network depth and the demand for feature extraction, resulting in computational complexity and network operation speed being the main factors limiting its application.
In contrast, depth-separable convolution (DWConv) is widely used in various network architectures. It first applies deep convolutions to each input channel independently [13], and then combines the results of these deep convolutions by 1 × 1 convolution (also known as dot convolution). This approach can significantly reduce the number of parameters and the computational burden of the model and speed up the inference. However, while reducing parameters, depth-separable convolution may also lose some of the semantic information between channels, affecting the overall accuracy of the model.
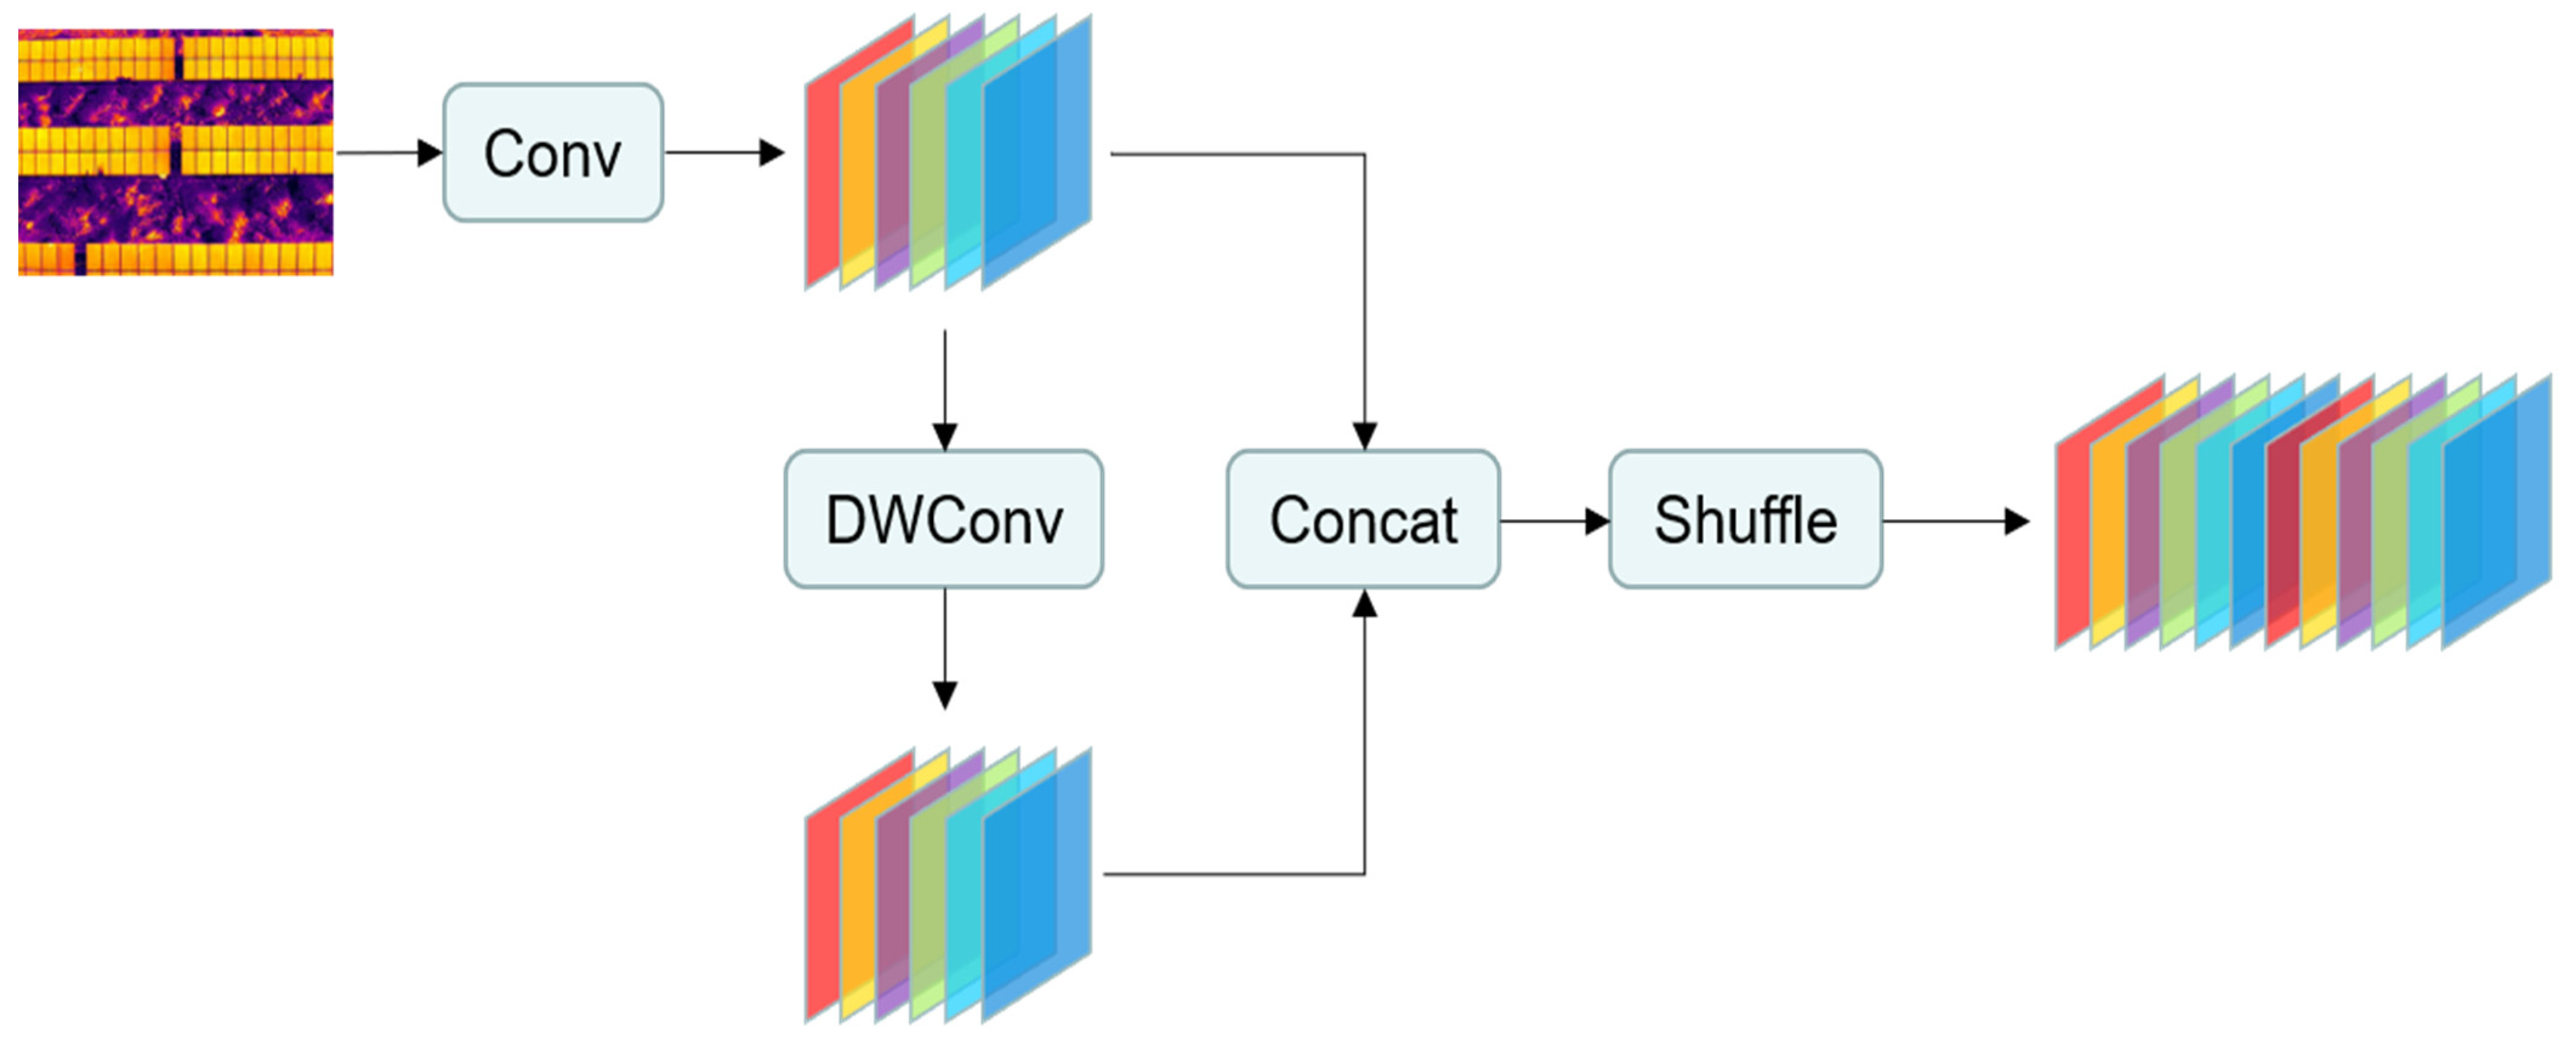
To overcome these limitations, GSConv is proposed as a novel convolutional structure [14], as shown in Figure 3, which skillfully blends the advantages of standard convolution and depth-separable convolution. GSConv effectively addresses the limitations of depth-separable convolution (DSC) in preserving the channel-information processing, which is a key drawback of DSC. While DSC reduces computational cost, it tends to separate channel information, which leads to a significant reduction in feature extraction and fusion capabilities, especially detrimental when detecting small targets. This separation hinders the ability to capture the complex details required for the model to accurately recognize small objects. In contrast, GSConv combines standard convolution (SC), DSC, and blending operations, allowing the model to reduce computational requirements while retaining information about interactions between channels. The incorporation of SC operations in GSConv ensures that depth-separated information is combined with channel-intensive features, compensating for the loss of detail encountered when using DSC alone. This design significantly improves the model’s ability to identify and accurately localize small targets, ensuring that critical spatial and feature-level details are not lost during the convolution operation. In addition, the mixing operation within GSConv ensures a homogeneous mixing of information, allowing SC-extracted features to effectively permeate the output of the DSC operation. This process ensures a more comprehensive feature representation and further enhances the model’s sensitivity to small-scale details, which is critical for detecting small targets.
By optimizing the balance between computational efficiency and model accuracy while preserving inter-channel linkages, GSConv is particularly suitable for application scenarios that require efficient real-time processing and highly accurate detection, such as PV-panel defect detection. It is able to effectively represent the fault deformation and overlap on PV panels due to variations in shooting angles, heights, and environmental conditions, providing an effective means to improve the generalization ability and robustness of the model. The introduction of this convolutional structure opens up new possibilities for the application of deep learning models in areas such as PV-panel defect detection, allowing the model to maintain a low computational complexity while effectively improving detection performance.
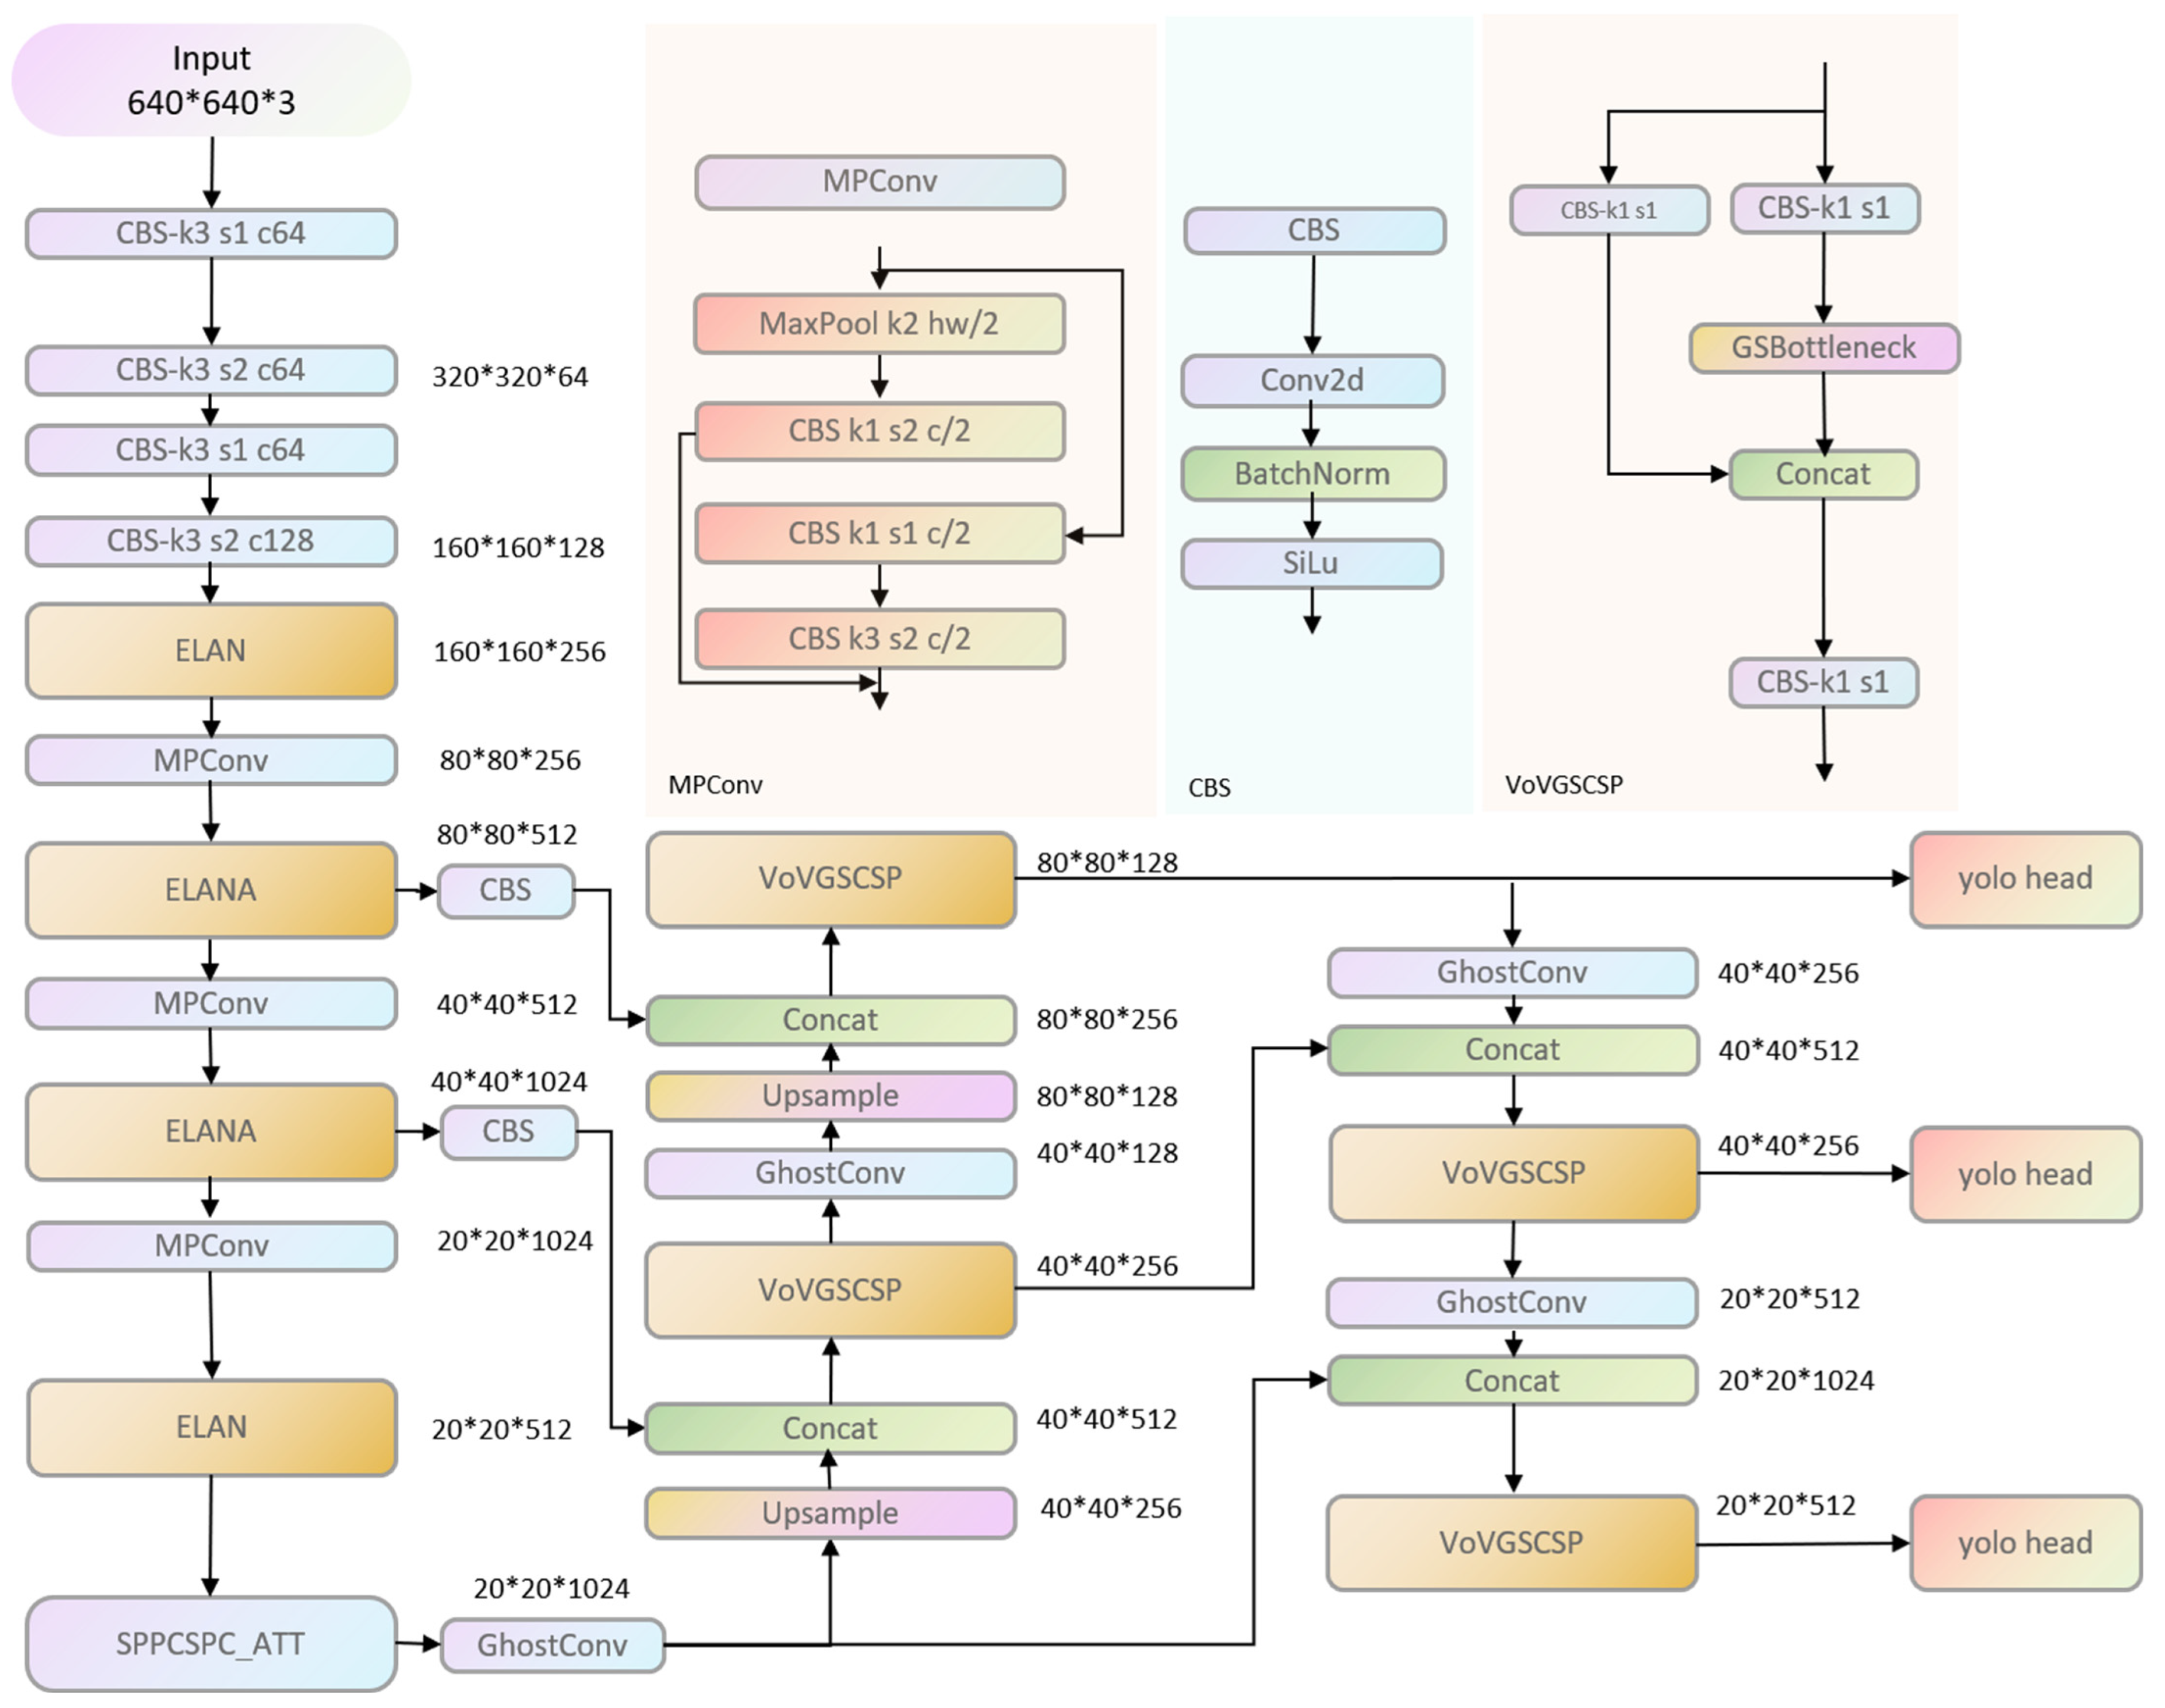
Replacing all the convolutions of the model with GSConv may significantly increase the number of layers of the model, which leads to an increase in the inference time for the PV panels. In the YOLOv7 network, the backbone layer requires enough convolution operations to extract the defect information on the PV panels. Therefore, we chose to replace the convolution operation only at the neck layer. By performing convolutional substitution at the neck layer, redundant and repetitive information can be reduced to improve the efficiency and performance of the model [15]. Such an optimization strategy can reduce the computational complexity of the model without sacrificing the accuracy of the model, making the model more feasible in resource-constrained environments [16]. Through extensive experiments, we redesigned the neck structure and proposed a new GhostSlimFPN network structure, as shown in Figure 4. This structure replaces the previous top-down and bottom-up pyramid structure in YOLOv7, which greatly compresses the number of layers of the model while ensuring that there is no loss of model accuracy, which not only reduces the computational cost, but also maintains the connectivity between the channels as much as possible [17].
2.2. Custom Convolution with GAM Attention Mechanism
The GAM attention mechanism is a method that can amplify global interaction features with reduced information dispersion [18]. A sequential channel-space attention mechanism was adopted and the CBAM sub-module was redesigned [19]. In order to effectively integrate the GAM attention mechanism into the model, while considering the computational efficiency of the model and the feasibility of practical applications, we skillfully integrated the GAM into a 1 × 1 convolutional block to form a new type of convolutional block, Conv_ATT, as shown in Figure 5. This design not only retains the advantages of 1 × 1 convolution in reducing the number of parameters and the computational burden, but also introduces the GAM attention mechanism, which enables the model to focus on and zoom in on the key features in the image more accurately, and effectively reduces the dispersion problem of the information in the process of transmission.
By integrating the GAM attention mechanism in a 1 × 1 convolutional block, Conv_ATT is able to achieve an efficient extraction and enhancement of the global features of an image, which is particularly important in tasks requiring fine characterization such as PV-panel defect detection. PV-panel defects, such as tiny occlusions and hot spots, often occupy a very small area in the image and are not easy to clearly distinguish, and the introduction of the GAM mechanism can help the model better recognize these subtle differences, thus improving the accuracy and reliability of detection.
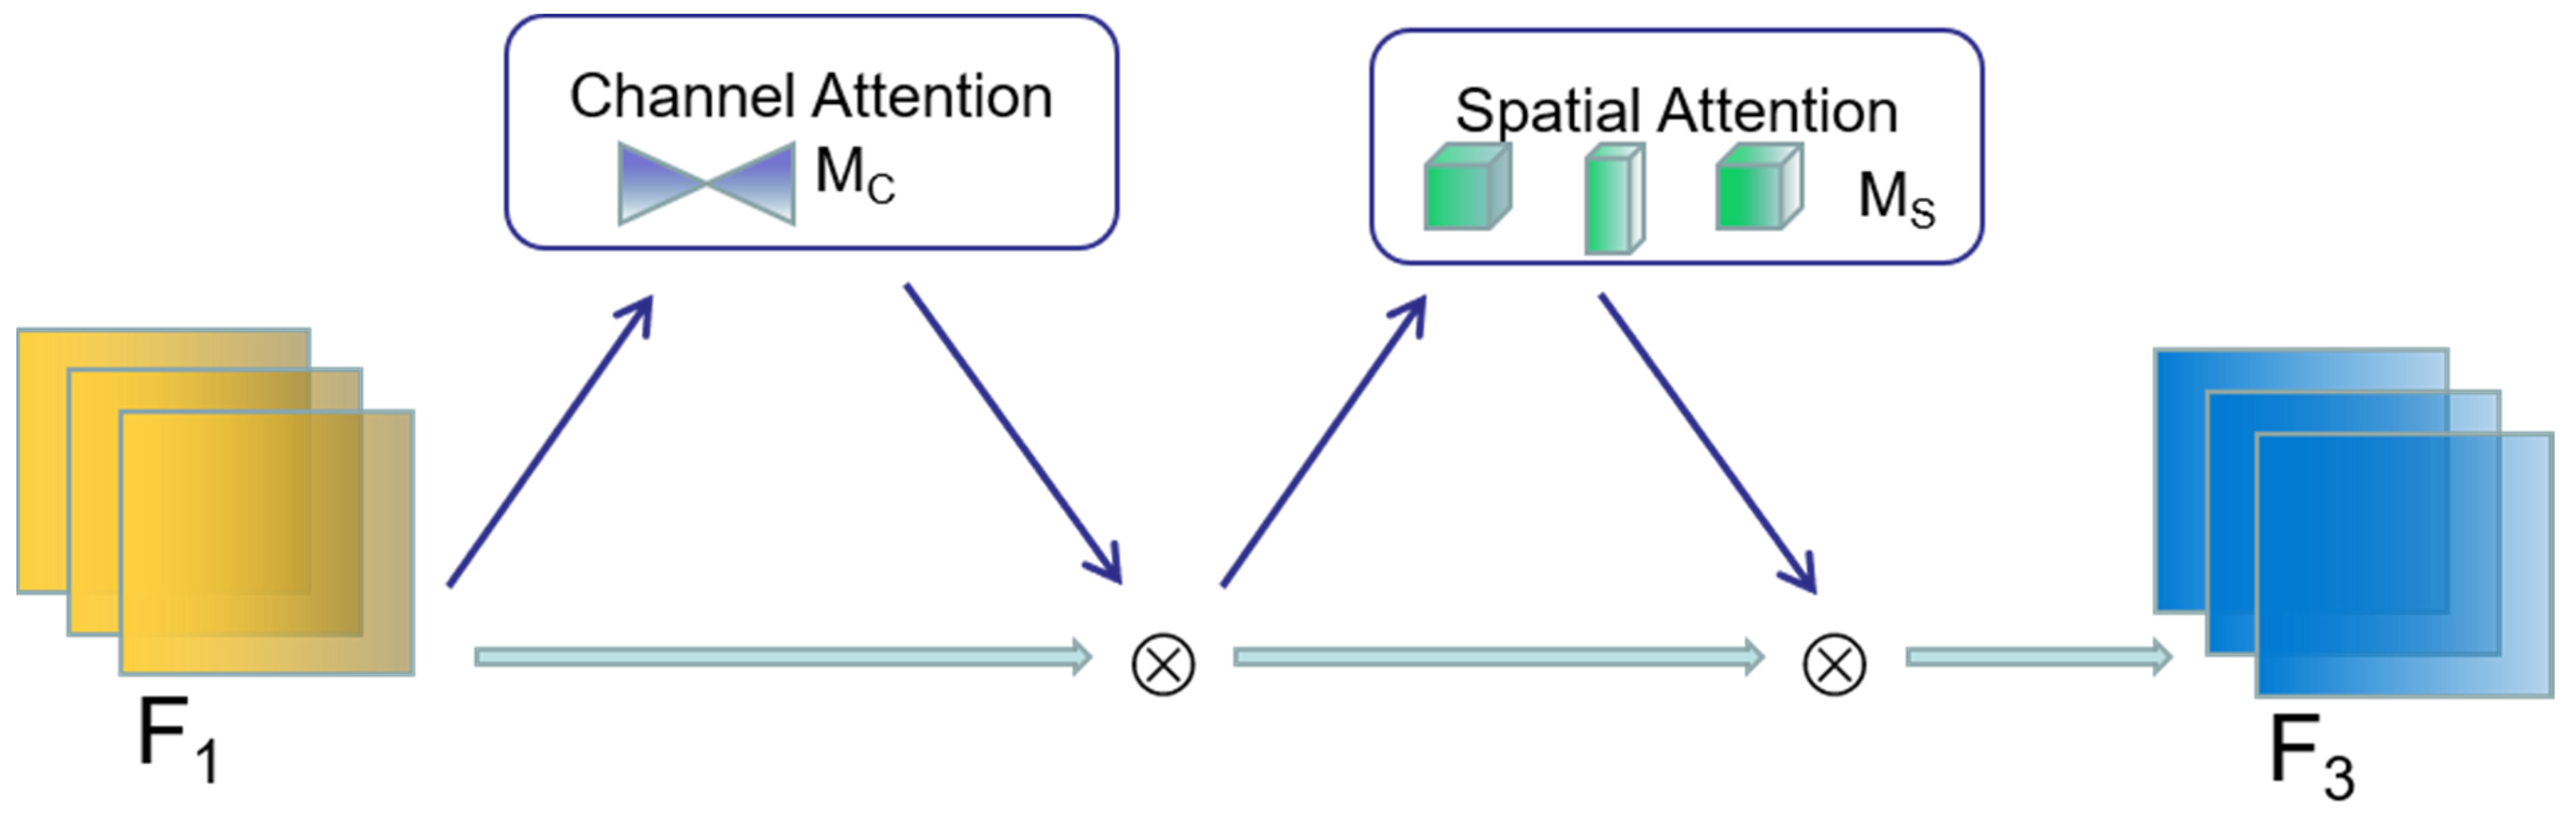
In deep learning models, especially those used for image recognition and target detection, the introduction of the attention mechanism has become one of the most important methods to enhance the performance of the model. The GAM attention mechanism effectively enhances the model’s ability to understand and capture the global features of an image through the design of its channel-attention sub-module and spatial-attention sub-module.
In the GAM attention mechanism (e.g., Figure 6), given an input feature map an intermediate feature map and an output feature map F3, are defined as
where and denote channel-attention and spatial-attention feature mapping, respectively; and ⨂ denotes the multiplication operation by element.
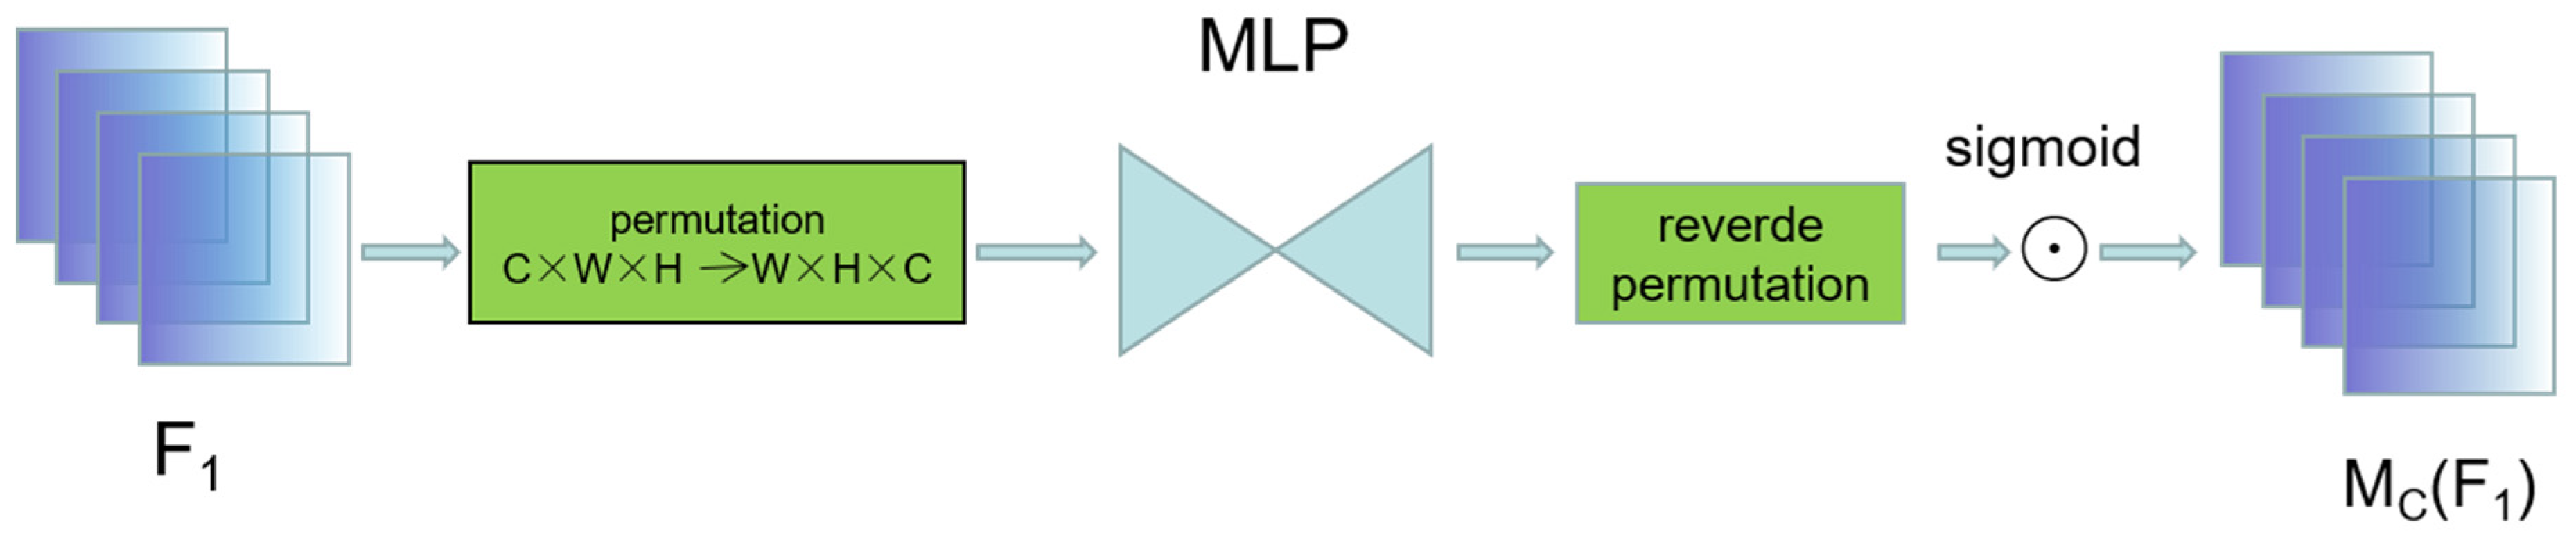
The channel-attention sub-module effectively preserves the three-dimensional information of the input features by employing a three-dimensional arrangement, as shown in Figure 7. This design enables the module to strengthen the cross-dimensional channel-space dependencies while preserving the spatial information. By applying a two-layer MLP (multilayer perceptron), the sub-module not only amplifies the inter-channel correlations, but also enhances the model’s ability to perceive different spatial location information. The encoder–decoder structure adopted by the MLP further optimizes the use of parameters with the help of the reduction ratio r, which ensures the efficient transfer and processing of information.
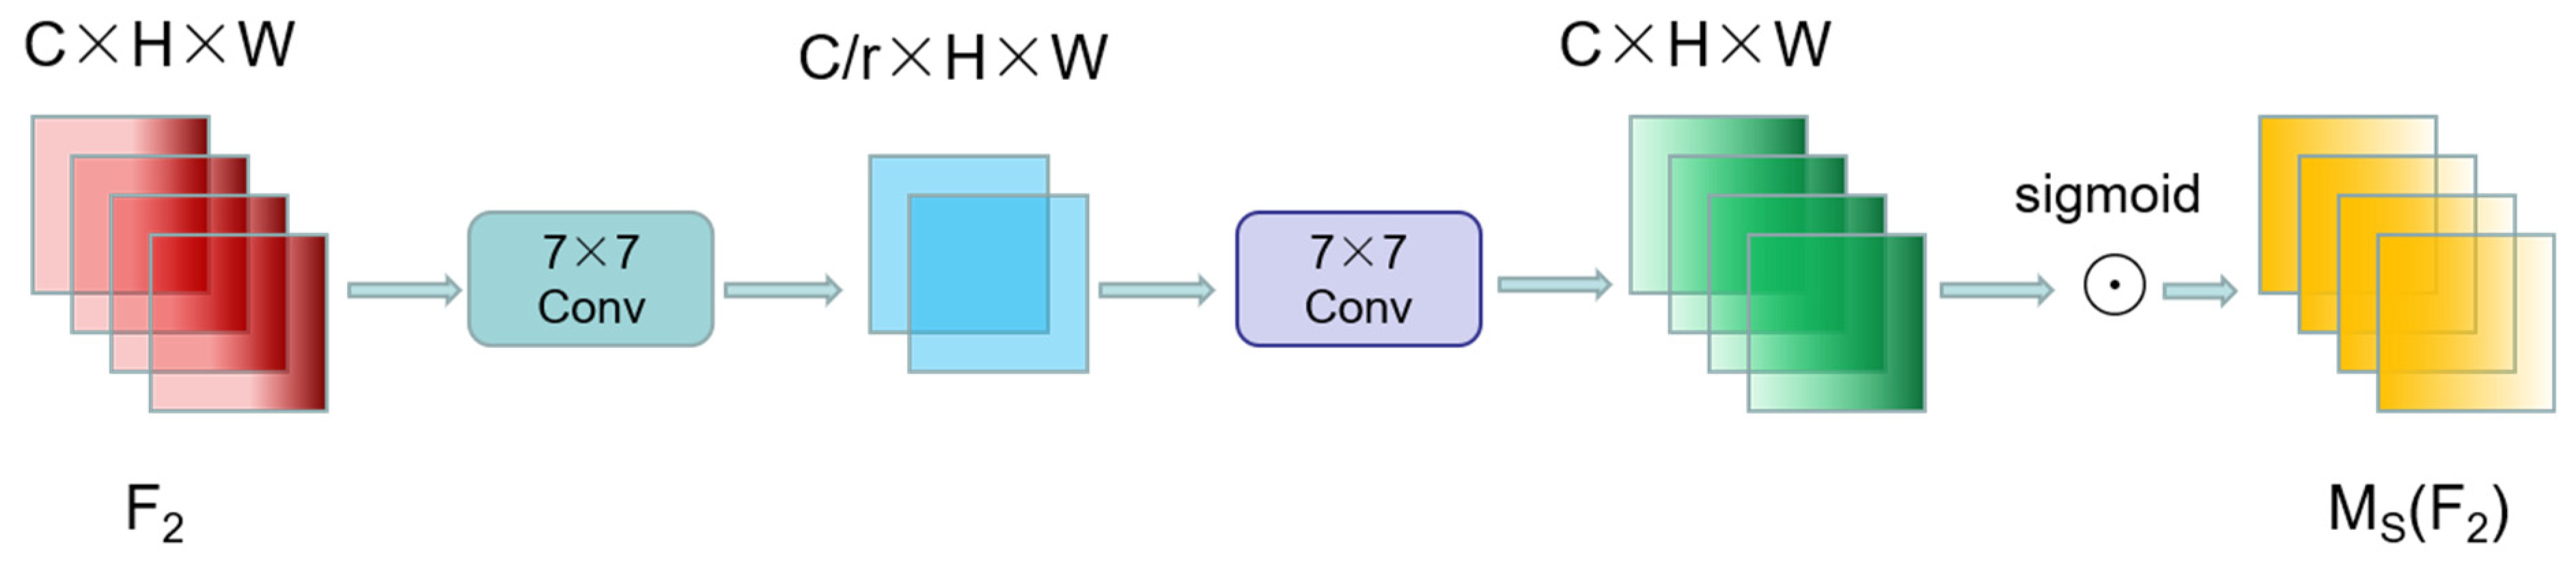
The spatial-attention sub-module focuses on capturing and fusing spatial information. By using two convolutional layers, this sub-module effectively fuses spatial information from different locations, enhancing the model’s understanding of the spatial features of the image. Similar to the channel-attention sub-module, the spatial-attention sub-module also employs a reduced ratio r to maintain the efficiency and accuracy of information processing. Notably, in order to avoid the possible loss of information from the maximum pooling operation, this sub-module removes the pooling step to further preserve the feature mapping.
In order to balance the number of parameters of the model and the computational efficiency, the spatial attention sub-module employs group convolution with channel shuffle in models such as ResNet50. This design aims to optimize the model’s parameter usage while maintaining or improving the model’s ability to capture spatial features through the group processing of group convolution and the channel shuffling of channel shuffle.
With these well-designed sub-modules, the GAM attention mechanism provides an effective way for deep learning models to enhance their understanding of image channels and spatial information. The introduction of this mechanism will undoubtedly ensure the efficiency of the model while significantly improving its performance in complex image-processing tasks, especially in the fields of target detection and image recognition. The spatial-attention sub-module without group convolution is shown in Figure 8.
2.3. Loss Function
YOLOv7 incorporates a boundary regression loss function known as CIOU that considers three critical geometric aspects: the intersecting area, the center-point distance, and the aspect ratio between predicted and actual bounding boxes. The CIOU metric evaluates the shared area between the predicted and actual boxes, calculates the Euclidean distance between their centers, and considers the angle difference related to their aspect ratios against the IOU metric [20]. The formula for the CIOU loss is expressed as follows:
Nevertheless, the utilization of the arctan function in the last term of the loss, intended as a penalty for aspect ratio variance, introduces a couple of issues impacting the speed of convergence and the stability of the . The sensitivity of this term to outliers can cause significant swings in the value range of the loss function, undermining its effectiveness. Furthermore, the output range of the arctan function does not align with the normalization standards set for the loss function. The need to incorporate additional coefficients for the numerical normalization of this penalty term also contributes to a rise in computational demand.
Based on the above, we designed a more efficient loss function, the regression loss function. The loss function serves as an improvement of the overlap metric between the bounding boxes. The loss function introduces an additional parameter tuning on top of the loss, which also takes into account the shape factor of the bounding boxes through the convex diagonal loss. Specifically, the loss function introduces two additional parameters, and , which are calculated by applying Sigmoid functions to the width and height of the bounding box. By adjusting the terms in the calculation formula, the loss function provides a more accurate measure of the bounding box overlap. The formula is as follows:
From Equations (6)–(8), it can be seen that the loss function introduces the and parameters in the parameter-tuning section, which is obtained by calculating the Sigmoid function for the width and height of the bounding box. These two parameters are used to adjust the terms in the equation when calculating the to provide a more accurate loss metric.
The proposal of the XIOU loss function not only effectively improves the problems in the CIOU loss, but also provides a more accurate and robust bounding box regression loss-calculation method for the target-detection model. By applying the XIOU loss function in advanced target-detection models such as YOLOv7, the performance of the model in various detection tasks can be further improved, especially in the precise localization and the handling of scenarios with large variations in target aspect ratios, which show significant advantages.
2.4. Weighting Strategies
In order to solve the sample imbalance problem in the target-detection task, we introduced the methods of category-weight calculation and image-weight calculation in the implementation of the YOLOv7 model. These two methods can effectively adjust the model’s focus on different categories and images, thus improving the accuracy and performance of target detection. In category-weight calculation, we assigned appropriate weights to different categories based on the distribution of each category in the training data [21]. By analyzing the training-label data, we counted the number of occurrences of each category in the training data to obtain the frequency information of the categories. In order to avoid the impact of certain categories not appearing in the training data on the weight calculation, we processed the categories with zero occurrences. Specifically, we replaced the weights of these empty categories with a default value to ensure that they play an appropriate role in the weight calculation. In addition, this is done to improve the detection accuracy of the “hotspot”, which is a small target and difficult to detect in this dataset sample. In order to improve the detection accuracy of “hot spot”, we adjusted the weight of the category “hot spot” by doubling its original weight to increase its importance in the training process.
Equation (9) is the category of frequency statistics, where is the number of times the ith category appears in the training set and is the ith category. Equation (10) deals with the empty categories; for the categories that do not appear, their frequency is set to 1. Equation (11) is the category-weight adjustment; for a specific category “hot spot”, we doubled its weight by . Equation (12) is the calculation of the inverse frequency weights. Equation (13) is the weight normalization, where is the total number of categories.
In addition to category-weight computation, we also introduced the method of image-weight computation to better handle the sample-imbalance problem at the image level. By analyzing the distribution of each category in each image in the training data, the weights of each image were calculated. These image weights can be used to adjust how much attention the model pays to different images, thus balancing the importance of different images in the training process [22]. Specifically, we calculated a category-weighted sum for each image based on the category weights and the number of occurrences of each category in each image. Then, by processing and normalizing the category-weighted sum appropriately, we obtained the final weight values for each image. With the introduction of category-weight calculation and image-weight calculation, we are able to better deal with the sample-imbalance problem during the training process and improve the performance and accuracy of the target-detection algorithm. These methods were applied in the YOLOv7-GX model and achieved significant improvements.
3. Results
3.1. Experimental Environment
To complete the experiment, we used the PyTorch framework. The experimental conditions were the following: Ubuntu 20.04 operating system, Python 3.8, PyTorch 1.10.0, and RTXA5000 GPU (Nvidia Corporation, Santa Clara, CA, USA) with 24 GB of video memory. The batch size was 16 and the number of epochs was 100.
3.2. Datasets
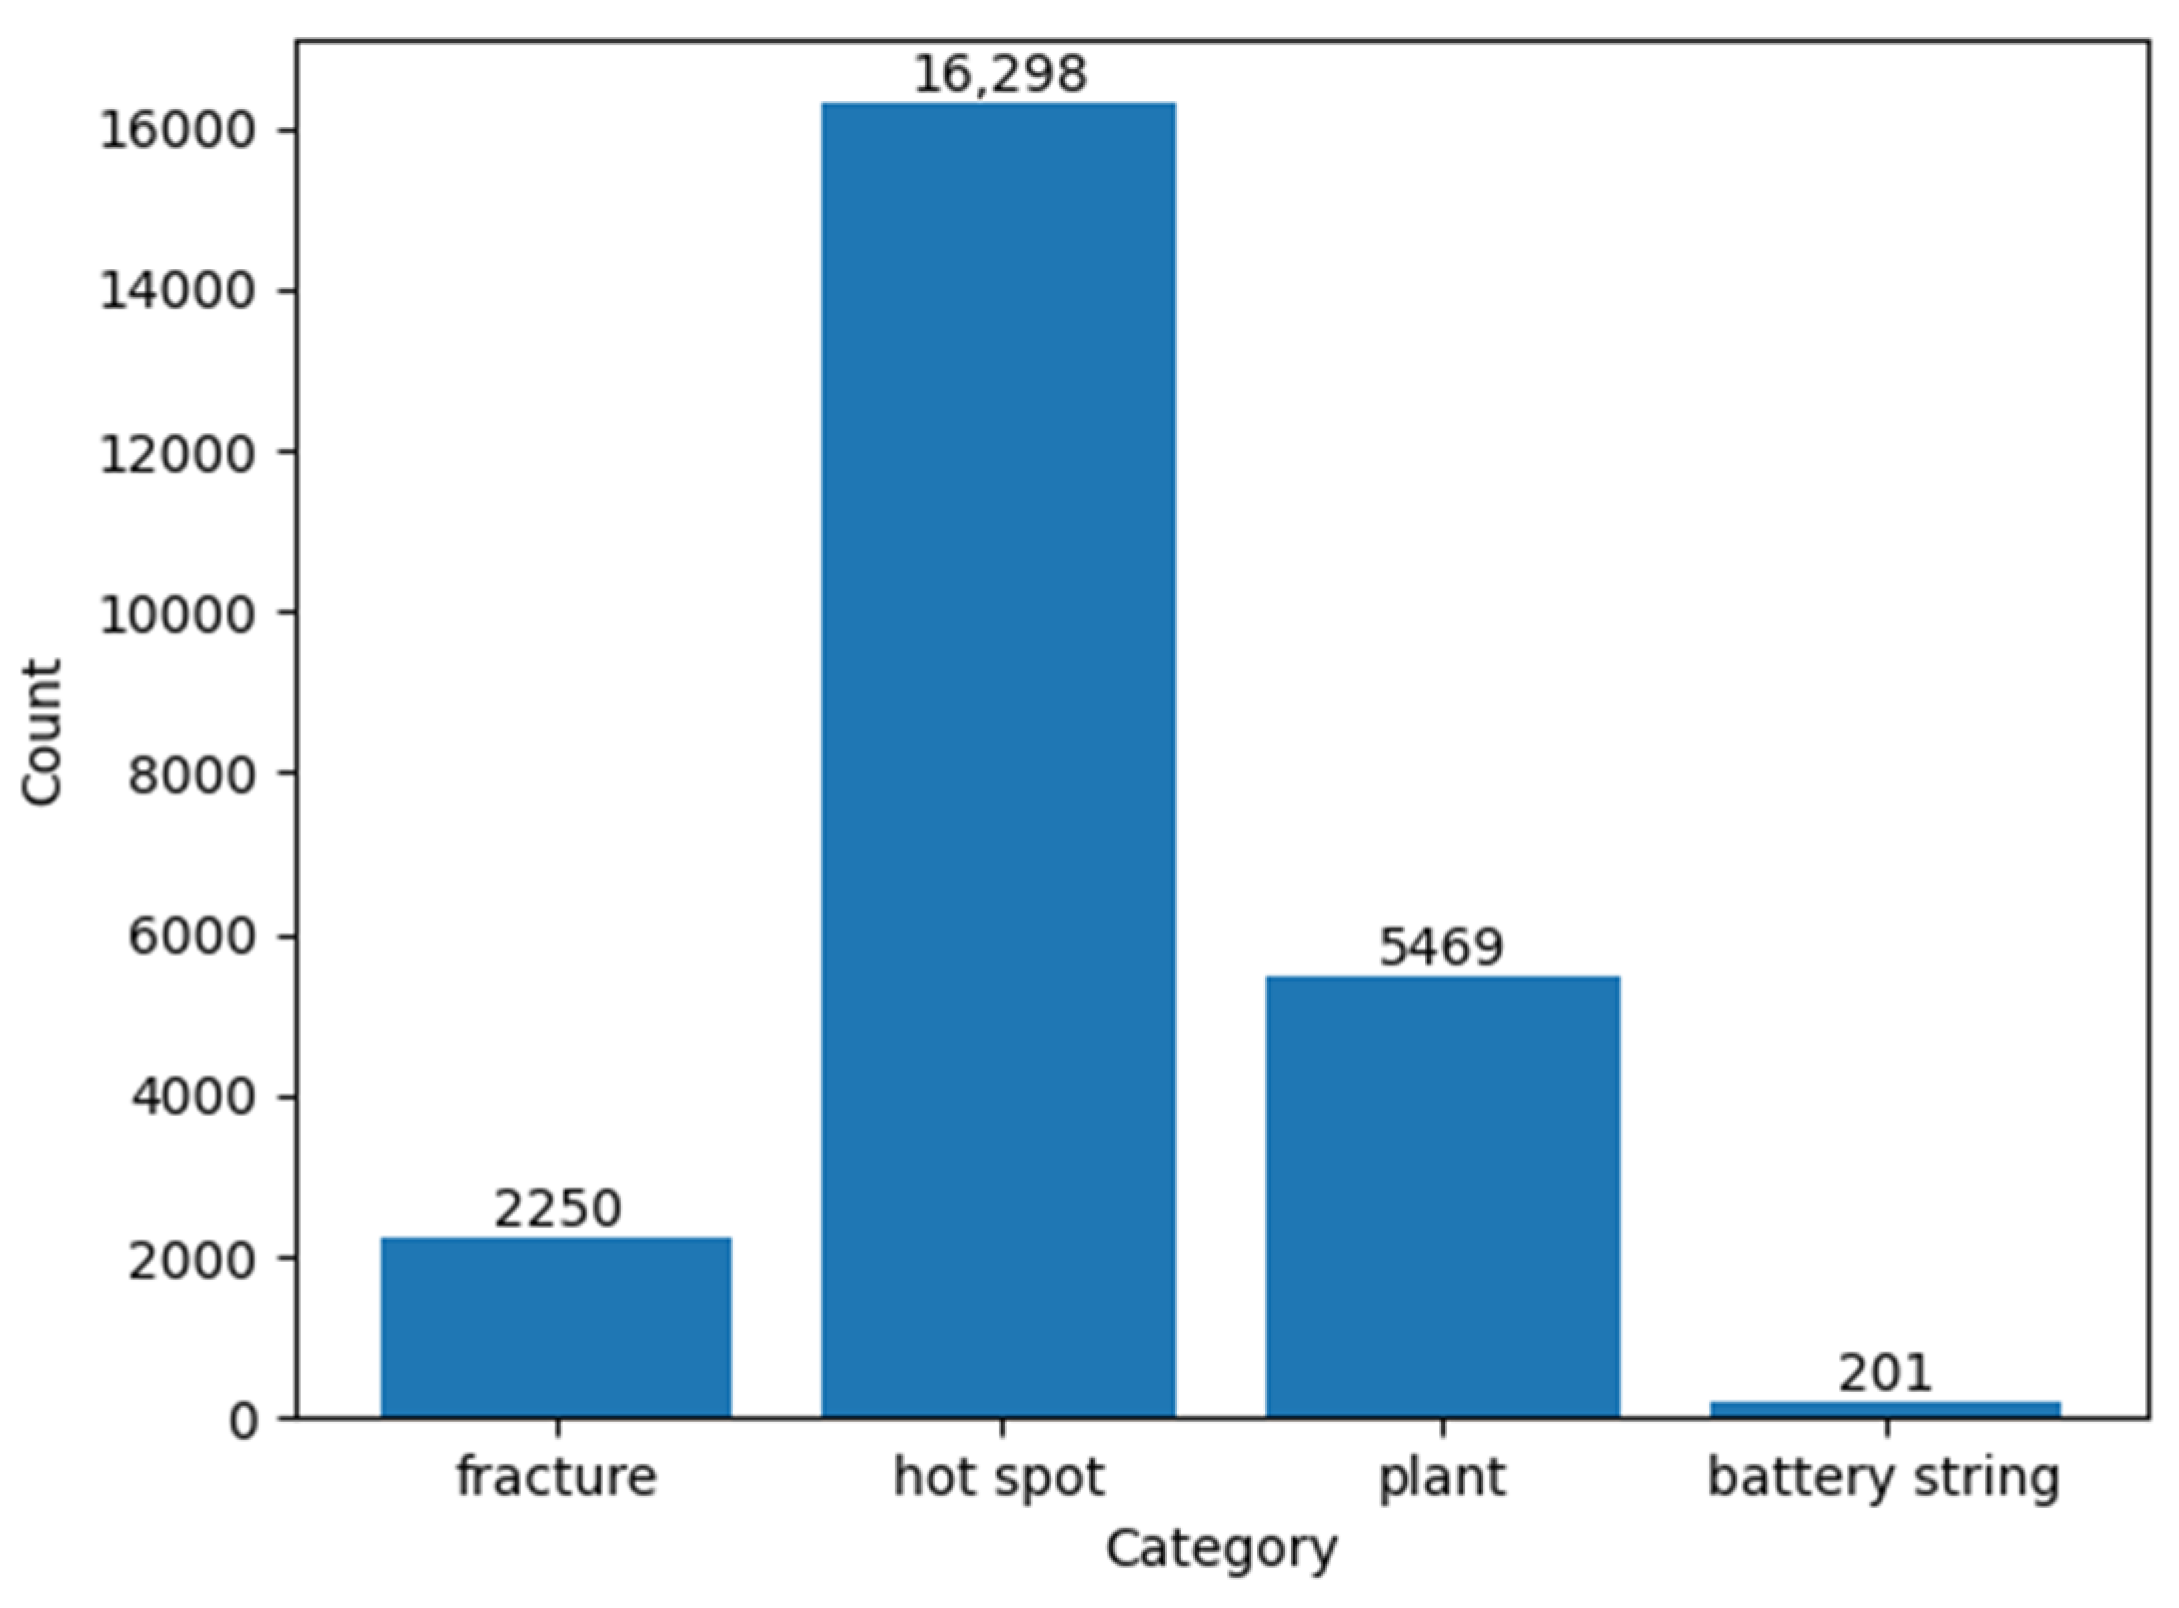
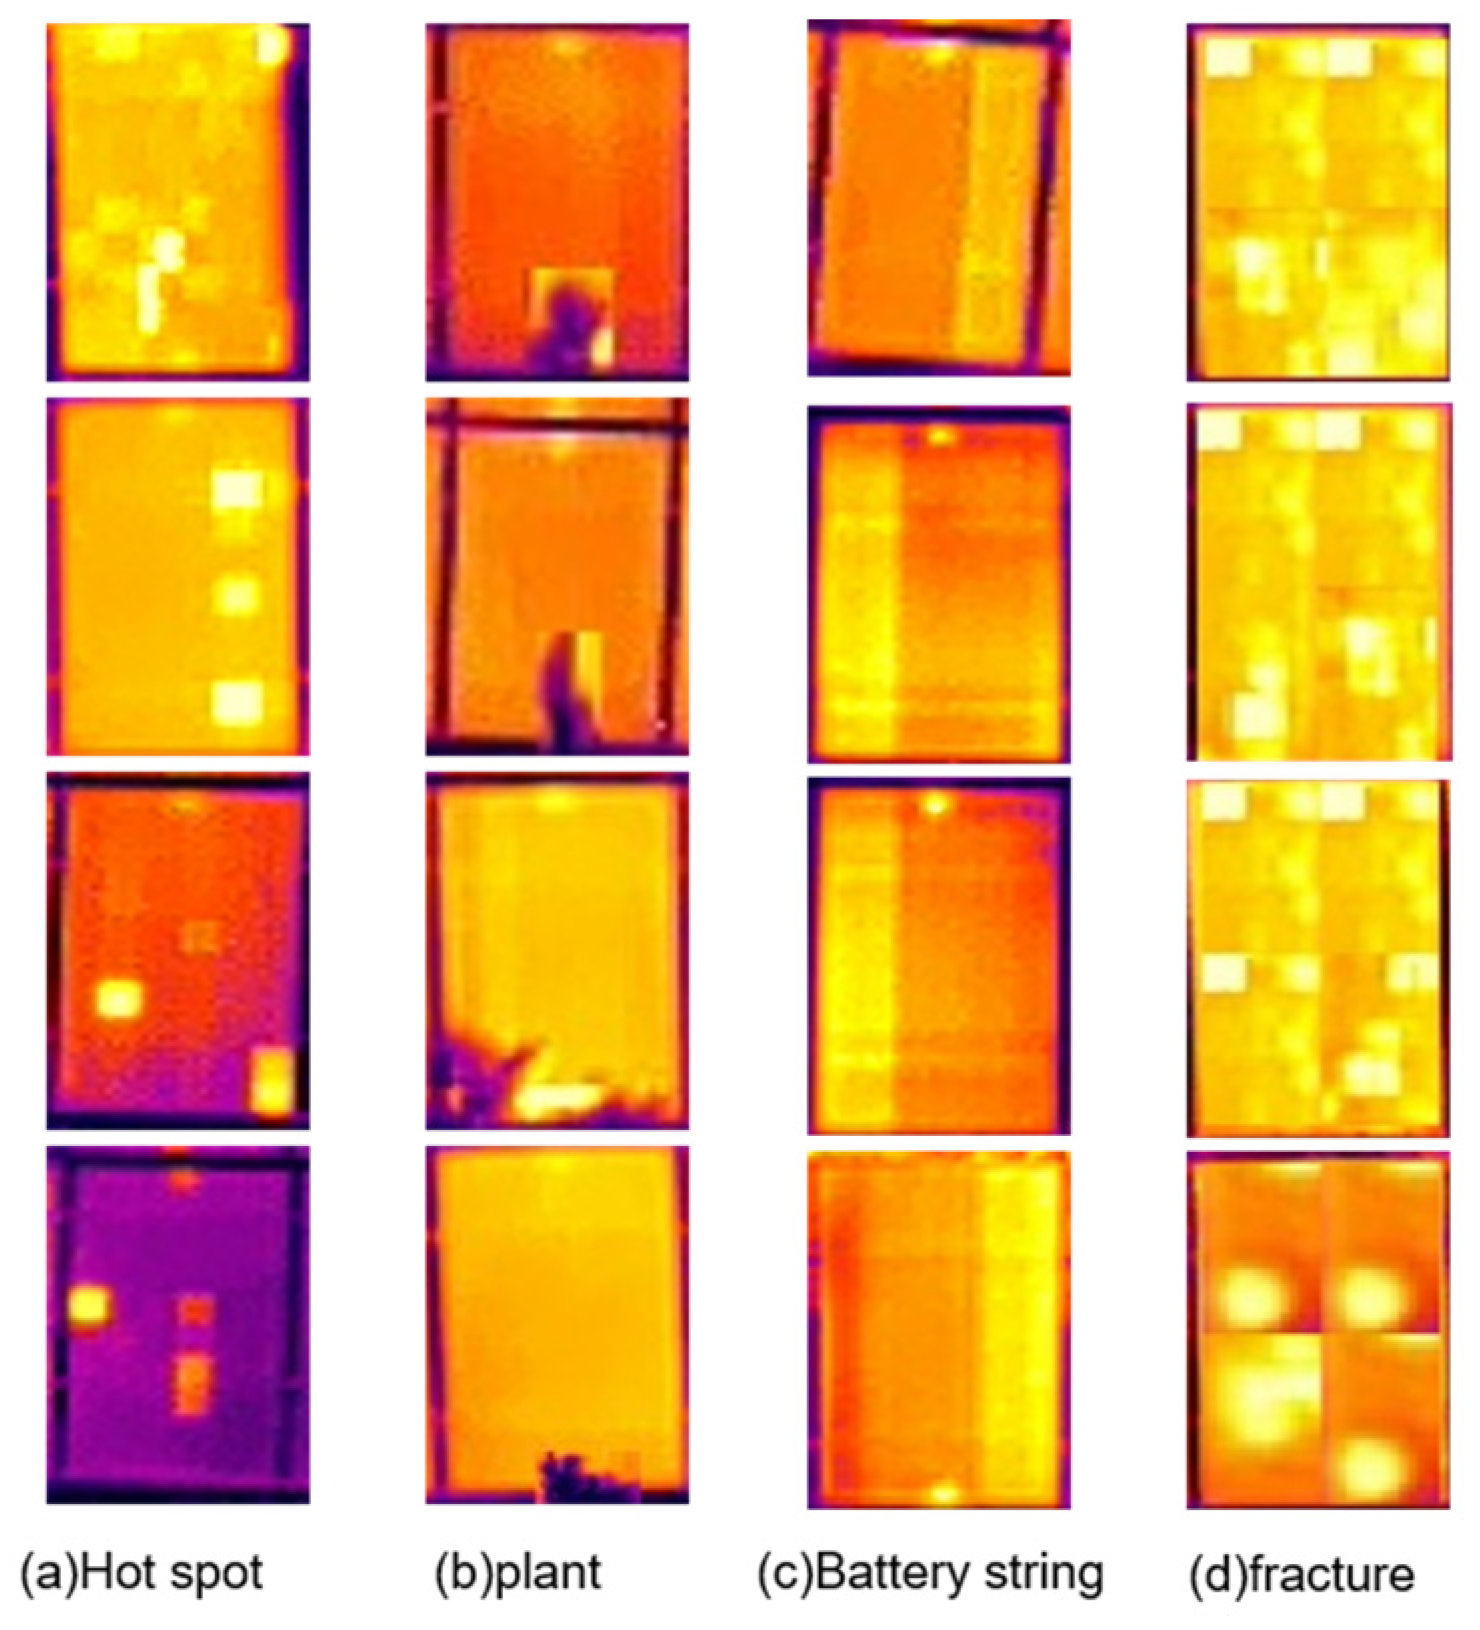
The dataset used in this study was collected from 13 large power stations by the cooperative enterprises of the group using drones carrying infrared cameras. In order to improve the accuracy of detection, we selected 2261 infrared images from the original dataset as the original images for this study. In the original dataset, we used a labelimg tool to manually annotate four types of faults, namely fractures, hot spots, plants, and battery strings. The fracture and battery-string faults were labeled according to the size of the PV module, and the plant shading and hot spot are labeled according to their size. In addition, we did not label positive samples with unclear pixel regions to prevent overfitting in neural networks [23], and the final dataset was stored in the Pascal VOC dataset format. In the whole dataset, we labeled a total of 24,218 labels. Figure 11 illustrates the distribution of labels, while Figure 12 shows the feature maps for the four fault types. These labels and feature maps provide the basis and reference for subsequent studies.
We allocated the dataset in a ratio of 8:2, where 80% of the data was randomly selected for training the network model and the remaining 20% was selected for validation and testing. In this experiment, the SGD optimizer is used for optimization and training by default, the YOLOV7-GX network parameters are initialized, the input image size is 640 × 640, the initial learning rate is set to 0.01, and OneCycleLR is used to reduce the learning rate to further stabilize the training process, and in order to guide the model to learn smoothly in the initial stage of training and provide a better initialization state for the model, an optimization process is performed at the beginning of the training. At the same time, in order to smoothly guide the model learning in the initial stage of training and to provide a better initialization state for the model, a “warmup” strategy [24] is carried out at the beginning of training to warm up the model (warmup = 3).
3.3. Evaluation Indicators
By comparing the difference in the detection of several types of images by the network model before and after the improvement in the same experimental environment to assess the leakage and false detection, this paper mainly selects three indicators to measure the performance of the network, the average accuracy (AP), the recall (R) and the average precision (mAP), which are calculated using the following formulas:
In this context, is indicative of accurate predictions, FP denotes incorrect predictions encompassing missed and ignored targets, and FN points to the erroneous classification of a target into a different category. Precision (P) quantifies the proportion of accurate predictions among all the positive predictions made. Conversely, recall (R) gauges the fraction of actual positive samples that were correctly identified. A precision–recall (P-R) curve is plotted with precision and recall on the axes, defining an area equivalent to the average precision (AP). To assess the overall efficacy of the object detection model, the mean AP across all categories is computed, yielding the metric mean average precision (mAP).
By comparing the detection performance of the network model for different types of images under the same experimental conditions before and after the improvement, the leakage and false detection of the model as well as the overall detection accuracy and recall ability can be specifically analyzed. Using the three metrics of recall, AP, and mAP, the performance improvement of the model can be comprehensively evaluated to verify the effectiveness of the network improvement. In the experimental results, the improvement of the model’s accuracy in detecting the fault types of PV panels can be visualized by increasing the mAP value, especially for the small targets that are difficult to detect, such as “hot spots”, etc., and the improvement of these indexes better reflects the significance of the model’s improvement.
3.4. Experimental Results and Analysis
3.4.1. Comparison with Other Algorithms
In this study, in order to validate the effectiveness of our proposed YOLOv7-GX model for PV-panel defect detection, we compare it with several current leading models. These models include YOLOv5s, YOLOX, YOLOv7, and YOLOv8, all of which show their respective advantages in our evaluation metrics. However, by introducing an improved feature extraction and fusion mechanism, YOLOv7-GX achieves significant performance gains in all metrics. The experimental results are shown in Table 1.
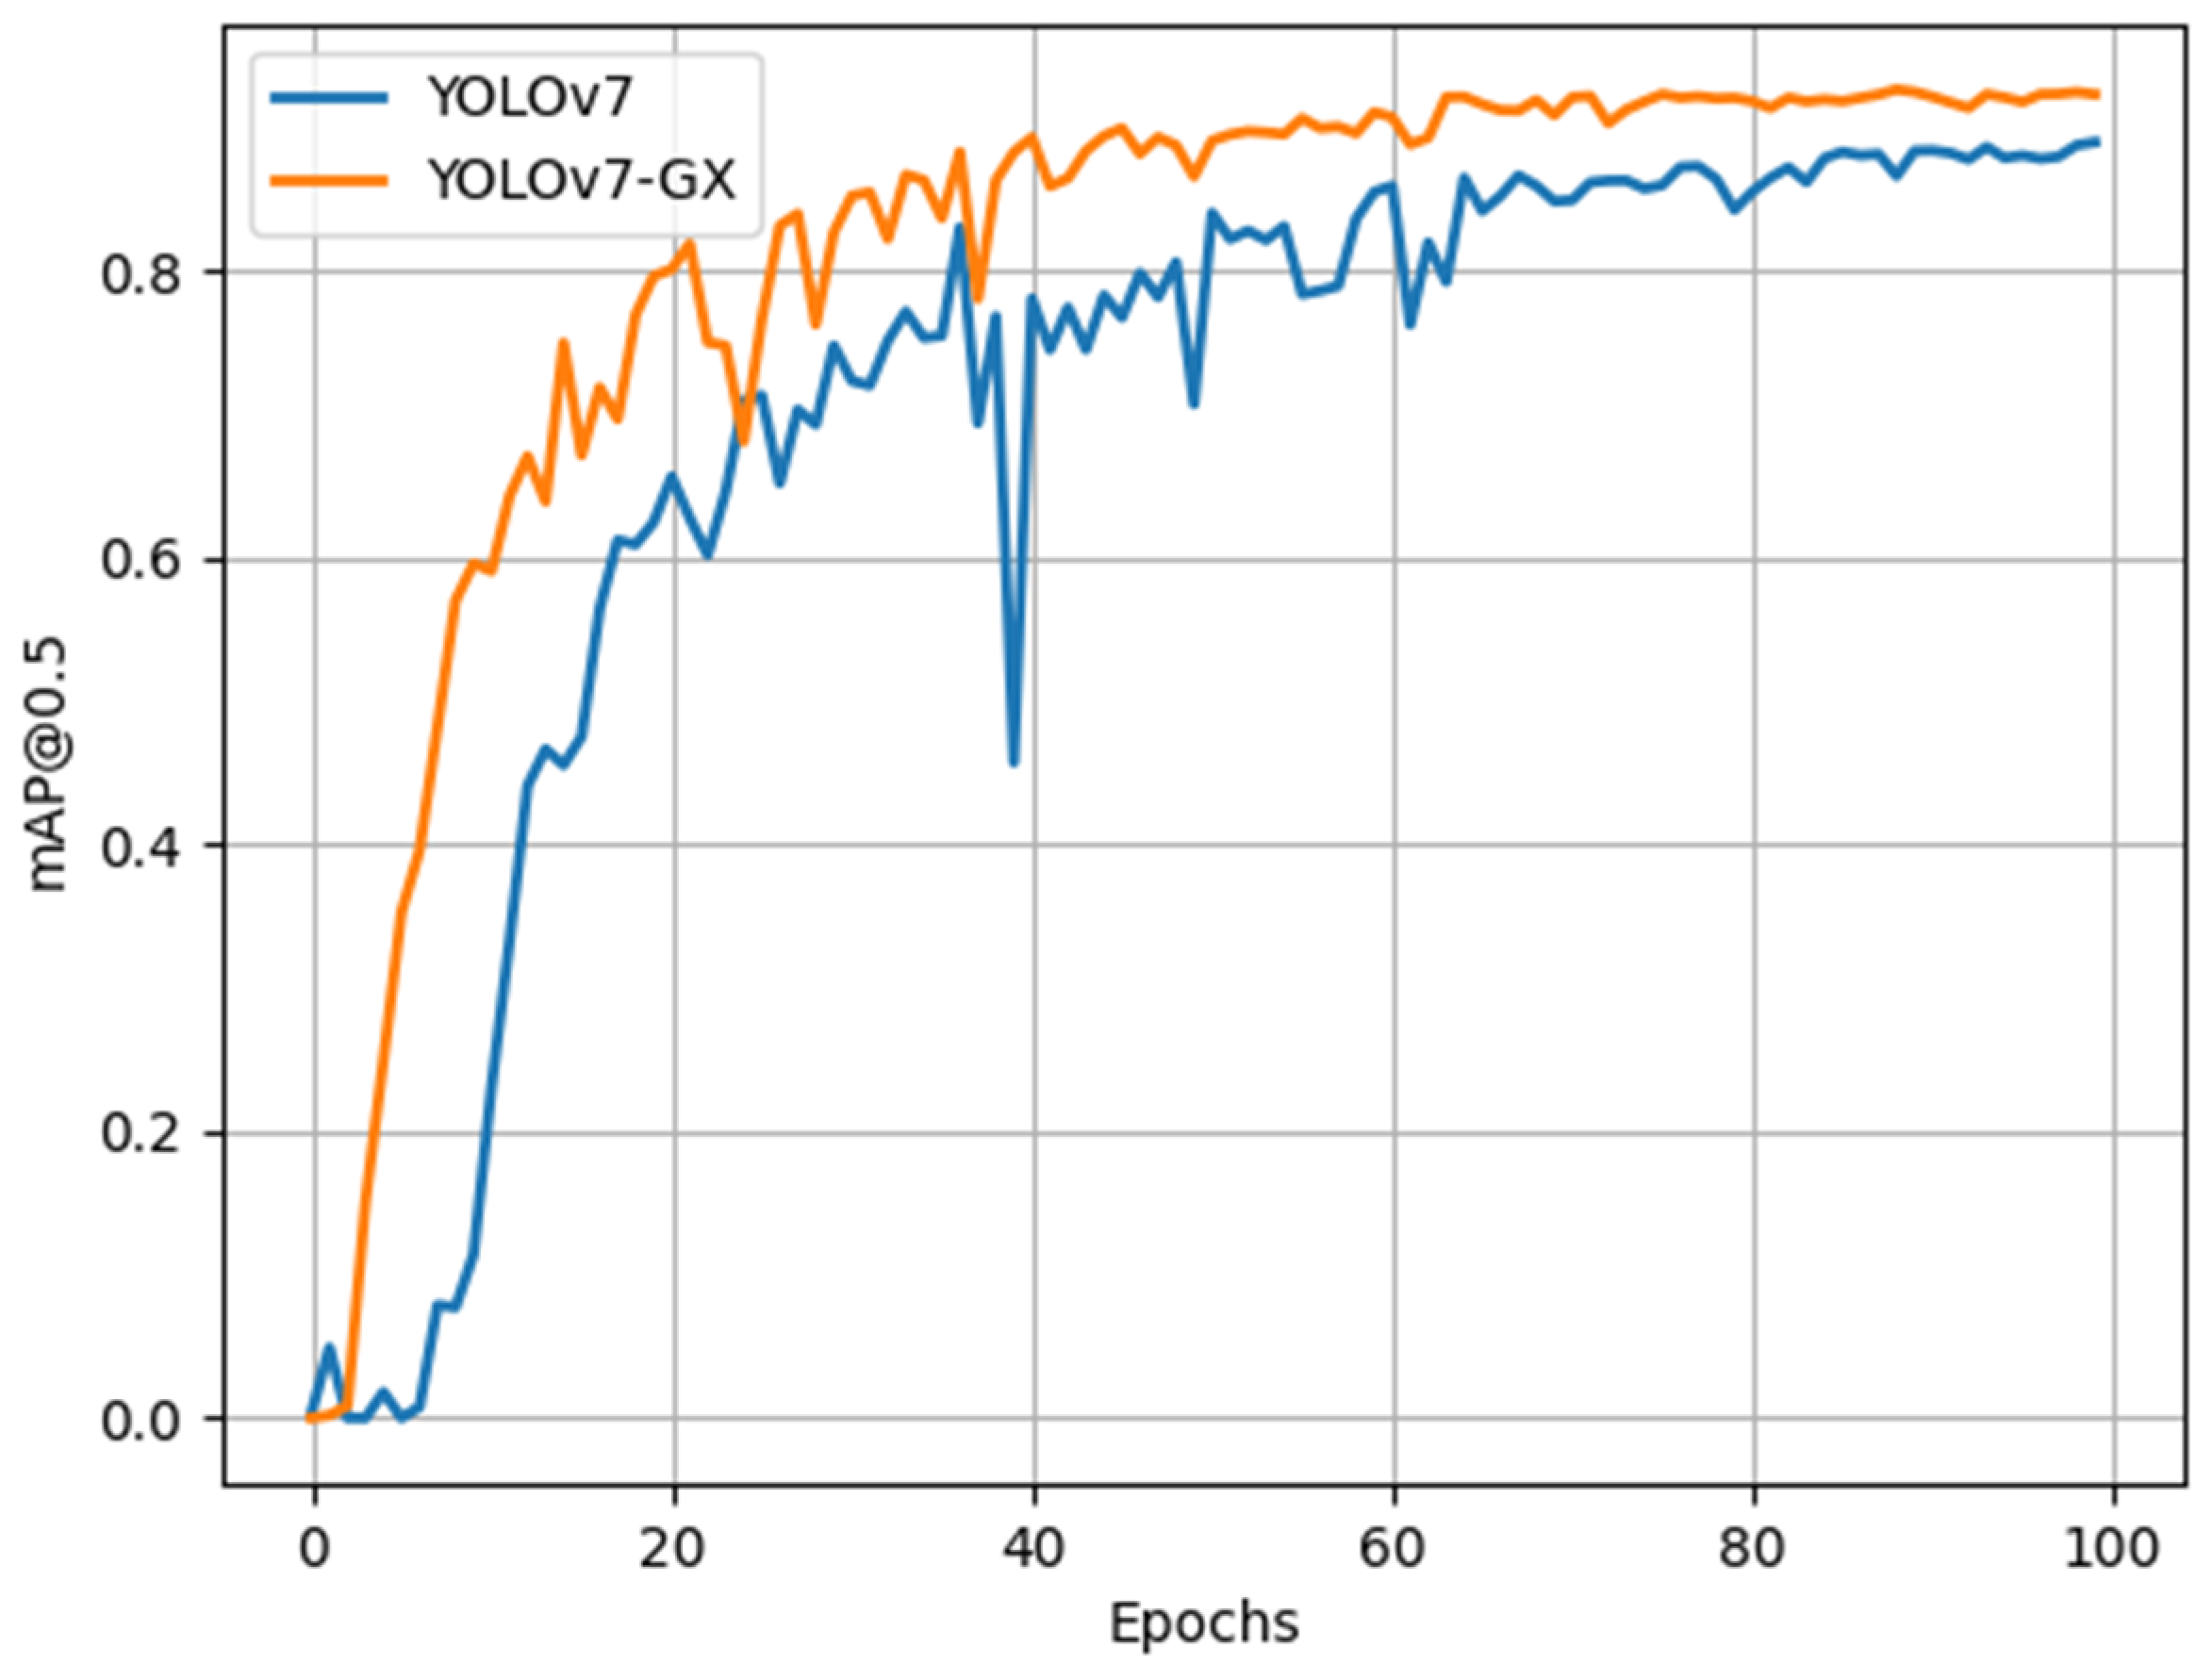
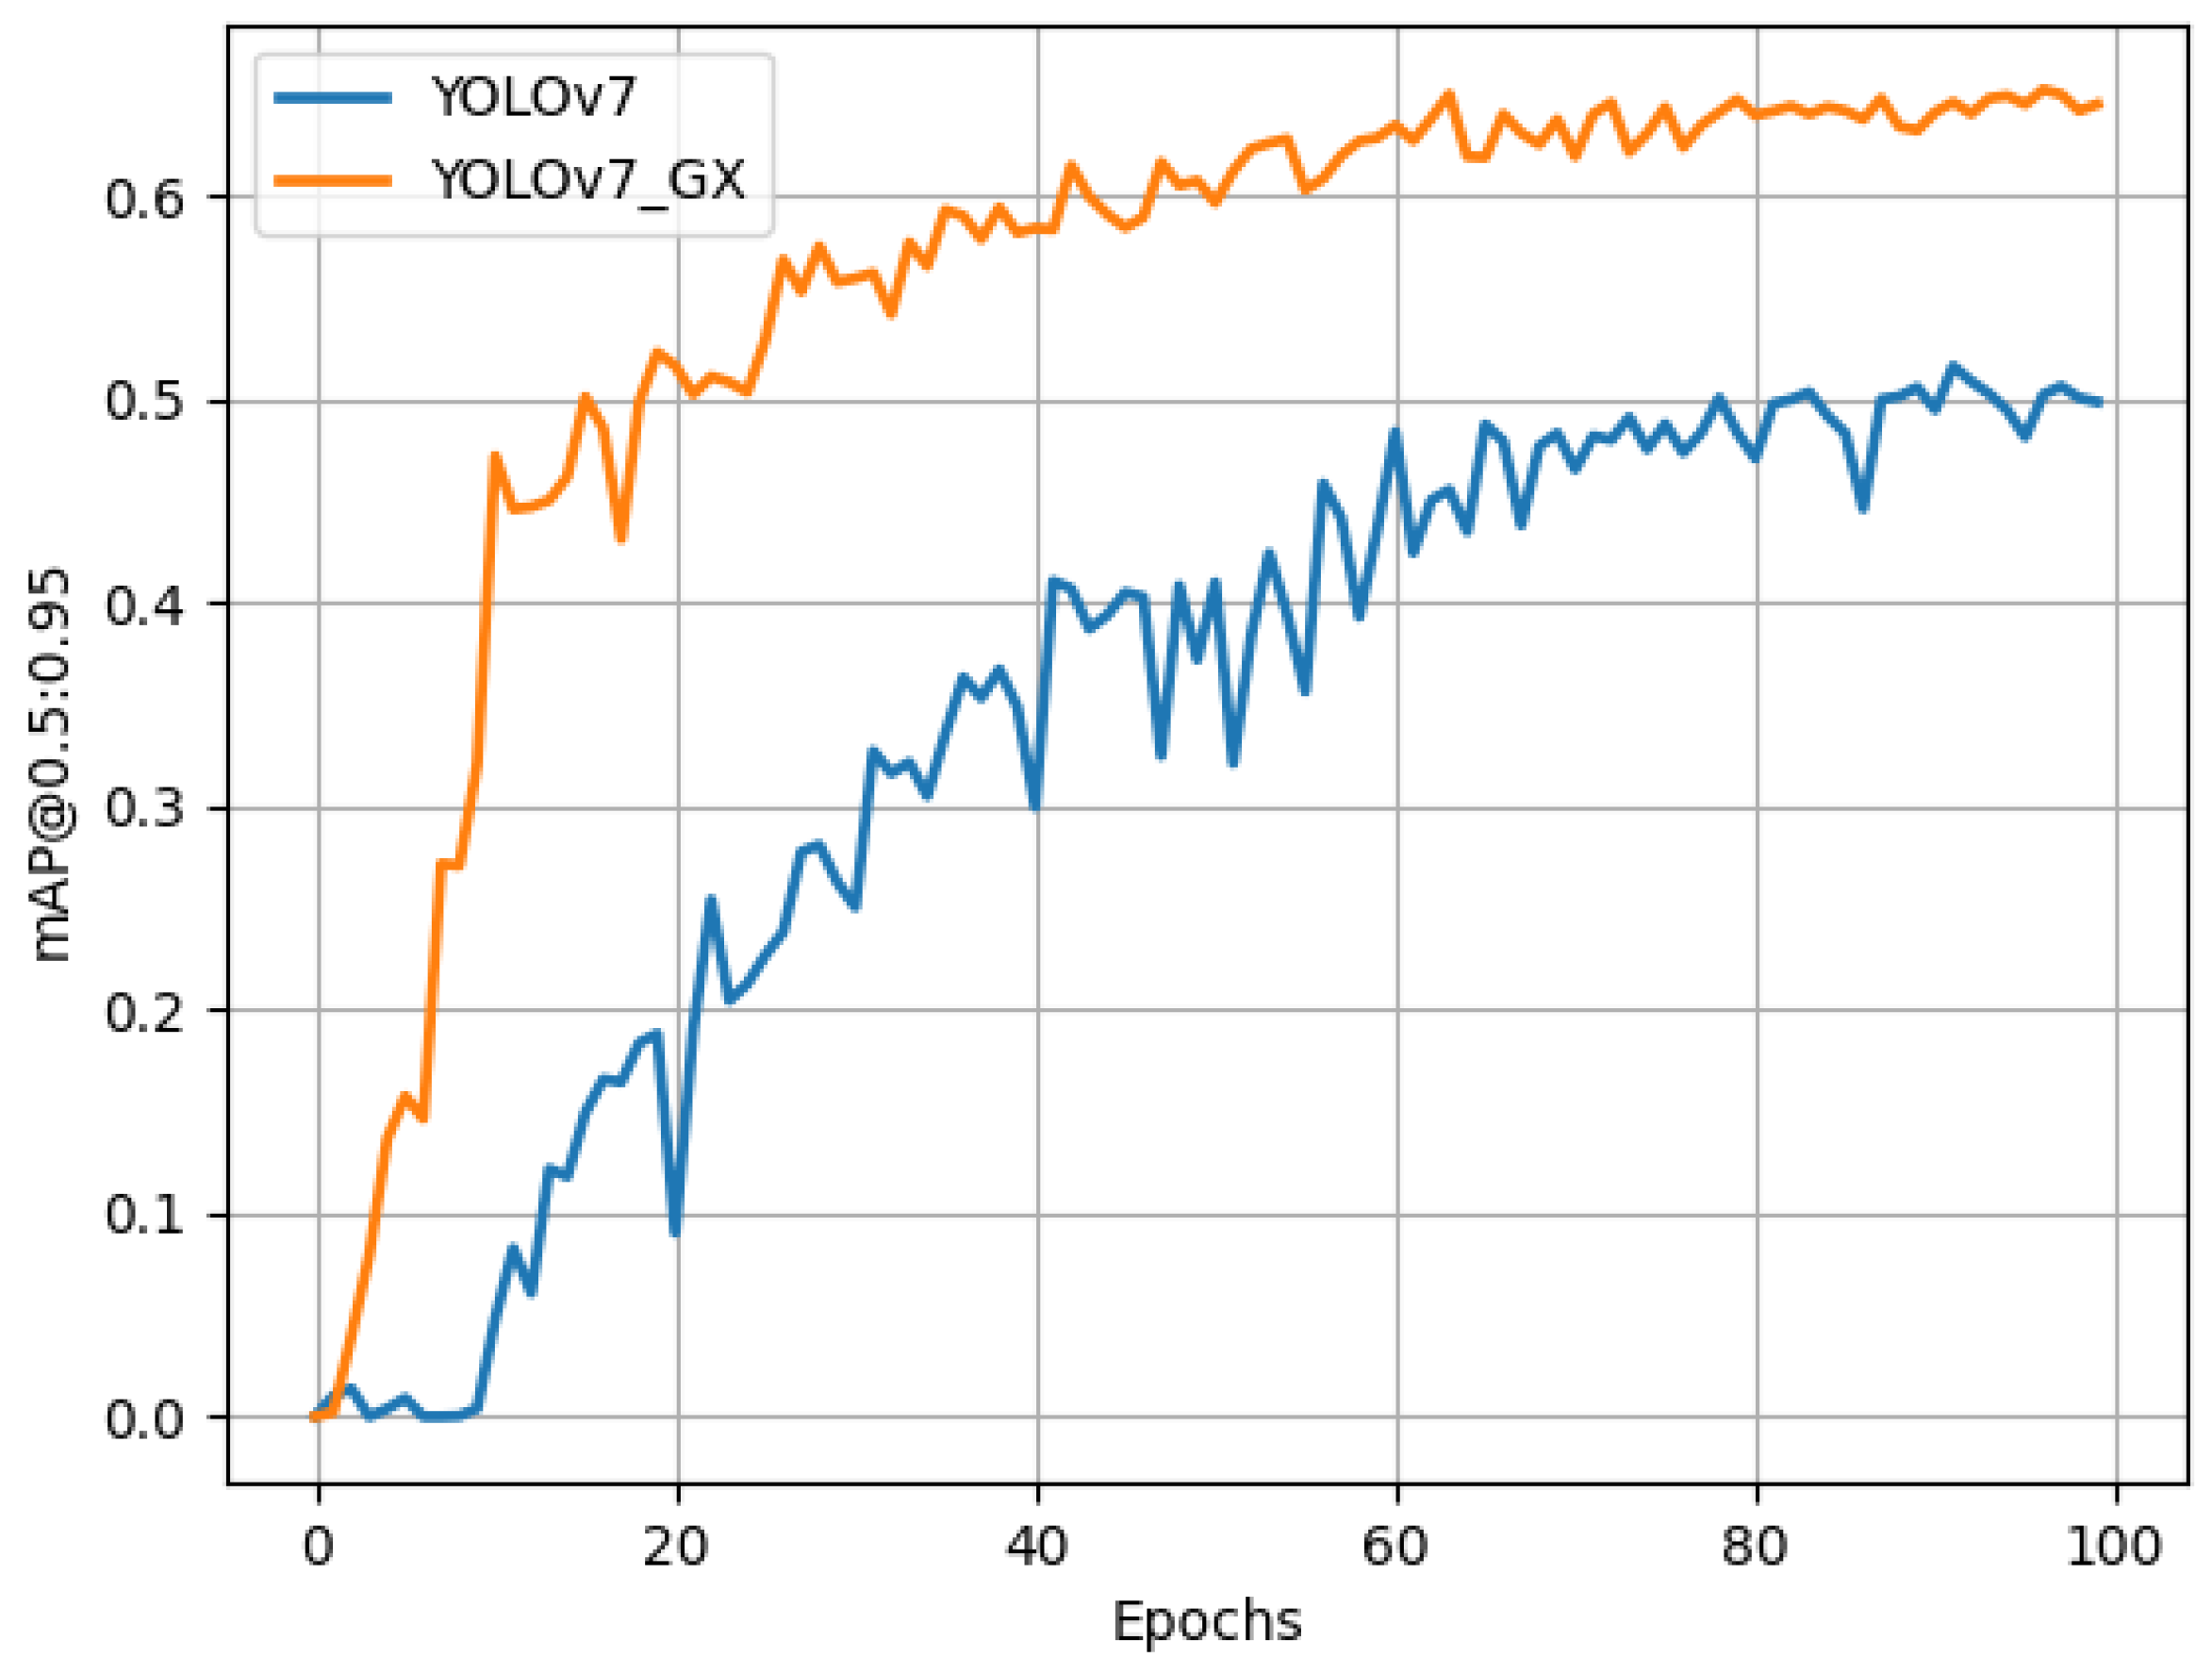
As can be seen from Table 1, the mAP of the improved algorithm (YOLOV7-GX) is 6.4% higher than that of the original network (YOLOV7), and the recall rate is increased by 9.7%, which greatly reduces the missed-detection rate of the network and improves the performance of the network. As shown in Figure 13, the performance of the improved network is better than that of the original YOLOV7 network in this dataset, and the improved network is more stable. We can also use [email protected] as an evaluation metric to describe the performance of the network. In this case, we set the threshold for the overlap rate of the detected target with the real target at 0.95. As can be seen from Figure 14, the improved network can also converge quickly under more stringent requirements, and the network performance is significantly better than that of the original YOLOv7 network, which can better reflect the performance of the network under the high-precision requirements. In addition, the APs of the four fault types are improved, and the AP value of hot spots is increased by 18.2%, which is extremely important for improving the network’s ability to detect small targets. The AP value of the fragmentation is increased to 99.5%, which is an accuracy that is difficult to break through. The AP value of plant occlusion has increased by 3.8% to 94.1%, which fully meets the needs of industrialization.
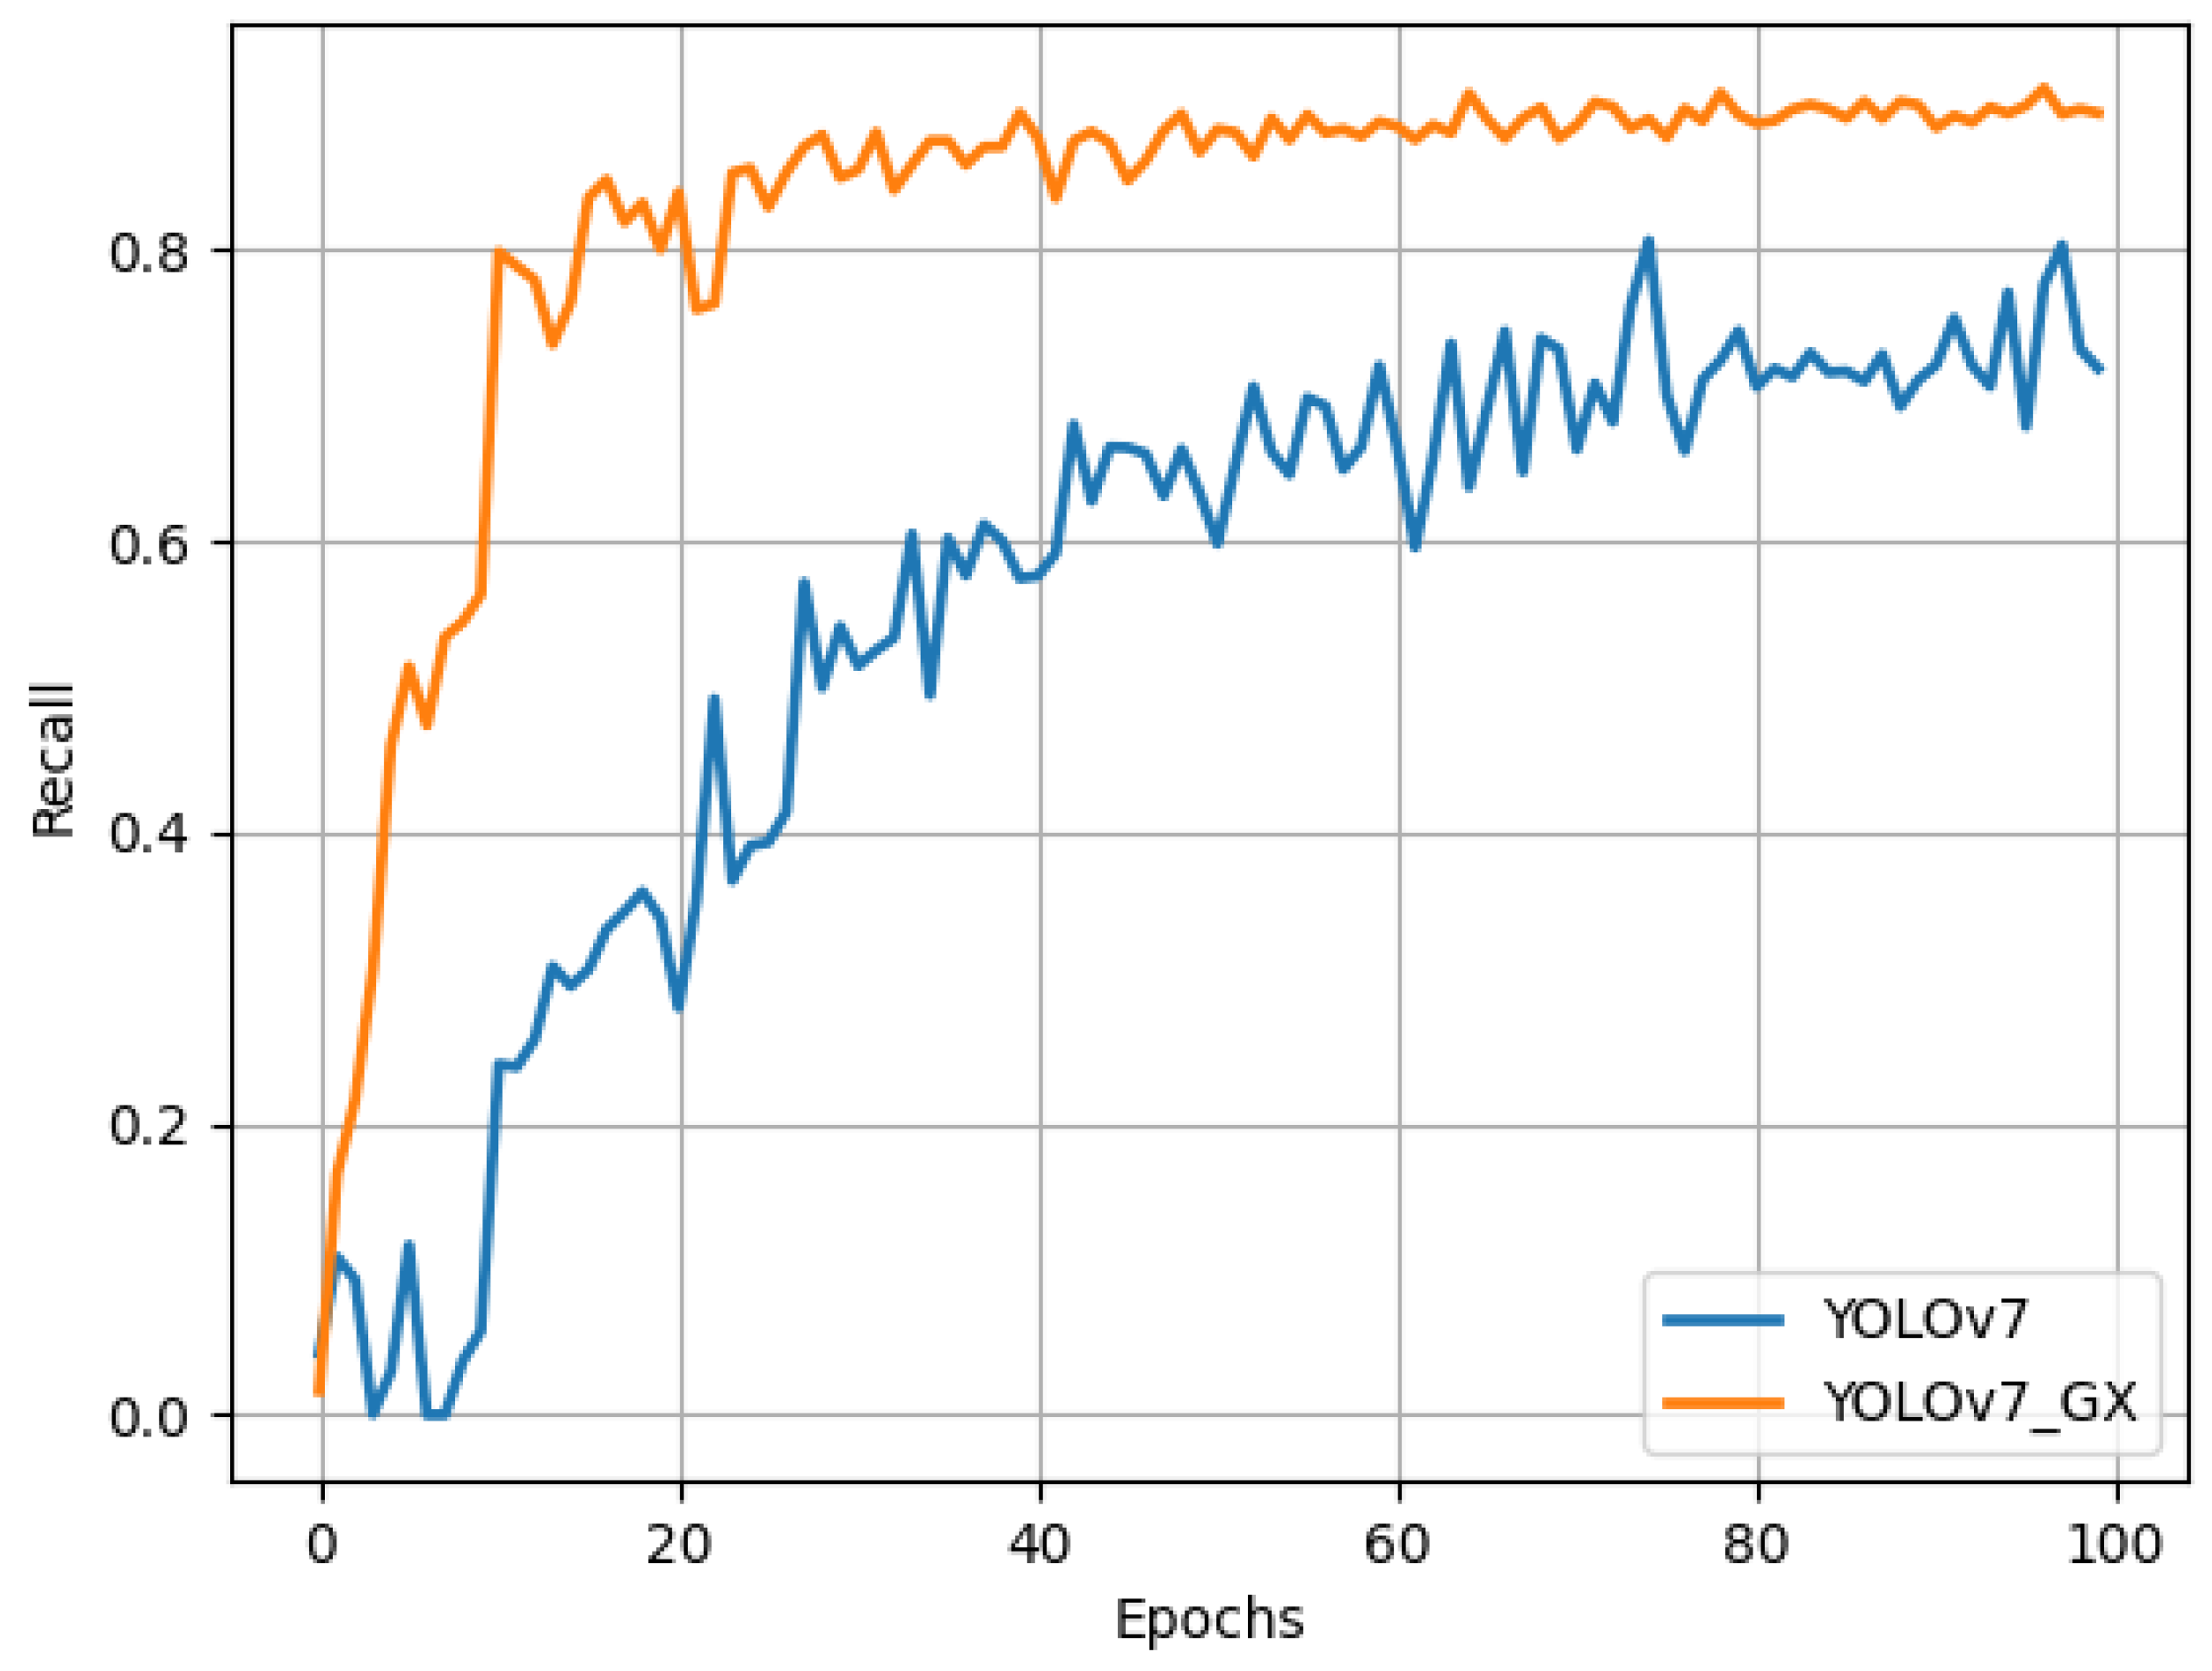
In the experiment, we compare the performance of the proposed algorithm and the original YOLOv7 in terms of convergence speed and recall. This is an evaluation of whether our network can improve recall rates while maintaining a fast convergence rate. First, as can be seen from Figure 15, our network shows faster convergence during training. Specifically, with the same number of training iterations, our network achieves a lower training loss and a higher validation accuracy. This shows that our network is able to learn and adapt to patterns and features in the dataset more quickly. Secondly, we compare the recall rates of the YOLOv7_GX network and the original YOLOv7 network on the training set. The results show that our network achieves higher recalls with the same number of iterations. This shows that our network is able to detect defective content in target images more comprehensively and is able to identify real objects more accurately. Overall, our network has demonstrated excellent performance in terms of convergence speed and recall. Not only is our network able to learn the characteristics of the data faster, but it is also able to achieve higher recall rates than the original network, resulting in better performance in object-detection tasks.
In this study, we provide an in-depth review of the performance of the algorithms proposed in this paper in comparison to the current leading defect-detection models in the field (e.g., YOLOV5s, YOLOX, YOLOV7, and YOLOV8), especially in the area of dense small target detection, i.e., “hotspot” detection, where the algorithms clearly outperform the other models in the comparison group. Through comprehensive evaluation, the YOLOV7-GX algorithm reached 94.8% on the key performance indicator [email protected], which significantly surpassed the other models in the comparison group. In particular, YOLOV7-GX achieves a high accuracy of 88.3% in the hot-spot-detection category, confirming its superior ability to handle dense small targets. Benchmark tests show that compared to similar models, YOLOV7-GX not only demonstrates higher accuracy on multiple complex defect-recognition tasks, such as cracks, hot-spots, plants, and battery strings, but also has a significant advantage in terms of stability and robustness. For example, it achieves 99.5% and 97.5% accuracy on the crack- and battery-string-detection tasks, respectively, demonstrating the model’s ability to efficiently recognize and adapt to a wide range of fault types. This significant improvement in performance comes from a number of innovations in the algorithm design of the YOLOV7-GX, including a finer feature extraction mechanism, optimized target classification and localization strategies, and a significant enhancement in the sensitivity to detecting small-sized targets. In summary, the YOLOV7-GX model not only sets a new industry standard in the field of dense-small-target detection, but also demonstrates its outstanding performance in complex defect-detection tasks, especially in performing the technically challenging hot-spot-detection task, which shows its obvious competitive advantages and broad application prospects. The results of this study not only prove the leadership of our proposed algorithm, but also provide an important reference direction for the future development of defect-detection technology.
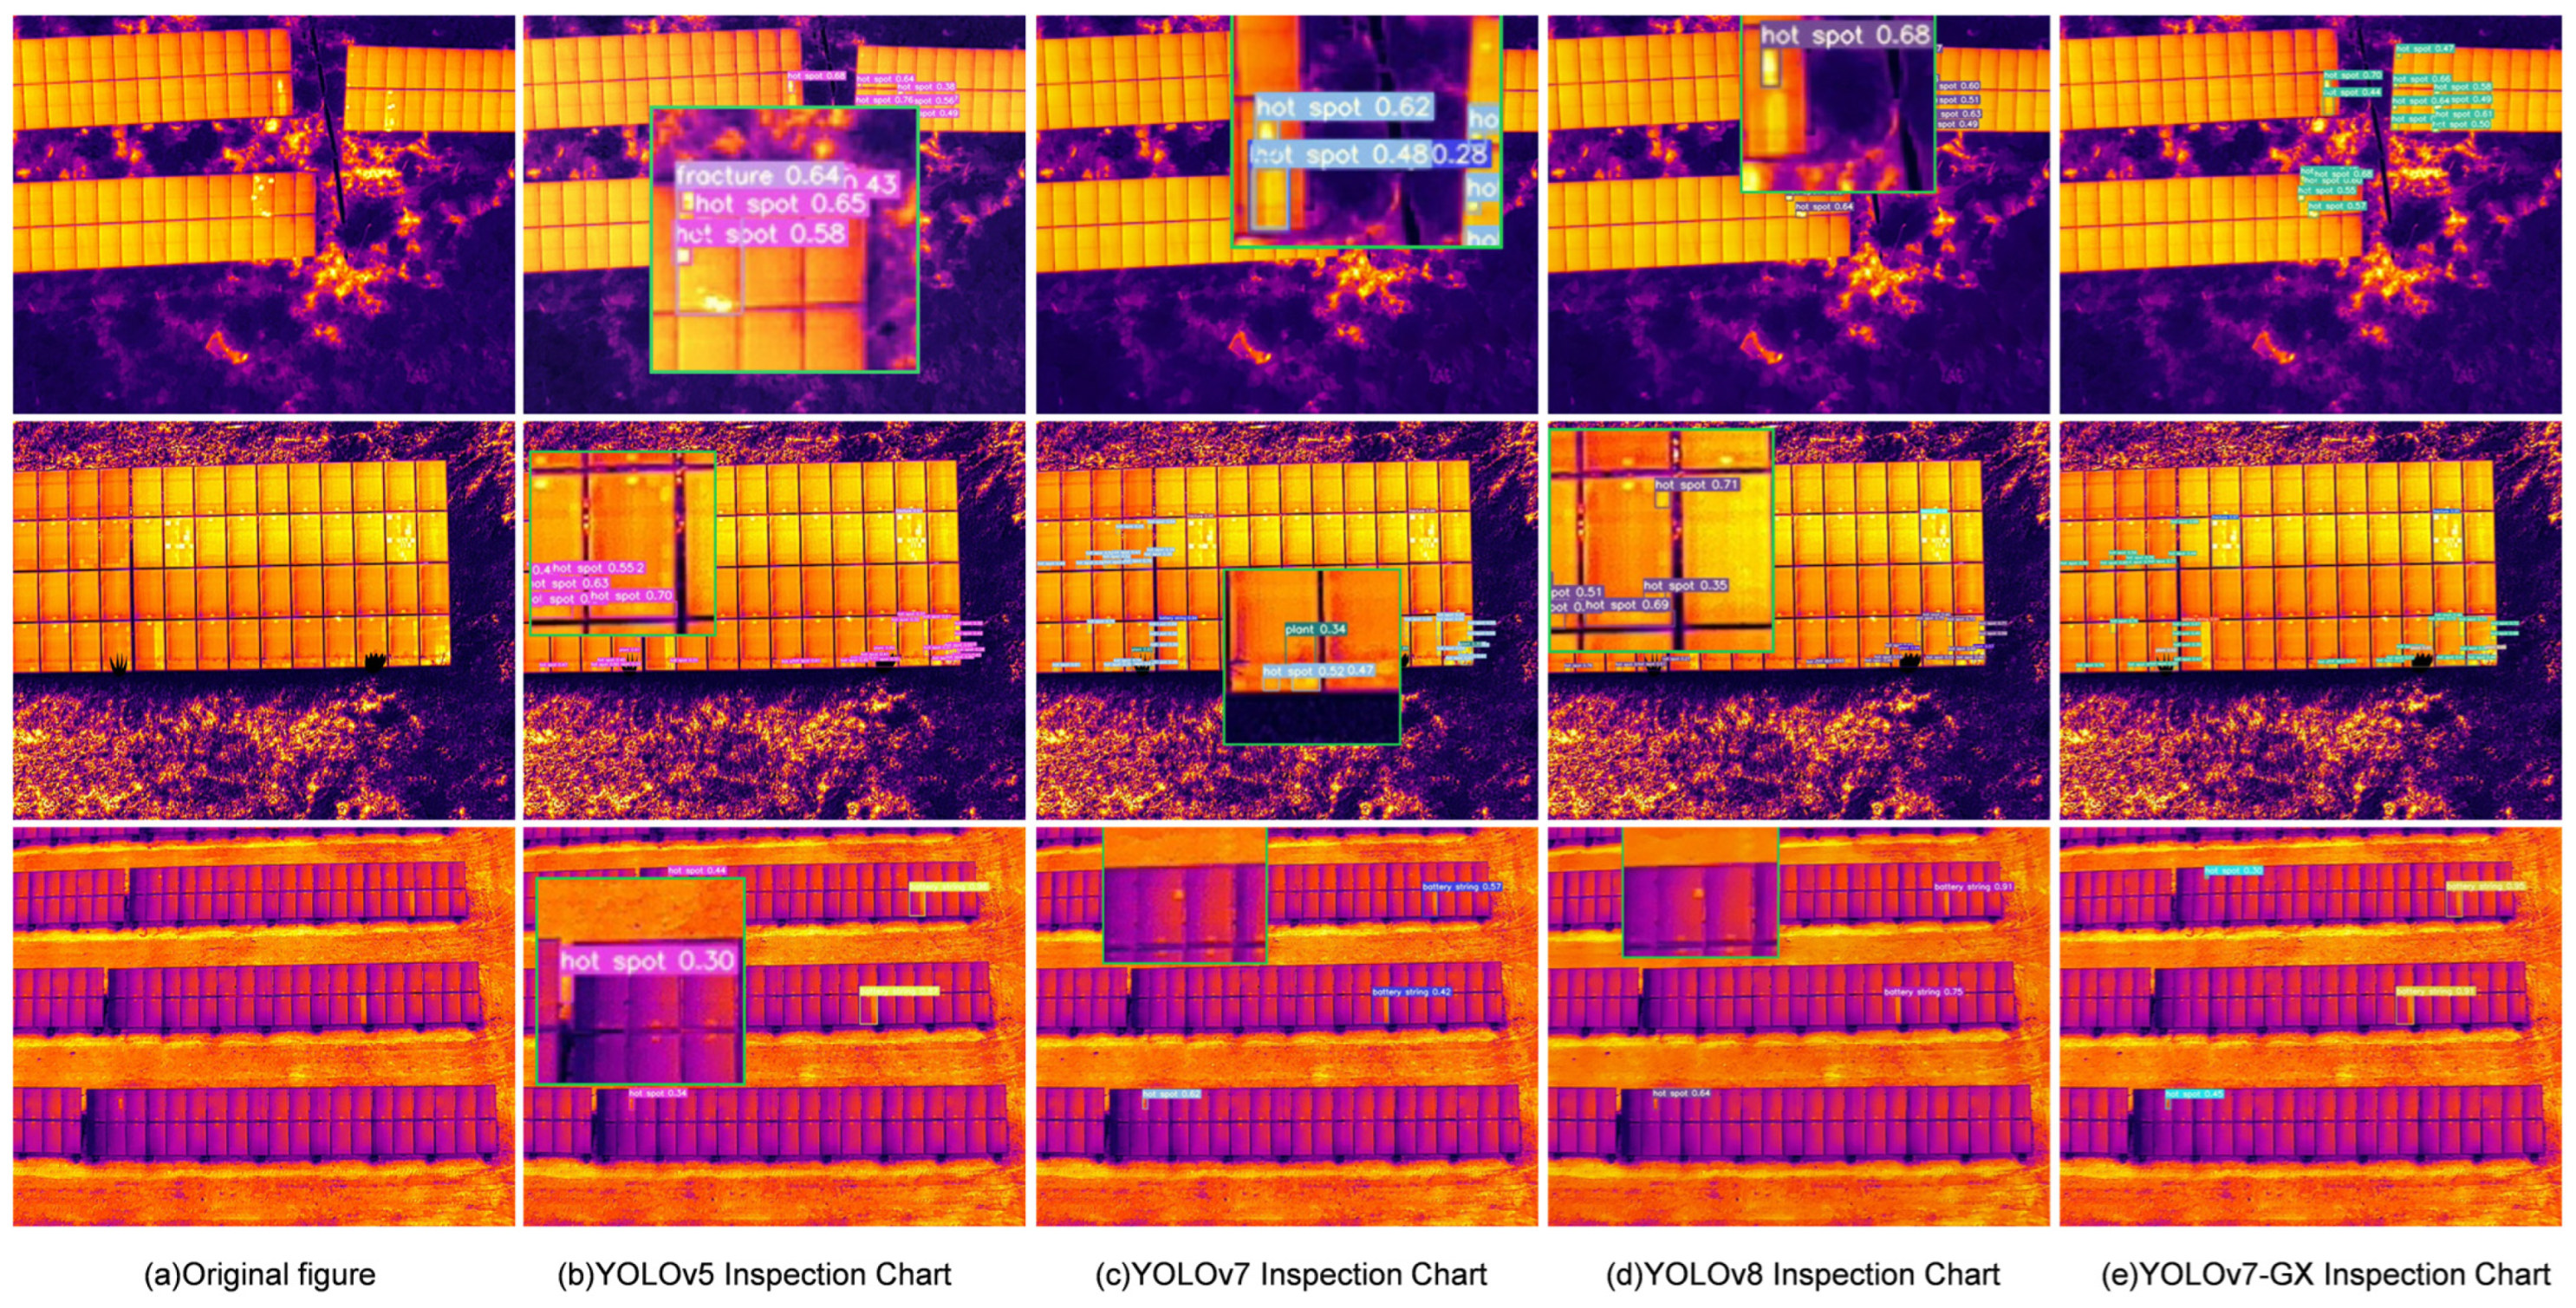
In order to visualize the superiority of this algorithm over the original algorithm, Figure 16 shows some of the comparison results of YOLOv5, YOLOv7, and YOLOv8 with the algorithm on the test set. The original graph at the bottom of Figure 16a shows that there are four faults in this graph, namely two “hot spots” and two “battery string” faults. In the YOLOv5 test chart, there is a false detection of a “hot spot”. Similarly, YOLOv7 and YOLOv8 have one missed detection, as shown in the green enlargement in the figure. Figure 16b: The middle and top two inspection images can be compared with the original image in Figure 16a) to see that there is a “hot spot” missed detection. In Figure 16c, the middle and top inspection maps of YOLOv7 have a “plant” and “battery string” leakage, respectively. In Figure 16d, there is an obvious “hot spot” leakage in the detection diagram. The various errors in the detection of the above comparison networks are effectively solved in this paper’s algorithm YOLOv7-GX, which greatly reflects the superiority of this paper’s algorithm.
In addition, the data analysis in Table 1 further demonstrates the superiority of the YOLOv7-GX algorithm. Compared with other classical target-detection algorithms, YOLOv7-GX not only performs excellently in terms of overall mAP, but also has generally higher AP values in all categories; especially, its recall is as high as 91.2%, which means that the algorithm is able to capture the real targets more efficiently, which is very important in practical applications, and for the application context of this paper, the higher recall can ensure that as many real targets are correctly recognized and detected [25], reducing the risk of missing important targets.
These performance advantages of the YOLOv7-GX are particularly important in an application scenario such as PV-panel defect detection, which requires high precision and high recall, to ensure that as many real targets as possible are correctly recognized and detected, thus reducing the risk of missing important targets and providing strong technical support for the accurate diagnosis of PV-panel defects.
In summary, the YOLOv7-GX algorithm demonstrates excellent performance in the PV-panel defect-detection task, showing significant advantages in terms of improving detection accuracy, reducing misses and false detections, and maintaining a high recall rate. These advantages not only prove the practical application value of the algorithm, but also provide a more reliable and efficient technical solution for the PV-energy industry.
3.4.2. Ablation Experiments
The ablation experiment is an important means to evaluate the contribution of each module in the algorithm. By removing and combining the key modules in the YOLOv7-GX algorithm, GhostSlimFPN, convolutional block with GAM attention mechanism, XIOU loss function, and the weight-adjustment strategy individually and in combination, it is possible to clarify the contribution of each module’s contribution to the overall performance improvement, and the experimental data are shown in Table 2.
The experimental results show that when the four modules are used in fusion at the same time, mAP achieves a significant improvement of 6.4% compared to the original YOLOv7 algorithm, a result that fully demonstrates the effectiveness of the improvement strategy in improving model performance. When examining the impact of each module individually, the data shows that each module delivers a performance improvement of 3.0% to 4.3%, where the following is true.
The convolutional block with the GAM attention mechanism improves the experimental accuracy most significantly, reaching 4.3%. This indicates that the GAM convolutional block can effectively enhance the network’s attention to global features, which plays a key role in improving the model’s detection accuracy. The weight adjustment also improves the model accuracy significantly, reaching 4.0%, indicating that reasonable weight adjustment is crucial for improving the model performance in dealing with the task of target detection with sample imbalance. The addition of the XIOU loss function brings about a performance improvement of 3.1%, which proves that it significantly improves the accuracy and localization precision of the target detection while speeding up the convergence speed of the model. The introduction of the GhostSlimFPN structure improves the mAP by 3.0%, demonstrating its effectiveness in feature fusion and information transfer.
These ablation experimental results not only demonstrate the important contribution of each module in the YOLOv7-GX algorithm to the overall performance improvement, but also further validate the rationality and effectiveness of the improvement strategy. In particular, the convolutional blocks and weight adjustments of the GAM attention mechanism play a decisive role in improving the model’s accuracy in detecting defects in PV panels. With these well-designed blocks, the YOLOv7-GX algorithm is able to capture the target features more accurately and effectively improve the detection performance, especially when dealing with sample imbalance and small-target-detection tasks. This series of improvements makes YOLOv7-GX the preferred solution for high-precision demanding scenarios such as PV-panel defect detection.
4. Discussion
Facing the common problem of dense-small-target detection in PV-panel defect detection, this study proposes an innovative solution: a detection algorithm based on YOLOv7-GX. The core of this algorithm lies in the introduction of a newly designed GhostSlimFPN network structure, which is specifically optimized for the detection of small targets, significantly improving the recognition accuracy of small-sized targets and effectively reducing the false-detection rate. In addition, the algorithm in this paper incorporates a customized 1 × 1 convolutional block with a GAM attention mechanism, and this innovative design effectively enhances the model’s ability to perceive and express target features without additionally increasing the network depth.
In terms of loss function selection, this study adopts the XIOU loss function instead of the traditional CIOU loss function, and this improvement not only strengthens the robustness of the model, but also improves the convergence speed, further enhancing the detection performance. In order to cope with the possible imbalance of sample distribution during the training process, this paper adopts the strategy of assigning different weights to different images and categories, which achieves balanced training and ensures the algorithm’s generalization ability and stability.
Through a series of rigorous experimental evaluations of the algorithm, the results confirm its significant advantages in the field of PV-panel defect detection. The experimental results show that the method proposed in this paper achieves 94.8% in the mAP index, which significantly exceeds the performance of other existing models in the current market. This achievement not only highlights the excellent performance of this algorithm in enhancing the detection capability of tiny targets and reducing the false-detection rate, but also reflects the successful improvement of the overall perceptual capability and robustness of the model through technological innovations such as the attention mechanism and loss function optimization.
The contributions made in this study are significant to the maintenance of solar PV panels, providing an efficient and accurate technological tool to ensure the efficient operation and prolonged service life of PV panels. Looking ahead, we will work to further improve the computational efficiency and generalized applicability of the algorithm, aiming to meet the detection needs in a wider range of application scenarios, and to provide stronger technical support for the development and application of PV technology.
Author Contributions
Conceptualization, Y.W. and J.Z.; Methodology, Y.W.; Software, J.Z.; Validation, Y.Y., Z.Z. and X.H.; Writing—Review and Editing, Y.W. and J.Z.; Visualization, X.H.; Supervision, Y.Y.; Funding Acquisition, Y.W. All authors have read and agreed to the published version of the manuscript.
Funding
Shanxi Provincial Scientific and Technological Achievement Transformation Guidance Special Program (202204021301059), Shanxi Key R&D Program (202202150401005).
Data Availability Statement
The dataset utilized in this investigation originates from onsite photography conducted by partner companies and has been manually annotated by our research team. Owing to confidentiality agreements, the dataset is not publicly accessible. However, interested parties may request the data directly from the corresponding authors, provided that the inquiry is deemed justifiable.
Conflicts of Interest
All authors of the study have no conflicts of interest.
References
- Singh, G.K. Solar power generation by PV (photovoltaic) technology: A review. Energy 2013, 53, 1–13. [Google Scholar] [CrossRef]
- Liao, K.C.; Lu, J.H. Using uav to detect solar module fault conditions of a solar power farm with ir and visual image analysis. Appl. Sci. 2021, 11, 1835. [Google Scholar] [CrossRef]
- Jiao, L.; Zhao, J. A survey on the new generation of deep learning in image processing. IEEE Access 2019, 7, 172231–172263. [Google Scholar] [CrossRef]
- Tao, H. Erasing-inpainting-based data augmentation using denoising diffusion probabilistic models with limited samples for generalized surface defect inspection. Mech. Syst. Signal Process. 2024, 208, 111082. [Google Scholar] [CrossRef]
- Tao, H.; Lu, M.; Hu, Z.; An, J. A gated multi-hierarchical feature fusion network for recognizing steel plate surface defects. Multimed. Syst. 2023, 29, 1347–1360. [Google Scholar] [CrossRef]
- Latoui, A.; Daachi, M.E.H. Real-time monitoring of partial shading in large PV plants using Convolutional Neural Network. Sol. Energy 2023, 253, 428–438. [Google Scholar] [CrossRef]
- Guo, M.; Xu, H. Research on hot spot defect detection of infrared thermal images based on Faster RCNN. Comput. Syst. Appl. 2019, 28, 265–270. [Google Scholar]
- Winston, D.P.; Murugan, M.S.; Elavarasan, R.M.; Pugazhendhi, R.; Singh, O.J.; Murugesan, P.; Gurudhachanamoorthy, M.; Hossain, E. Solar PV’s micro crack and hotspots detection technique using NN and SVM. IEEE Access 2021, 9, 127259–127269. [Google Scholar] [CrossRef]
- Chen, Z.; Chen, Y.; Wu, L.; Cheng, S.; Lin, P. Deep residual network based fault detection and diagnosis of photovoltaic arrays using current-voltage curves and ambient conditions. Energy Convers. Manag. 2019, 198, 111793. [Google Scholar] [CrossRef]
- Vega Díaz, J.J.; Vlaminck, M.; Lefkaditis, D.; Orjuela Vargas, S.A.; Luong, H. Solar panel detection within complex backgrounds using thermal images acquired by UAVs. Sensors 2020, 20, 6219. [Google Scholar] [CrossRef]
- Wang, C.Y.; Bochkovskiy, A.; Liao HY, M. YOLOv7: Trainable bag-of-freebies sets new state-of-the-art for real-time object detectors. In Proceedings of the IEEE/CVF Conference on Computer Vision and Pattern Recognition, Vancouver, BC, Canada, 17–24 June 2023; pp. 7464–7475. [Google Scholar]
- Ge, Z.; Liu, S.; Wang, F.; Li, Z.; Sun, J. Yolox: Exceeding yolo series in 2021. arXiv 2021, arXiv:2107.08430. [Google Scholar]
- Chollet, F. Xception: Deep learning with depthwise separable convolutions. In Proceedings of the IEEE Conference on Computer Vision and Pattern Recognition, Honolulu, HI, USA, 21–26 July 2017; pp. 1251–1258. [Google Scholar]
- Li, H.; Li, J.; Wei, H.; Liu, Z.; Zhan, Z.; Ren, Q. Slim-neck by GSConv: A better design paradigm of detector architectures for autonomous vehicles. arXiv 2022, arXiv:2206.02424. [Google Scholar]
- Zhang, Y.; Fang, X.; Guo, J.; Wang, L.; Tian, H.; Yan, K.; Lan, Y. CURI-YOLOv7: A lightweight YOLOv7tiny target detector for citrus trees from UAV remote sensing imagery based on embedded device. Remote Sens. 2023, 15, 4647. [Google Scholar] [CrossRef]
- Chen, G.; Cheng, R.; Lin, X.; Jiao, W.; Bai, D.; Lin, H. LMDFS: A lightweight model for detecting forest fire smoke in UAV images based on YOLOv7. Remote Sens. 2023, 15, 3790. [Google Scholar] [CrossRef]
- Yin, W.; Zhao, J.; Gang, X.; Zhao, Z.; Hu, X. PA-YOLO-Based Multifault Defect Detection Algorithm for PV Panels. Int. J. Photoenergy 2024, 2024, 6113260. [Google Scholar]
- Liu, Y.; Shao, Z.; Hoffmann, N. Global attention mechanism: Retain information to enhance channel-spatial interactions. arXiv 2021, arXiv:2112.05561. [Google Scholar]
- Woo, S.; Park, J.; Lee, J.Y.; Kweon, I.S. Cbam: Convolutional block attention module. In Proceedings of the European Conference on Computer Vision (ECCV), Munich, Germany, 8–14 September 2018; pp. 3–19. [Google Scholar]
- Zheng, Z.; Wang, P.; Ren, D.; Liu, W.; Ye, R.; Hu, Q.; Zuo, W. Enhancing geometric factors in model learning and inference for object detection and instance segmentation. IEEE Trans. Cybern. 2021, 52, 8574–8586. [Google Scholar] [CrossRef] [PubMed]
- Shorten, C.; Khoshgoftaar, T.M. A survey on image data augmentation for deep learning. J. Big Data 2019, 6, 1–48. [Google Scholar] [CrossRef]
- Mikołajczyk, A.; Grochowski, M. Data augmentation for improving deep learning in image classification problem. In Proceedings of the 2018 International Interdisciplinary PhD Workshop (IIPhDW), Swinoujscie, Poland, 9–12 May 2018; pp. 117–122. [Google Scholar]
- Zhao, L.; Zhi, L.; Zhao, C.; Zheng, W. Fire-YOLO: A small target object detection method for fire inspection. Sustainability 2022, 14, 4930. [Google Scholar] [CrossRef]
- Goyal, P.; Dollár, P.; Girshick, R.; Noordhuis, P.; Wesolowski, L.; Kyrola, A.; Tulloch, A.; Jia, Y.; He, K. Accurate, large minibatch sgd: Training imagenet in 1 hour. arXiv 2017, arXiv:1706.02677. [Google Scholar]
- Buckland, M.; Gey, F. The relationship between recall and precision. J. Am. Soc. Inf. Sci. 1994, 45, 12–19. [Google Scholar] [CrossRef]
Figure 1.
YOLOv7 network architecture overview.

Figure 2.
Example of the distribution of small, dense targets in a hot-spot area.

Figure 3.
GSConv architecture details.

Figure 4.
Schematic of the optimized YOLOv7-GX network structure with the novel GhostSlim-FPN architecture: efficiency gains are achieved by replacing the traditional convolution at the neck layer.
Figure 4.
Schematic of the optimized YOLOv7-GX network structure with the novel GhostSlim-FPN architecture: efficiency gains are achieved by replacing the traditional convolution at the neck layer.

Figure 5.
Schematic of convolution equipped with the GAM attention mechanism.

Figure 6.
Example of integration of channeling and spatial-attention mechanisms in GAM modeling.

Figure 7.
Channel-attention sub-module.

Figure 8.
Spatial-attention sub-module.

Figure 9.
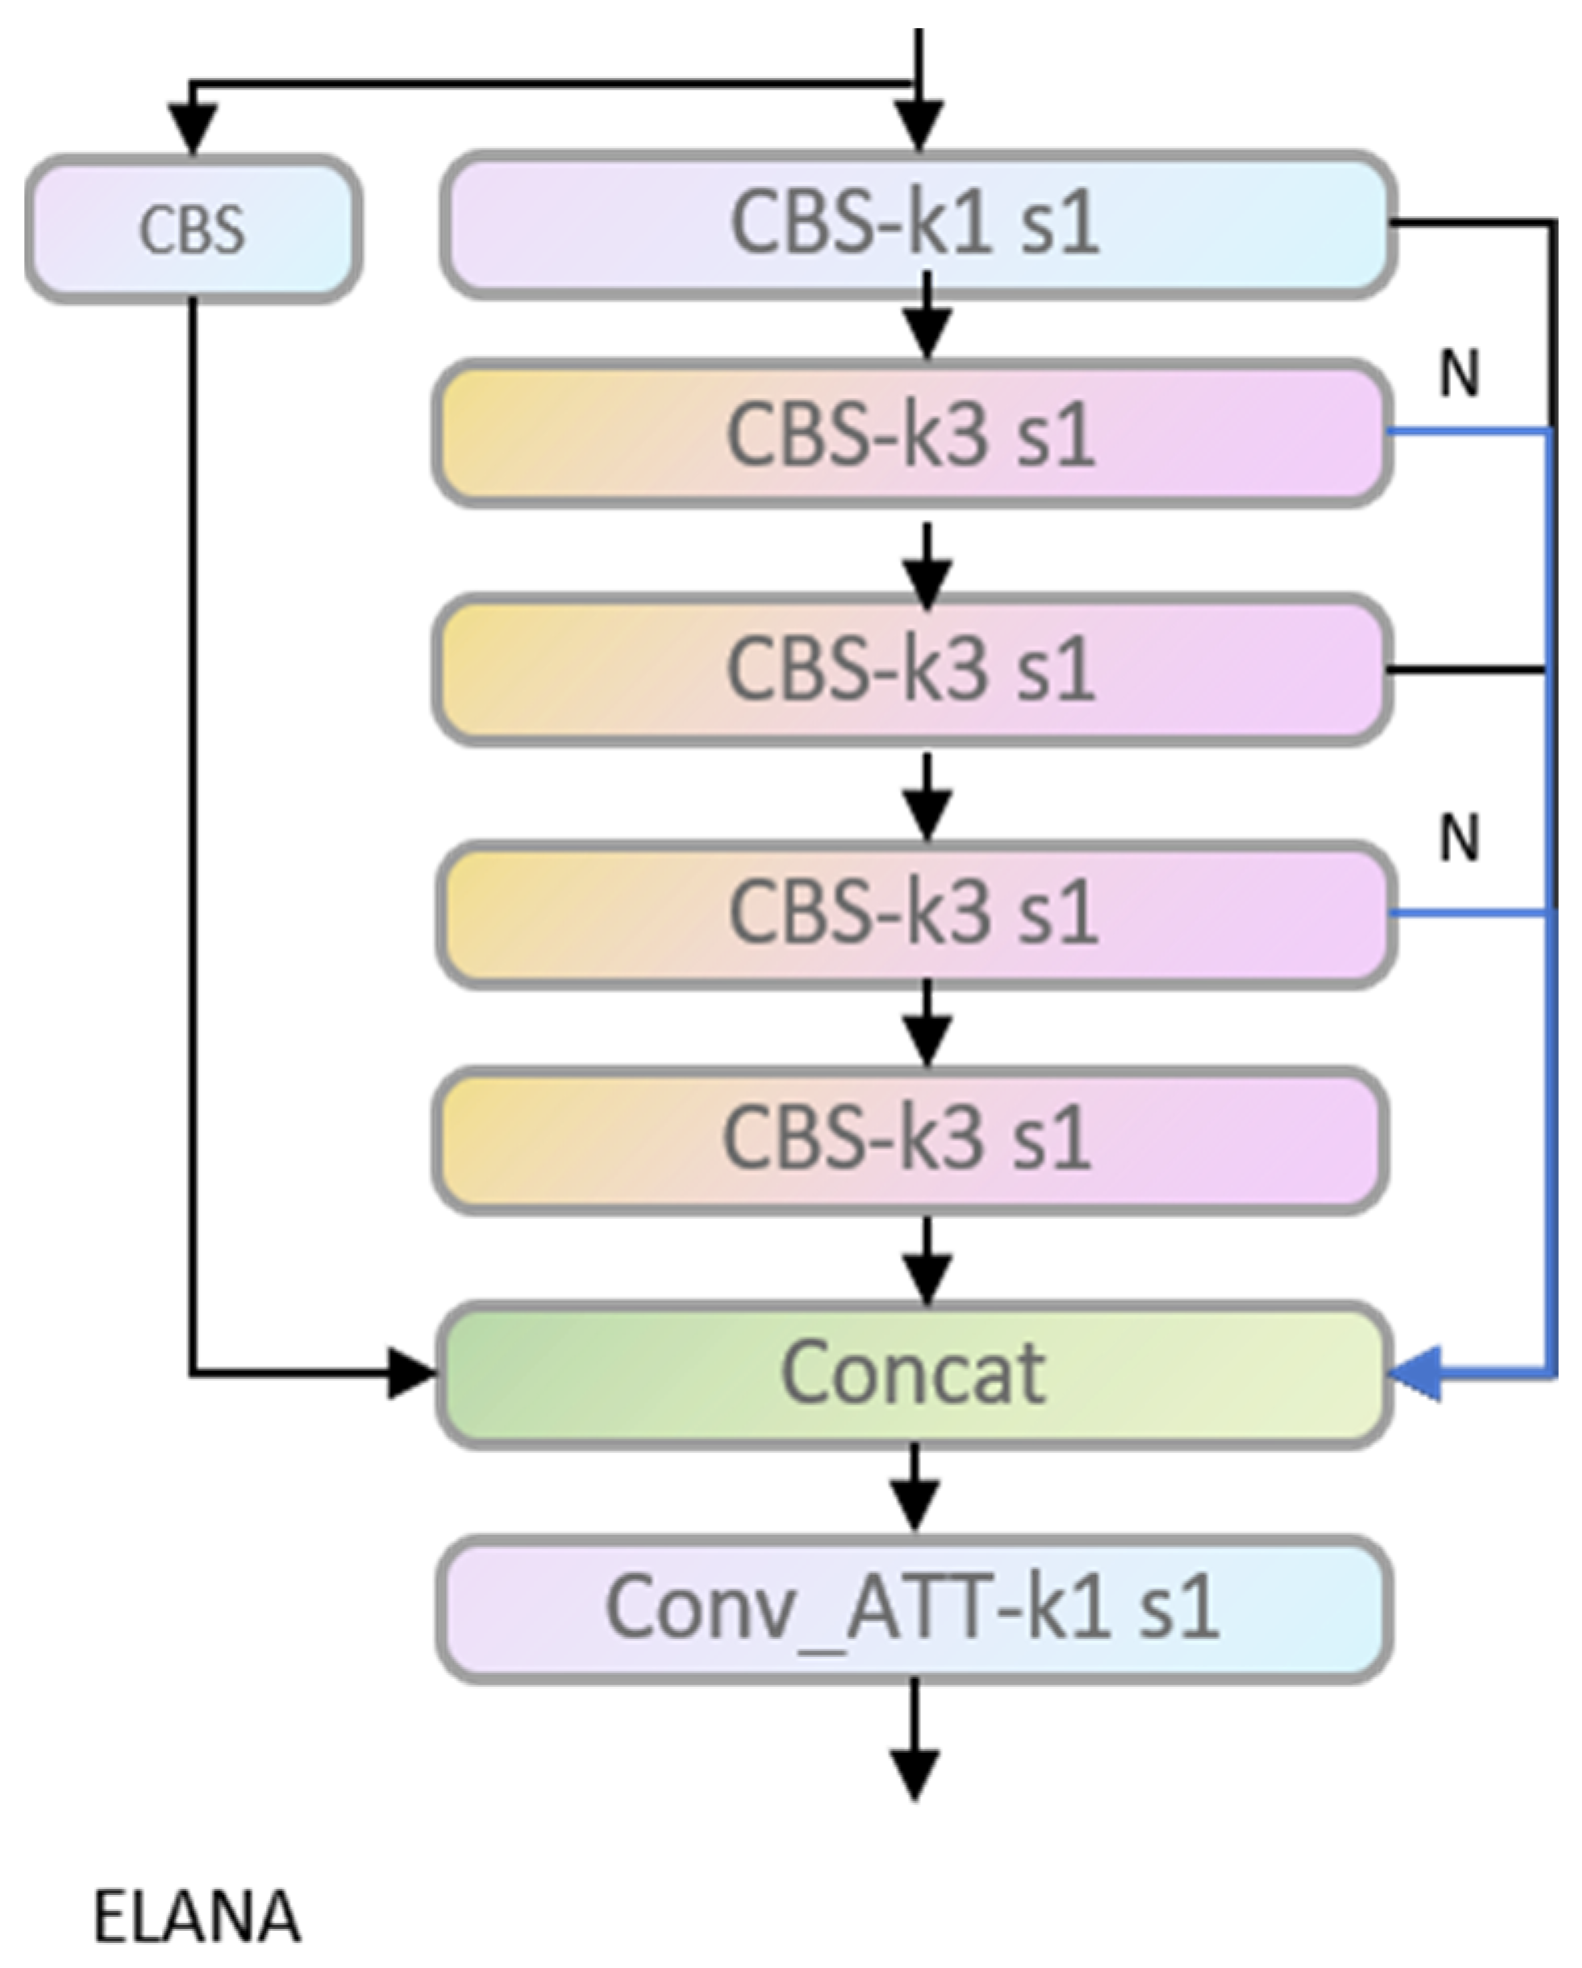
ELANA module.

Figure 10.
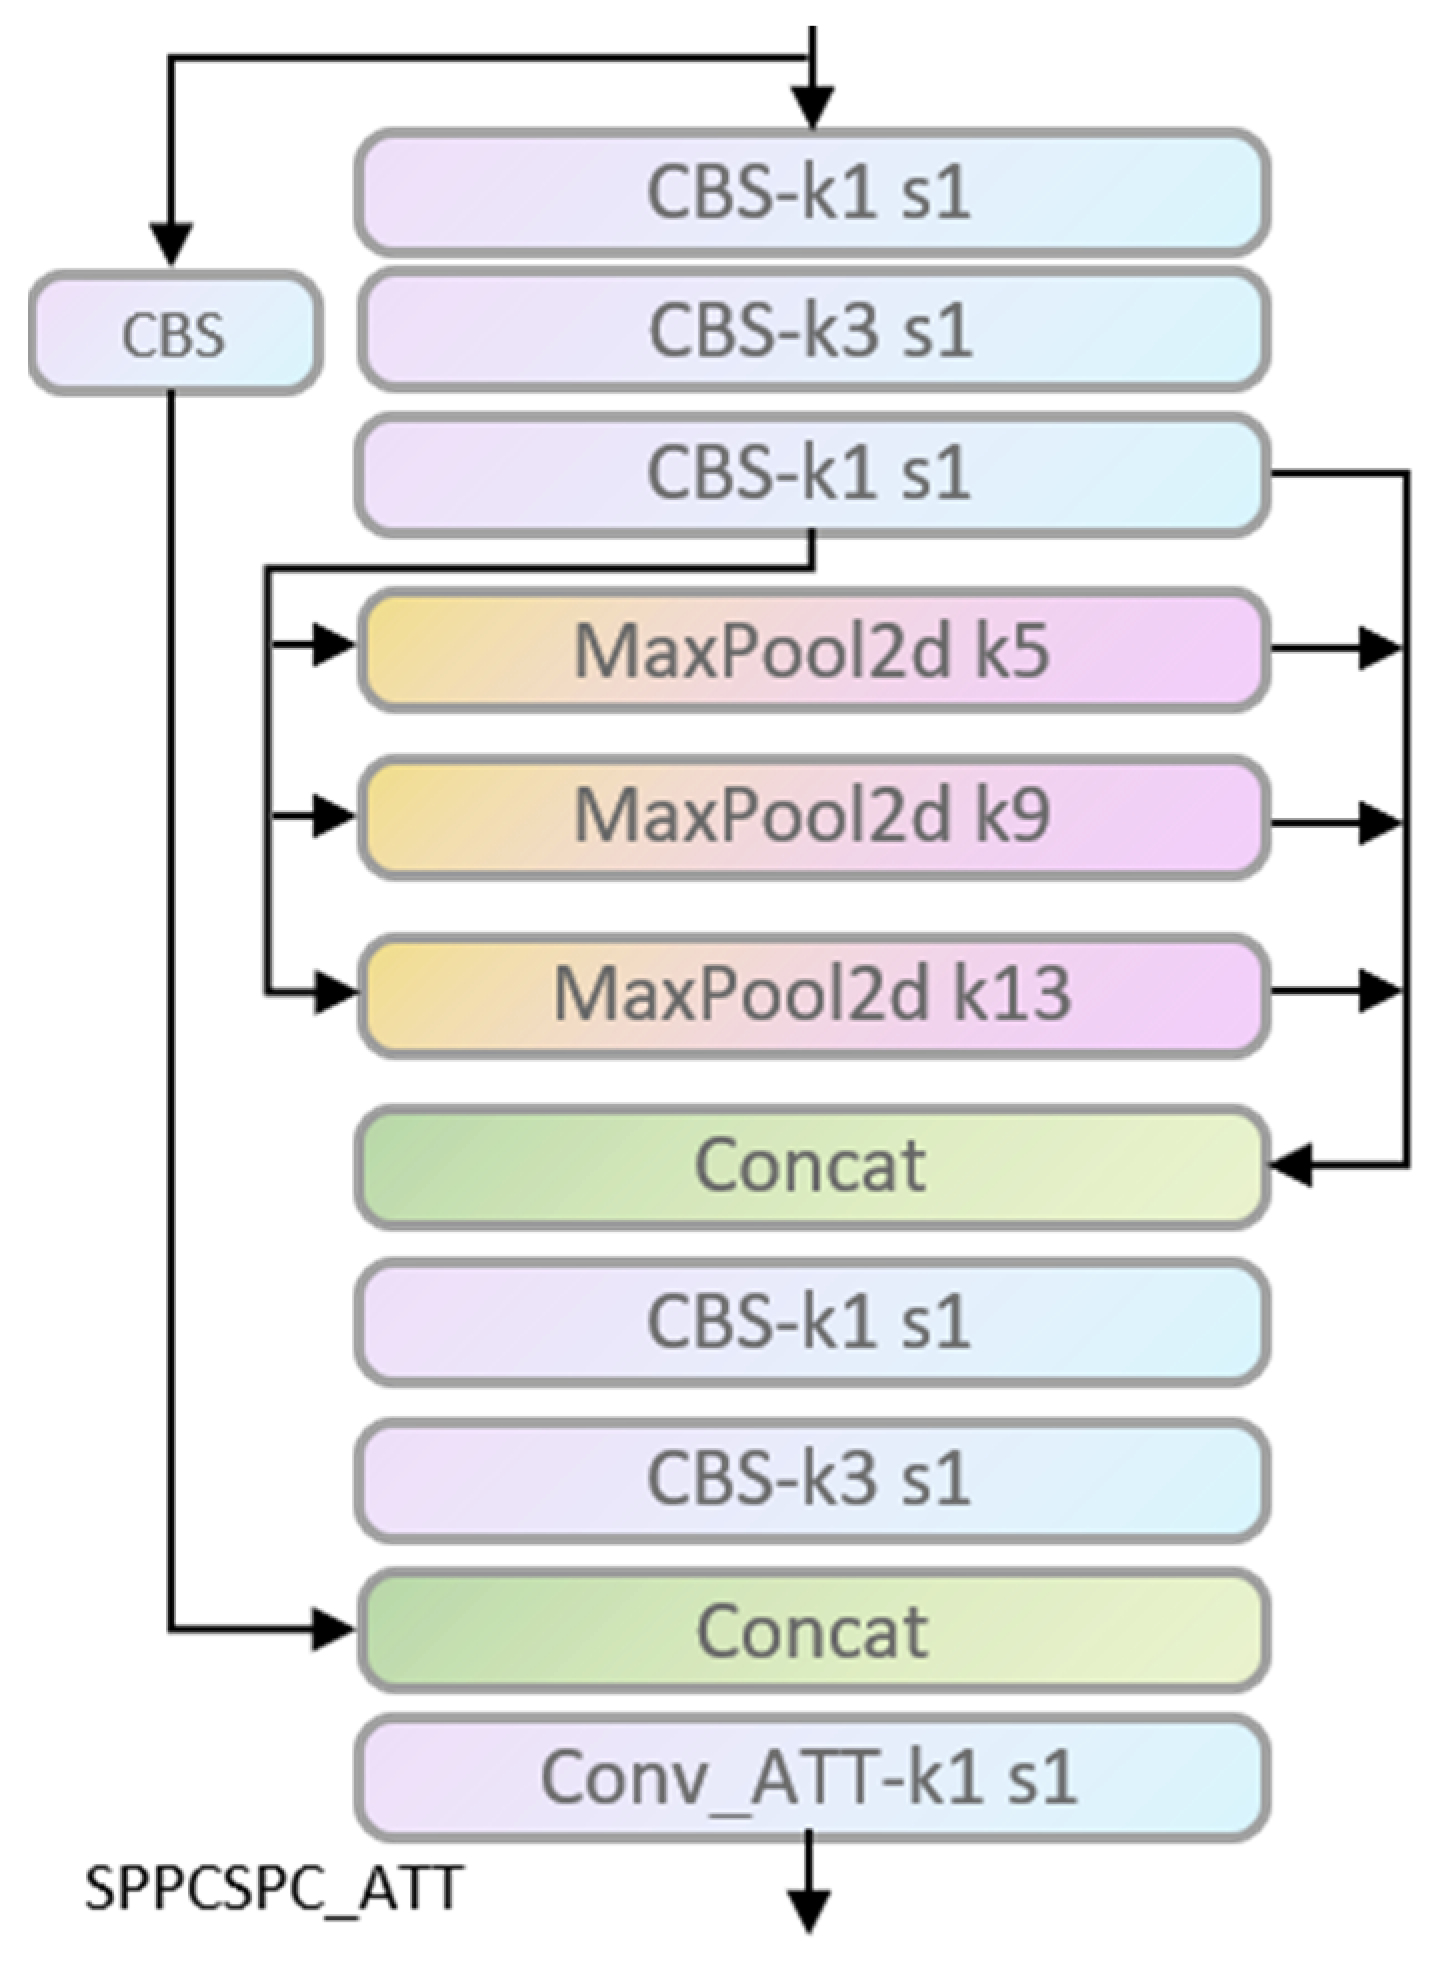
SPPCSPC_ATT module.

Figure 11.
Statistics on the distribution of different defect categories in the dataset.

Figure 12.
Failure example thermal imaging collection.

Figure 13.
Comparison of network [email protected] curves before and after improvement.
Figure 13.
Comparison of network [email protected] curves before and after improvement.

Figure 14.
Comparison of network [email protected] curves before and after improvement.
Figure 14.
Comparison of network [email protected] curves before and after improvement.

Figure 15.
Recall-comparison curves before and after YOLOv7 and YOLOv7-GX network improvement.

Figure 16.
Detection effect of different algorithms on the same detected image.


Table 1.
Performance comparison of different network models.
| Arithmetic | [email protected] | R | Fracture | Hot Spot | Plant | Battery String |
|---|---|---|---|---|---|---|
| YOLOV5s | 83.4 | 77.3 | 96.1 | 60.7 | 83.7 | 93 |
| YOLOX | 85.0 | 79.5 | 75 | 80 | 93 | 92 |
| YOLOV7 | 88.4 | 81.5 | 98.4 | 70.1 | 90.3 | 94.9 |
| YOLOV8 | 91.8 | 85.2 | 98.8 | 79.3 | 92.6 | 96.5 |
| YOLOV7-GX | 94.8 | 91.2 | 99.5 | 88.3 | 94.1 | 97.5 |
Note: Indicators in the table are expressed in percentages.
Table 2.
Effectiveness of different modules in detecting the model.
| GhostSlimFPN | GAM | XIOU | Weighting | mAP (%) |
|---|---|---|---|---|
| 88.4 | ||||
| √ | 91.4 | |||
| √ | 92.7 | |||
| √ | 91.5 | |||
| √ | 92.4 | |||
| √ | √ | √ | √ | 94.8 |
Disclaimer/Publisher’s Note: The statements, opinions and data contained in all publications are solely those of the individual author(s) and contributor(s) and not of MDPI and/or the editor(s). MDPI and/or the editor(s) disclaim responsibility for any injury to people or property resulting from any ideas, methods, instructions or products referred to in the content. |
© 2024 by the authors. Licensee MDPI, Basel, Switzerland. This article is an open access article distributed under the terms and conditions of the Creative Commons Attribution (CC BY) license (https://creativecommons.org/licenses/by/4.0/).
Share and Cite
MDPI and ACS Style
Wang, Y.; Zhao, J.; Yan, Y.; Zhao, Z.; Hu, X. Pushing the Boundaries of Solar Panel Inspection: Elevated Defect Detection with YOLOv7-GX Technology. Electronics 2024, 13, 1467. https://doi.org/10.3390/electronics13081467
AMA Style
Wang Y, Zhao J, Yan Y, Zhao Z, Hu X. Pushing the Boundaries of Solar Panel Inspection: Elevated Defect Detection with YOLOv7-GX Technology. Electronics. 2024; 13(8):1467. https://doi.org/10.3390/electronics13081467
Chicago/Turabian StyleWang, Yin, Jingyong Zhao, Yihua Yan, Zhicheng Zhao, and Xiao Hu. 2024. "Pushing the Boundaries of Solar Panel Inspection: Elevated Defect Detection with YOLOv7-GX Technology" Electronics 13, no. 8: 1467. https://doi.org/10.3390/electronics13081467
Note that from the first issue of 2016, this journal uses article numbers instead of page numbers. See further details here.