

Pancreatic Beta Cell Function in Infants Varies by Maternal Weight

 , , ,
, , ,
Abstract
1. Introduction
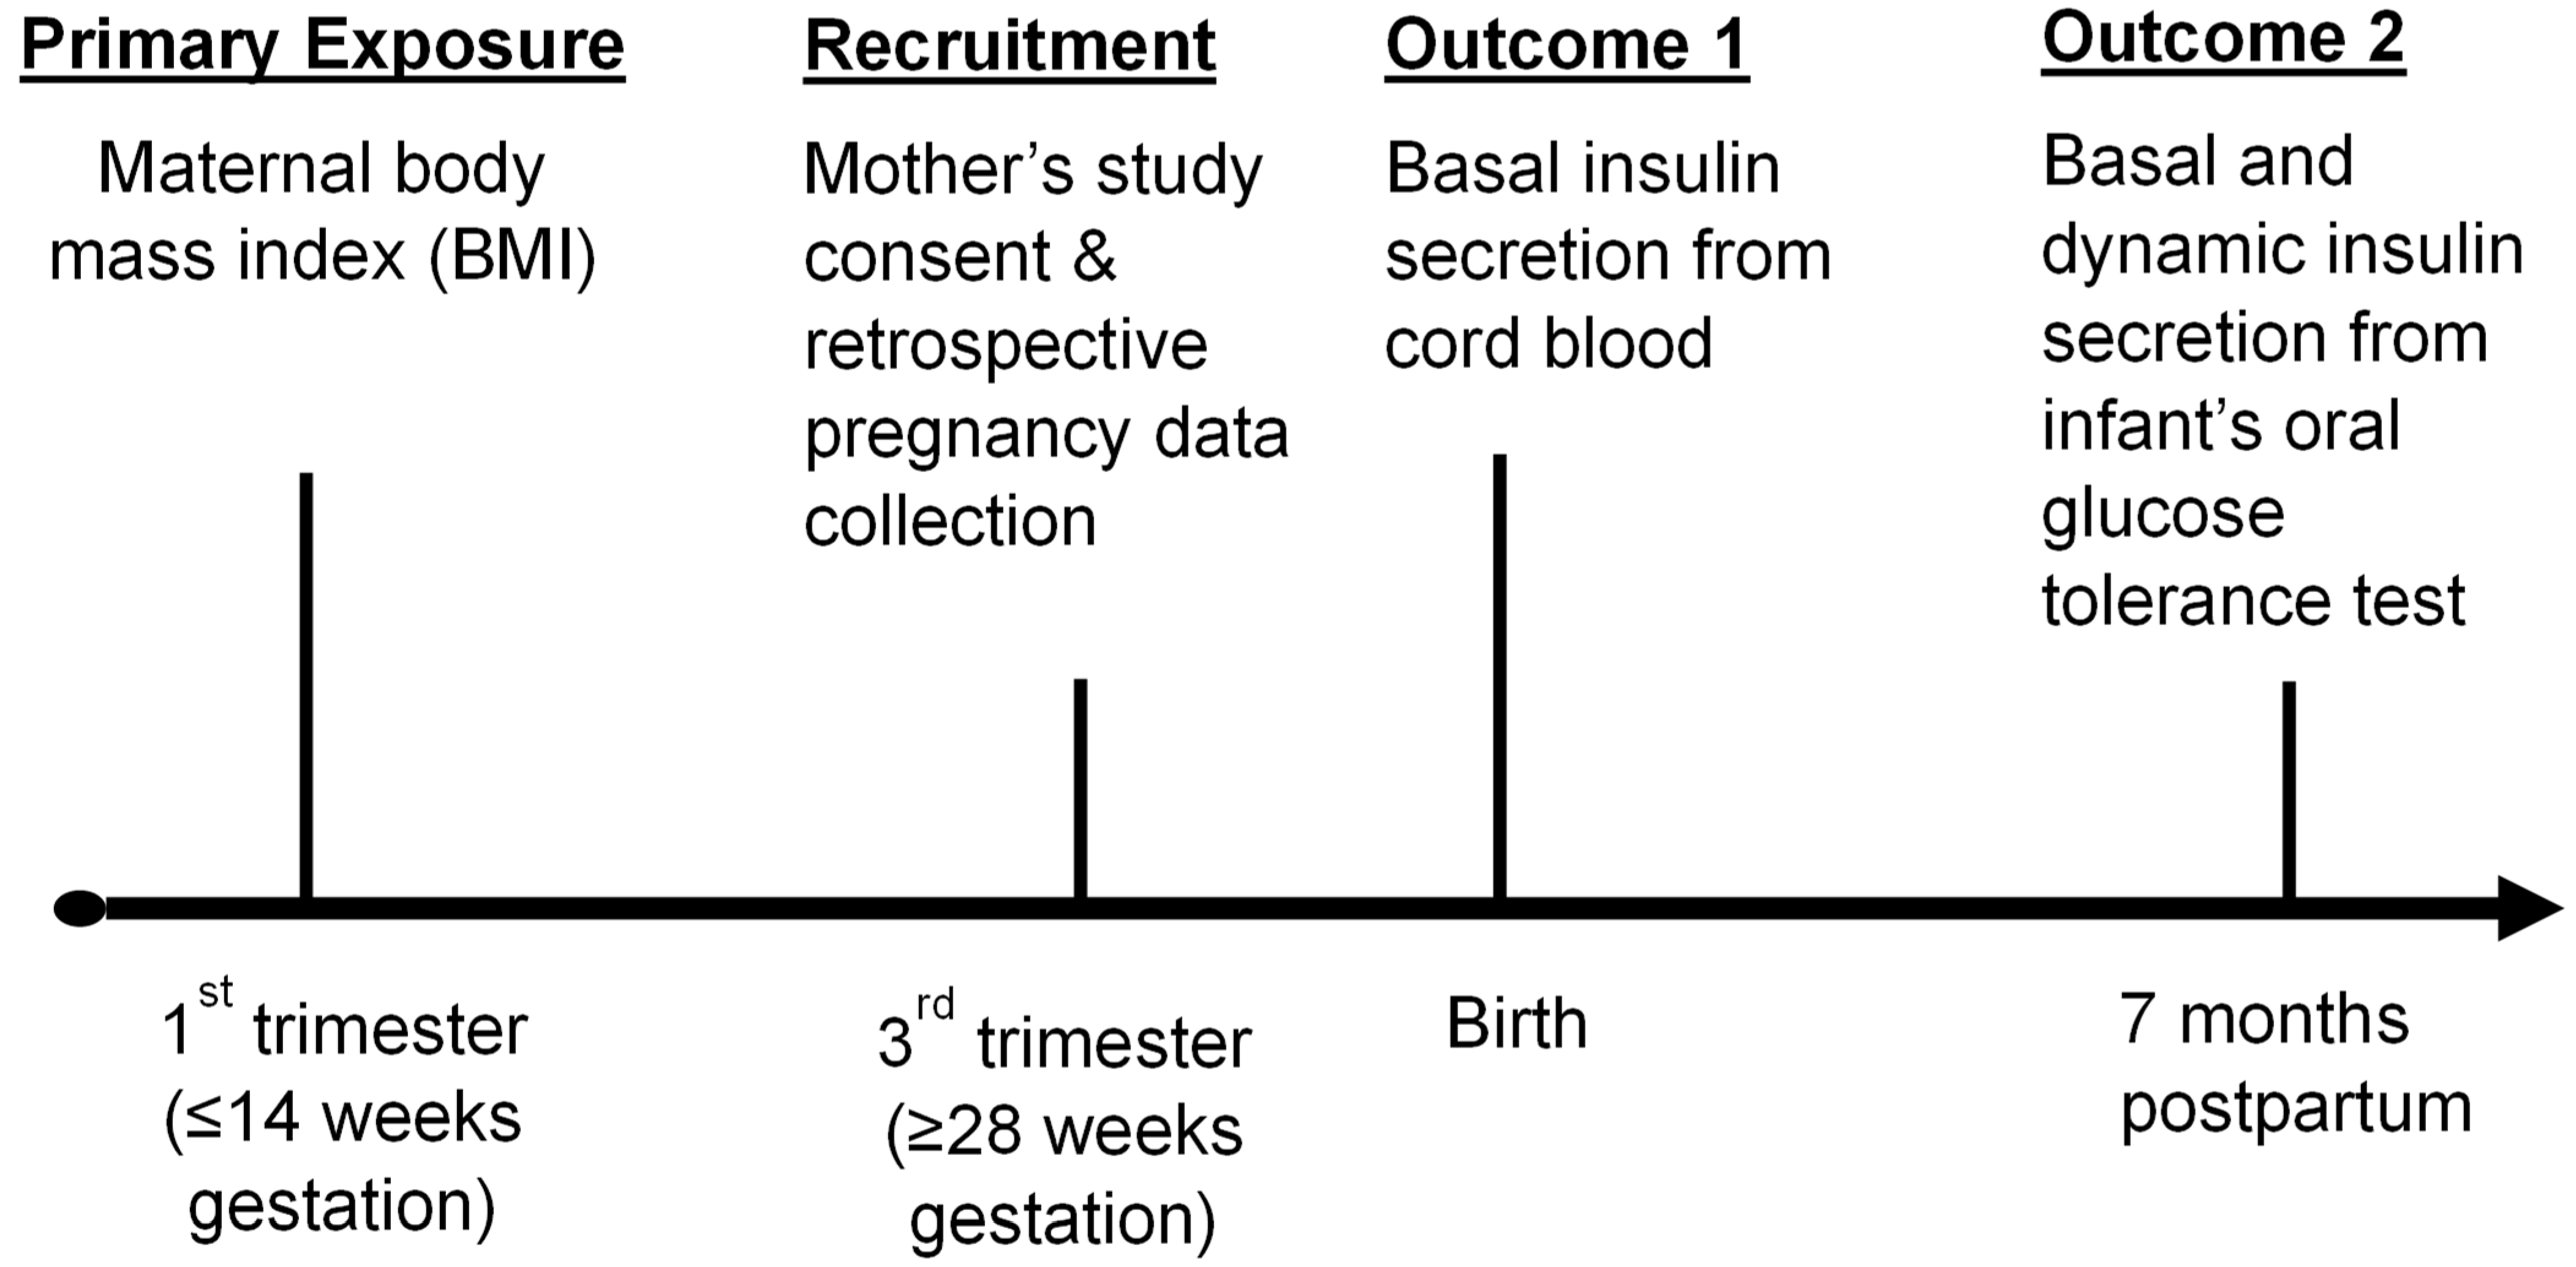
2. Materials and Methods
Analysis
3. Results
4. Discussion
Author Contributions
Funding
Institutional Review Board Statement
Informed Consent Statement
Data Availability Statement
Acknowledgments
Conflicts of Interest
References
- International Diabetes Federation. IDF Diabetes Atlas. 2021. Available online: https://diabetesatlas.org/ (accessed on 14 September 2022).
- Bommer, C.; Sagalova, V.; Heesemann, E.; Manne-Goehler, J.; Atun, R.; Barnighausen, T.; Davies, J.; Vollmer, S. Global Economic Burden of Diabetes in Adults: Projections from 2015 to 2030. Diabetes Care 2018, 41, 963–970. [Google Scholar] [CrossRef] [PubMed]
- Songer, T.J.; Haymond, M.W.; Glazner, J.E.; Klingensmith, G.J.; Laffel, L.M.; Zhang, P.; Hirst, K.; Group, T.S. Healthcare and associated costs related to type 2 diabetes in youth and adolescence: The TODAY clinical trial experience. Pediatr. Diabetes 2019, 20, 702–711. [Google Scholar] [CrossRef] [PubMed]
- de Rooij, S.R.; Painter, R.C.; Phillips, D.I.; Osmond, C.; Michels, R.P.; Godsland, I.F.; Bossuyt, P.M.; Bleker, O.P.; Roseboom, T.J. Impaired insulin secretion after prenatal exposure to the Dutch famine. Diabetes Care 2006, 29, 1897–1901. [Google Scholar] [CrossRef] [PubMed]
- Catalano, P.M.; Presley, L.; Minium, J.; Hauguel-de Mouzon, S. Fetuses of obese mothers develop insulin resistance in utero. Diabetes Care 2009, 32, 1076–1080. [Google Scholar] [CrossRef]
- Dabelea, D.; Mayer-Davis, E.J.; Lamichhane, A.P.; D’Agostino, R.B., Jr.; Liese, A.D.; Vehik, K.S.; Narayan, K.M.; Zeitler, P.; Hamman, R.F. Association of intrauterine exposure to maternal diabetes and obesity with type 2 diabetes in youth: The SEARCH Case-Control Study. Diabetes Care 2008, 31, 1422–1426. [Google Scholar] [CrossRef] [PubMed]
- Barker, D.J. The developmental origins of insulin resistance. Horm. Res. 2005, 64 (Suppl. S3), 2–7. [Google Scholar] [CrossRef]
- Fleming, T.P.; Sun, C.; Denisenko, O.; Caetano, L.; Aljahdali, A.; Gould, J.M.; Khurana, P. Environmental Exposures around Conception: Developmental Pathways Leading to Lifetime Disease Risk. Int. J. Environ. Res. Public Health 2021, 18, 9380. [Google Scholar] [CrossRef]
- Heijmans, B.T.; Tobi, E.W.; Stein, A.D.; Putter, H.; Blauw, G.J.; Susser, E.S.; Slagboom, P.E.; Lumey, L.H. Persistent epigenetic differences associated with prenatal exposure to famine in humans. Proc. Natl. Acad. Sci. USA 2008, 105, 17046–17049. [Google Scholar] [CrossRef]
- Tobi, E.W.; Lumey, L.H.; Talens, R.P.; Kremer, D.; Putter, H.; Stein, A.D.; Slagboom, P.E.; Heijmans, B.T. DNA methylation differences after exposure to prenatal famine are common and timing- and sex-specific. Hum. Mol. Genet. 2009, 18, 4046–4053. [Google Scholar] [CrossRef]
- Finer, S.; Mathews, C.; Lowe, R.; Smart, M.; Hillman, S.; Foo, L.; Sinha, A.; Williams, D.; Rakyan, V.K.; Hitman, G.A. Maternal gestational diabetes is associated with genome-wide DNA methylation variation in placenta and cord blood of exposed offspring. Hum. Mol. Genet. 2015, 24, 3021–3029. [Google Scholar] [CrossRef]
- Chen, P.; Piaggi, P.; Traurig, M.; Bogardus, C.; Knowler, W.C.; Baier, L.J.; Hanson, R.L. Differential methylation of genes in individuals exposed to maternal diabetes in utero. Diabetologia 2017, 60, 645–655. [Google Scholar] [CrossRef] [PubMed]
- Donato, J., Jr. Programming of metabolism by adipokines during development. Nat. Rev. Endocrinol. 2023, 19, 385–397. [Google Scholar] [CrossRef] [PubMed]
- Ponrartana, S.; Goodarzian, F.; Emadi, S.; Aggabao, P.C.; Fisher, C.L.; Gilsanz, V. Radiographic depiction of intra-abdominal fat in newborns: A marker of infants born to diabetic mothers. J. Perinatol. 2016, 36, 389–391. [Google Scholar] [CrossRef] [PubMed]
- Nelson, L.; Turkel, S.; Shulman, I.; Gabbe, S. Pancreatic-islet fibrosis in young infants of diabetic mothers. Lancet 1977, 2, 362–363. [Google Scholar] [CrossRef] [PubMed]
- Narayan, K.M.V.; Kondal, D.; Daya, N.; Gujral, U.P.; Mohan, D.; Patel, S.A.; Shivashankar, R.; Anjana, R.M.; Staimez, L.R.; Ali, M.K.; et al. Incidence and pathophysiology of diabetes in South Asian adults living in India and Pakistan compared with US blacks and whites. BMJ Open Diabetes Res. Care 2021, 9, e001927. [Google Scholar] [CrossRef] [PubMed]
- Narayan, K.M.V.; Kondal, D.; Kobes, S.; Staimez, L.R.; Mohan, D.; Gujral, U.P.; Patel, S.A.; Anjana, R.M.; Shivashankar, R.; Ali, M.K.; et al. Incidence of diabetes in South Asian young adults compared to Pima Indians. BMJ Open Diabetes Res. Care 2021, 9, e001988. [Google Scholar] [CrossRef] [PubMed]
- Kusneniwar, G.N.; Whelan, R.M.; Betha, K.; Robertson, J.M.; Ramidi, P.R.; Balasubramanian, K.; Kamasamudram, V.; Haggerty, C.L.; Bunker, C.H.; Reddy, P.S. Cohort Profile: The Longitudinal Indian Family hEalth (LIFE) Pilot Study, Telangana State, India. Int. J. Epidemiol. 2017, 46, 788–789j. [Google Scholar] [CrossRef] [PubMed]
- WHO. Expert Consultation. Appropriate body-mass index for Asian populations and its implications for policy and intervention strategies. Lancet 2004, 363, 157–163. [Google Scholar] [CrossRef] [PubMed]
- Staimez, L.R.; Khandelwal, S.; Dutta, A.; Gupta, R.; Noule, H.; Kothari, S.; Kamate, M.; Patil, K.; Prabhakaran, D.; Prabhakaran, P. Assessing risk of type 2 diabetes in childhood: The feasibility of applying population measures to pediatric populations. In Proceedings of the American Public Health Association Conference, Oral Presentation, Atlanta, GA, USA, 4–8 November 2017. [Google Scholar]
- Institute of Medicine NRC. Weight Gain during Pregnancy: Reexamining the Guidelines; The National Academies Collection: Reports funded by National Institutes of Health; Rasmussen, K.M., Yaktine, A.L., Eds.; The National Academies Press: Washington, DC, USA, 2009. [Google Scholar]
- Hill, N.R.; Levy, J.C.; Matthews, D.R. Expansion of the homeostasis model assessment of beta-cell function and insulin resistance to enable clinical trial outcome modeling through the interactive adjustment of physiology and treatment effects: iHOMA2. Diabetes Care 2013, 36, 2324–2330. [Google Scholar] [CrossRef]
- World Health Organization. WHO Anthro for Personal Computers, Version 3.2.2 2011: Software for Assessing Growth and Development of the World’s Children; WHO: Geneva, Switzerland, 2010. [Google Scholar]
- Milovanovic, I.; Njuieyon, F.; Deghmoun, S.; Chevenne, D.; Levy-Marchal, C.; Beltrand, J. SGA children with moderate catch-up growth are showing the impaired insulin secretion at the age of 4. PLoS ONE 2014, 9, e100337. [Google Scholar] [CrossRef]
- Utzschneider, K.M.; Prigeon, R.L.; Tong, J.; Gerchman, F.; Carr, D.B.; Zraika, S.; Udayasankar, J.; Montgomery, B.; Mari, A.; Kahn, S.E. Within-subject variability of measures of beta cell function derived from a 2 h OGTT: Implications for research studies. Diabetologia 2007, 50, 2516–2525. [Google Scholar] [CrossRef]
- Wasserstein, R.L.; Shchirm, A.L.; Lazar, N.A. Moving to a World beyond “p < 0.05”. Am. Stat. 2019, 73, 1–19. [Google Scholar] [CrossRef]
- Wasserstein, R.L.; Lazar, N.A. The ASA’s Statement on p-Values: Context, Process, and Purpose. Am. Stat. 2016, 70, 129–133. [Google Scholar] [CrossRef]
- Greenland, S.; Senn, S.J.; Rothman, K.J.; Carlin, J.B.; Poole, C.; Goodman, S.N.; Altman, D.G. Statistical tests, P values, confidence intervals, and power: A guide to misinterpretations. Eur. J. Epidemiol. 2016, 31, 337–350. [Google Scholar] [CrossRef] [PubMed]
- Bergman, R.N.; Phillips, L.S.; Cobelli, C. Physiologic evaluation of factors controlling glucose tolerance in man: Measurement of insulin sensitivity and beta-cell glucose sensitivity from the response to intravenous glucose. J. Clin. Investig. 1981, 68, 1456–1467. [Google Scholar] [CrossRef]
- Utzschneider, K.M.; Prigeon, R.L.; Faulenbach, M.V.; Tong, J.; Carr, D.B.; Boyko, E.J.; Leonetti, D.L.; McNeely, M.J.; Fujimoto, W.Y.; Kahn, W.E. Oral disposition index predicts the development of future diabetes above and beyond fasting and 2-h glucose levels. Diabetes Care 2009, 32, 335–341. [Google Scholar] [CrossRef] [PubMed]
- Retnakaran, R.; Shen, S.; Hanley, A.J.; Vuksan, V.; Hamilton, J.K.; Zinman, B. Hyperbolic relationship between insulin secretion and sensitivity on oral glucose tolerance test. Obesity 2008, 16, 1901–1907. [Google Scholar] [CrossRef]
- Yajnik, C.S.; Bandopadhyay, S.; Bhalerao, A.; Bhat, D.S.; Phatak, S.B.; Wagh, R.H.; Yajnik, P.C.; Pandit, A.; Bhave, S.; Coyaji, K.; et al. Poor in Utero Growth, and Reduced beta-Cell Compensation and High Fasting Glucose from Childhood, Are Harbingers of Glucose Intolerance in Young Indians. Diabetes Care 2021, 44, 2747–2757. [Google Scholar] [CrossRef]
- Gregg, B.E.; Moore, P.C.; Demozay, D.; Hall, B.A.; Li, M.; Husain, A.; Wright, A.J.; Atkinson, M.A.; Rhodes, C.J. Formation of a human beta-cell population within pancreatic islets is set early in life. J. Clin. Endocrinol. Metab. 2012, 97, 3197–3206. [Google Scholar] [CrossRef] [PubMed]
- Perez-Ramirez, C.A.; Nakano, H.; Law, R.C.; Matulionis, N.; Thompson, J.; Pfeiffer, A.; Park, J.O.; Nakano, A.; Christofk, H.R. Atlas of fetal metabolism during mid-to-late gestation and diabetic pregnancy. Cell 2024, 187, 204–215.e14. [Google Scholar] [CrossRef] [PubMed]
- Haddad-Tovolli, R.; Claret, M. Metabolic and feeding adjustments during pregnancy. Nat. Rev. Endocrinol. 2023, 19, 564–580. [Google Scholar] [CrossRef]
- Hales, C.N.; Barker, D.J. Type 2 (non-insulin-dependent) diabetes mellitus: The thrifty phenotype hypothesis. Diabetologia 1992, 35, 595–601. [Google Scholar] [CrossRef]
- Dwarkanath, P.; Kurpad, A.V.; Muthayya, S.; Thomas, T.; Mhaskar, A.; Mhaskar, R.; Thomas, A.; Vaz, M.; Jahoor, F. Glucose kinetics and pregnancy outcome in Indian women with low and normal body mass indices. Eur. J. Clin. Nutr. 2009, 63, 1327–1334. [Google Scholar] [CrossRef] [PubMed]
- Duggleby, S.L.; Jackson, A.A. Relationship of maternal protein turnover and lean body mass during pregnancy and birth length. Clin. Sci. 2001, 101, 65–72. [Google Scholar] [CrossRef]
- Strain, J.; Spaans, F.; Serhan, M.; Davidge, S.T.; Connor, K.L. Programming of weight and obesity across the lifecourse by the maternal metabolic exposome: A systematic review. Mol Aspects Med 2022, 87, 100986. [Google Scholar] [CrossRef]
- Soto, N.; Bazaes, R.A.; Pena, V.; Salazar, T.; Avila, A.; Iniguez, G.; Ong, K.K.; Dunger, D.B.; Mericq, M.V. Insulin sensitivity and secretion are related to catch-up growth in small-for-gestational-age infants at age 1 year: Results from a prospective cohort. J. Clin. Endocrinol. Metab. 2003, 88, 3645–3650. [Google Scholar] [CrossRef] [PubMed]
- Fleddermann, M.; Rauh-Pfeiffer, A.; Demmelmair, H.; Holdt, L.; Teupser, D.; Koletzko, B. Effects of a Follow-On Formula Containing Isomaltulose (Palatinose) on Metabolic Response, Acceptance, Tolerance and Safety in Infants: A Randomized-Controlled Trial. PLoS ONE 2016, 11, e0151614. [Google Scholar] [CrossRef] [PubMed]
- Coffey, D. Prepregnancy body mass and weight gain during pregnancy in India and sub-Saharan Africa. Proc. Natl. Acad. Sci. USA 2015, 112, 3302–3307. [Google Scholar] [CrossRef] [PubMed]
- Prasad, R.B.; Asplund, O.; Shukla, S.R.; Wagh, R.; Kunte, P.; Bhat, D.; Parekh, M.; Shah, M.; Phatak, S.; Karajamaki, A.; et al. Subgroups of patients with young-onset type 2 diabetes in India reveal insulin deficiency as a major driver. Diabetologia 2022, 65, 65–78. [Google Scholar] [CrossRef]
- Chopra, M.; Kaur, N.; Singh, K.D.; Maria Jacob, C.; Divakar, H.; Babu, G.R.; Hong Nguyen, P.; Bhanot, A.; Sabharwal, M.; Deb, S.; et al. Population estimates, consequences, and risk factors of obesity among pregnant and postpartum women in India: Results from a national survey and policy recommendations. Int. J. Gynaecol. Obstet. 2020, 151 (Suppl. S1), 57–67. [Google Scholar] [CrossRef]


| Characteristics | Underweight Mothers (n = 63) | Normal Weight Mothers (n = 43) | Overweight Mothers (n = 29) | % Difference Underweight vs. Normal Weight | % Difference Overweight vs. Normal Weight | |||
|---|---|---|---|---|---|---|---|---|
| Mother | Mean (SD) or n (%) | Mean (SD) or n (%) | Mean (SD) or n (%) | |||||
| Age at delivery (yrs) | 23.0 | 3.0 | 22.7 | 3.0 | 23.8 | 3.0 | 1.3 | 4.8 |
| Height (cm) | 153.1 | 5.7 | 151.8 | 5.5 | 152.0 | 5.7 | 1.3 | 0.2 |
| Family history of diabetes (n, %) | 14 | 22.2 | 11 | 25.6 | 10 | 34.5 | −3.4 | 8.9 |
| Highest education: 10th grade or less (n, %) | 45 | 71.4 | 3.0 | 58.1 | 13 | 44.8 | 13.3 | −13.3 |
| Income (Indian Rupee) | 10,920 | 4330 | 10,560 | 3100 | 12,720 | 9680 | 3.4 | 20.5 |
| Religion: Hindu (n, %) | 60 | 95.2 | 36 | 83.7 | 25 | 86.2 | 11.5 | 2.5 |
| Random Glucose–1st trimester (mg/dL) | 88.0 | 14.2 | 88.7 | 17.2 | 87.7 | 11.9 | −0.8 | −1.1 |
| Glucose from 50 g Glucose Challenge Test (mg/dL) | 103.6 | 23.2 | 101.3 | 23.9 | 106.2 | 23.8 | 2.3 | 4.8 |
| BMI 1st trimester (kg/m2) | 17.0 | 1.2 | 20.6 | 1.3 | 25.1 | 1.3 | −17.5 | 21.8 |
| Weight 1st trimester (kg) | 39.7 | 4.2 | 47.5 | 4.4 | 58.2 | 6.7 | −16.4 | 22.5 |
| Weight 2nd trimester (kg) | 42.1 | 4.6 | 49.0 | 4.9 | 59.3 | 6.7 | −14.1 | 21.0 |
| Weight 3rd trimester (kg) | 50.3 | 5.7 | 57.8 | 6.3 | 68.0 | 7.8 | −13.0 | 17.6 |
| Total Weight Gain (kg) | 11.5 | 3.9 | 11.1 | 3.5 | 10.5 | 4.2 | 3.6 | −5.4 |
| Infant | ||||||||
| Gestational Age at birth (weeks) | 38.2 | 1.7 | 38.0 | 1.9 | 37.9 | 1.4 | 0.5 | −0.3 |
| Sex: female (n, %) | 31 | 49.2 | 24 | 55.8 | 14 | 48.3 | −6.6 | −7.5 |
| Preterm birth (n, %) | 7 | 11.1 | 9 | 20.9 | 7 | 24.1 | −9.8 | 3.2 |
| Birth weight (g) | 2680 | 380 | 2820 | 410 | 2930 | 430 | −5.2 | 3.7 |
| Weight for Age Z score | −1.3 | 0.8 | −1.2 | 1.1 | −0.9 | 1.0 | −0.1 * | 0.3 * |
| Length at birth (cm) | 47.0 | 2.3 | 47.2 | 2.7 | 46.7 | 3.6 | −0.4 | −1.1 |
| Length for Age Z score | −1.3 | 1.2 | −1.3 | 1.4 | −1.3 | 1.3 | 0 * | 0 * |
| Head Circumference (cm) | 33.4 | 2.5 | 33.6 | 3.2 | 34.6 | 3.5 | −0.6 | 3.0 |
| Head Circumference for Age Z score | −0.6 | 2.1 | −0.4 | 2.7 | 0.3 | 3.0 | −0.2 * | 0.7 * |
| Glucose at birth (mg/dL) | 84.9 | 22.0 | 100.5 | 21.9 | 88.5 | 24.0 | −15.5 | −11.9 |
| Insulin at birth (mIU/L) | 5.4 | 8.8 | 4.9 | 7.1 | 4.8 | 5.7 | 10.2 | −3.0 |
| C-peptide at birth (pmol/L) | 260.3 | 243.5 | 231.0 | 245.0 | 246.3 | 153.6 | 12.7 | 6.6 |
| HOMA2-IR at birth (mean, SD) | 0.56 | 0.56 | 0.51 | 0.55 | 0.53 | 0.31 | 9.2 | 3.1 |
| HOMA2-B at birth (mean, SD) | 83.5 | 55.2 | 55.4 | 51.5 | 79.9 | 60.8 | 50.8 | 44.2 |
| Infant Characteristics | Underweight Mothers (n = 63) | Normal Weight Mothers (n = 43) | Overweight Mothers (n = 29) | % Difference Underweight vs. Normal Weight | % Difference Overweight vs. Normal Weight | |||
|---|---|---|---|---|---|---|---|---|
| Mean (SD) or n (%) | Mean (SD) or n (%) | Mean (SD) or n (%) | ||||||
| Age, months ~ | 7.2 | 0.6 | 7.5 | 1.1 | 7.5 | 1.0 | −4.0 | 0.7 |
| Weight (kg) | 7.1 | 0.9 | 7.4 | 0.9 | 7.4 | 1.0 | −3.3 | 1.2 |
| Weight for Age (Z-score) | −1.1 | 1.1 | −0.9 | 1.1 | −0.8 | 1.1 | 0.0 * | 0.0 * |
| Length (cm) | 66.7 | 2.5 | 67.1 | 2.3 | 67.6 | 2.6 | −0.7 | 0.7 |
| Length for Age (Z-score) | −0.8 | 1.1 | −0.7 | 1.0 | −0.6 | 1.0 | 0.0 * | 0.0 * |
| Weight for Length (Z-score) | −0.8 | 1.1 | −0.5 | 1.2 | −0.6 | 1.2 | 0.0 * | 0.0 * |
| Breast Feeding: yes | 50.0 | 79.4 | 37.0 | 86.1 | 24.0 | 82.8 | −6.7 | −3.3 |
| Glucose 0 min (mg/dL) | 79.7 | 9.5 | 82.5 | 12.2 | 82.7 | 15.5 | −3.4 | 0.2 |
| Glucose 30 min (mg/dL) | 105.7 | 22.0 | 114.0 | 21.7 | 109.8 | 22.6 | −7.3 | −3.7 |
| Insulin 0 min (mIU/L) | 2.6 | 3.5 | 2.2 | 2.4 | 4.5 | 7.9 | 15.4 | 103.6 |
| Insulin 30 min (mIU/L) | 8.9 | 7.1 | 9.7 | 8.1 | 10.2 | 7.3 | −8.5 | 4.8 |
| C-Peptide 0 min (pmol/L) | 157.3 | 160.4 | 161.2 | 114.9 | 259.1 | 208.9 | −2.4 | 60.7 |
| C-Peptide 30 min (pmol/L) | 395.3 | 231.7 | 443.8 | 280.4 | 471.4 | 251.0 | −10.9 | 6.2 |
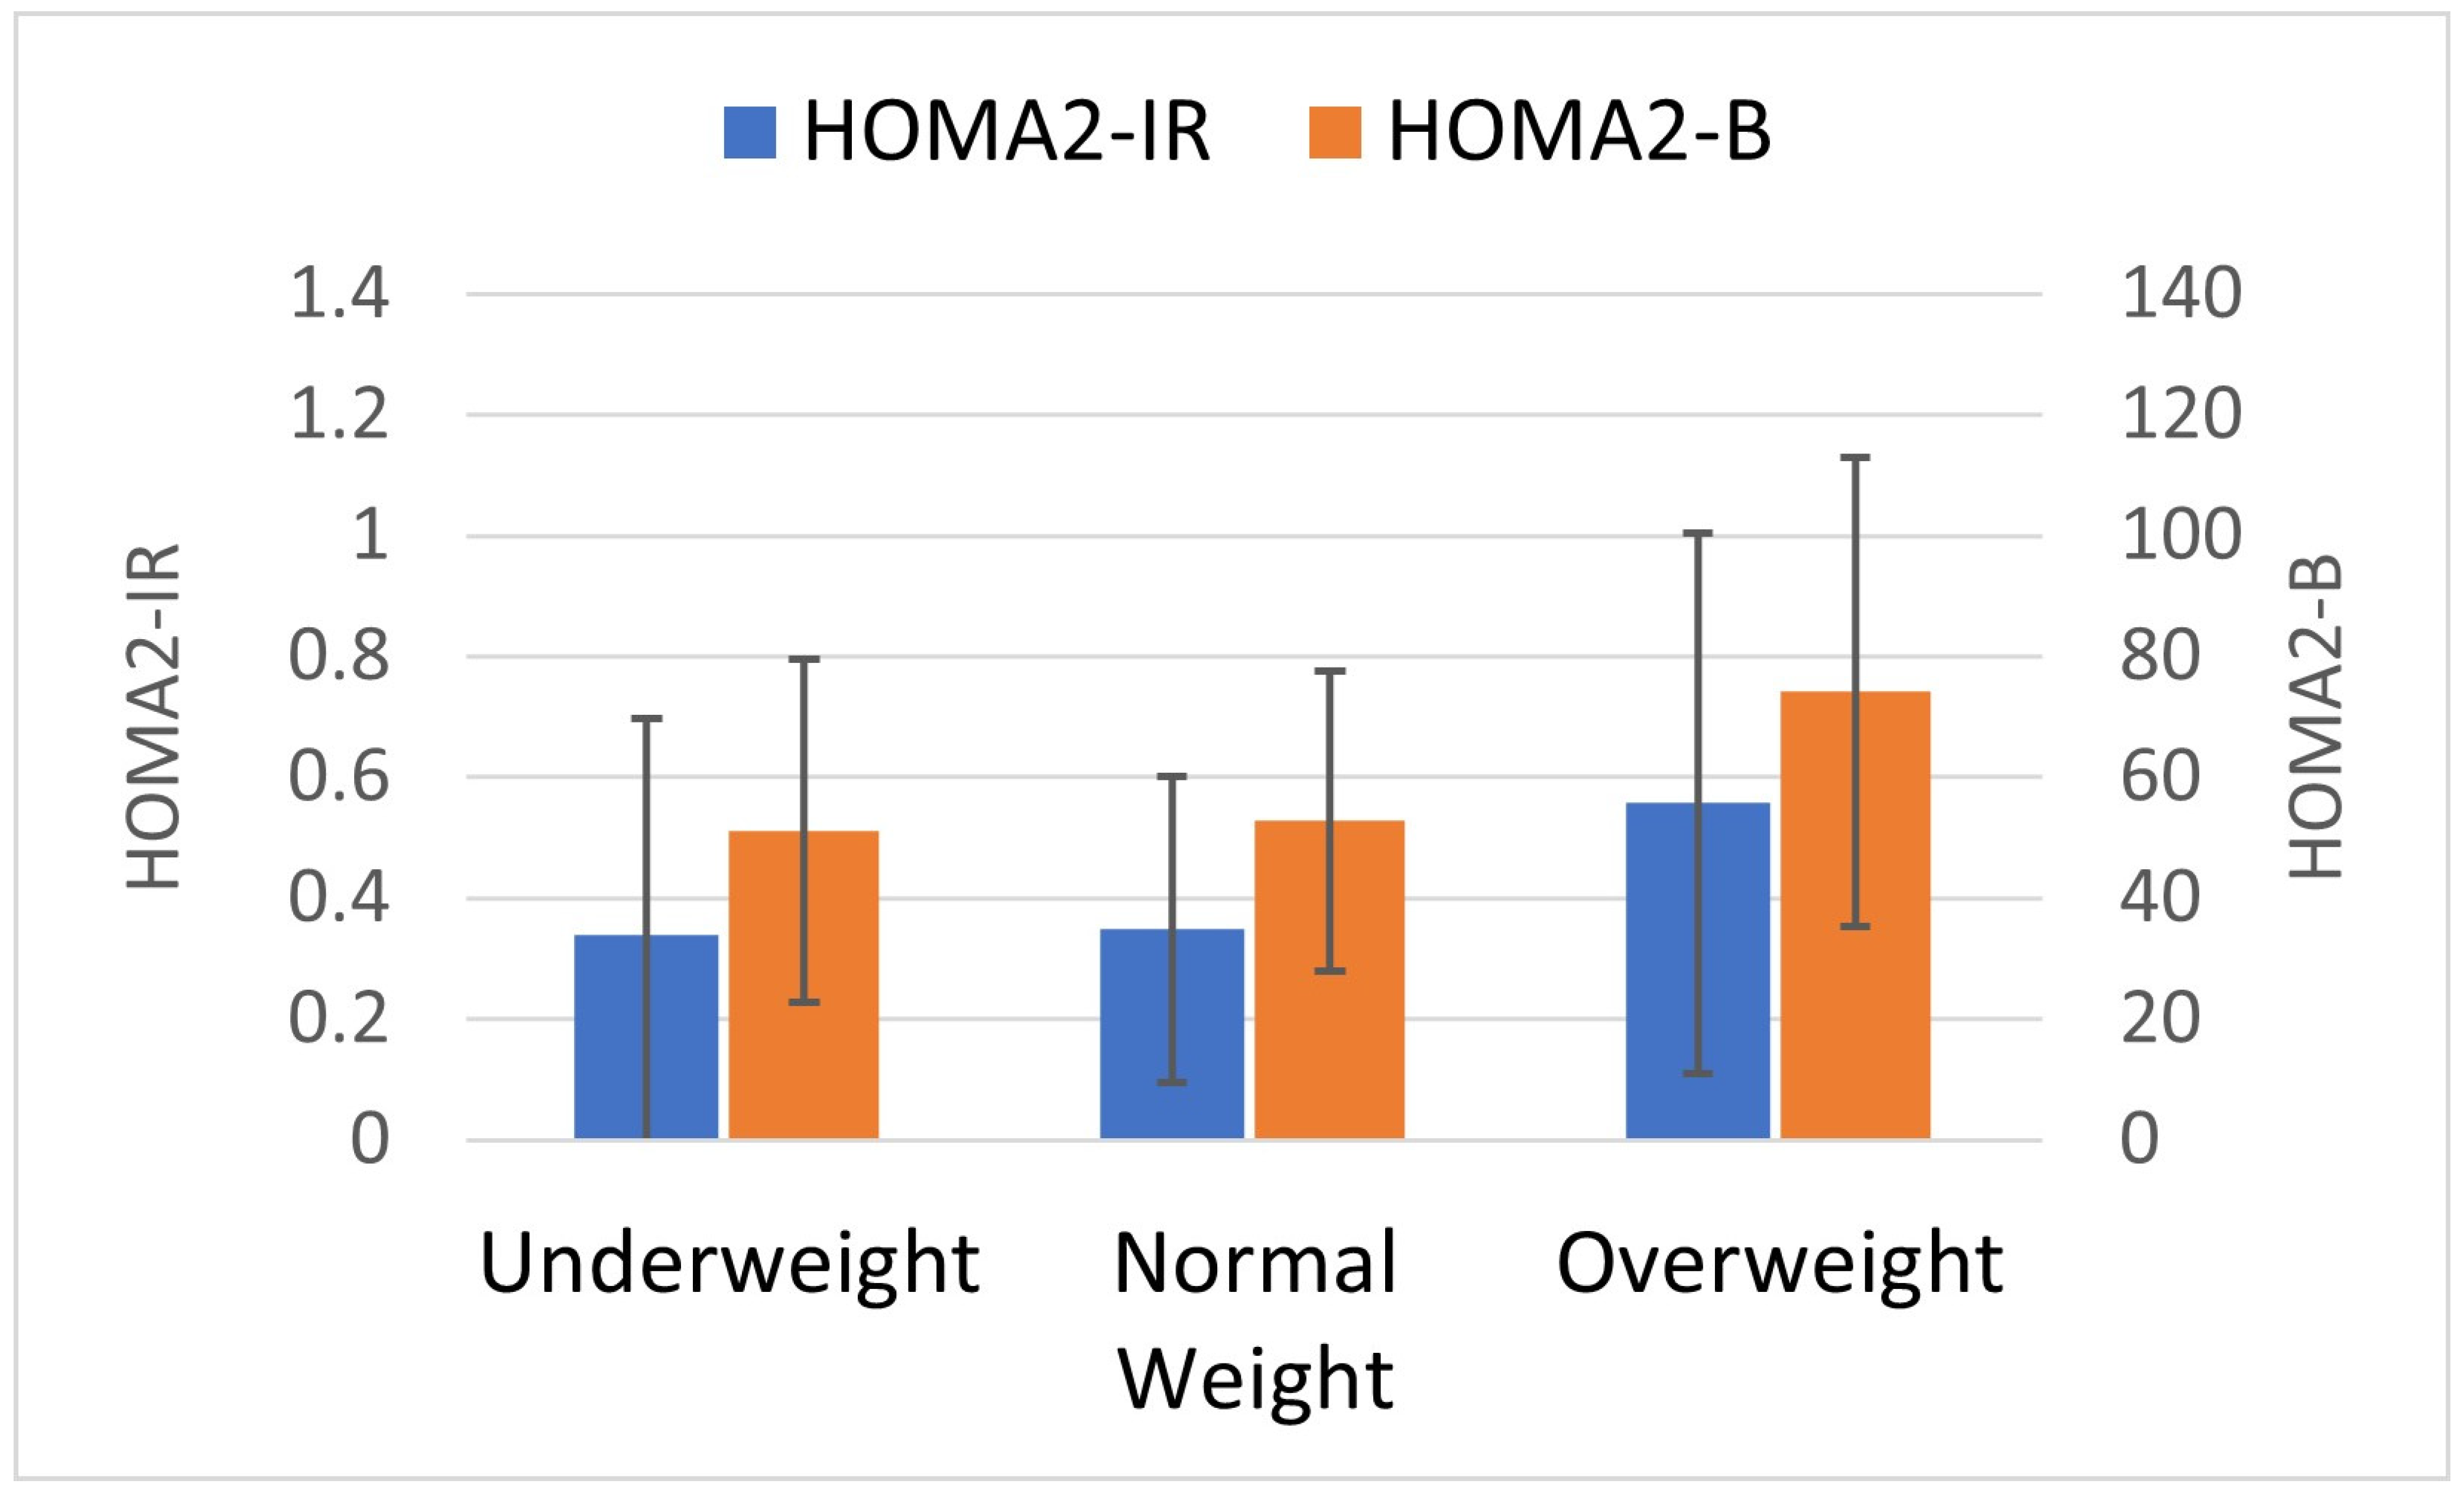
| HOMA2-IR | 0.34 | 0.36 | 0.35 | 0.25 | 0.56 | 0.45 | −3.1 | 59.1 |
| HOMA2-B | 51.1 | 28.4 | 52.8 | 24.9 | 74.2 | 38.8 | −3.1 | 40.6 |
| Insulinogenic Index (using C-peptide, nmol/mmol) | 0.17 | 2.39 | 0.14 | 2.20 | 0.18 | 1.31 | 15.0 | 27.1 |
| Disposition Index (using C-peptide, L/mmol) | 1.9 | 2.5 | 1.3 | 2.6 | 1.2 | 3.7 | 49.2 | −6.8 |
| Beta Maternal Weight | SE Maternal Weight | P(t) Maternal Weight | R-Squared | Model p (F) | |
|---|---|---|---|---|---|
| Models of Static Indices at Birth | |||||
| Model Set 1: Outcome HOMA2-IR | |||||
| Model 1a: Birth HOMA2-IR ~ Maternal Weight Group | 0.15 | 0.10 | 0.14 | 0.02 | 0.14 |
| Model 1b: Birth HOMA2-IR ~ Maternal Weight Group + Pregnancy Weight Gain | 0.15 | 0.10 | 0.14 | 0.02 | 0.32 |
| Model 1c: Birth HOMA2-IR ~ Maternal Weight Group + Education | 0.16 | 0.10 | 0.10 | 0.04 | 0.08 |
| Model 1d: Birth HOMA2-IR ~ Maternal Weight Group + 2nd trimester GCT glucose | 0.20 | 0.10 | 0.05 | 0.03 | 0.15 |
| ,Model 1e: Birth HOMA2-IR ~ Maternal Weight Group + Birth HOMA2-B | −0.05 | 0.07 | 0.49 | 0.53 | <0.0001 |
| Model Set 2: Outcome HOMA2-B | |||||
| Model 2a: Birth HOMA2-B ~ Maternal Weight Group | 0.27 | 0.10 | 0.007 | 0.05 | 0.007 |
| Model 2b: Birth HOMA2-B ~ Maternal Weight Group + Pregnancy Weight Gain | 0.28 | 0.10 | 0.007 | 0.06 | 0.02 |
| Model 2c: Birth HOMA2-B ~ Maternal Weight Group + Education | 0.29 | 0.10 | 0.004 | 0.07 | 0.01 |
| Model 2d: Birth HOMA2-B ~ Maternal Weight Group + 2nd trimester GCT glucose | 0.35 | 0.10 | 0.0005 | 0.1 | 0.002 |
| Model 2e: Birth HOMA2-B ~ Maternal Weight Group + Birth HOMA2-IR | 0.17 | 0.07 | 0.02 | 0.55 | <0.0001 |
| Models of Static Indices at 7 months | |||||
| Model Set 3: Outcome HOMA2-IR | |||||
| Model 3a: HOMA2-IR ~ Maternal Weight Group | 0.20 | 0.13 | 0.11 | 0.02 | 0.11 |
| Model 3b: HOMA2-IR ~ Maternal Weight Group + Pregnancy Weight Gain | 0.20 | 0.13 | 0.12 | 0.03 | 0.18 |
| Model 3c: HOMA2-IR ~ Maternal Weight Group + Education | 0.16 | 0.13 | 0.20 | 0.02 | 0.20 |
| Model 3d: HOMA2-IR ~ Maternal Weight Group + 2nd trimester GCT glucose | 0.22 | 0.13 | 0.09 | 0.03 | 0.17 |
| Model 3e: HOMA2-IR~ Maternal Weight Group +HOMA2-B | −0.02 | 0.06 | 0.66 | 0.82 | <0.0001 |
| Model 3f: HOMA2-IR~ Maternal Weight Group +Birth HOMA2-B | 0.25 | 0.13 | 0.05 | 0.03 | 0.11 |
| Model Set 4: Outcome HOMA2-B | |||||
| Model 4a: HOMA2-B~ Maternal Weight Group | 0.14 | 0.07 | 0.05 | 0.03 | 0.048 |
| Model 4b: HOMA2-B~ Maternal Weight Group + Pregnancy Weight Gain | 0.14 | 0.07 | 0.05 | 0.03 | 0.10 |
| Model 4c: HOMA2-B~ Maternal Weight Group + Education | 0.12 | 0.07 | 0.10 | 0.03 | 0.16 |
| Model 4d: HOMA2-B~ Maternal Weight Group + GCT glucose | 0.14 | 0.07 | 0.06 | 0.03 | 0.15 |
| Model 4e: HOMA2-B~ Maternal Weight Group + HOMA2-IR | 0.04 | 0.03 | 0.21 | 0.82 | <0.0001 |
| Model 4f: HOMA2-B ~ Maternal Weight Group + Birth HOMA2-IR | 0.15 | 0.07 | 0.04 | 0.03 | 0.11 |
| Models of Dynamic Indices at 7 Months | |||||
| Model 5a: Insulinogenic Index~ Maternal Weight Group | 0.12 | 0.12 | 0.31 | 0.009 | 0.31 |
| Model 5b: Insulinogenic Index~ Maternal Weight Group + HOMA2-IR | 0.09 | 0.11 | 0.44 | 0.17 | <0.0001 |
| Model 5c: Disposition Index ~ Maternal Weight Group | 0.02 | 0.13 | 0.87 | 0.0002 | 0.87 |
| Model 5d: Disposition Index ~ Maternal Weight Group + HOMA2-IR | 0.08 | 0.11 | 0.48 | 0.31 | <0.0001 |
Disclaimer/Publisher’s Note: The statements, opinions and data contained in all publications are solely those of the individual author(s) and contributor(s) and not of MDPI and/or the editor(s). MDPI and/or the editor(s) disclaim responsibility for any injury to people or property resulting from any ideas, methods, instructions or products referred to in the content. |
© 2024 by the authors. Licensee MDPI, Basel, Switzerland. This article is an open access article distributed under the terms and conditions of the Creative Commons Attribution (CC BY) license (https://creativecommons.org/licenses/by/4.0/).
Share and Cite
Staimez, L.R.; Dutta, A.; Beyh, Y.S.; Gupta, R.; Noule, H.K.; Sapna, V.; Deepa, K.; Stein, A.D.; Narayan, K.M.V.; Prabhakaran, D.; et al. Pancreatic Beta Cell Function in Infants Varies by Maternal Weight. Metabolites 2024, 14, 208. https://doi.org/10.3390/metabo14040208
Staimez LR, Dutta A, Beyh YS, Gupta R, Noule HK, Sapna V, Deepa K, Stein AD, Narayan KMV, Prabhakaran D, et al. Pancreatic Beta Cell Function in Infants Varies by Maternal Weight. Metabolites. 2024; 14(4):208. https://doi.org/10.3390/metabo14040208
Chicago/Turabian StyleStaimez, Lisa R., Anubrati Dutta, Yara S. Beyh, Ruby Gupta, Hari Krishna Noule, Vyakaranam Sapna, Kothapally Deepa, Aryeh D. Stein, K.M. Venkat Narayan, Dorairaj Prabhakaran, and et al. 2024. "Pancreatic Beta Cell Function in Infants Varies by Maternal Weight" Metabolites 14, no. 4: 208. https://doi.org/10.3390/metabo14040208
APA StyleStaimez, L. R., Dutta, A., Beyh, Y. S., Gupta, R., Noule, H. K., Sapna, V., Deepa, K., Stein, A. D., Narayan, K. M. V., Prabhakaran, D., Kalpana, B., & Prabhakaran, P. (2024). Pancreatic Beta Cell Function in Infants Varies by Maternal Weight. Metabolites, 14(4), 208. https://doi.org/10.3390/metabo14040208