
The Application of Metabolomics in Hyperlipidemia: Insights into Biomarker Discovery and Treatment Efficacy Assessment


Abstract
:1. Introduction
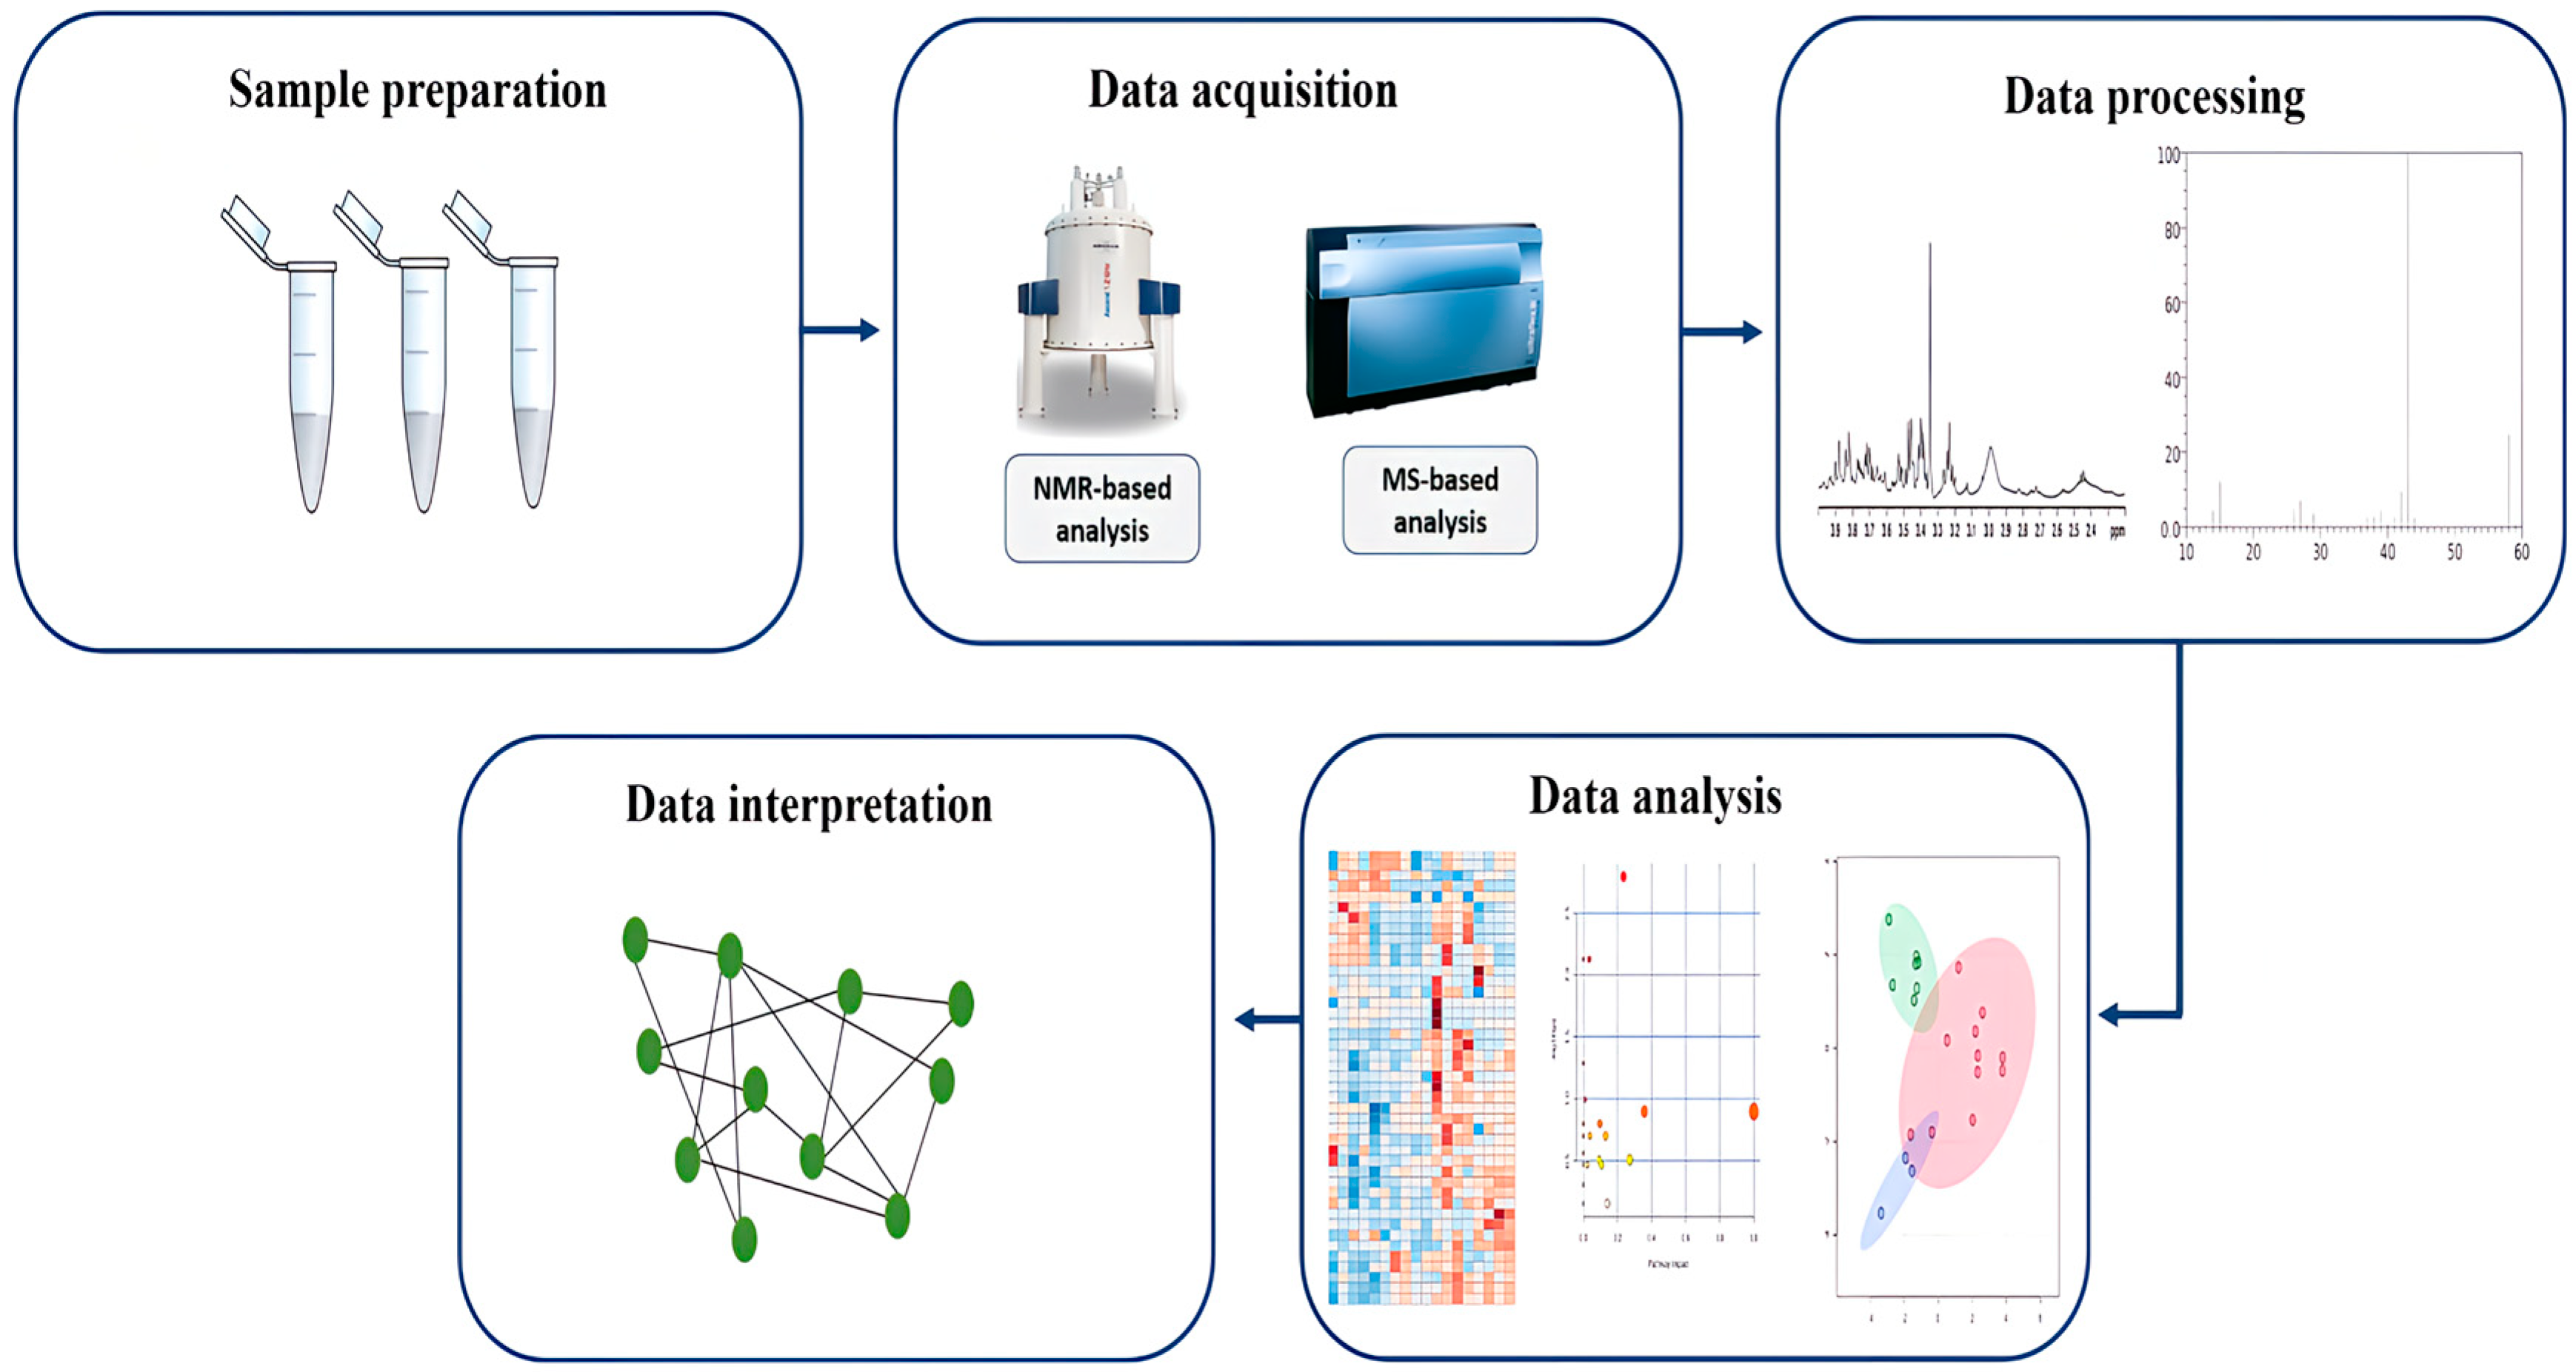
2. Metabolomics
2.1. Metabolomics Techniques

| Analytical Technique | Advantages | Limitations | References |
|---|---|---|---|
| Nuclear Magnetic Resonance (NMR) spectroscopy |
|
| [46] |
| Liquid chromatography–mass spectrometry (LC-MS) |
|
| [44,54] |
| Gas chromatography–mass spectrometry (GC-MS) |
Large spectral libraries |
| [44,54] |
| Fourier-transform infrared (FTIR) spectroscopy (less common) |
|
| [39] |
2.2. The Need for Biomarkers in Hyperlipidemia
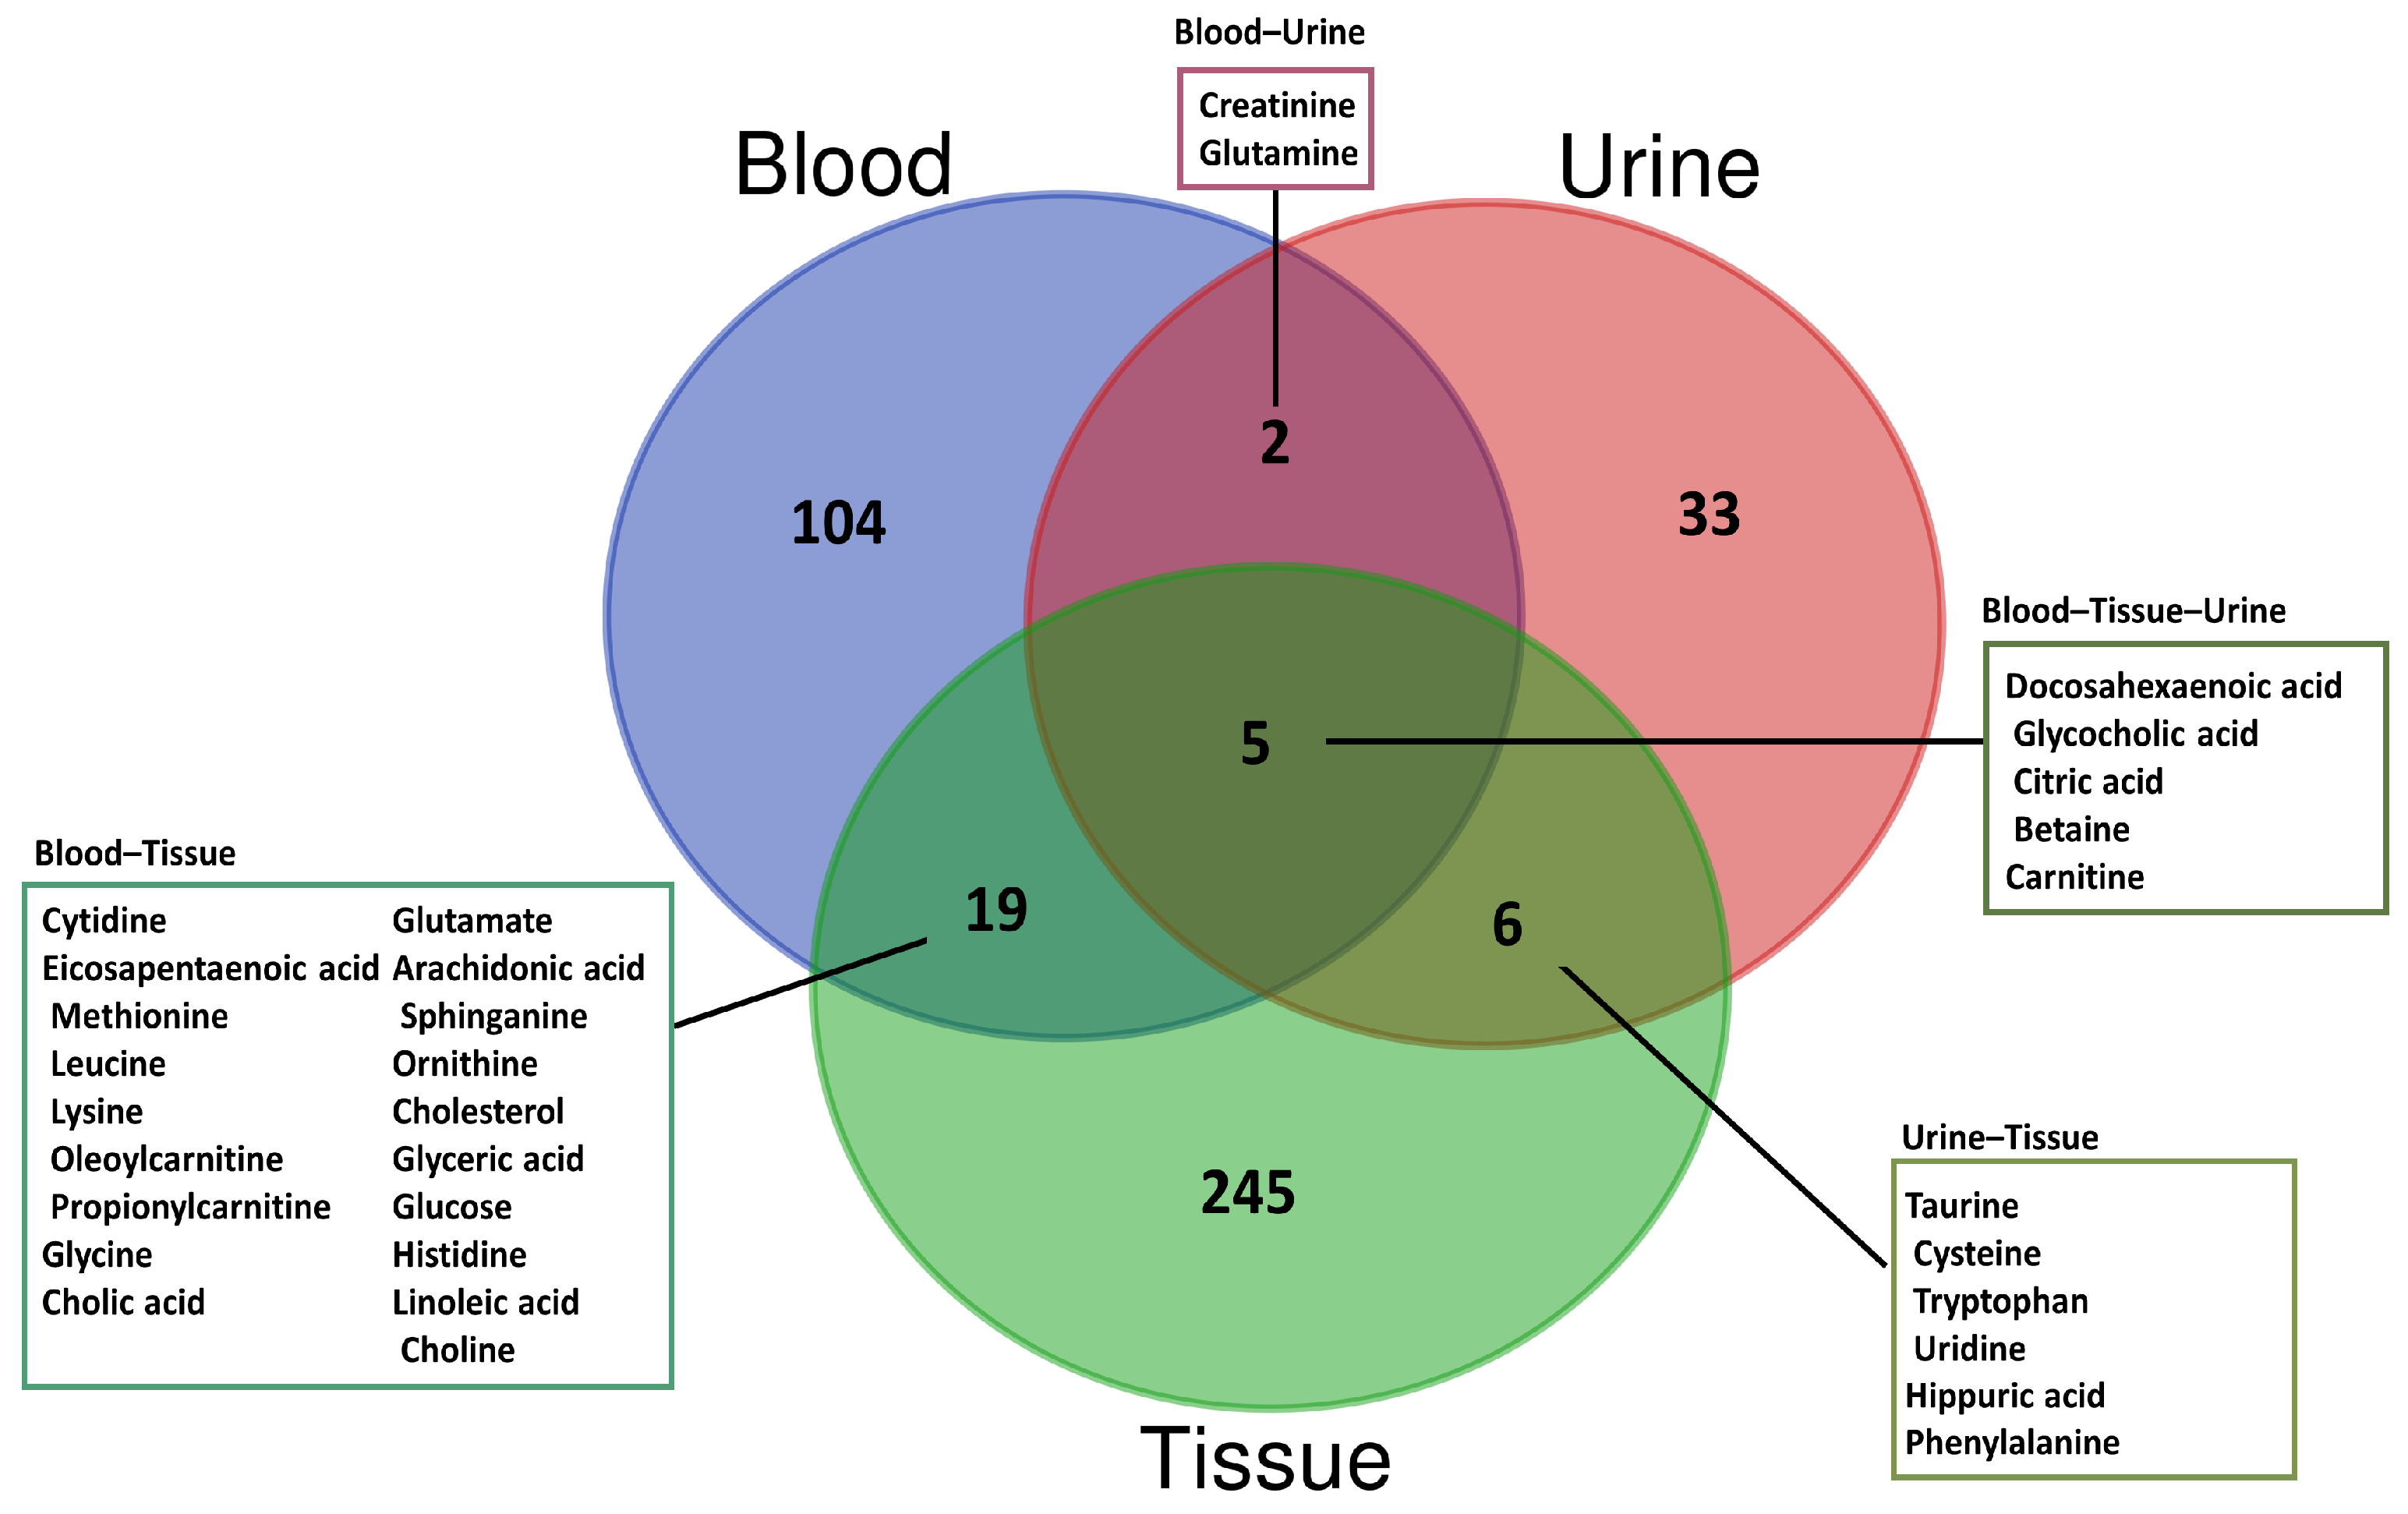
3. Metabolomics for the Identification of the Potential Biomarkers Associated with Hyperlipidemia
3.1. Blood-Based Metabolomics
3.2. Urine-Based Metabolomics
3.3. Tissue-Based Metabolomics
| Sample Type | Analytical Technique | Statistical Details | Sample Source | Potential Biomarkers | References | |
|---|---|---|---|---|---|---|
| Human (2016) | UPLC-MS | Orthogonal partial least squares discriminant analysis (OPLS-DA), t-test (p value of 0.05 or less) | Serum | ↑ | 1-(sn-glycero-3-phospho)-1d-myo-inositol, Gamma-Glutamyl-beta-cyanoalanine, Uric acid, Beta-D-Galactose, Acetyl-N-formyl-5-methoxykynurenamine, P-Cresol, Azelaic acid, N-[(3a,5b,7a)-3-Hydroxy-24-oxo-7-(sulfooxy)cholan-24-yl]-glycine, 2-Phenylethanol glucuronide, Murocholic acid, Sphingosine 1-phosphate, LysoPC(18:3(6Z,9Z,12Z)), LysoPC(20:5(5Z,8Z,11Z,14Z,17Z)), LysoPC(18:3(9Z,12Z,15Z)), LysoPC(16:1(9Z)), LysoPC(22:6(4Z,7Z,10Z,13Z,16Z,19Z)), 14,15-Epoxy-5,8,11-eicosatrienoic acid, LysoPC(20:3(5Z,8Z,11Z)), LysoPC(16:0), LysoPC(22:5(7Z,10Z,13Z,16Z,19Z)), LysoPC(22:4(7Z,10Z,13Z,16Z)), LysoPC(15:0), LysoPC(18:0), LysoPC(P-18:0), Linoleic acid, PC(18:0/20:5(5Z,8Z,11Z,14Z,17Z)), Oleic acid, SM(d18:0/16:1(9Z), PC(18:0/18:4(6Z,9Z,12Z,15Z)), Chenodeoxycholic acid, and PE(14:1(9Z)/14:1(9Z)). | [21] |
| ↓ | 4-Hydroxybenzaldehyde, Testosterone sulfate, LysoPC(14:0), LysoPC(18:1(11Z)), LysoPC(P-16:0), and Maslinic acid. | |||||
| Human (2023) | 1H-NMR | Partial least squares discriminant analysis (PLS-DA), Mann–Whitney U test (FDR-adjusted p value < 0.05), variable importance in projection (VIP) score ≥ 1 | Plasma | ↑ | Tyrosine, glutamic acid, ornithine, lysine, alanine, creatinine, oxoglutaric acid, and creatine. | [66] |
| Human (2019) | UPLC-Q-TOF/MS | PLS-DA, VIP > 1, t-test (p value < 0.05) | Urine | ↑ | Prolylhydroxyproline, N-acetyltryptophan, L-Isoleucine, L-Homocystine, 5-Oxoproline, N-acetylglutamic acid, Betaine, Hydroxyphenylacetylglycine, Phenylacetic acid, Glutaric acid, Homovanillic acid sulfate, Dihyroxy-1H-indole glucuronide I, Porphobilinogen, Cortexolone, and Deoxyguanosine. | [64] |
| ↓ | L-Proline, N-phenylacetylphenylalanine, L-Glutamine, Glycocholic acid, 2-Phenylglycine, Caproic acid, and Sebacic acid. | |||||
| Rat (2014) | UPLC-Q-TOF/MS | OPLS-DA, VIP > 1.5, independent sample t-test (p value < 0.05) | Serum | ↑ | Succinic acid, Cholic acid, C16 Sphinganine, and Sphinganine. | [68] |
| ↓ | Stearidonic acid, Linoleic acid, 8,11-Eicosadiynoic acid, Eicosapentaenoic acid, and DHA. | |||||
| Urine | ↑ | DHA, 3-methyluridine, uridine, L-isoleucine, and phenyllactic acid. | ||||
| ↓ | Hippuric acid, taurine, L-cysteine, norepinephrine, and L-carnitine. | |||||
| Mice (2020) | 1H-NMR | Principal component analysis (PCA), OPLS, VIP > 1, t-test (p value < 0.05) | Plasma | Eleven metabolites (glycerol, glucose, leucine, arginine, betaine, lysine, glutamine, glutamate, valine, alanine, and choline) had regular changes within nine points during the study. | [70] | |
| Rat (2020) | LC-MS | One-way analysis of variance (ANOVA) followed by Turkey–Kramer multiple comparison test | Serum | ↓ | Alanine, arginine, lysine, methionine, serine, tyrosine, and valine. | [63] |
| Rat (2016) | GC-MS, LC-MS, and Capillary electrophoresis-mass spectrometry (CE-MS) | PCA, PLS-DA, OPLS-DA, Welch’s t-test (p value < 0.05), Benjamin Hochberg FDR correction | Plasma | ↑ | PE (O-36:4), PC (18:1/16:0), PC (35:2), LPE (16:0), LPE(18:0), LPE (18:1), LPE (18:2), LPC (15:0) sn-1, Glycocholic acid, Cholic acid, Deoxyvitamin D3, Dihydroxy-oxo-vitamin D3, Trinorvitamin D3 carboxylic acid, Oleoylcarnitine, Linoleoyl carnitine, Propanoylcarnitine, Cytosine, Cholesterol, Lysine, Glycine, Acetoacetate, Citric acid, Pyranoses, l-Serine, Glyceric acid, Acetyl-l-carnitine, Propionyl-l-carnitine, NG,NG-dimethyl-l-arginine, Kynurenine, Ornithine, Betaine, Isoputreanine, Nx-Acetylspermidine, Asparagine, 5-Hydroxylysine, Histidine, N-methyl-l-histidine, and Cytidine. | [67] |
| ↓ | Arachidonic Acid, PE (P-19:1), PE-NMe2 (16:0/20:4), PE (P-38:6), PC (15:0), PC (34:4), PC (20:4/16:0), PC (36:4), PC (37:4), PC (20:4/18:0), PC (18:2/20:4), PC (40:5), PC (40:7), PC (40:8), PC (42:10), LPC (16:0), LPC (17:0), LPC (18:0) sn-1, LPC (P-18:1) sn-1, LPC (19:0) sn-2, LPC (20:4) sn-2, LPC (22:5) sn-1, LPC (22:6) sn-1, SM (32:1), SM (33:1), SM (34:2), SM (34:1), PI-Cer (40:1), Carnitine, Linoleoyl taurine, Leucyl-proline, Bilirubin, 2-Ketoisocaproic acid, D-Galactopyranoside, Glycerol, Arginine, and Cysteine–homocysteine disulfide. | |||||
| Rat (2014) | UPLC-Q-TOF/HDMS | OPLS-DA, ANOVA followed by t-test for multiple comparisons (p < 0.05) | Urine | ↑ | Octadecanamide, Oleamide, Tryptophan, Ursodeoxycholic acid, Creatinine, Ascorbalamic acid, 3-Methyluridine, Indole-3-carboxylic Acid, and Tryptophyl-tyrosine. | [73] |
| ↓ | Citric acid, Adenosine 2′,3′-cyclic phosphate, 3-O-Methyldopa, Proline, 1-Methyladenosine, Phenylalanine, and 5-Methylcytosine. | |||||
| Rat (2023) | GC-MS and LC/MS/MS | Welch’s two-sample t-tests (p value ≤ 0.05) | Aorta | ↑ | 30 differential metabolites. | [76] |
| ↓ | 40 differential metabolites. | |||||
| Heart | ↑ | 122 differential metabolites. | ||||
| ↓ | 59 differential metabolites. | |||||
| Liver | ↑ | 67 differential metabolites. | ||||
| ↓ | 78 differential metabolites. | |||||
| Plasma | ↑ | 97 differential metabolites. | ||||
| ↓ | 75 differential metabolites. | |||||
| Rat (2023) | MSI | PLS-DA, volcano plot, VIP > 1, fold change > 1.5 or <0.75, p value < 0.05 | Liver | PA (20:3-OH/i-21:0), PA (20:4-OH/22:6), PG (20:5-OH/i-16:0), PG (22:6-2OH/i-13:0), PG(O-18:0/20:4), PGP (18:3-OH/i-12:0), PGP(PGJ2/i-15:0), SM(d18:0/18:1-2OH), and TG (14:0/14:0/16:0) showed differences through the entire experimental period. | [77] | |
4. Metabolomics as a Tool for the Investigation of the Activity of Therapeutic Agents
4.1. Conventional Anti-Hyperlipidemic Drugs
4.2. Traditional Herbal Products in Hyperlipidemia Treatment
5. Limitations and Future Applications
6. Conclusions
Author Contributions
Funding
Institutional Review Board Statement
Informed Consent Statement
Data Availability Statement
Acknowledgments
Conflicts of Interest
References
- Karr, S. Epidemiology and management of hyperlipidemia. Am. J. Manag. Care 2017, 23 (Suppl. S9), S139–S148. [Google Scholar] [PubMed]
- Hill, M.F.; Bordoni, B. Hyperlipidemia. In StatPearls; StatPearls Publishing: Treasure Island, FL, USA, 2022. [Google Scholar]
- Nouh, F.; Omar, M.; Younis, M. Risk factors and management of hyperlipidemia. Asian J. Cardiol. Res. 2018, 2, 1–10. [Google Scholar]
- Rachitha, P.; Krishnaswamy, K.; Lazar, R.A.; Gupta, V.K.; Inbaraj, B.S.; Raghavendra, V.B.; Sharma, M.; Sridhar, K. Attenuation of hyperlipidemia by medicinal formulations of Emblica officinalis synergized with nanotechnological approaches. Bioengineering 2023, 10, 64. [Google Scholar] [CrossRef] [PubMed]
- Bilen, O.; Pokharel, Y.; Ballantyne, C.M. Genetic testing in hyperlipidemia. Endocrinol. Metab. Clin. 2016, 45, 129–140. [Google Scholar] [CrossRef] [PubMed]
- Ezeh, K.J.; Ezeudemba, O. Hyperlipidemia: A review of the novel methods for the management of lipids. Cureus 2021, 13, e16412. [Google Scholar] [CrossRef] [PubMed]
- Kokkinos, P.; Katsagoni, C.N.; Sidossis, L.S. Prevention and Management of Cardiovascular and Metabolic Disease: Diet, Physical Activity and Healthy Aging; Wiley: Hoboken, NJ, USA, 2023. [Google Scholar]
- Mumthaj, P.; Natarajan, P.; Janani, A.; Vijay, J.; Gokul, V. A Global Review Article on Hyperlipidemia. Int. J. Pharm. Sci. Rev. Res. 2021, 68, 104–110. [Google Scholar]
- Amini, M.; Zayeri, F.; Salehi, M. Trend analysis of cardiovascular disease mortality, incidence, and mortality-to-incidence ratio: Results from global burden of disease study 2017. BMC Public Health 2021, 21, 1–12. [Google Scholar] [CrossRef]
- Karam, I.; Ma, N.; Liu, X.; Li, J.; Yang, Y. Short Review on Hyperlipidemia. J. Blood Transfus. Dis. 2019, 2, 86–88. [Google Scholar]
- Di Cesare, M.; Perel, P.; Taylor, S.; Kabudula, C.; Bixby, H.; Gaziano, T.A.; McGhie, D.V.; Mwangi, J.; Pervan, B.; Narula, J.; et al. The Heart of the World. Glob. Heart 2024, 19, 11. [Google Scholar] [CrossRef]
- Şahin, B.; İlgün, G. Risk factors of deaths related to cardiovascular diseases in World Health Organization (WHO) member countries. Health Soc. Care Community 2022, 30, 73–80. [Google Scholar] [CrossRef]
- Mensah, G.A.; Fuster, V.; Murray, C.J.L.; Roth, G.A. Global burden of cardiovascular diseases and risks 1990–2022. J. Am. Coll. Cardiol. 2023, 82, 2350–2473. [Google Scholar] [CrossRef] [PubMed]
- Frąk, W.; Wojtasińska, A.; Lisińska, W.; Młynarska, E.; Franczyk, B.; Rysz, J. Pathophysiology of Cardiovascular Diseases: New Insights into Molecular Mechanisms of Atherosclerosis, Arterial Hypertension, and Coronary Artery Disease. Biomedicines 2022, 10, 1938. [Google Scholar] [CrossRef] [PubMed]
- Wang, T.; Butany, J. Pathogenesis of atherosclerosis. Diagn. Histopathol. 2017, 23, 473–478. [Google Scholar] [CrossRef]
- Bui, Q.T.; Prempeh, M.; Wilensky, R.L. Atherosclerotic plaque development. Int. J. Biochem. Cell Biol. 2009, 41, 2109–2113. [Google Scholar] [CrossRef]
- Wouters, K.; Shiri-Sverdlov, R.; van Gorp, P.J.; van Bilsen, M.; Hofker, M.H. Understanding hyperlipidemia and atherosclerosis: Lessons from genetically modified apoe and ldlr mice. Clin. Chem. Lab. Med. (CCLM) 2005, 43, 470–479. [Google Scholar] [CrossRef] [PubMed]
- Rafieian-Kopaei, M.; Setorki, M.; Doudi, M.; Baradaran, A.; Nasri, H. Atherosclerosis: Process, indicators, risk factors and new hopes. Int. J. Prev. Med. 2014, 5, 927. [Google Scholar]
- Liu, Y.; Zhang, Q.; Zhao, G.; Liu, G.; Liu, Z. Deep learning-based method of diagnosing hyperlipidemia and providing diagnostic markers automatically. Diabetes Metab. Syndr. Obes. 2020, 13, 679–691. [Google Scholar] [CrossRef] [PubMed]
- Lin, C.; Tian, Q.; Guo, S.; Xie, D.; Cai, Y.; Wang, Z.; Chu, H.; Qiu, S.; Tang, S.; Zhang, A. Metabolomics for clinical biomarker discovery and therapeutic target identification. Molecules 2024, 29, 2198. [Google Scholar] [CrossRef] [PubMed]
- Zhao, Q.; Zhang, A.; Zong, W.; An, N.; Zhang, H.; Luan, Y.; Cao, H.; Sun, H.; Wang, X. Chemometrics strategy coupled with high resolution mass spectrometry for analyzing and interpreting comprehensive metabolomic characterization of hyperlipemia. RSC Adv. 2016, 6, 112534–112543. [Google Scholar] [CrossRef]
- Dong, W.; Zhang, F.; Lian, D.; Chen, X.; Zhou, H.; Gong, T.; Wang, C. Efficacy and safety of tai chi for hyperlipidaemia: A protocol for systematic review and meta-analysis. BMJ Open 2022, 12, e053867. [Google Scholar] [CrossRef]
- Su, L.; Mittal, R.; Ramgobin, D.; Jain, R.; Jain, R. Current management guidelines on hyperlipidemia: The silent killer. J. Lipids 2021, 2021, 9883352. [Google Scholar] [CrossRef] [PubMed]
- Stewart, J.; McCallin, T.; Martinez, J.; Chacko, S.; Yusuf, S. Hyperlipidemia. Pediatr. Rev. 2020, 41, 393–402. [Google Scholar] [CrossRef] [PubMed]
- Poznyak, A.V.; Zhang, D.; Orekhova, V.; Grechko, A.V.; Wetzker, R.; Orekhov, A.N. A brief overview of currently used atherosclerosis treatment approaches targeting lipid metabolism alterations. Am. J. Cardiovasc. Dis. 2020, 10, 62. [Google Scholar] [PubMed]
- Alwahsh, M.; Knitsch, R.; Marchan, R.; Lambert, J.; Hoerner, C.; Zhang, X.; Schalke, B.; Lee, D.-H.; Bulut, E.; Graeter, T.; et al. Metabolic profiling of thymic epithelial tumors hints to a strong Warburg Effect, glutaminolysis and precarious redox homeostasis as potential therapeutic targets. Cancers 2022, 14, 1564. [Google Scholar] [CrossRef] [PubMed]
- Srivastava, S. Emerging insights into the metabolic alterations in aging using metabolomics. Metabolites 2019, 9, 301. [Google Scholar] [CrossRef] [PubMed]
- Nalbantoglu, S. Metabolomics: Basic principles and strategies. Mol. Med. 2019, 10, 88563. [Google Scholar]
- Chen, H.; Miao, H.; Feng, Y.-L.; Zhao, Y.-Y.; Lin, R.-C. Metabolomics in dyslipidemia. Adv. Clin. Chem. 2014, 66, 101–119. [Google Scholar] [PubMed]
- Zhang, X.; Zhu, X.; Wang, C.; Zhang, H.; Cai, Z. Non-targeted and targeted metabolomics approaches to diagnosing lung cancer and predicting patient prognosis. Oncotarget 2016, 7, 63437. [Google Scholar] [CrossRef] [PubMed]
- Bingol, K. Recent advances in targeted and untargeted metabolomics by NMR and MS/NMR methods. High-Throughput 2018, 7, 9. [Google Scholar] [CrossRef]
- Ta, N.; Lisha, A.; Erdunduleng, E.; Qi, R.; Mu, X.; Feng, L.; Ba, G.; Li, Y.; Zhang, J.; Bai, L.; et al. Metabolomics analysis reveals amelioration effects of yellow horn tea extract on hyperlipidemia, inflammation, and oxidative stress in high-fat diet-fed mice. Front. Nutr. 2023, 10, 1087256. [Google Scholar] [CrossRef]
- Zeng, L.; Luo, L.; Xue, Q.; He, Q.; Chen, X.; Meng, J.; Wang, S.; Liang, S. LC–MS based plasma metabolomics study of the intervention effect of different polar parts of Hawthorn on hyperlipidemia rats. J. Sep. Sci. 2021, 44, 963–972. [Google Scholar] [CrossRef]
- Barnes, S.; Benton, H.P.; Casazza, K.; Cooper, S.J.; Cui, X.; Du, X.; Engler, J.; Kabarowski, J.H.; Li, S.; Pathmasiri, W.; et al. Training in metabolomics research. II. Processing and statistical analysis of metabolomics data, metabolite identification, pathway analysis, applications of metabolomics and its future. J. Mass Spectrom. 2016, 51, 535–548. [Google Scholar] [CrossRef] [PubMed]
- Monteiro, M.; Carvalho, M.; Bastos, M.; Guedes de Pinho, P. Metabolomics analysis for biomarker discovery: Advances and challenges. Curr. Med. Chem. 2013, 20, 257–271. [Google Scholar] [CrossRef]
- Johnson, C.H.; Ivanisevic, J.; Siuzdak, G. Metabolomics: Beyond biomarkers and towards mechanisms. Nat. Rev. Mol. Cell Biol. 2016, 17, 451–459. [Google Scholar] [CrossRef]
- Fraga-Corral, M.; Carpena, M.; Garcia-Oliveira, P.; Pereira, A.; Prieto, M.; Simal-Gandara, J. Analytical metabolomics and applications in health, environmental and food science. Crit. Rev. Anal. Chem. 2022, 52, 712–734. [Google Scholar] [CrossRef] [PubMed]
- Alhusban, A.A.; Albustanji, S.; Hamadneh, L.A.; Shallan, A.I. High performance liquid chromatography–tandem mass spectrometry method for correlating the metabolic changes of lactate, pyruvate and L-glutamine with induced tamoxifen resistant MCF-7 cell line potential molecular changes. Molecules 2021, 26, 4824. [Google Scholar] [CrossRef]
- Fonseca, T.A.; Oliveira, M.C.; Araújo, R.; Bento, L.; Von Rekowski, C.; Justino, G.C.; Calado, C.R. Comparison of Analytical Methods Of Serum Untargeted Metabolomics. In Proceedings of the 2023 IEEE 7th Portuguese Meeting on Bioengineering (ENBENG), Porto, Portugal, 22–23 June 2023. [Google Scholar]
- Sivamani, Y.; Murthy, K.N.; Sajal, H.; Elayaperumal, S. Chapter 13—Isotope labeling LC-MS for metabolomics of biofilm study and tracer-based biofilm metabolomics analysis. In Microbial Biofilms; Sarma, H., Joshi, S., Lahiri, D., Ray, R.R., Davoodbasha, M., Eds.; Academic Press: Cambridge MA, USA, 2023; pp. 217–224. [Google Scholar]
- Chen, X.; Shu, W.; Zhao, L.; Wan, J. Advanced mass spectrometric and spectroscopic methods coupled with machine learning for in vitro diagnosis. View 2023, 4, 20220038. [Google Scholar] [CrossRef]
- Miguez, A.M.; Zhang, Y.; Styczynski, M. Metabolomics Analysis of Cell-Free Expression Systems Using Gas Chromatography-Mass Spectrometry. In Cell-Free Gene Expression: Methods and Protocols; Springer Nature: London, UK, 2022; pp. 217–226. [Google Scholar]
- Wang, Y.; Liu, S.; Hu, Y.; Li, P.; Wan, J.-B. Current state of the art of mass spectrometry-based metabolomics studies—A review focusing on wide coverage, high throughput and easy identification. RSC Adv. 2015, 5, 78728–78737. [Google Scholar] [CrossRef]
- Segers, K.; Declerck, S.; Mangelings, D.; Heyden, Y.V.; Eeckhaut, A.V. Analytical techniques for metabolomic studies: A review. Bioanalysis 2019, 11, 2297–2318. [Google Scholar] [CrossRef]
- Silva, C.; Perestrelo, R.; Silva, P.; Tomás, H.; Câmara, J.S. Breast cancer metabolomics: From analytical platforms to multivariate data analysis. A review. Metabolites 2019, 9, 102. [Google Scholar] [CrossRef] [PubMed]
- Emwas, A.-H.; Roy, R.; McKay, R.T.; Tenori, L.; Saccenti, E.; Gowda, G.N.; Raftery, D.; Alahmari, F.; Jaremko, L.; Jaremko, M.; et al. NMR spectroscopy for metabolomics research. Metabolites 2019, 9, 123. [Google Scholar] [CrossRef]
- Aggarwal, S.; Banerjee, N.; Parihari, S.; Roy, J.; Bojak, K.; Shah, R. Metabolomics: Role in pathobiology and therapeutics of COVID-19. In Multi-Pronged Omics Technologies to Understand COVID-19; CRC Press: Boca Raton, FL, USA, 2022; pp. 75–99. [Google Scholar]
- Ozcelikay, G.; Kaya, S.; Ozkan, E.; Cetinkaya, A.; Nemutlu, E.; Kır, S.; Ozkan, S. Sensor-based MIP technologies for targeted metabolomics analysis. TrAC Trends Anal. Chem. 2022, 146, 116487. [Google Scholar] [CrossRef]
- Paul, A.; de Boves Harrington, P. Chemometric applications in metabolomic studies using chromatography-mass spectrometry. TrAC Trends Anal. Chem. 2021, 135, 116165. [Google Scholar] [CrossRef]
- Gonzalez-Dominguez, A.; Duran-Guerrero, E.; Fernandez-Recamales, A.; Lechuga-Sancho, A.M.; Sayago, A.; Schwarz, M.; Segundo, C.; Gonzalez-Dominguez, R. An overview on the importance of combining complementary analytical platforms in metabolomic research. Curr. Top. Med. Chem. 2017, 17, 3289–3295. [Google Scholar] [CrossRef] [PubMed]
- Jeppesen, M.J.; Powers, R. Multiplatform untargeted metabolomics. Magn. Reson. Chem. 2023, 61, 628–653. [Google Scholar] [CrossRef] [PubMed]
- Chen, Y.; Li, E.-M.; Xu, L.-Y. Guide to metabolomics analysis: A bioinformatics workflow. Metabolites 2022, 12, 357. [Google Scholar] [CrossRef] [PubMed]
- Sussulini, A. Metabolomics: From Fundamentals to Clinical Applications; Springer: Berlin/Heidelberg, Germany, 2017; Volume 965. [Google Scholar]
- Aretz, I.; Meierhofer, D. Advantages and pitfalls of mass spectrometry based metabolome profiling in systems biology. Int. J. Mol. Sci. 2016, 17, 632. [Google Scholar] [CrossRef] [PubMed]
- Califf, R.M. Biomarker definitions and their applications. Exp. Biol. Med. 2018, 243, 213–221. [Google Scholar] [CrossRef]
- Zhang, A.; Sun, H.; Yan, G.; Wang, P.; Wang, X. Metabolomics for biomarker discovery: Moving to the clinic. Biomed. Res. Int. 2015, 2015, 354671. [Google Scholar] [CrossRef]
- Chen, H.; Yuan, B.; Miao, H.; Tan, Y.; Bai, X.; Zhao, Y.-Y.; Wang, Y. Urine metabolomics reveals new insights into hyperlipidemia and the therapeutic effect of rhubarb. Anal. Methods 2015, 7, 3113–3123. [Google Scholar] [CrossRef]
- Rai, S.; Bhatnagar, S. Novel lipidomic biomarkers in hyperlipidemia and cardiovascular diseases: An integrative biology analysis. Omics J. Integr. Biol. 2017, 21, 132–142. [Google Scholar] [CrossRef] [PubMed]
- German, C.A.; Shapiro, M.D. Assessing atherosclerotic cardiovascular disease risk with advanced lipid testing: State of the science. Eur. Cardiol. Rev. 2020, 15, e56. [Google Scholar] [CrossRef] [PubMed]
- Xu, Q.-y.; Liu, Y.-h.; Zhang, Q.; Ma, B.; Yang, Z.-d.; Liu, L.; Yao, D.; Cui, G.-b.; Sun, J.-j.; Wu, Z.-m. Metabolomic analysis of simvastatin and fenofibrate intervention in high-lipid diet-induced hyperlipidemia rats. Acta Pharmacol. Sin. 2014, 35, 1265–1273. [Google Scholar] [CrossRef] [PubMed]
- O’Neill, S.; Bohl, M.; Gregersen, S.; Hermansen, K.; O’Driscoll, L. Blood-based biomarkers for metabolic syndrome. Trends Endocrinol. Metab. 2016, 27, 363–374. [Google Scholar] [CrossRef] [PubMed]
- Kalyani, A.; Jha, R.M.; Sharma, S. Use of circulating nucleic acids, metabolites, and proteins as clinical biomarkers for earlier prognosis and diagnosis of disease. In Prognostic Epigenetics; Elsevier: Amsterdam, The Netherlands, 2019; pp. 85–116. [Google Scholar]
- Wang, X.-F.; Zhang, Y.-X.; Ma, H.-Y. Targeted profiling of amino acid metabolome in serum by a liquid chromatography-mass spectrometry method: Application to identify potential markers for diet-induced hyperlipidemia. Anal. Methods 2020, 12, 2355–2362. [Google Scholar] [CrossRef] [PubMed]
- Yang, L.; Li, Z.; Song, Y.; Liu, Y.; Zhao, H.; Liu, Y.; Zhang, T.; Yuan, Y.; Cai, X.; Wang, S.; et al. Study on urine metabolic profiling and pathogenesis of hyperlipidemia. Clin. Chim. Acta 2019, 495, 365–373. [Google Scholar] [CrossRef] [PubMed]
- Li, Q.; Gu, W.; Ma, X.; Liu, Y.; Jiang, L.; Feng, R.; Liu, L. Amino acid and biogenic amine profile deviations in an oral glucose tolerance test: A comparison between healthy and hyperlipidaemia individuals based on targeted metabolomics. Nutrients 2016, 8, 379. [Google Scholar] [CrossRef] [PubMed]
- Gu, P.-S.; Su, K.-W.; Yeh, K.-W.; Huang, J.-L.; Lo, F.-S.; Chiu, C.-Y. Metabolomics Analysis Reveals Molecular Signatures of Metabolic Complexity in Children with Hypercholesterolemia. Nutrients 2023, 15, 1726. [Google Scholar] [CrossRef] [PubMed]
- González-Peña, D.; Dudzik, D.; Colina-Coca, C.; de Ancos, B.; García, A.; Barbas, C.; Sánchez-Moreno, C. Multiplatform metabolomic fingerprinting as a tool for understanding hypercholesterolemia in Wistar rats. Eur. J. Nutr. 2016, 55, 997–1010. [Google Scholar] [CrossRef]
- Wu, Q.; Zhang, H.; Dong, X.; Chen, X.-F.; Zhu, Z.-Y.; Hong, Z.-Y.; Chai, Y.-F. UPLC-Q-TOF/MS based metabolomic profiling of serum and urine of hyperlipidemic rats induced by high fat diet. J. Pharm. Anal. 2014, 4, 360–367. [Google Scholar] [CrossRef]
- Liu, X.; Yu, J.; Zhao, J.; Guo, J.; Zhang, M.; Liu, L. Glucose challenge metabolomics implicates the change of organic acid profiles in hyperlipidemic subjects. Biomed. Chromatogr. 2020, 34, e4815. [Google Scholar] [CrossRef] [PubMed]
- Li, Y.; Zhao, X.-J. NMR-based plasma metabonomics in hyperlipidemia mice. Anal. Methods 2020, 12, 1995–2001. [Google Scholar] [CrossRef]
- Chen, Y.-L.; Xiao, C.-H.; Hu, Z.-X.; Liu, X.-S.; Liu, Z.; Zhang, W.-N.; Zhao, X.-J. Dynamic lipid profile of hyperlipidemia mice. J. Chromatogr. B 2017, 1055, 165–171. [Google Scholar] [CrossRef] [PubMed]
- Jedinak, A.; Loughlin, K.R.; Moses, M.A. Approaches to the discovery of non-invasive urinary biomarkers of prostate cancer. Oncotarget 2018, 9, 32534. [Google Scholar] [CrossRef] [PubMed]
- Miao, H.; Chen, H.; Zhang, X.; Yin, L.; Chen, D.-Q.; Cheng, X.-L.; Bai, X.; Wei, F. Urinary metabolomics on the biochemical profiles in diet-induced hyperlipidemia rat using ultraperformance liquid chromatography coupled with quadrupole time-of-flight SYNAPT high-definition mass spectrometry. J. Anal. Methods Chem. 2014, 2014, 184162. [Google Scholar] [CrossRef] [PubMed]
- Jin, W.; Li, C.; Yang, S.; Song, S.; Hou, W.; Song, Y.; Du, Q. Hypolipidemic effect and molecular mechanism of ginsenosides: A review based on oxidative stress. Front. Pharmacol. 2023, 14, 1166898. [Google Scholar] [CrossRef] [PubMed]
- Saoi, M.; Britz-McKibbin, P. New advances in tissue metabolomics: A review. Metabolites 2021, 11, 672. [Google Scholar] [CrossRef] [PubMed]
- Xu, K.; Saaoud, F.; Shao, Y.; Lu, Y.; Wu, S.; Zhao, H.; Chen, K.; Vazquez-Padron, R.; Jiang, X.; Wang, H.; et al. Early hyperlipidemia triggers metabolomic reprogramming with increased SAH, increased acetyl-CoA-cholesterol synthesis, and decreased glycolysis. Redox Biol. 2023, 64, 102771. [Google Scholar] [CrossRef] [PubMed]
- Mao, H.; Wang, W.; Xiang, X.; Li, Y.; Zhao, J.; Huang, Y.; Di, S.; Zhuo, Q.; Nie, H. Analysis of metabolite distribution in rat liver of high-fat model by mass spectrometry imaging. Metabolites 2023, 13, 411. [Google Scholar] [CrossRef]
- Feingold, K.R. Cholesterol Lowering Drugs; Endotext Publishing: South Dartmouth, MA, USA, 2016. [Google Scholar]
- Sizar, O.; Khare, S.; Jamil, R.T.; Talati, R. Statin Medications; StatPearls Publishing: Treasure Island, FL, USA, 2017. [Google Scholar]
- Fiorentino, R.; Chiarelli, F. Statins in Children, an Update. Int. J. Mol. Sci. 2023, 24, 1366. [Google Scholar] [CrossRef]
- Zhang, S.; Yuan, L.; Li, H.; Han, L.; Jing, W.; Wu, X.; Ullah, S.; Liu, R.; Wu, Y.; Xu, J. The novel interplay between commensal gut bacteria and metabolites in diet-induced hyperlipidemic rats treated with simvastatin. J. Proteome Res. 2021, 21, 808–821. [Google Scholar] [CrossRef]
- Fernandes Silva, L.; Ravi, R.; Vangipurapu, J.; Laakso, M. Metabolite signature of simvastatin treatment involves multiple metabolic pathways. Metabolites 2022, 12, 753. [Google Scholar] [CrossRef] [PubMed]
- Zhang, Q.; Fan, X.; Ye, R.; Hu, Y.; Zheng, T.; Shi, R.; Cheng, W.; Lv, X.; Chen, L.; Liang, P. The effect of simvastatin on gut microbiota and lipid metabolism in hyperlipidemic rats induced by a high-fat diet. Front. Pharmacol. 2020, 11, 522. [Google Scholar] [CrossRef] [PubMed]
- Li, H.; Wang, S.; Wang, S.; Yu, H.; Yu, W.; Ma, X.; He, X. Atorvastatin inhibits high-fat diet-induced lipid metabolism disorders in rats by inhibiting Bacteroides reduction and improving metabolism. Drug Des. Dev. Ther. 2022, 16, 3805. [Google Scholar] [CrossRef] [PubMed]
- Abu Farha, R.; Bustanji, Y.; Al-Hiari, Y.; Al-Qirim, T.; Abu Shiekha, G.; Albashiti, R. Lipid lowering activity of novel N-(benzoylphenyl) pyridine-3-carboxamide derivatives in Triton WR-1339-induced hyperlipidemic rats. J. Enzym. Inhib. Med. Chem. 2016, 31 (Suppl. S4), S138–S144. [Google Scholar] [CrossRef] [PubMed]
- El-Tantawy, W.H.; Temraz, A. Natural products for controlling hyperlipidemia. Arch. Physiol. Biochem. 2019, 125, 128–135. [Google Scholar] [CrossRef]
- Wu, G.; Zhang, W.; Li, H. Application of metabolomics for unveiling the therapeutic role of traditional Chinese medicine in metabolic diseases. J. Ethnopharmacol. 2019, 242, 112057. [Google Scholar] [CrossRef]
- Zang, E.; Qiu, B.; Chen, N.; Li, C.; Liu, Q.; Zhang, M.; Liu, Y.; Li, M. Xanthoceras sorbifolium Bunge: A review on botany, phytochemistry, pharmacology, and applications. Front. Pharmacol. 2021, 12, 708549. [Google Scholar] [CrossRef]
- Shao, F.; Gu, L.; Chen, H.; Liu, R.; Huang, H.; Chen, L.; Yang, M. Evaluation of hypolipidemic and antioxidant effects in phenolrich fraction of Crataegus pinnatifida fruit in hyperlipidemia rats and identification of chemical composition by ultra-performance liquid chromatography coupled with quadropole time-of-flight mass spectrometry. Pharmacogn. Mag. 2017, 13, 725. [Google Scholar]
- Dehghani, S.; Mehri, S.; Hosseinzadeh, H. The effects of Crataegus pinnatifida (Chinese hawthorn) on metabolic syndrome: A review. Iran. J. Basic Med. Sci. 2019, 22, 460. [Google Scholar]
- Hu, C.; Zhang, Y.; Liu, G.; Liu, Y.; Wang, J.; Sun, B. Untargeted metabolite profiling of adipose tissue in hyperlipidemia rats exposed to hawthorn ethanol extracts. J. Food Sci. 2019, 84, 717–725. [Google Scholar] [CrossRef] [PubMed]
- Zeng, W.; Huang, K.E.; Luo, Y.; Li, D.X.; Chen, W.; Yu, X.Q.; Ke, X.H. Nontargeted urine metabolomics analysis of the protective and therapeutic effects of Citri reticulatae chachiensis pericarpium on high-fat feed-induced hyperlipidemia in rats. Biomed. Chromatogr. 2020, 34, e4795. [Google Scholar] [CrossRef] [PubMed]
- Yang, B.; Li, H.; Ruan, Q.; Xuan, S.; Chen, X.; Cui, H.; Liu, Z.; Jin, J.; Zhao, Z. Effects of gut microbiota and ingredient-ingredient interaction on the pharmacokinetic properties of rotundic acid and pedunculoside. Planta Medica 2019, 85, 729–737. [Google Scholar] [CrossRef]
- Liu, C.; Shen, Y.-J.; Tu, Q.-B.; Zhao, Y.-R.; Guo, H.; Wang, J.; Zhang, L.; Shi, H.-W.; Sun, Y. Pedunculoside, a novel triterpene saponin extracted from Ilex rotunda, ameliorates high-fat diet induced hyperlipidemia in rats. Biomed. Pharmacother. 2018, 101, 608–616. [Google Scholar] [CrossRef]
- Yang, B.; Xuan, S.; Ruan, Q.; Jiang, S.; Cui, H.; Zhu, L.; Luo, X.; Jin, J.; Zhao, Z. UPLC/Q-TOF-MS/MS-based metabolomics revealed the lipid-lowering effect of Ilicis Rotundae Cortex on high-fat diet induced hyperlipidemia rats. J. Ethnopharmacol. 2020, 256, 112784. [Google Scholar] [CrossRef] [PubMed]
- Sethi, Y.; Patel, N.; Kaka, N.; Kaiwan, O.; Kar, J.; Moinuddin, A.; Goel, A.; Chopra, H.; Cavalu, S. Precision medicine and the future of cardiovascular diseases: A clinically oriented comprehensive review. J. Clin. Med. 2023, 12, 1799. [Google Scholar] [CrossRef]
- Schmidt, J.C.; Dougherty, B.V.; Beger, R.D.; Jones, D.P.; Schmidt, M.A.; Mattes, W.B. Metabolomics as a truly translational tool for precision medicine. Int. J. Toxicol. 2021, 40, 413–426. [Google Scholar] [CrossRef]
- Gonzalez-Covarrubias, V.; Martínez-Martínez, E.; del Bosque-Plata, L. The potential of metabolomics in biomedical applications. Metabolites 2022, 12, 194. [Google Scholar] [CrossRef]
| Methodology | |
|---|---|
| Databases | Google Scholar, PubMed, and ScienceDirect |
| Terms used in the search process | “hyperlipidemia” AND (“metabolomics” OR “metabolic profiling”) AND (“tissue” OR “plasma” OR “serum” OR “urine”) AND (“biomarker” OR “potential biomarker”) |
| Included articles | Articles focusing on biomarker identification and metabolite level alteration in hyperlipidemia |
| Filters | Articles published from 2014 to 2024 |
Disclaimer/Publisher’s Note: The statements, opinions and data contained in all publications are solely those of the individual author(s) and contributor(s) and not of MDPI and/or the editor(s). MDPI and/or the editor(s) disclaim responsibility for any injury to people or property resulting from any ideas, methods, instructions or products referred to in the content. |
© 2024 by the authors. Licensee MDPI, Basel, Switzerland. This article is an open access article distributed under the terms and conditions of the Creative Commons Attribution (CC BY) license (https://creativecommons.org/licenses/by/4.0/).
Share and Cite
Alwahsh, M.; Alejel, R.; Hasan, A.; Abuzaid, H.; Al-Qirim, T. The Application of Metabolomics in Hyperlipidemia: Insights into Biomarker Discovery and Treatment Efficacy Assessment. Metabolites 2024, 14, 438. https://doi.org/10.3390/metabo14080438
Alwahsh M, Alejel R, Hasan A, Abuzaid H, Al-Qirim T. The Application of Metabolomics in Hyperlipidemia: Insights into Biomarker Discovery and Treatment Efficacy Assessment. Metabolites. 2024; 14(8):438. https://doi.org/10.3390/metabo14080438
Chicago/Turabian StyleAlwahsh, Mohammad, Rahaf Alejel, Aya Hasan, Haneen Abuzaid, and Tariq Al-Qirim. 2024. "The Application of Metabolomics in Hyperlipidemia: Insights into Biomarker Discovery and Treatment Efficacy Assessment" Metabolites 14, no. 8: 438. https://doi.org/10.3390/metabo14080438