Article

Syndecan-1 Promotes Hepatocyte-Like Differentiation of Hepatoma Cells Targeting Ets-1 and AP-1

1
First Department of Pathology and Experimental Cancer Research, Semmelweis University, Üllői út 26, H-1085 Budapest, Hungary
2
Tumor Progression Research Group of Joint Research Organization of Hungarian Academy of Sciences and Semmelweis University, Széchenyi István tér 9, H-1051 Budapest, Hungary
3
Faculty of Information Technology and Bionics, Pázmány Péter Catholic University, Práter u. 50/A, H-1083 Budapest, Hungary
4
Department of Experimental Pharmacology, National Institute of Oncology, Ráth György utca 7-9, H-1122 Budapest, Hungary
5
Solvo Biotechnology, Irinyi József utca 4-20, H-1117 Budapest, Hungary
6
Department of Urology, Semmelweis University, Üllői út 78/B, H-1082 Budapest, Hungary
7
Department of Urology, West German Cancer Center, University of Duisburg-Essen, University Hospital Essen, Hufelandstr. 55, 45147 Essen, Germany
8
Szilak Laboratories Bioinformatics and Molecule-Design Ltd., Gem utca 14, H-6723 Szeged, Hungary
*
Author to whom correspondence should be addressed.
These authors contributed equally to this paper.
Biomolecules 2020, 10(10), 1356; https://doi.org/10.3390/biom10101356
Submission received: 29 July 2020 / Revised: 18 September 2020 / Accepted: 21 September 2020 / Published: 23 September 2020

Abstract

:
Syndecan-1 is a transmembrane heparan sulfate proteoglycan which is indispensable in the structural and functional integrity of epithelia. Normal hepatocytes display strong cell surface expression of syndecan-1; however, upon malignant transformation, they may lose it from their cell surfaces. In this study, we demonstrate that re-expression of full-length or ectodomain-deleted syndecan-1 in hepatocellular carcinoma cells downregulates phosphorylation of ERK1/2 and p38, with the truncated form exerting an even stronger effect than the full-length protein. Furthermore, overexpression of syndecan-1 in hepatoma cells is associated with a shift of heparan sulfate structure toward a highly sulfated type specific for normal liver. As a result, cell proliferation and proteolytic shedding of syndecan-1 from the cell surface are restrained, which facilitates redifferentiation of hepatoma cells to a more hepatocyte-like phenotype. Our results highlight the importance of syndecan-1 in the formation and maintenance of differentiated epithelial characteristics in hepatocytes partly via the HGF/ERK/Ets-1 signal transduction pathway. Downregulation of Ets-1 expression alone, however, was not sufficient to replicate the phenotype of syndecan-1 overexpressing cells, indicating the need for additional molecular mechanisms. Accordingly, a reporter gene assay revealed the inhibition of Ets-1 as well as AP-1 transcription factor-induced promoter activation, presumably an effect of the heparan sulfate switch.

1. Introduction

Liver cancer is the sixth most commonly diagnosed cancer (782,000 cases/year) and the second most common cause of cancer death (745,000 deaths/year) worldwide [1]. This excessively high mortality to incidence ratio reflects the poor prognosis of liver cancer and underlines the importance of a better understanding of its pathogenesis and biological behavior. Hepatocellular carcinoma (HCC) is a malignant tumor derived from hepatocytes and the most common (75%) histological type of primary liver cancer. Etiological factors include chronic hepatitis B or/and hepatitis C infection, dietary ingestion of aflatoxins, chronic alcohol abuse with subsequent chronic liver disease and cirrhosis, obesity, and diabetes [2] (pp. 205-216). Various signal transduction pathways including Wnt, p53, Rb, Ras, MAPK, JAK/STAT, EGFR/TGF-β, and the heat shock response are commonly altered in liver cancer [3,4].
Syndecan-1 (sdc-1, SDC1) is the prototype member of the syndecan family of membrane-bound proteoglycans, featuring heparan sulfate (HS) and chondroitin sulfate chains on its core protein [5,6]. It is predominantly expressed on the basolateral surface of epithelial cells [7]. Normal hepatocytes also express syndecan-1 on their basolateral surface facing the space of Disse [7,8,9,10]. In HCC, the normal sinusoidal and lateral localization pattern of syndecan-1 changes to a more uniform, honeycomb-like membrane distribution, with occasional cytoplasmic and nuclear positivity [9,10,11,12]. Syndecan-1 levels are found upregulated in HCCs that develop in a cirrhotic liver [10]. As a contrast, cell surface syndecan-1 expression is markedly reduced in HCCs with no underlying cirrhosis, especially in those with poor differentiation and high metastatic potential [9,10,13,14].
The intact ectodomains of all mammalian syndecans are constitutively released from cell surfaces by enzymatic cleavage [15,16]. Therefore, shed syndecan-1 is detectable in vitro in conditioned cell culture media (CCM) or in vivo in various body fluids, where its levels often correlate with disease stage. In fact, elevated amounts of shed syndecan-1 can be detected in the sera of patients with HCC as compared with healthy controls, and serum levels of shed syndecan-1 showed a positive correlation with the Barcelona Clinic Liver Cancer staging system, less favorable overall survival, and a greater risk of tumor recurrence and death [17,18]. Despite the abundance of relevant histological data, very little is known about the actual role of syndecan-1 in liver cancer. In the present study, we aimed to address the importance of syndecan-1 in hepatocellular tumor cells, with particular attention to its individual core protein domains.
To date, the exact fate of the post-shedding syndecan-1 remnant is elusive [19,20,21,22,23,24]. Therefore, in addition to full-length syndecan-1, in our model, we include a truncated form of syndecan-1 that contains the intracellular and transmembrane domains, as well as four extracellular amino acids (DRKE motif) but lacks the rest of the extracellular domain. This truncated construct is intended to mimic the potential action of the remnant portion of syndecan-1 after shedding. Because the versatile function of syndecan-1 largely depends on the structure of its heparan sulfate chains, we also attempted to clarify changes in the amount and structure of HS chains upon syndecan-1 transfection.

2. Materials and Methods

2.1. Cell Lines and Culture Conditions

HepG2 (ATCC HB-8065) [25] and Hep3B (ATCC HB-8064) human hepatocellular carcinoma [26] cell lines were obtained from the American Type Culture Collection (ATCC, Manassas, VA, USA) and maintained in Dulbecco’s Modified Eagle Medium supplemented with 10% fetal bovine serum 1% L-glutamine, and 100 U/mL penicillin-streptomycin. Cell culture consumables were purchased from Sigma-Aldrich Co. (St. Louis, MO, USA) and SARSTEDT AG&Co (Nümbrecht, Germany).

2.2. Plasmid Constructs

2.2.1. Mammalian Expression Vectors

Full-length human syndecan-1 cDNA and a deletion mutant, lacking nucleotides coding for amino acids 23–247, i.e., the extracellular domain except the signal peptide and the juxtamembrane DRKE motif, were cloned into mammalian expression vectors pEGFP-N1 and pEGFP-C3 (CLONTECHLaboratories, Inc./BD Biosciences, Palo Alto, CA, USA) and designated “full-length” and “truncated” syndecan-1, respectively (Szilák Laboratories Bioinformatics and Molecule-Design Ltd., Szeged, Hungary), as previously described [20,22]. The host vector, named as “empty vector” (pEGFP-N1) was used as a negative control.

2.2.2. Reporter Vectors

A high affinity consensus Ets-1 response element (ACCGGAAGT)5 was designed based on previous reports [27,28,29] and inserted in the promoterless firefly luciferase reporter vector pGL4.16[luc2CP/Hygro] (Promega Corporation, Madison, WI, USA). The PathDetect pAP-1-Luc cis-reporting plasmid (Agilent Technologies, Santa Clara, CA, USA) contained a firefly luciferase gene under the control of direct repeats of TPA-responsive elements. The pGL4.74[hRluc/TK] vector (Promega Corporation) encoding a Renilla luciferase gene was used as a control for transfection efficiency.

2.2.3. RNA Interference (RNAi) Expression Vectors

Targeted silencing of Ets-1 expression was achieved using the Block-iT Pol II miR RNAi Expression Vector Kit (Thermo Fisher Scientific, Waltham, MA, USA). Briefly, oligos for microRNAs starting at codons 362 and 641 were designed in silico with the Block-iT RNAi Designer software (Thermo Fisher Scientific) (Table S1). Specificity was confirmed by a BLAST search of human RefSeq RNA database. Ligation to pcDNA6.2-GW/EmGFP-miR vector and transformation of One Shot TOP10 chemically competent Escherichia coli cells (Thermo Fisher Scientific) were carried out according to the manufacturer’s protocol. Transformants were selected using Blasticidin at 40 μg/mL (Thermo Fisher Scientific). The system produces Emerald green fluorescent protein (EmGFP)-microRNA (miRNA) chimeras selectively targeting ETS1 transcripts.

2.2.4. Validation of Constructs

All plasmid constructs (empty vector, full-length sdc-1, truncated sdc-1, pEts-1-Luc, pAP-1-Luc, miR-lacZ, miR-362, miR-641, miR-362+641) were sequence verified by the Sanger method using the BigDye Terminator v3.1 Cycle Sequencing Kit and ABI PRISM 310 Genetic Analyzer (Thermo Fisher Scientific).

2.3. Transfection

HepG2 cells were transfected using Effectene (Qiagen GmbH, Hilden, Germany) nonliposomal lipid reagent as follows. Cells were seeded in 9.5 cm2 wells at a density of 3 × 10⁵ cells/well, 24 h prior to transfection. For each well, the transfection mixture contained 0.25 μg plasmid DNA, 100 μL EC buffer, 3.2 μL Enhancer solution, 10 μL Effectene reagent, and 0.6 mL serum-free medium. Hep3B cells were transfected using the Neon (Thermo Fisher Scientific) capillary-type electroporation system. In each well, 5 × 10⁵ cells were mixed with 3 μg plasmid DNA in a 100 μL tip and the following settings were configured: input voltage 1300 V, pulse width 40 ms, and pulse number 1. Using either method, the average transfection efficiencies and viabilities were >70% and >90%, respectively, monitored 24 h post-transfection with confocal laser microscope (Bio-Rad MRC 1024; Bio-Rad Laboratories Inc., Hercules, CA, USA) by the enhanced green fluorescent protein (EGFP) expression and with a microplate reader (VarioskanFlash v4.00.53 using SkanIt Software 2.4.5 RE for Varioskan Flash; Thermo Fisher Scientific) by luciferase activity. Stable transfectants were established by sustained antibiotic selection using the effective concentration of 650 μg/mL G418 (Roche Applied Science, Penzberg, Germany) for HepG2 and 500 μg/mL for Hep3B cells. Stably transfected cultures were enriched for higher expressors using FACSAria High Speed Cell Sorter (Becton-Dickinson, San Jose, CA, USA) and Navios Flow Cytometer (Beckman Coulter, Brea, CA, USA) and Kaluza v1.2 software (Beckman Coulter).
Stably transfected hepatoma cells were examined for any morphological changes. Live cells were observed by phase contrast microscopy (Olympus CK2 inverted phase microscope with an Olympus DP50 CCD camera, Olympus Corporation, Tokyo, Japan); fixed and hematoxylin-eosin (H&E) stained cells were photographed using light microscopy (Olympus BX50 microscope, Olympus Corporation).

2.4. Real-Time Quantitative Reverse Transcription PCR (qRT-PCR)

Total RNA was isolated using the Qiagen RNeasy Mini Kit (Qiagen GmbH), according to the instruction of the manufacturer. RNA concentrations were determined with a Nanodrop ND-100 device (Thermo Fisher Scientific). cDNAs were synthesized as follows: 1 μg total RNA, 1 μL 200 ng/μL random primer, and 1 μL 10 mM dNTP mix were incubated in 12 μL final volume, at 65 °C, for 5 min. Subsequently, 4 μL 5x first strand buffer, 2 μL 0.1 M DTT, 1 μL RNase OUT, and 200 U MMLV RT (Thermo Fisher Scientific) were added and the mixture was incubated at 25 °C, for 10 min, then at 37 °C for 50 min. The reaction was inactivated by 5 min incubation at 70 °C.
SDC1, ETS1, and MMP7 mRNAs were detected by real-time PCR amplification on a LightCycler 480 System (Roche Applied Science) using the following program: 95 °C for 10 min, then, 10 touchdown cycles of 95 °C for 30 s, 60 °C with 0.4 °C decrement/cycle for 30 s, 72 °C for 30 s, followed by 40 cycles of amplification at 95 °C for 30 s, 56 °C for 30 s, and 72 °C for 30 s. The reaction mixture included AmpliTaq Gold 360 Master Mix (Thermo Fisher Scientific), ResoLight Dye (Roche Applied Science), specific primers at 200 nM final concentration, and 2 μL cDNA in 10 µL final volume. The examined mRNA expressions were normalized to those of reference genes GAPDH and 18S rRNA (4326317E and 4319413E, Thermo Fisher Scientific). Primer sequences are included in Table S1.

2.5. Immunofluorescence

Cells were seeded on glass coverslips and fixed with either 4% w/v paraformaldehyde for 10 min or ice-cold methanol for 10 min. Fixed cells were further permeabilized with 0.1% v/v Triton X-100 for 10 min when needed. Nonspecific binding was blocked with 5% w/v bovine serum albumin (BSA, Merck KGaA, Darmstadt, Germany) and 5% v/v nonimmune serum from the host species of secondary antibody. Primary antibodies were applied overnight in 1% w/v BSA at 4 °C (Table S2). After washing in PBS, coverslips were incubated with fluorescent-labeled secondary antibodies in 1% w/v BSA for 1 h at room temperature (Table S2). Cells were washed and mounted in Vectashield fluorescence mounting medium containing DAPI (Vector Laboratories Inc., Burlingame, CA, USA) or propidium iodide (Merck KGaA). Immunofluorescence images were either captured on a Nikon Eclipse E600 microscope (Nikon Corporation, Tokyo, Japan) connected to the Lucia Cytogenetics v1.5.6 software (Laboratory Imaging, Prague, Czech Republic), or with a Bio-Rad MRC 1024 (Bio-Rad Laboratories Inc.) confocal laser microscope.

2.6. Enzyme-Linked Immunosorbent Assay (ELISA)

Cell-bound and shed forms of syndecan-1 were quantified using the CD138 ELISA Kit (Diaclone Research, Besancon, France) according to the instructions of the manufacturer. Conditioned, serum-free media were concentrated using Centricon centrifugal filter devices with 10 kDa nominal molecular weight limit filters (Merck Millipore, Burlington, MA, USA). Cells were lysed in a buffer containing 20 mM Tris-HCl pH 8.0, 150 mM NaCl, 2 mM EDTA, 0.5% v/v Triton X-100, and protease inhibitor cocktail (Sigma-Aldrich). The protein content of the samples was determined by Coomassie reagent (Bio-Rad Laboratories Inc.) and 300 μg total protein from each sample was applied to the ELISA plate. Optical densities were read at 450 nm in a LabSystems Multiskan MS microplate reader (Thermo Fisher Scientific).

2.7. Western and Dot Blotting

Cells at 80% confluency were harvested in lysis buffer containing 20 mM Tris-HCl (pH 8.0), 150 mM NaCl, 2 mM EDTA, 0.5% v/v Triton X-100, protease inhibitor cocktail, 5 mM NaF, 2 mM NaVO3 (all Sigma-Aldrich) and centrifuged at 13,000 rpm for 10 min at 4 °C. Supernatants were diluted in Laemmli buffer, boiled, and aliquots containing 25 μg total protein were subjected to sodium dodecyl sulfate polyacrylamide (SDS-PAA) gel electrophoresis. Then, samples were blotted to Immobilon-P PVDF membranes (Merck Millipore) overnight at 4 °C, and blocked with 5% w/v BSA, for 1 h, at room temperature. All hardware and reagents for Western blotting were purchased from Bio-Rad Laboratories Inc. For dot blotting, parallel with the control samples, cells were exposed to phorbol ester (phorbol 12-myristate 13-acetate, PMA) at 0.5 μM for 15 min. Two hundred μL CCM per sample was blotted onto the membranes using a Minifold Vacuum Filtration system SRC-96 (Schleicher & Schuell GmbH of Whatman Plc., Dassel, Germany), then subjected to immunoassays. Primary antibodies (Table S2) were applied in 1% w/v BSA overnight at 4 °C. Membranes were washed in Tris-buffered saline containing 0.1% v/v Tween-20 (TBST), and horseradish peroxidase (HRP)-conjugated secondary antibodies (Table S2) were applied for 1 h at room temperature. After washing in TBST, immunoreactions were visualized by enhanced chemiluminescence using SuperSignal West Pico Chemiluminescent Substrate (Pierce/Thermo Fisher Scientific). Images were obtained using Kodak Image Station 4000MM (Eastman Kodak Company, Rochester, NY, USA) and densitometric analysis was performed using Kodak Molecular Imaging Software 4.0.3. (Eastman Kodak Company) or ImageJ software (Bethesda, MD, USA). For Western and dot blots, chemiluminescent intensities were normalized to Ponceau S staining.

2.8. Phospho-Receptor Tyrosine Kinase (pRTK) Array

The phosphorylation status of 42 different RTKs was screened using the Human Phospho-Receptor Tyrosine Kinase Array Kit (R&D Systems, Minneapolis, MN, USA) according to the manufacturer’s protocol (Figure S1). Briefly, confluent monolayers of stable Hep3B transfectants were lysed in lysis buffer containing 1% v/v Igepal CA-630, 20 mM Tris-HCl (pH 8.0), 137 mM NaCl, 10% v/v glycerol, 2 mM EDTA, 1 mM NaVO3, 10 μg/mL aprotinin, 10 μg/mL leupeptin, and 10 μg/mL pepstatin. Lysates were centrifuged at 13,000 rpm for 10 min at 4 °C, and supernatants containing 500 μg total protein were transferred to nitrocellulose membranes containing capture and control antibodies. Following incubation with HRP-conjugated detection antibodies, signals were visualized by ECL, and detected and quantified by Kodak Image Station 4000MM and Kodak Molecular Imaging Software 4.0.3.

2.9. Zymography

Twenty μL aliquots of CCM containing 15 μg total protein from each HepG2/Hep3B transfectant were subjected to gelatinase zymogram analysis. Briefly, samples were run on 10% SDS-PAA gels containing 300 μg/mL gelatin. Normal human serum served as a control. Gels were washed in 2.5% Triton X-100 for 30 min and incubated overnight in a solution containing 50 mM Tris (pH 7.5) and 10 mM CaCl2 at 37 °C. Then, gels were fixed in 30% methanol/10% acetic acid solution for 30 min and proteinase activities were visualized by Coomassie Blue staining (Bio-Rad Laboratories Inc.). Gelatinase activity appeared as transparent bands against the blue background. Images were taken on a Kodak Image Station 4000MM (Figure S2).

2.10. Cell Proliferation Assay

Cell proliferation rates were measured using the Sulforhodamine B (SRB, Sigma-Aldrich) colorimetric assay [30]. In brief, cells were counted using a hemocytometer and Trypan Blue dye exclusion and seeded in 96-well plates at a density of 5 × 10³ cells/well in 100 μL culture medium. Each transfectant, at each time point, was represented in at least 8 parallel wells. Every 24 h, cells were fixed with 10% trichloroacetic acid for 1 h, at 4 °C. After an extensive wash with tap water, plates were allowed to dry, and were stained with 0.4% SRB in 1% acetic acid for 30 min. Following extensive wash with 1% acetic acid, plates were dried, and the dye was dissolved in 10 mM Tris-HCl. Color intensity was measured at 570 nm absorbance using a LabSystems Multiskan MS microplate reader. Doubling times were calculated from the log-phase of growth curves.

2.11. Statistical Analysis

Data were analyzed using Microsoft Excel v.2016 (Microsoft Corp., Redmond, WA, USA) and GraphPad Prism 7 (GraphPad Software, La Jolla, CA, USA). Data from syndecan-1 transfectants were normalized to those containing the empty vector, miR transfectants were normalized to those expressing miR-lacZ. For ELISA, qRT-PCR, luciferase reporter assay, pRTK array, Western and dot blot, the data from empty vector vs. sdc-1 transfected forms and from miR-lacZ vs. miR-362, miR-641, and miR-362+641 transfected forms were analyzed by unpaired Student’s t-test. For dot blot, data from full-length vs. truncated sdc-1 transfectants were analyzed by unpaired Student’s t-test. Statistical significance was considered at p < 0.05.

3. Results

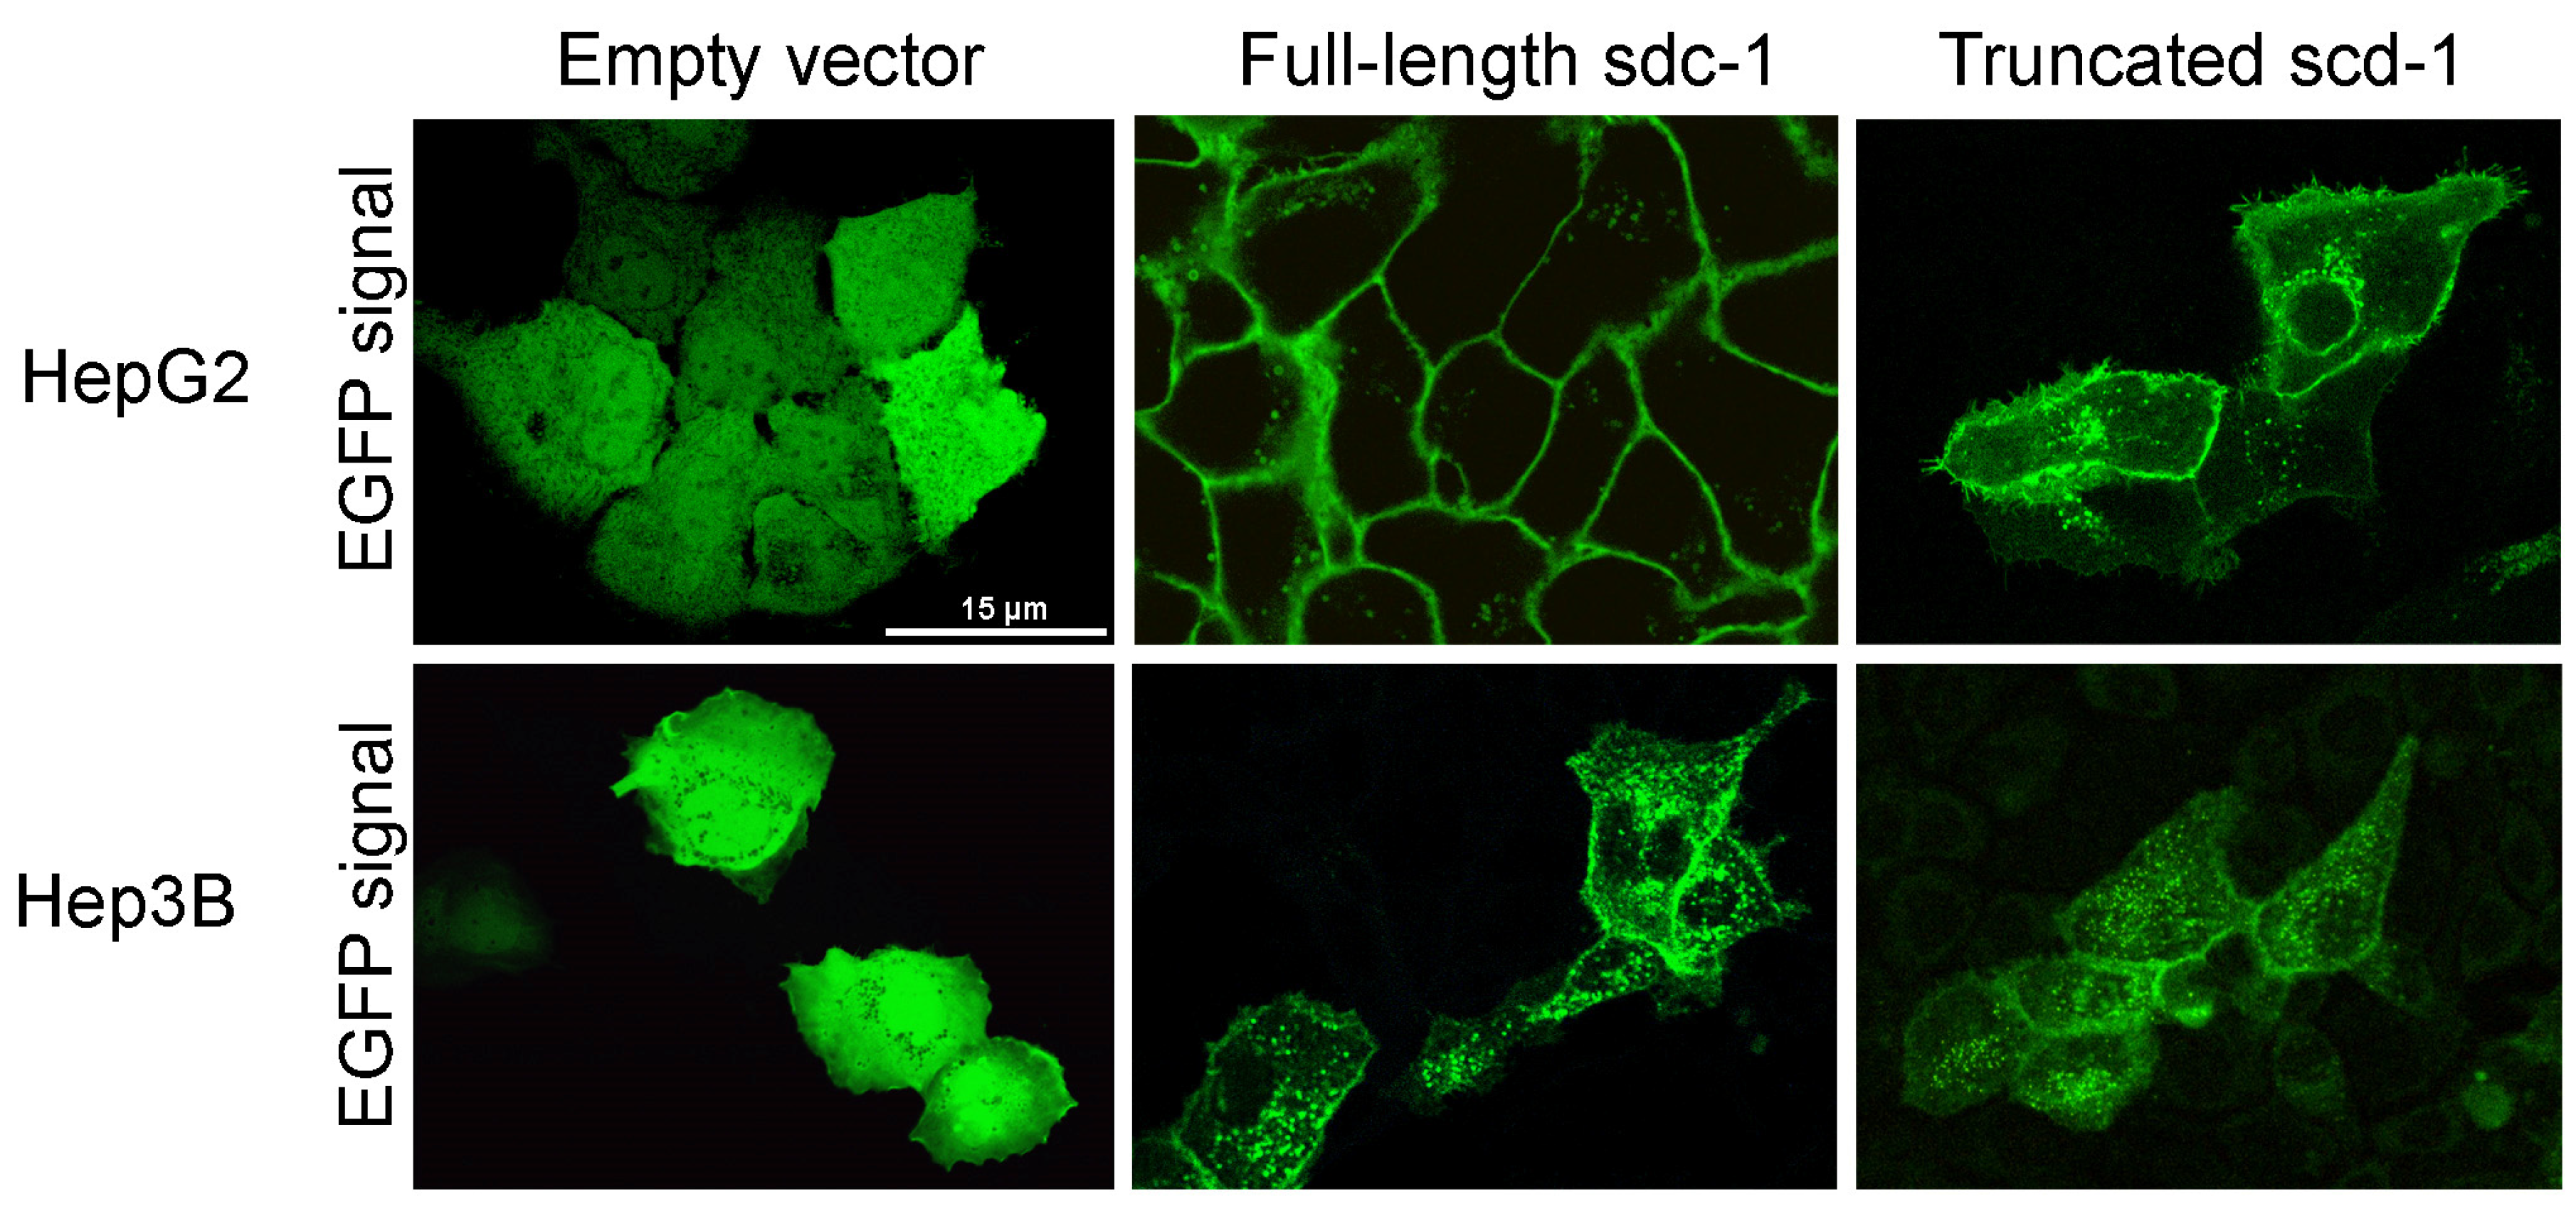
3.1. Expression of Wild-Type and Truncated Syndecan-1 in Hepatoma Cells

Full-length and truncated syndecan-1 were transfected into HepG2 and Hep3B cells. Stable transfectants were established and subcellular localization of the fusion protein products was observed by fluorescent microscopy (Figure 1). Full-length syndecan-1 localized primarily to the plasma membrane and to a lesser extent to cytoplasmic vesicular structures. Truncated syndecan-1 showed a weaker fluorescent signal on the cell surface and was more abundant in the endosomal compartment. Notably, both full-length and truncated syndecan-1 constructs preferentially localized to the plasma membrane at areas of cell-cell contact. Diffuse green fluorescence was detected in the empty vector transfected cells.

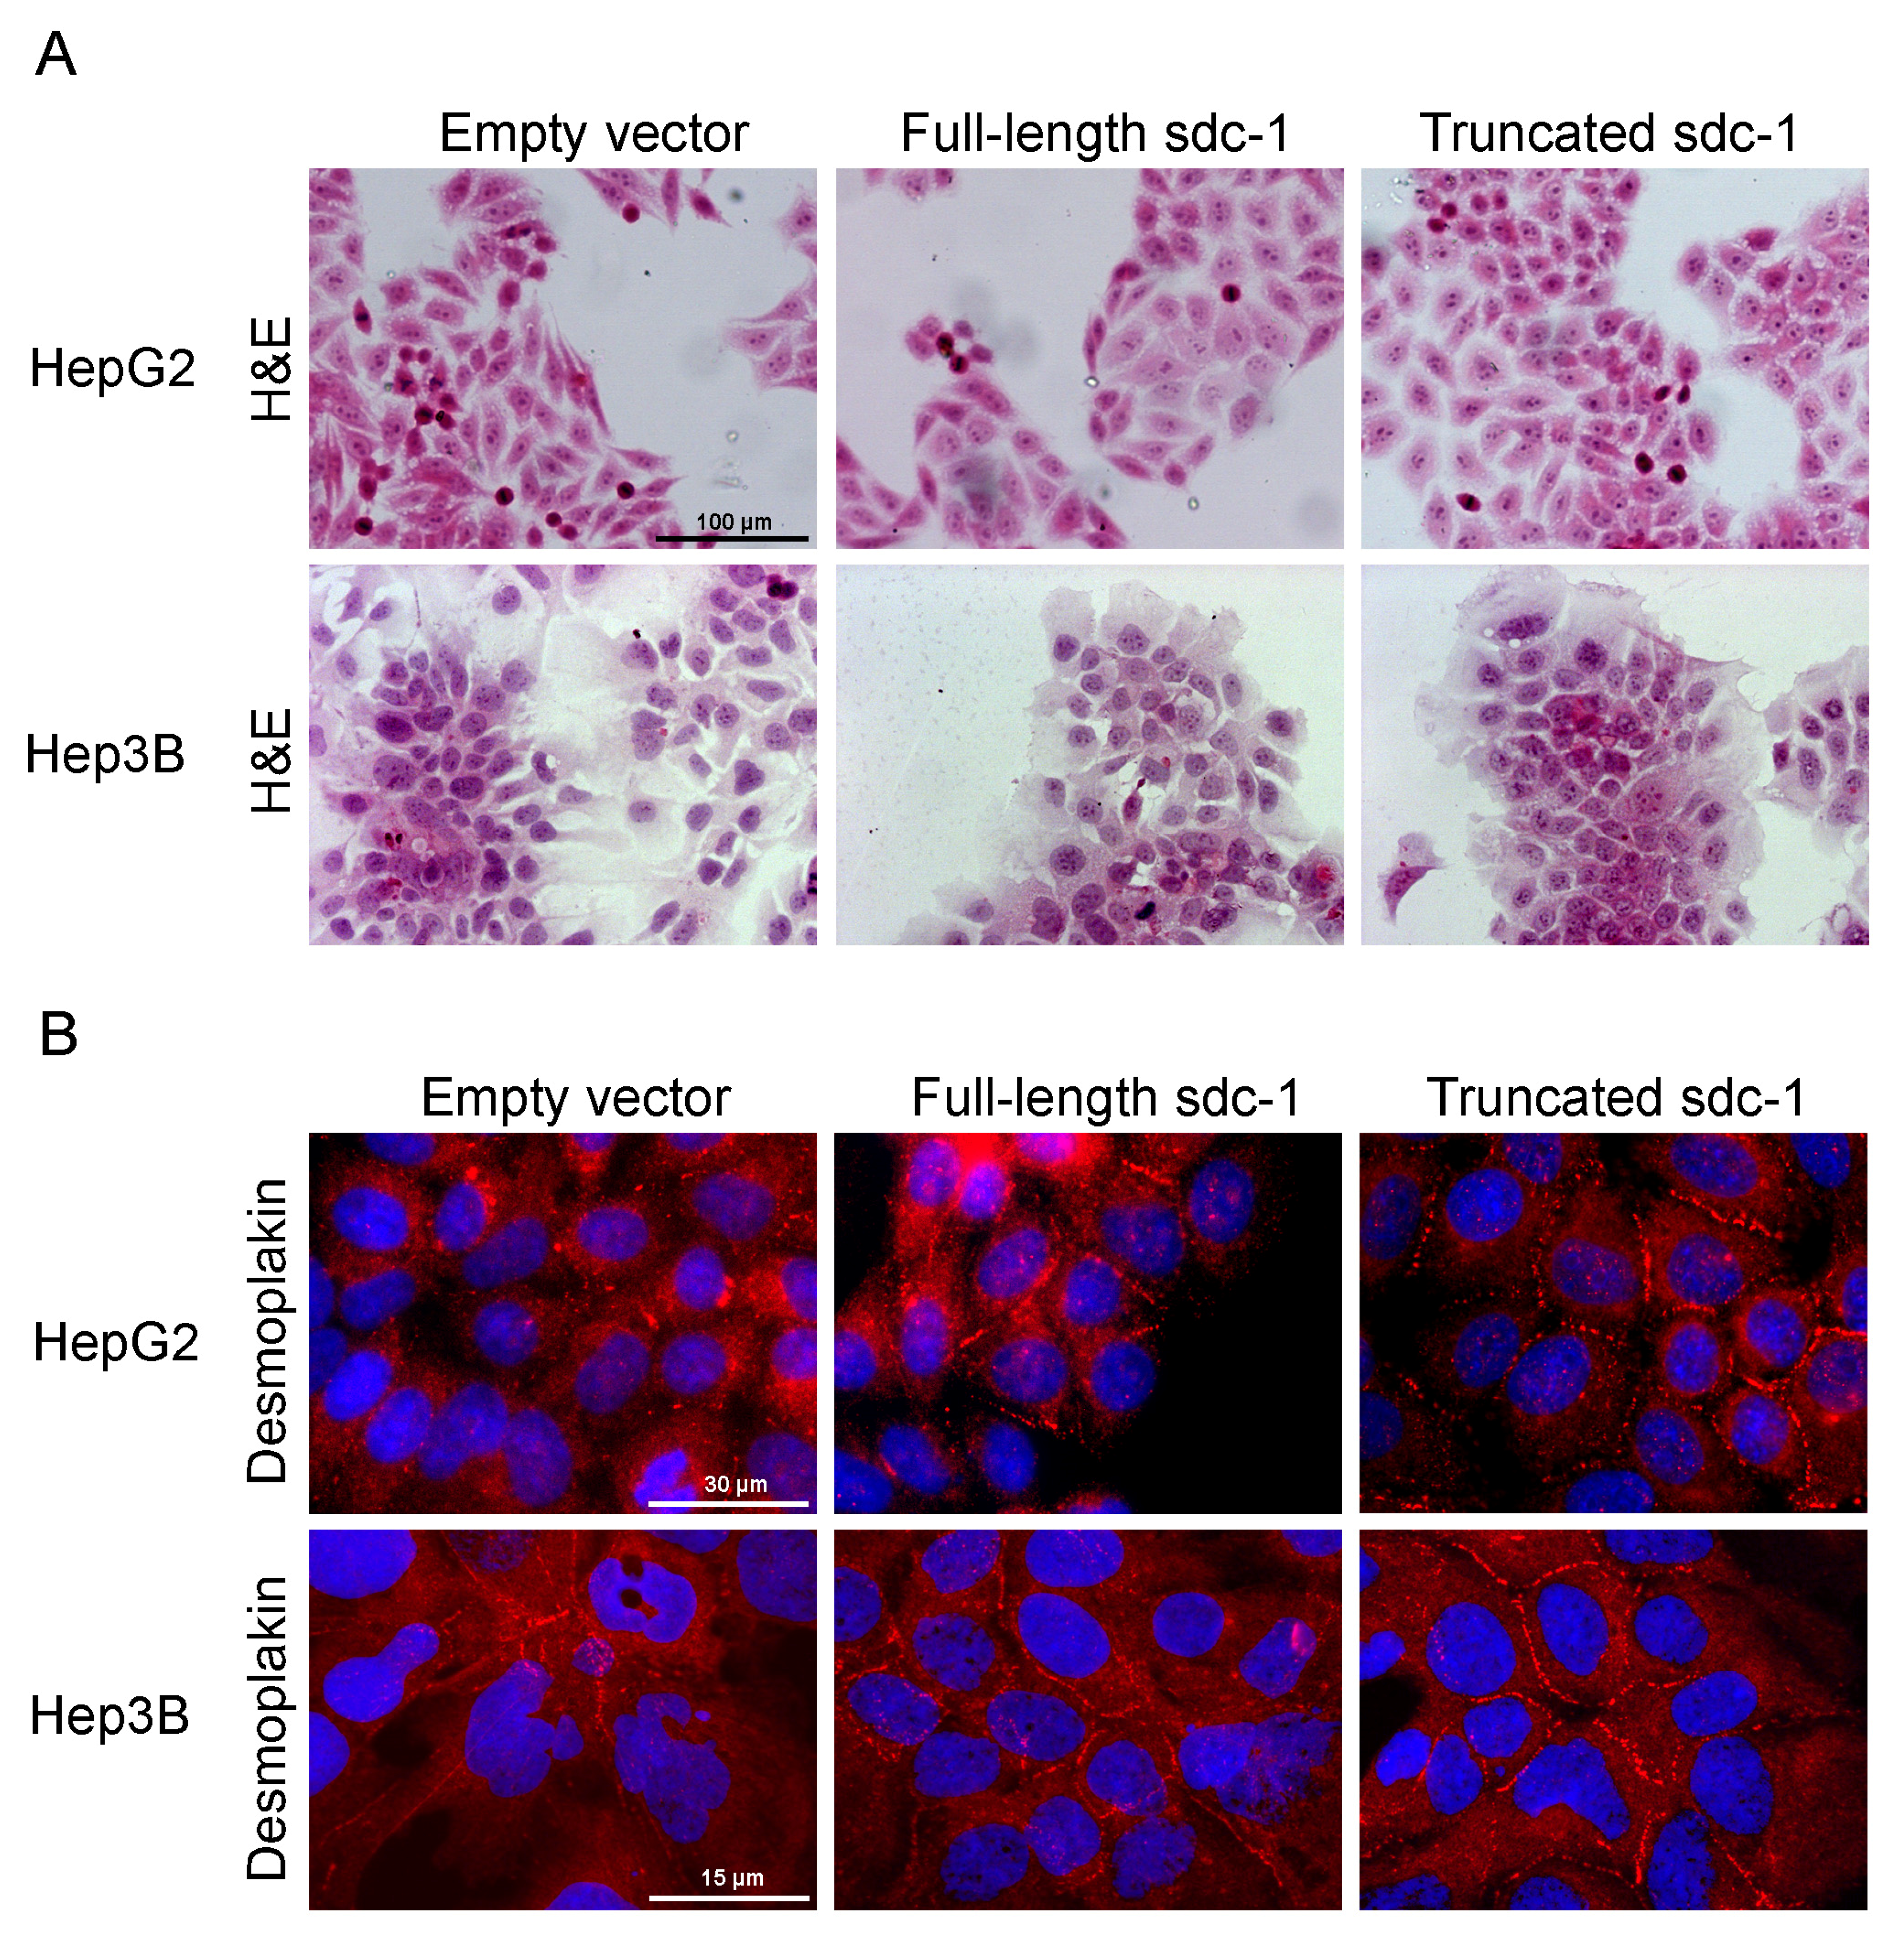
3.2. Overexpression of Full-Length or Truncated Syndecan-1 Induces a Hepatocyte-Like Cell Morphology

HepG2 and Hep3B cells were selected as transfection targets; as HepG2 expressed, whereas Hep3B contained hardly any endogenous syndecan-1, thus, we presumed that they would respond differently to syndecan-1 transfection. The morphology of the transfected cell lines was examined by H&E staining. Remarkably, overexpression of full-length or truncated syndecan-1 resulted in morphological signs of hepatocyte-like differentiation. Typical features of hepatomas such as heterogeneous cell size, irregular nuclear staining, elongated cell shape, and the presence of dividing cells, were partially replaced by a more homogenous, isodiametric morphology. A cobblestone pattern was more prominent in HepG2 transfectants, while the disappearance of the fusiform component from cultures was characteristic of Hep3B transfectants. In low-confluence cultures, syndecan-1 overexpressing cells spread better and had a decreased nuclear-to-cytoplasmic ratio. In near-confluent and confluent cultures, however, syndecan-1 overexpressing cells tended to form denser islets. The number of dividing cells also decreased markedly in the areas displaying differentiation (Figure 2A). The above changes in cell morphology were more prominent in hepatoma cells overexpressing the truncated form of syndecan-1.
Cells were immunostained for desmoplakin, an obligate component of functional desmosomes. As opposed to cells transfected with the empty vector where desmoplakin was dispersed in the cytoplasm, syndecan-1 transfected cells recruited desmoplakin to areas of cell-cell contact serving as a marker of cell differentiation (Figure 2B). Importantly, albumin expression was reactivated in truncated syndecan-1 transfectants, as observed by fluorescent immunocytochemistry (Figure 2C). Changes in cell morphology, as described above, appeared more markedly in hepatoma cells overexpressing the truncated form of syndecan-1.

3.3. Syndecan-1 Status of the Transfectant Cells

To elucidate the mechanism by which the overexpression of full-length or truncated syndecan-1 resulted in the phenotypical changes observed, we next evaluated whether and how syndecan-1 turnover was affected in our cells. As expected, mRNA coding for the cytoplasmic domain of syndecan-1 was elevated in both full-length and truncated syndecan-1 transfected cells, whereas mRNA coding for the syndecan-1 ectodomain was elevated only in the full-length transfected cells (Figure 3A). Surprisingly, however, syndecan-1 ectodomain protein levels were increased in both transfectants, as shown by immunofluorescence and ELISA using a syndecan-1 ectodomain-specific antibody (Figure 3B,C). To elucidate the mechanism regarding why endogenous syndecan-1 was expressed in truncated syndecan-1 expressing cells, further experiments were carried out.

3.4. Shift of Heparan Sulfate Epitope Abundance in Syndecan-1-Transfected Hep3B Cells

Heparan sulfate structure was probed using two structure-specific heparan sulfate antibodies, HS4C3 and AO4B08. HS4C3 recognizes highly sulfated and 3-O-sulfated motifs, whereas AO4B08 reacts with epitopes possessing an internal 2-O-sulfated iduronic acid residue and more than one 6-O-sulfate groups [10,31,32,33]. The intensity of AO4B08 immunoreaction was reduced upon transfection with either full-length or truncated syndecan-1 as compared with the empty vector control; in contrast, HS4C3-reactive epitopes were markedly upregulated in both transfectants, especially in those expressing the truncated variant. In addition to the cell surface, HS4C3 was also clearly detected in cell nuclei (Figure 3D). Taken together, heparan sulfate modifications were shifted in syndecan-1 transfected cell lines from AO4B08-reactive towards HS4C3-reactive epitopes. Of note, the empty vector-transfected cells also contained low amounts of HS4C3-reactive heparan sulfate which, however, was probably linked to another proteoglycan core, as syndecan-1 was hardly expressed in these cells.

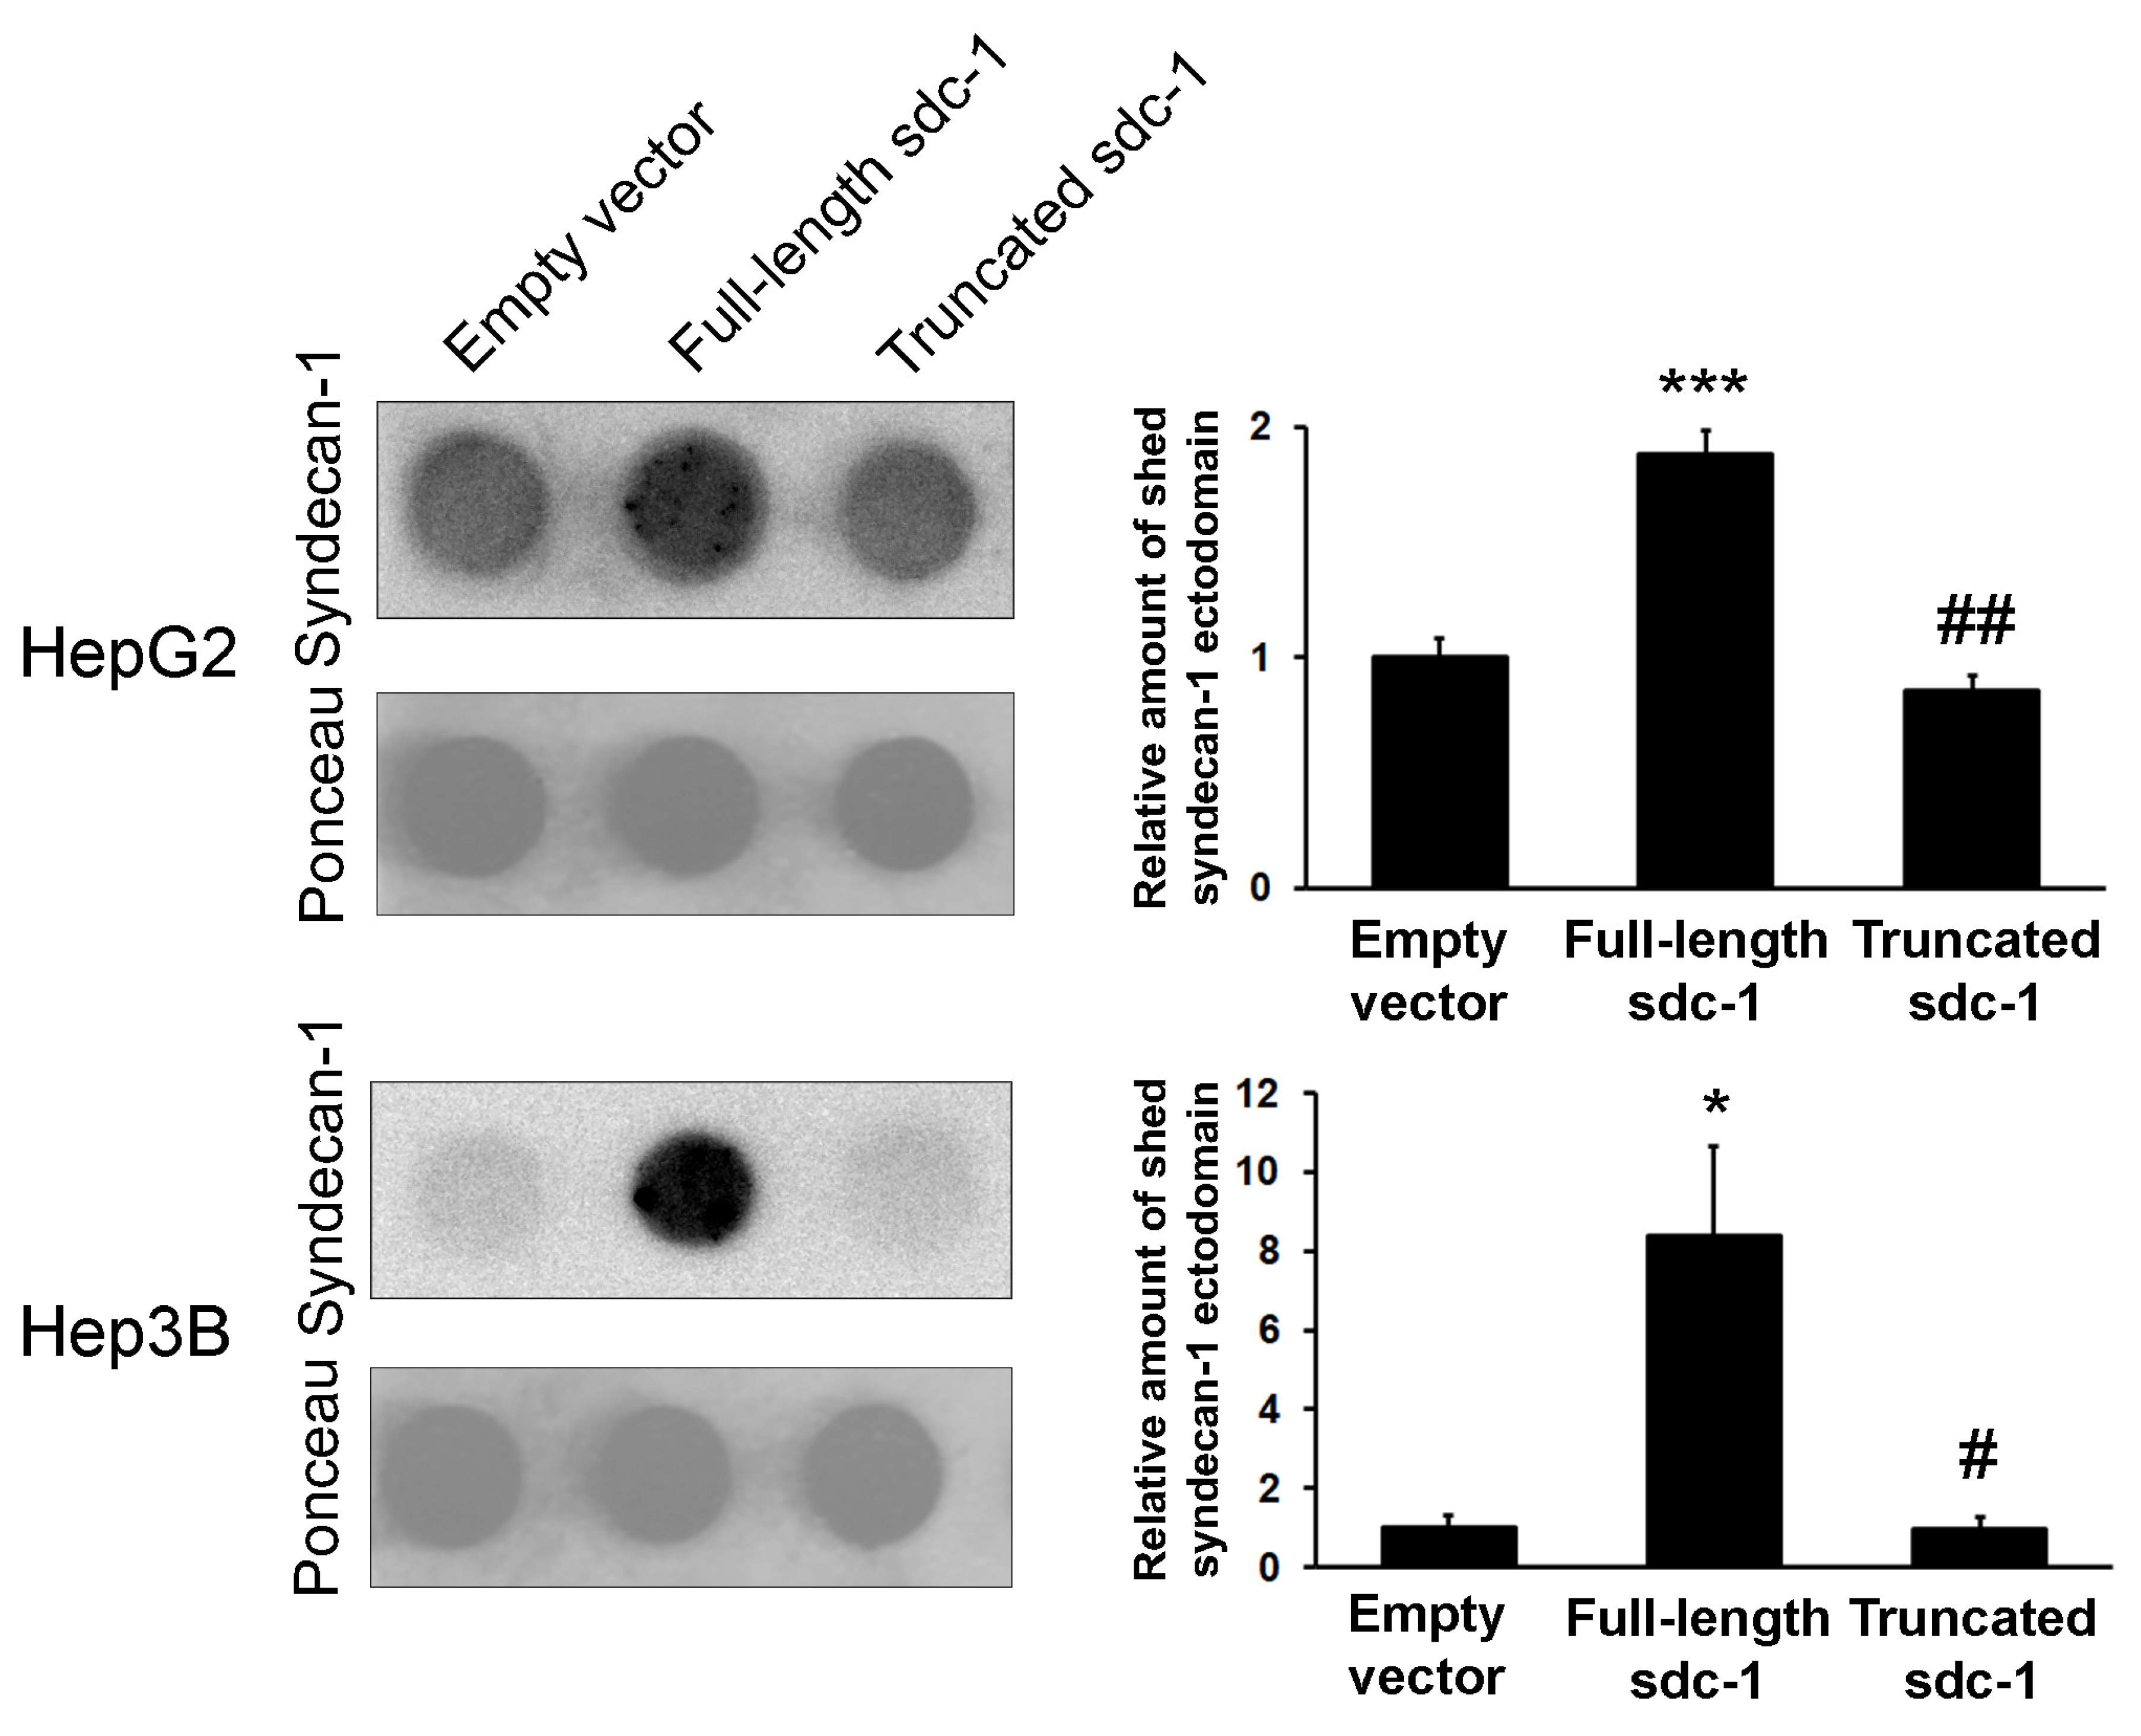
3.5. Syndecan-1 Shedding is Inhibited by Truncated Syndecan-1 in Hepatoma Cells

The elevated syndecan-1 ectodomains on the surface of the truncated syndecan-1 expressing cells could indicate an enhanced translation or extended half-life of endogenous syndecan-1 molecules, the latter being a result of decreased proteolytic shedding of endogenous syndecan-1 from the cell surface. To test this hypothesis, we performed a dot blot assay to quantify the presence of shed syndecan-1 protein ectodomains in the CCM of our cell lines (Figure 4). A comparison with the empty vector-transfected cells showed that the amount of shed syndecan-1 ectodomain was increased in the CCM of full-length syndecan-1 transfectants; however, despite an increased abundance of the native protein on the cell surface as demonstrated by immunofluorescence, ELISA and syndecan-1 ectodomain shedding remained as low as the control, in the CCM of truncated syndecan-1 overexpressing cells. To further demonstrate that endogenous syndecan-1 was enhanced because of its suppressed shedding in truncated transfectants, cells were treated with PMA that induced shedding (Figure S3). Indeed, the amount of shed syndecan-1 ectodomain in the CCM of truncated transfectants was greatly increased by PMA.

3.6. Truncated Syndecan-1 Suppresses Proliferation of Hepatoma Cells

The proliferation rate of truncated syndecan-1 transfectants decreased significantly in both hepatoma cell lines (Student’ t-test, HepG2 p < 0.001 and Hep3B p < 0.001) (Figure 5A,B). In HepG2, the generation time increased from 39.4 to 49.2 h (by 24.9%) and to 64 h (by 62.7%) in full-length and truncated syndecan-1 transfectants, respectively, whereas in Hep3B, it was increased from 34.6 to 52.4 h (by 51.2%) in truncated syndecan-1 transfectants as compared with the empty vector control. For both cell lines, the difference between control and truncated transfectants was significant at p < 0.001 (Student’ t-test) (Figure 5C). Transfection of Hep3B with full-length syndecan-1 appeared to reduce doubling time to 30.2 h (by 12.9%); whereas this difference was statistically significant, its biological relevance was probably minor (Figure 5C).

3.7. Overexpression of Truncated Syndecan-1 Downregulates MMP-7 Expression in HCC Cells

In vivo, proteolytic shedding of syndecan-1 ectodomains was shown to be mediated by MMP-7 [34,35]; therefore, we evaluated MMP-7 expression in our cells (Figure 6). Except for HepG2 transfected with full-length syndecan-1, decreased expression of MMP-7 was detected in syndecan-1 transfectants by qRT-PCR and immunostaining. Zymography also corroborated the decreased activity of MMP-7 protease in full-length syndecan-1 Hep3B transfectants. The MT-MMP-1 (MMP-14) could have compensated for the decreased amount of MMP-7 (Figure S2).

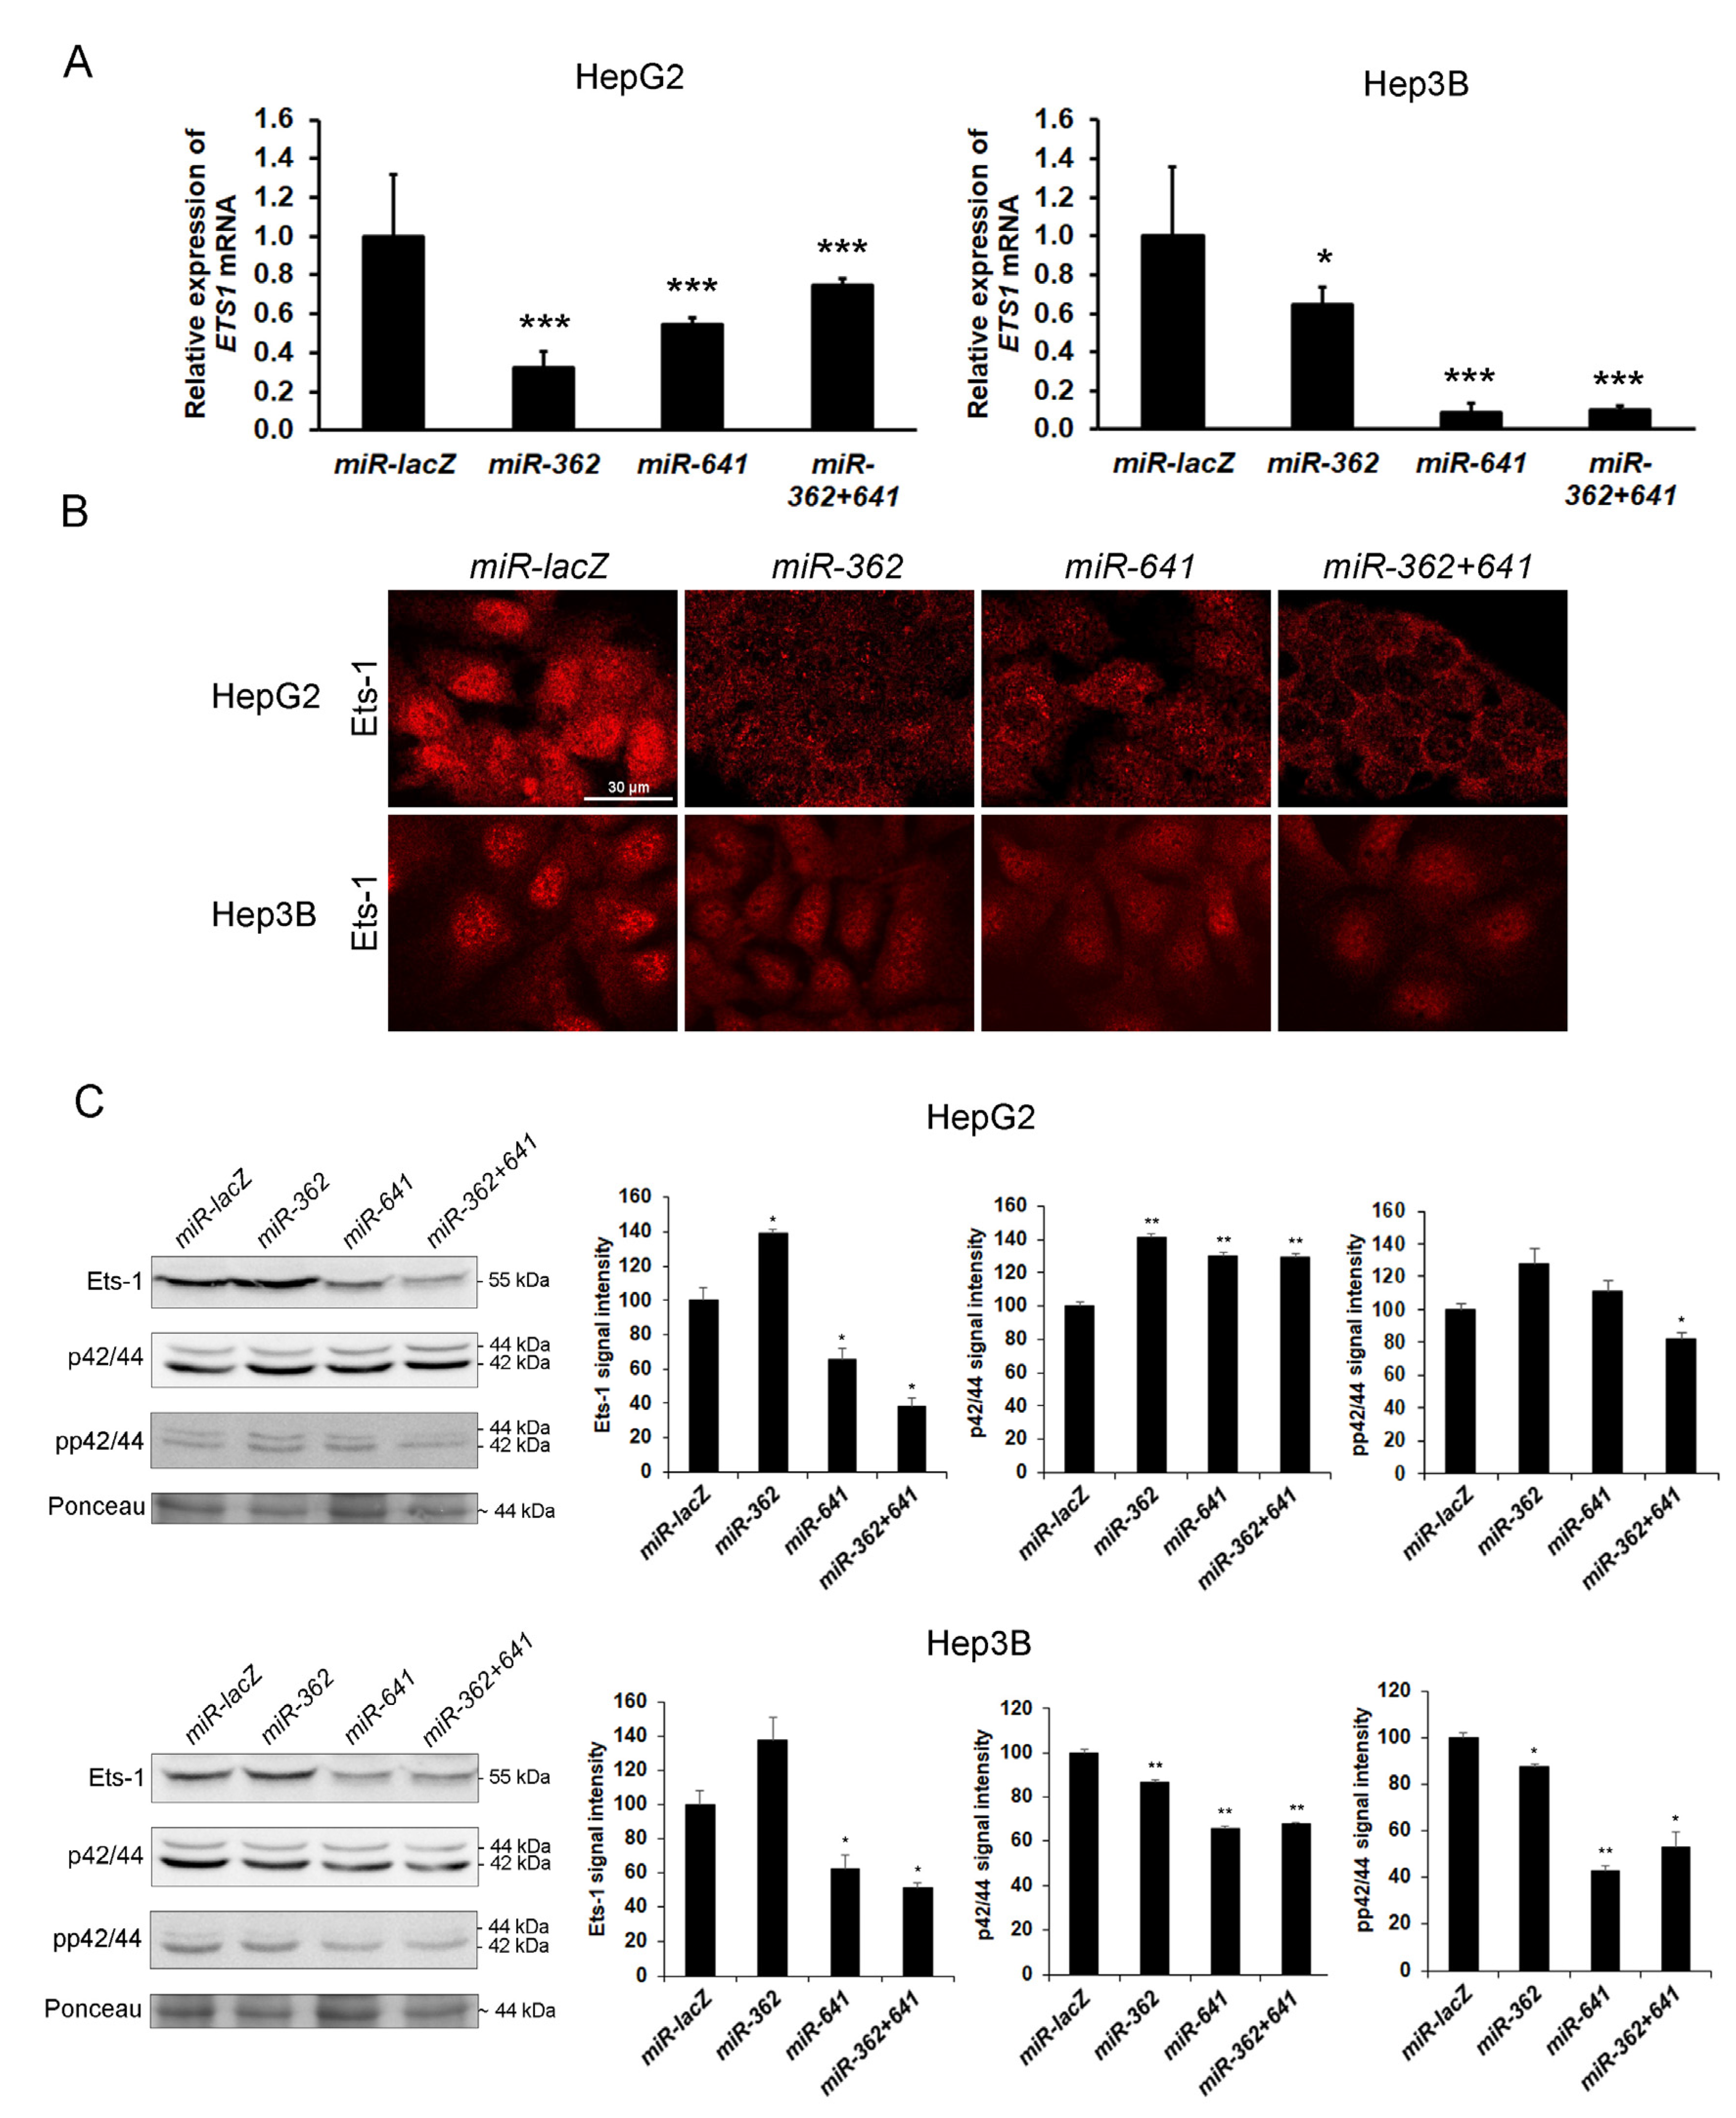
3.8. Signaling Pathways Converging to Ets-1 Are Downregulated in Hepatoma Cells Overexpressing Full-Length or Truncated Syndecan-1

Expression of various MMPs is typically regulated by the ETS and AP-1 families of transcription factors, therefore, we evaluated their expression at both protein and functional activity levels using immunocytochemistry, and luciferase reporter assays (Figure 7A,B). Although the amount of Ets-1 did not seem to change significantly, its nuclear localization diminished markedly in the truncated syndecan-1 transfectants, although the cytosol was saturated with Ets-1 (Figure 7A). The relative activation of Ets-1 response elements did not decrease in the full-length syndecan-1 transfected HepG2 cells, whereas all the other response elements we studied were downregulated as compared with the empty vector containing control cell lines. This could explain why MMP-7 expression remained invariant in the full-length syndecan-1 transfected HepG2 cell line (Figure 6). In the meantime, in the case of AP-1 response elements, all transfected cell lines showed decreased activity (Figure 7B).
Since the Ets-1 transcription factor is known to be activated by ERK1/2 and p38 kinases, we also measured protein levels and phosphorylation status of these proteins using Western blot. Both the amounts and activating phosphorylations of ERK1/2 and p38 (T202/Y204 and T185/Y187 on ERK1 and ERK2, respectively; T180 and Y182 on p38) tended to diminish upon syndecan-1 overexpression, with some changes being significant (Figure 7C).

3.9. Silencing of Ets-1 Alone is Insufficient to Induce Epithelial Differentiation in Hepatoma Cell Lines

To confirm that syndecan-1 induced downregulation of Ets-1 is in a causal relationship with hepatocyte-like differentiation of the transfected hepatoma cells, wild-type HepG2 and Hep3B cell lines were stably transfected with miRNA expressing plasmids, i.e., designated miR-362, miR-641 and miR-362+641, targeting ETS1 transcripts. Control cells were transfected with a miRNA targeting lacZ transcripts (miR-lacZ). Successful knockdown of Ets-1 was confirmed by fluorescent immunocytochemistry, qRT-PCR, and Western blot (Figure 8).
Unlike the overexpression of syndecan-1 that inhibited MMP7 in Hep3B cells, downregulation of ETS1 alone by miRNA did not result in consistent suppression of MMP-7. While some of the effects of syndecan-1 were reproduced, for example, desmoplakin localization was moderately redistributed to areas of cell-cell contacts, as seen in Hep3B cells, and epithelial cell morphology was partially regained, ETS1 silencing failed to fully replicate the syndecan-1 induced phenotype shift (Figure 9).

4. Discussion

On the basis of in vitro observations on mouse mammary tumor cells [36], Jalkanen and colleagues suggested that the loss or suppression of syndecan-1 expression had an important role in driving malignant transformation, as restitution of syndecan-1 expression cells regained epithelial morphology and diminished anchorage-independent malignant growth [37]. The degree of syndecan-1 loss in carcinomas often correlates with histological grade and indicates poor prognosis, as shown in head and neck [38,39,40], hepatocellular [13,14], colorectal [41,42,43,44], cervical [45], pancreatic [46], renal carcinomas [47], and bladder [48] cancers. Intriguingly, strong expression of syndecan-1 can also confer aggressive behavior to some tumor types as reported in dedifferentiated thyroid [49], poorly differentiated prostate [50,51], high grade breast [52,53], high grade ovarian [54,55], and high grade hepatocellular carcinomas [12].
Syndecan-1, as a major proteoglycan constituent of the liver, is extensively implicated in the physiological function of hepatocytes. Liver diseases are often accompanied by quantitative changes of syndecan-1. Liver cirrhosis is characterized by increased amounts of syndecan-1, and shed syndecan-1 has been experimentally shown to protect against fibrotic remodeling [56]. The significance of quantitative changes of syndecan-1 in liver cancer is still not clearly understood [57]. In the present study, we made an effort to investigate the importance of syndecan-1 in HCC, where loss of syndecan-1 was frequently observed and associated with poor prognosis. Therefore, we restored the expression of full-length or ectodomain-deleted syndecan-1 in two HCC cell lines.
In line with previous reports [58], syndecan-1 was expressed moderately in HepG2, and hardly expressed in Hep3B cells. The full-length and truncated syndecan-1 constructs were both successfully expressed and showed enrichment in the plasma membrane, mostly at sites of cell-cell contact. This observation implies that the ectodomain is dispensable for the cell surface localization of truncated syndecan-1. However, it is to be noted that our truncated syndecan-1 construct still contained the transmembrane domain and membrane-proximal four amino acids of the ectodomain that were found important for the dimerization [20,59,60].
Overexpression of syndecan-1, especially of the truncated construct, resulted in a more differentiated and hepatocyte-like phenotype. This change was accompanied by enhanced formation of desmosomes, as indicated by the accumulation of desmoplakin at sites of cell-cell contact. Desmoplakin provides the link to intermediate filaments, and therefore is an obligate component for the stabilization of desmosomes and, consequently, tissue architecture [61]. Accordingly, abnormal localization and loss of desmoplakin were shown to correlate with progression in several types of cancer [62] including HCC [63]. Overexpression of truncated syndecan-1 also triggered albumin production and reduced cell proliferation, both of which were benchmarks of a more differentiated phenotype.
Transfection of B6FS fibrosarcoma and STAV-AB malignant mesothelioma cells with the same two constructs used in this study also resulted in decreased proliferation and a more epithelioid cell morphology [20]. On the contrary, both constructs decreased doubling time in HT-1080 fibrosarcoma cells [22]. A recent study demonstrated the interaction of syndecan-1 with important regulatory proteins inside the nucleus [64].
Unexpectedly, immunostaining revealed an elevated amount of full-length syndecan-1 on the cell surface of cells transfected with truncated syndecan-1. Expression of the truncated form did not enhance the transcription of the endogenous syndecan-1, however, it could have increased its translation or inhibited the shedding of its ectodomain. Overexpression of full-length syndecan-1 increased the amount of shed ectodomains, which aligned with previous findings [65]. Although matrix metalloproteinases with syndecan-1 sheddase activity are primarily produced by stromal cells [34,35,66,67,68,69], MMP-7 and MMP-14 can be expressed by normal, as well as tumorous hepatocytes [56,70]. We found that MMP-7 was suppressed in cells overexpressing the truncated form of syndecan-1. It is plausible that transfection with ectodomain-deleted syndecan-1 mimics the post-shedding membrane stub and exerts feedback inhibition towards MMP-7 production. Multiple mechanisms that could mediate such regulation have been published. Activation of MAPK, EGF, and PKCα can facilitate syndecan-1 shedding. Our experiments revealed that PMA exposure enhanced syndecan-1 shedding, which indicated the potential implication of PKCα [71].
The fate of truncated syndecan-1 requires more investigation. In a process termed regulated intramembrane proteolysis (RIP), the remaining core protein stub could be subjected to intramembrane cleavage, where an intramembrane-cleaving protease would release the cytoplasmic domain without membrane damage, rendering it available for proteasomal degradation or translocation to the nucleus [72,73,74]. RIP presumably occurs only if the remaining ectodomain stub is shorter than 30 amino acid residues [75]. In our truncated syndecan-1 construct, the truncated syndecan-1 core protein was extracellularly tagged with EGFP, therefore, it could not be subject to RIP. It looks plausible that EGFP protects the protein from intramembrane proteolysis, thus, rendering it resistant to RIP.
To elucidate further mechanisms by which truncated syndecan-1 suppressed syndecan-1 shedding, we examined transcriptional regulation of MMP7 and its connection to the MAPK signaling pathway, actively involved in the control of syndecan-1 shedding [71,76]. The promoter region of MMP7 contains AP-1 and PEA3 motifs, which serve as binding sites for complexes composed of members of the JUN, FOS, and ETS families of transcription factors [70,77,78]. We confirmed downregulation of the activity of promoters containing Ets-1 or AP-1 binding sites, as well as decreased Ets-1 protein expression, in cells overexpressing truncated syndecan-1. In fact, Ets-1 expression has also been known to be induced by AP-1 and Ets-1 itself [79,80], and thus this loop appeared to be downregulated in our system. Promoter-binding activity of Ets-1 has been shown to be controlled by several molecules including ERK1/2 [81] and p38 [82]. We could indeed confirm decreased amounts of phosphorylated p38 and phosphorylated ERK1/2 in cells transfected with truncated syndecan-1.
We have previously described that HS of liver origin interfered with DNA binding of Ets-1 and AP-1, indicating that it was also capable of competing with the transcription initiated by these transcription factors [83]. Transfection with truncated syndecan-1 and, to a lesser extent, with full-length syndecan-1, brought about a shift in HS epitope abundance from AO4B08-reactive epitopes, previously shown to be upregulated in HCC [10], in favor of liver-specific HS4C3-reactive epitopes. Furthermore, immunoreaction clearly localized this epitope in the nuclei of tumor cells, as well. Thus, we speculated that downregulation of ETS1 and AP1 activity, confirmed by reporter gene assay, could be at least in part, related to the inhibitory action of the HS4C3-reactive HS chains of syndecan-1 [84]. As wild-type Hep3B cells only express trace amounts of syndecan-1, HS detected in these cells could belong to proteoglycans other than syndecan-1. Although more detailed analysis of HS structure was beyond our technical capabilities, we believe, in line with recently published data [85,86], that the versatile function of syndecan-1 highly depends on the structure of its sugar chains, especially its HS epitopes. HS chains engage in selective interactions with growth factors and cytokines, endowing syndecans with a plethora of functions, greatly influenced by the amount and location of sulfation, many of which are yet to be discovered.
Another mechanism to inhibit ETS1 transcription is related to the downregulation of HGFR (c-Met). It has been published that exposure of hepatoma cell lines to HGF induced transcription of ETS1 and, subsequently, MMPs, whereas silencing of ETS1 downregulated production of MMPs [87]. Therefore, the reduction in Ets-1 levels observed in our system could ultimately be caused by the downregulation of the HGF/ERK/Ets-1 pathway [76]. This hypothesis is supported by our preliminary results using a phosphorylated receptor tyrosine kinase array that showed a marked reduction in HGFR activation in syndecan-1 transfected Hep3B cells. Interestingly, MET itself is transcriptionally upregulated by Ets-1 and, in turn, activation of c-Met induces transcription of ETS1 showing that Ets-1 can act both upstream and downstream of c-Met (Figure S2) [87,88].
Ets-1 has been shown to be involved in a variety of processes, such as cell differentiation, proliferation, tissue remodeling, angiogenesis, apoptosis, transformation, and metastasis [89]. In a previous study, we found a decrease in the expression of syndecan-1 and opposite trend for Ets-1 throughout colon carcinoma progression [90]. In HCC, increased transcriptional activity of MMP7 and ETS1 as compared with adjacent noncancerous liver tissue [78] statistically correlated with tumor progression of HCCs [91].
To confirm the implication of downregulated Ets-1 in the partial differentiation and suppressed proliferation of hepatoma cells overexpressing syndecan-1, we knocked down Ets-1 expression by miRNAs. The effect of miR inhibition was more pronounced in Hep3B cells, where reduced levels of Ets-1 partially replicated the effects of syndecan-1 overexpression (e.g., a trend towards differentiation), indicating the implication of Ets-1 in these events. However, since the effect of ETS1 silencing was only partial as compared with syndecan-1 overexpression, we speculated that there was a need for other factors, such as AP-1, that could also mediate the effect of overexpressed syndecan-1. AP-1 transcription factors are of particular importance in liver cancer. Conditional inactivation of c-Jun in the liver reduces the proliferative capacity of hepatocytes after partial hepatectomy [92] and interferes with the development of liver tumors [93]. HCCs are also characterized by a significantly higher c-Fos expression as compared with non-tumor tissues [94]. In agreement with literature data, we found decreased AP-1 promoter-binding activity upon overexpression of truncated syndecan-1.
A limitation to our in vitro model is the lack of stromal components, which could significantly influence the behavior of the tumor tissue. Ectopic expression of syndecan-1 in stromal cells has been reported in carcinomas of the cervix [95,96], and stromal syndecan-1 expression was shown to correlate with poor prognosis in some tumor types such as cancers of the stomach [97], pancreas [46], endometrium [98], oral cavity [99], breast [100,101], bladder [48], and ovary [102].
Future studies are needed to complement our results by determining additional effects of syndecan-1, either full-length or truncated, on the phenotype and behavior of hepatoma cells. Such research is not unprecedented; for instance, the importance of syndecan-1 in hepatoma cell migration and invasion has been demonstrated [58,103], and the role of certain miRNAs in the negative regulation of both syndecan-1 [104] and Ets-1 [105] expression has been described, albeit the root causes of these expressional changes during tumor progression remain to be elucidated in more detail (Figure 10).

5. Conclusions

While syndecan-1 is known to play a key role in the normal function of the liver, its participation in the development and progression of HCC is not clarified. To address this question, two HCC cell lines with decreased syndecan-1 expression were transfected with the full-length or truncated forms of syndecan-1. The latter can mimic the situation that occurs after ectodomain shedding. Overexpression of syndecan-1, especially in its truncated form, slowed down the proliferation and induced differentiation of HCC cells. The molecular mechanisms implicated in this effect included decreased MAPK signaling and a shift in the relative abundance of various HS epitopes. Both pathways converged on decreased nuclear availability of the Ets-1 transcription factor which is known to stimulate the transcription of MMP-7 and c-Met. However, miR inhibition of Ets-1 only partially replicated the effects of truncated syndecan-1. Because reporter assays in syndecan-1 transfectants revealed decreased promoter binding of AP-1 as well as Ets-1, Ets-1 silencing alone may not be sufficient to mimic all effects of syndecan-1 overexpression. Since the truncated form of syndecan-1 proved to be more effective, we speculate that post shedding stub of syndecan-1 may regulate cell differentiation and proliferation. Given the plethora of functions of syndecan-1 in the liver, additional beneficial effects of syndecan-1 re-expression in HCC can be expected.

Supplementary Materials

The following are available online at https://www.mdpi.com/2218-273X/10/10/1356/s1, Figure S1: Expression of c-Met in HepG2 and Hep3B cells, Figure S2: Zymography of HepG2 and Hep3B conditioned cell media, Figure S3: PMA treated HepG2 conditioned cell media, Table S1: qRT-PCR primer and oligo sequences, Table S2: Antibodies used.

Author Contributions

Conceptualization, P.H., L.V., K.D., L.S. and I.K.; Data curation, T.S. and I.K.; Funding acquisition, I.K.; Investigation, P.H., L.V., K.D., E.T. and I.K.; Methodology, P.H., K.D., B.P., S.P. and L.S.; Resources, I.K.; Software, B.P.; Supervision, P.T., T.S. and L.S.; Validation, K.K.; Visualization, P.H. and S.P.; Writing—original draft, P.H., K.K. and I.K.; Writing—review and editing, K.K. and P.T. All authors have read and agreed to the published version of the manuscript.

Funding

This research was funded by the Hungarian Scientific Research Fund (grants 67925, 100904, and 119283) and the European Union Horizon 2020 Marie Skłodowska-Curie Actions (MSCA) Research and Innovation Staff Exchange Evaluations (RISE) project (grant 645756), “GLYCANC—Matrix glycans as multifunctional pathogenesis factors and therapeutic targets in cancer”. The study and the APC were also funded by the NVKP_16-1-2016-0004 grant of the Hungarian National Research, Development and Innovation Office (NKFIH).

Acknowledgments

The authors would like to thank John R. Couchman (University of Copenhagen) for kindly providing the pIRES2-EGFP vector, Gábor Barna (Semmelweis University) and György Várady (Institute of Enzymology) for their help in fluorescence activated cell sorting, and Zsolt Nagy and Attila Patócs (Semmelweis University) for their assistance in luminometric measurements.

Conflicts of Interest

The author (L.S.) is founder of Szilak Laboratories Bioinformatics and Molecule-Design Ltd. This founder provided the syndecan-1 constructs taking part in the design of the study. The author (P.T.) is employed by Solvo Biotechnology. The funder (Solvo Biotechnology) provided support in the form of author’s salaries for the author (P.T.), but did not have any additional role in the design of the study; in the collection, analyses, or interpretation of data; in the writing of the manuscript, or in the decision to publish the results. The remaining authors declare no conflict of interest.

References

  1. Ferlay, J.; Soerjomataram, I.; Dikshit, R.; Eser, S.; Mathers, C.; Rebelo, M.; Parkin, D.M.; Forman, D.; Bray, F. Cancer incidence and mortality worldwide: Sources, methods and major patterns in GLOBOCAN 2012. Int. J. Cancer 2015, 136, E359–E386. [Google Scholar] [CrossRef] [PubMed]
  2. Theise, N.D.; Curado, M.P.; Franceschi, S.; Hytiroglou, P.; Kudo, M.; Park, Y.N.; Sakamoto, M.; Torbenson, M.; Wee, A. Tumours of the liver and intrahepatic bile ducts: Hepatocellular carcinoma. In World Health Organization Classification of Tumours of the Digestive System, 4th ed.; Bosman, F.T., Carneiro, F., Hruban, R.H., Theise, N.D., Eds.; IARC Press: Lyon, France, 2010; Volume 3, pp. 205–216. [Google Scholar]
  3. Laurent-Puig, P.; Zucman-Rossi, J. Genetics of hepatocellular tumors. Oncogene 2006, 25, 3778–3786. [Google Scholar] [CrossRef] [PubMed] [Green Version]
  4. Aravalli, R.N.; Steer, C.J.; Cressman, E.N. Molecular mechanisms of hepatocellular carcinoma. Hepatology 2008, 48, 2047–2063. [Google Scholar] [CrossRef] [PubMed]
  5. Rapraeger, A.; Jalkanen, M.; Endo, E.; Koda, J.; Bernfield, M. The cell surface proteoglycan from mouse mammary epithelial cells bears chondroitin sulfate and heparan sulfate glycosaminoglycans. J. Biol. Chem. 1985, 260, 11046–11052. [Google Scholar] [PubMed]
  6. Saunders, S.; Jalkanen, M.; O’Farrell, S.; Bernfield, M. Molecular cloning of syndecan, an integral membrane proteoglycan. J. Cell Biol. 1989, 108, 1547–1556. [Google Scholar] [CrossRef] [PubMed]
  7. Hayashi, K.; Hayashi, M.; Jalkanen, M.; Firestone, J.H.; Trelstad, R.L.; Bernfield, M. Immunocytochemistry of cell surface heparan sulfate proteoglycan in mouse tissues. A light and electron microscopic study. J. Histochem. Cytochem. 1987, 35, 1079–1088. [Google Scholar] [CrossRef] [PubMed] [Green Version]
  8. Roskams, T.; Moshage, H.; De Vos, R.; Guido, D.; Yap, P.; Desmet, V. Heparan sulfate proteoglycan expression in normal human liver. Hepatology 1995, 21, 950–958. [Google Scholar] [CrossRef]
  9. Roskams, T.; De Vos, R.; David, G.; Van Damme, B.; Desmet, V. Heparan sulphate proteoglycan expression in human primary liver tumours. J. Pathol. 1998, 185, 290–297. [Google Scholar] [CrossRef]
  10. Tátrai, P.; Egedi, K.; Somorácz, A.; van Kuppevelt, T.H.; Ten Dam, G.; Lyon, M.; Deakin, J.A.; Kiss, A.; Schaff, Z.; Kovalszky, I. Quantitative and qualitative alterations of heparan sulfate in fibrogenic liver diseases and hepatocellular cancer. J. Histochem. Cytochem. Off. J. Histochem. Soc. 2010, 58, 429–441. [Google Scholar] [CrossRef] [Green Version]
  11. Kambham, N.; Kong, C.; Longacre, T.A.; Natkunam, Y. Utility of syndecan-1 (CD138) expression in the diagnosis of undifferentiated malignant neoplasms: A tissue microarray study of 1754 cases. Appl. Immunohistochem. Mol. Morphol. AIMM 2005, 13, 304–310. [Google Scholar] [CrossRef]
  12. Ramalingam, P.; Adeagbo, B.; Bollag, R.; Lee, J.; Reid-Nicholson, M. Metastatic hepatocellular carcinoma with CD138 positivity: An unusual mimic of multiple myeloma? Diagn. Cytopathol. 2008, 36, 742–748. [Google Scholar] [CrossRef] [PubMed]
  13. Matsumoto, A.; Ono, M.; Fujimoto, Y.; Gallo, R.L.; Bernfield, M.; Kohgo, Y. Reduced expression of syndecan-1 in human hepatocellular carcinoma with high metastatic potential. Int. J. Cancer 1997, 74, 482–491. [Google Scholar] [CrossRef]
  14. Li, H.G.; Xie, D.R.; Shen, X.M.; Li, H.H.; Zeng, H.; Zeng, Y.J. Clinicopathological significance of expression of paxillin, syndecan-1 and EMMPRIN in hepatocellular carcinoma. World J. Gastroenterol. 2005, 11, 1445–1451. [Google Scholar] [CrossRef] [PubMed]
  15. Jalkanen, M.; Rapraeger, A.; Saunders, S.; Bernfield, M. Cell surface proteoglycan of mouse mammary epithelial cells is shed by cleavage of its matrix-binding ectodomain from its membrane-associated domain. J. Cell Biol. 1987, 105, 3087–3096. [Google Scholar] [CrossRef] [Green Version]
  16. Kim, C.W.; Goldberger, O.A.; Gallo, R.L.; Bernfield, M. Members of the syndecan family of heparan sulfate proteoglycans are expressed in distinct cell-, tissue-, and development-specific patterns. Mol. Biol. Cell 1994, 5, 797–805. [Google Scholar] [CrossRef] [Green Version]
  17. Metwaly, H.A.; Al-Gayyar, M.M.; Eletreby, S.; Ebrahim, M.A.; El-Shishtawy, M.M. Relevance of serum levels of interleukin-6 and syndecan-1 in patients with hepatocellular carcinoma. Sci. Pharm. 2012, 80, 179–188. [Google Scholar] [CrossRef] [Green Version]
  18. Nault, J.C.; Guyot, E.; Laguillier, C.; Chevret, S.; Ganne-Carrie, N.; N’Kontchou, G.; Beaugrand, M.; Seror, O.; Trinchet, J.C.; Coelho, J.; et al. Serum proteoglycans as prognostic biomarkers of hepatocellular carcinoma in patients with alcoholic cirrhosis. Cancer Epidemiol. Biomark. Prev. 2013, 22, 1343–1352. [Google Scholar] [CrossRef] [Green Version]
  19. Zong, F.; Fthenou, E.; Wolmer, N.; Hollósi, P.; Kovalszky, I.; Szilák, L.; Mogler, C.; Nilsonne, G.; Tzanakakis, G.; Dobra, K. Syndecan-1 and FGF-2, but not FGF receptor-1, share a common transport route and co-localize with heparanase in the nuclei of mesenchymal tumor cells. PLoS ONE 2009, 4, e7346. [Google Scholar] [CrossRef] [Green Version]
  20. Zong, F.; Fthenou, E.; Castro, J.; Péterfia, B.; Kovalszky, I.; Szilák, L.; Tzanakakis, G.; Dobra, K. Effect of syndecan-1 overexpression on mesenchymal tumour cell proliferation with focus on different functional domains. Cell Prolif. 2010, 43, 29–40. [Google Scholar] [CrossRef]
  21. Zong, F.; Fthenou, E.; Mundt, F.; Szatmári, T.; Kovalszky, I.; Szilák, L.; Brodin, D.; Tzanakakis, G.; Hjerpe, A.; Dobra, K. Specific syndecan-1 domains regulate mesenchymal tumor cell adhesion, motility and migration. PLoS ONE 2011, 6, e14816. [Google Scholar] [CrossRef]
  22. Péterfia, B.; Füle, T.; Baghy, K.; Szabadkai, K.; Fullár, A.; Dobos, K.; Zong, F.; Dobra, K.; Hollósi, P.; Jeney, A.; et al. Syndecan-1 enhances proliferation, migration and metastasis of HT-1080 cells in cooperation with syndecan-2. PLoS ONE 2012, 7, e39474. [Google Scholar] [CrossRef] [PubMed] [Green Version]
  23. Szatmári, T.; Mundt, F.; Heidari-Hamedani, G.; Zong, F.; Ferolla, E.; Alexeyenko, A.; Hjerpe, A.; Dobra, K. Novel genes and pathways modulated by syndecan-1: Implications for the proliferation and cell-cycle regulation of malignant mesothelioma cells. PLoS ONE 2012, 7, e48091. [Google Scholar] [CrossRef] [PubMed] [Green Version]
  24. Szatmári, T.; Dobra, K. The role of syndecan-1 in cellular signaling and its effects on heparan sulfate biosynthesis in mesenchymal tumors. Front. Oncol. 2013, 3, 310. [Google Scholar] [CrossRef] [Green Version]
  25. Aden, D.P.; Fogel, A.; Plotkin, S.; Damjanov, I.; Knowles, B.B. Controlled synthesis of HBsAg in a differentiated human liver carcinoma-derived cell line. Nature 1979, 282, 615–616. [Google Scholar] [CrossRef] [PubMed]
  26. Knowles, B.B.; Howe, C.C.; Aden, D.P. Human hepatocellular carcinoma cell lines secrete the major plasma proteins and hepatitis B surface antigen. Science 1980, 209, 497–499. [Google Scholar] [CrossRef]
  27. Fisher, R.J.; Mavrothalassitis, G.; Kondoh, A.; Papas, T.S. High-affinity DNA-protein interactions of the cellular ETS1 protein: The determination of the ETS binding motif. Oncogene 1991, 6, 2249–2254. [Google Scholar]
  28. Nye, J.A.; Petersen, J.M.; Gunther, C.V.; Jonsen, M.D.; Graves, B.J. Interaction of murine ets-1 with GGA-binding sites establishes the ETS domain as a new DNA-binding motif. Genes Dev. 1992, 6, 975–990. [Google Scholar] [CrossRef] [PubMed] [Green Version]
  29. Woods, D.B.; Ghysdael, J.; Owen, M.J. Identification of nucleotide preferences in DNA sequences recognised specifically by c-Ets-1 protein. Nucleic Acids Res. 1992, 20, 699–704. [Google Scholar] [CrossRef] [PubMed] [Green Version]
  30. Skehan, P.; Storeng, R.; Scudiero, D.; Monks, A.; McMahon, J.; Vistica, D.; Warren, J.T.; Bokesch, H.; Kenney, S.; Boyd, M.R. New colorimetric cytotoxicity assay for anticancer-drug screening. J. Natl. Cancer Inst. 1990, 82, 1107–1112. [Google Scholar] [CrossRef] [PubMed]
  31. Van Kuppevelt, T.H.; Dennissen, M.A.; van Venrooij, W.J.; Hoet, R.M.; Veerkamp, J.H. Generation and application of type-specific anti-heparan sulfate antibodies using phage display technology. Further evidence for heparan sulfate heterogeneity in the kidney. J. Biol. Chem. 1998, 273, 12960–12966. [Google Scholar] [CrossRef] [Green Version]
  32. Ten Dam, G.B.; Kurup, S.; van de Westerlo, E.M.; Versteeg, E.M.; Lindahl, U.; Spillmann, D.; van Kuppevelt, T.H. 3-O-sulfated oligosaccharide structures are recognized by anti-heparan sulfate antibody HS4C3. J. Biol. Chem. 2006, 281, 4654–4662. [Google Scholar] [CrossRef] [PubMed] [Green Version]
  33. Kurup, S.; Wijnhoven, T.J.; Jenniskens, G.J.; Kimata, K.; Habuchi, H.; Li, J.P.; Lindahl, U.; van Kuppevelt, T.H.; Spillmann, D. Characterization of anti-heparan sulfate phage display antibodies AO4B08 and HS4E4. J. Biol. Chem. 2007, 282, 21032–21042. [Google Scholar] [CrossRef] [PubMed] [Green Version]
  34. Li, Q.; Park, P.W.; Wilson, C.L.; Parks, W.C. Matrilysin shedding of syndecan-1 regulates chemokine mobilization and transepithelial efflux of neutrophils in acute lung injury. Cell 2002, 111, 635–646. [Google Scholar] [CrossRef] [Green Version]
  35. Ding, K.; Lopez-Burks, M.; Sánchez-Duran, J.A.; Korc, M.; Lander, A.D. Growth factor-induced shedding of syndecan-1 confers glypican-1 dependence on mitogenic responses of cancer cells. J. Cell Biol. 2005, 171, 729–738. [Google Scholar] [CrossRef] [Green Version]
  36. Leppä, S.; Mali, M.; Miettinen, H.M.; Jalkanen, M. Syndecan expression regulates cell morphology and growth of mouse mammary epithelial tumor cells. Proc. Natl. Acad. Sci. USA 1992, 89, 932–936. [Google Scholar] [CrossRef] [PubMed] [Green Version]
  37. Jalkanen, M.; Elenius, K.; Inki, P.; Kirjavainen, J.; Leppä, S. Syndecan, a regulator of cell behaviour, is lost in malignant transformation. Biochem. Soc. Trans. 1991, 19, 1069–1072. [Google Scholar] [CrossRef]
  38. Inki, P.; Joensuu, H.; Grénman, R.; Klemi, P.; Jalkanen, M. Association between syndecan-1 expression and clinical outcome in squamous cell carcinoma of the head and neck. Br. J. Cancer 1994, 70, 319–323. [Google Scholar] [CrossRef]
  39. Anttonen, A.; Kajanti, M.; Heikkilä, P.; Jalkanen, M.; Joensuu, H. Syndecan-1 expression has prognostic significance in head and neck carcinoma. Br. J. Cancer 1999, 79, 558–564. [Google Scholar] [CrossRef] [Green Version]
  40. Kurokawa, H.; Zhang, M.; Matsumoto, S.; Yamashita, Y.; Tanaka, T.; Takamori, K.; Igawa, K.; Yoshida, M.; Fukuyama, H.; Takahashi, T.; et al. Reduced syndecan-1 expression is correlated with the histological grade of malignancy at the deep invasive front in oral squamous cell carcinoma. J. Oral Pathol. Med. 2006, 35, 301–306. [Google Scholar] [CrossRef]
  41. Binder Gallimidi, A.; Nussbaum, G.; Hermano, E.; Weizman, B.; Meirovitz, A.; Vlodavsky, I.; Götte, M.; Elkin, M. Syndecan-1 deficiency promotes tumor growth in a murine model of colitis-induced colon carcinoma. PLoS ONE 2017, 12, e0174343. [Google Scholar] [CrossRef]
  42. Day, R.M.; Hao, X.; Ilyas, M.; Daszak, P.; Talbot, I.C.; Forbes, A. Changes in the expression of syndecan-1 in the colorectal adenoma-carcinoma sequence. Virchows Arch. Int. J. Pathol. 1999, 434, 121–125. [Google Scholar] [CrossRef]
  43. Fujiya, M.; Watari, J.; Ashida, T.; Honda, M.; Tanabe, H.; Fujiki, T.; Saitoh, Y.; Kohgo, Y. Reduced expression of syndecan-1 affects metastatic potential and clinical outcome in patients with colorectal cancer. Jpn. J. Cancer Res. 2001, 92, 1074–1081. [Google Scholar] [CrossRef] [PubMed]
  44. Lundin, M.; Nordling, S.; Lundin, J.; Isola, J.; Wiksten, J.P.; Haglund, C. Epithelial syndecan-1 expression is associated with stage and grade in colorectal cancer. Oncology 2005, 68, 306–313. [Google Scholar] [CrossRef] [PubMed]
  45. Shinyo, Y.; Kodama, J.; Hasengaowa; Kusumoto, T.; Hiramatsu, Y. Loss of cell-surface heparan sulfate expression in both cervical intraepithelial neoplasm and invasive cervical cancer. Gynecol. Oncol. 2005, 96, 776–783. [Google Scholar] [CrossRef] [PubMed]
  46. Juuti, A.; Nordling, S.; Lundin, J.; Louhimo, J.; Haglund, C. Syndecan-1 expression—A novel prognostic marker in pancreatic cancer. Oncology 2005, 68, 97–106. [Google Scholar] [CrossRef]
  47. Gökden, N.; Greene, G.F.; Bayer-Garner, I.B.; Spencer, H.J.; Sanderson, R.D.; Gökden, M. Expression of CD138 (Syndecan-1) in renal cell carcinoma is reduced with increasing nuclear grade. Appl. Immunohistochem. Mol. Morphol. 2006, 14, 173–177. [Google Scholar] [CrossRef]
  48. Szarvas, T.; Reis, H.; Kramer, G.; Shariat, S.F.; Vom Dorp, F.; Tschirdewahn, S.; Schmid, K.W.; Kovalszky, I.; Rübben, H. Enhanced stromal syndecan-1 expression is an independent risk factor for poor survival in bladder cancer. Hum. Pathol. 2014, 45, 674–682. [Google Scholar] [CrossRef]
  49. Ito, Y.; Yoshida, H.; Nakano, K.; Takamura, Y.; Miya, A.; Kobayashi, K.; Yokozawa, T.; Matsuzuka, F.; Matsuura, N.; Kuma, K.; et al. Syndecan-1 expression in thyroid carcinoma: Stromal expression followed by epithelial expression is significantly correlated with dedifferentiation. Histopathology 2003, 43, 157–164. [Google Scholar] [CrossRef]
  50. Zellweger, T.; Ninck, C.; Mirlacher, M.; Annefeld, M.; Glass, A.G.; Gasser, T.C.; Mihatsch, M.J.; Gelmann, E.P.; Bubendorf, L. Tissue microarray analysis reveals prognostic significance of syndecan-1 expression in prostate cancer. Prostate 2003, 55, 20–29. [Google Scholar] [CrossRef]
  51. Szarvas, T.; Reis, H.; Vom Dorp, F.; Tschirdewahn, S.; Niedworok, C.; Nyirady, P.; Schmid, K.W.; Rübben, H.; Kovalszky, I. Soluble syndecan-1 (SDC1) serum level as an independent pre-operative predictor of cancer-specific survival in prostate cancer. Prostate 2016, 76, 977–985. [Google Scholar] [CrossRef]
  52. Barbareschi, M.; Maisonneuve, P.; Aldovini, D.; Cangi, M.G.; Pecciarini, L.; Angelo Mauri, F.; Veronese, S.; Caffo, O.; Lucenti, A.; Palma, P.D.; et al. High syndecan-1 expression in breast carcinoma is related to an aggressive phenotype and to poorer prognosis. Cancer 2003, 98, 474–483. [Google Scholar] [CrossRef] [PubMed]
  53. Lendorf, M.E.; Manon-Jensen, T.; Kronqvist, P.; Multhaupt, H.A.; Couchman, J.R. Syndecan-1 and syndecan-4 are independent indicators in breast carcinoma. J. Histochem. Cytochem. Off. J. Histochem. Soc. 2011, 59, 615–629. [Google Scholar] [CrossRef] [PubMed] [Green Version]
  54. Davies, E.J.; Blackhall, F.H.; Shanks, J.H.; David, G.; McGown, A.T.; Swindell, R.; Slade, R.J.; Martin-Hirsch, P.; Gallagher, J.T.; Jayson, G.C. Distribution and clinical significance of heparan sulfate proteoglycans in ovarian cancer. Clin. Cancer Res. 2004, 10, 5178–5186. [Google Scholar] [CrossRef] [PubMed] [Green Version]
  55. Yoneda, A.; Lendorf, M.E.; Couchman, J.R.; Multhaupt, H.A. Breast and ovarian cancers: A survey and possible roles for the cell surface heparan sulfate proteoglycans. J. Histochem. Cytochem. 2012, 60, 9–21. [Google Scholar] [CrossRef] [Green Version]
  56. Regős, E.; Abdelfattah, H.H.; Reszegi, A.; Szilák, L.; Werling, K.; Szabó, G.; Kiss, A.; Schaff, Z.; Kovalszky, I.; Baghy, K. Syndecan-1 inhibits early stages of liver fibrogenesis by interfering with TGFβ1 action and upregulating MMP14. Matrix Biol. 2018, 68, 474–489. [Google Scholar] [CrossRef]
  57. Regős, E.; Karászi, K.; Reszegi, A.; Kiss, A.; Schaff, Z.; Baghy, K.; Kovalszky, I. Syndecan-1 in Liver Diseases. Pathol. Oncol. Res. POR 2020, 26, 813–819. [Google Scholar] [CrossRef]
  58. Charni, F.; Friand, V.; Haddad, O.; Hlawaty, H.; Martin, L.; Vassy, R.; Oudar, O.; Gattegno, L.; Charnaux, N.; Sutton, A. Syndecan-1 and syndecan-4 are involved in RANTES/CCL5-induced migration and invasion of human hepatoma cells. Biochim. Biophys. Acta 2009, 1790, 1314–1326. [Google Scholar] [CrossRef]
  59. Gondelaud, F.; Ricard-Blum, S. Structures and interactions of syndecans. FEBS J. 2019, 286, 2994–3007. [Google Scholar] [CrossRef] [Green Version]
  60. Dews, I.C.; Mackenzie, K.R. Transmembrane domains of the syndecan family of growth factor coreceptors display a hierarchy of homotypic and heterotypic interactions. Proc. Natl. Acad. Sci. USA 2007, 104, 20782–20787. [Google Scholar] [CrossRef] [Green Version]
  61. Kowalczyk, A.P.; Green, K.J. Structure, function, and regulation of desmosomes. Prog. Mol. Biol. Transl. Sci. 2013, 116, 95–118. [Google Scholar] [CrossRef] [Green Version]
  62. Chidgey, M.; Dawson, C. Desmosomes: A role in cancer? Br. J. Cancer 2007, 96, 1783–1787. [Google Scholar] [CrossRef] [PubMed]
  63. Cao, Y.; Chang, H.; Li, L.; Cheng, R.C.; Fan, X.N. Alteration of adhesion molecule expression and cellular polarity in hepatocellular carcinoma. Histopathology 2007, 51, 528–538. [Google Scholar] [CrossRef] [PubMed]
  64. Kumar-Singh, A.; Shrinet, J.; Parniewska, M.M.; Fuxe, J.; Dobra, K.; Hjerpe, A. Mapping the Interactome of the Nuclear Heparan Sulfate Proteoglycan Syndecan-1 in Mesothelioma Cells. Biomolecules 2020, 10, 1034. [Google Scholar] [CrossRef]
  65. Elenius, V.; Götte, M.; Reizes, O.; Elenius, K.; Bernfield, M. Inhibition by the soluble syndecan-1 ectodomains delays wound repair in mice overexpressing syndecan-1. J. Biol. Chem. 2004, 279, 41928–41935. [Google Scholar] [CrossRef] [PubMed] [Green Version]
  66. Manon-Jensen, T.; Multhaupt, H.A.; Couchman, J.R. Mapping of matrix metalloproteinase cleavage sites on syndecan-1 and syndecan-4 ectodomains. FEBS J. 2013, 280, 2320–2331. [Google Scholar] [CrossRef]
  67. Brule, S.; Charnaux, N.; Sutton, A.; Ledoux, D.; Chaigneau, T.; Saffar, L.; Gattegno, L. The shedding of syndecan-4 and syndecan-1 from HeLa cells and human primary macrophages is accelerated by SDF-1/CXCL12 and mediated by the matrix metalloproteinase-9. Glycobiology 2006, 16, 488–501. [Google Scholar] [CrossRef] [Green Version]
  68. Endo, K.; Takino, T.; Miyamori, H.; Kinsen, H.; Yoshizaki, T.; Furukawa, M.; Sato, H. Cleavage of syndecan-1 by membrane type matrix metalloproteinase-1 stimulates cell migration. J. Biol. Chem. 2003, 278, 40764–40770. [Google Scholar] [CrossRef] [Green Version]
  69. Pruessmeyer, J.; Martin, C.; Hess, F.M.; Schwarz, N.; Schmidt, S.; Kogel, T.; Hoettecke, N.; Schmidt, B.; Sechi, A.; Uhlig, S.; et al. A disintegrin and metalloproteinase 17 (ADAM17) mediates inflammation-induced shedding of syndecan-1 and -4 by lung epithelial cells. J. Biol. Chem. 2010, 285, 555–564. [Google Scholar] [CrossRef] [Green Version]
  70. Gaire, M.; Magbanua, Z.; McDonnell, S.; McNeil, L.; Lovett, D.H.; Matrisian, L.M. Structure and expression of the human gene for the matrix metalloproteinase matrilysin. J. Biol. Chem. 1994, 269, 2032–2040. [Google Scholar]
  71. Fitzgerald, M.L.; Wang, Z.; Park, P.W.; Murphy, G.; Bernfield, M. Shedding of syndecan-1 and -4 ectodomains is regulated by multiple signaling pathways and mediated by a TIMP-3-sensitive metalloproteinase. J. Cell Biol. 2000, 148, 811–824. [Google Scholar] [CrossRef]
  72. Wolfe, M.S. Intramembrane-cleaving proteases. J. Biol. Chem. 2009, 284, 13969–13973. [Google Scholar] [CrossRef] [PubMed] [Green Version]
  73. Pasqualon, T.; Pruessmeyer, J.; Jankowski, V.; Babendreyer, A.; Groth, E.; Schumacher, J.; Koenen, A.; Weidenfeld, S.; Schwarz, N.; Denecke, B.; et al. A cytoplasmic C-terminal fragment of Syndecan-1 is generated by sequential proteolysis and antagonizes Syndecan-1 dependent lung tumor cell migration. Oncotarget 2015, 6, 31295–31312. [Google Scholar] [CrossRef] [PubMed]
  74. Pasqualon, T.; Pruessmeyer, J.; Weidenfeld, S.; Babendreyer, A.; Groth, E.; Schumacher, J.; Schwarz, N.; Denecke, B.; Jahr, H.; Zimmermann, P.; et al. A transmembrane C-terminal fragment of syndecan-1 is generated by the metalloproteinase ADAM17 and promotes lung epithelial tumor cell migration and lung metastasis formation. Cell. Mol. Life Sci. 2015, 72, 3783–3801. [Google Scholar] [CrossRef] [PubMed]
  75. Brown, M.S.; Ye, J.; Rawson, R.B.; Goldstein, J.L. Regulated intramembrane proteolysis: A control mechanism conserved from bacteria to humans. Cell 2000, 100, 391–398. [Google Scholar] [CrossRef] [Green Version]
  76. Paumelle, R.; Tulasne, D.; Kherrouche, Z.; Plaza, S.; Leroy, C.; Reveneau, S.; Vandenbunder, B.; Fafeur, V. Hepatocyte growth factor/scatter factor activates the ETS1 transcription factor by a RAS-RAF-MEK-ERK signaling pathway. Oncogene 2002, 21, 2309–2319. [Google Scholar] [CrossRef] [Green Version]
  77. Gutman, A.; Wasylyk, B. The collagenase gene promoter contains a TPA and oncogene-responsive unit encompassing the PEA3 and AP-1 binding sites. EMBO J. 1990, 9, 2241–2246. [Google Scholar] [CrossRef]
  78. Ozaki, I.; Mizuta, T.; Zhao, G.; Yotsumoto, H.; Hara, T.; Kajihara, S.; Hisatomi, A.; Sakai, T.; Yamamoto, K. Involvement of the Ets-1 gene in overexpression of matrilysin in human hepatocellular carcinoma. Cancer Res. 2000, 60, 6519–6525. [Google Scholar]
  79. Seth, A.; Papas, T.S. The c-ets-1 proto-oncogene has oncogenic activity and is positively autoregulated. Oncogene 1990, 5, 1761–1767. [Google Scholar]
  80. Majérus, M.A.; Bibollet-Ruche, F.; Telliez, J.B.; Wasylyk, B.; Bailleul, B. Serum, AP-1 and Ets-1 stimulate the human ets-1 promoter. Nucleic Acids Res. 1992, 20, 2699–2703. [Google Scholar] [CrossRef] [Green Version]
  81. Bu, S.; Yamanaka, M.; Pei, H.; Bielawska, A.; Bielawski, J.; Hannun, Y.A.; Obeid, L.; Trojanowska, M. Dihydrosphingosine 1-phosphate stimulates MMP1 gene expression via activation of ERK1/2-Ets1 pathway in human fibroblasts. FASEB J. 2006, 20, 184–186. [Google Scholar] [CrossRef]
  82. Tanaka, K.; Oda, N.; Iwasaka, C.; Abe, M.; Sato, Y. Induction of Ets-1 in endothelial cells during reendothelialization after denuding injury. J. Cell. Physiol. 1998, 176, 235–244. [Google Scholar] [CrossRef]
  83. Dudás, J.; Ramadori, G.; Knittel, T.; Neubauer, K.; Raddatz, D.; Egedy, K.; Kovalszky, I. Effect of heparin and liver heparan sulphate on interaction of HepG2-derived transcription factors and their cis-acting elements: Altered potential of hepatocellular carcinoma heparan sulphate. Biochem. J. 2000, 350 Pt 1, 245–251. [Google Scholar] [CrossRef]
  84. Hirano, K.; Sasaki, N.; Ichimiya, T.; Miura, T.; Van Kuppevelt, T.H.; Nishihara, S. 3-O-sulfated heparan sulfate recognized by the antibody HS4C3 contributes to the differentiation of mouse embryonic stem cells via fas signaling. PLoS ONE 2012, 7, e43440. [Google Scholar] [CrossRef]
  85. Gulberti, S.; Mao, X.; Bui, C.; Fournel-Gigleux, S. The role of heparan sulfate maturation in cancer: A focus on the 3O-sulfation and the enigmatic 3O-sulfotransferases (HS3STs). Semin. Cancer Biol. 2020, 62, 68–85. [Google Scholar] [CrossRef]
  86. Heidari-Hamedani, G.; Vivès, R.R.; Seffouh, A.; Afratis, N.A.; Oosterhof, A.; van Kuppevelt, T.H.; Karamanos, N.K.; Metintas, M.; Hjerpe, A.; Dobra, K.; et al. Syndecan-1 alters heparan sulfate composition and signaling pathways in malignant mesothelioma. Cell. Signal. 2015, 27, 2054–2067. [Google Scholar] [CrossRef] [PubMed]
  87. Jiang, Y.; Xu, W.; Lu, J.; He, F.; Yang, X. Invasiveness of hepatocellular carcinoma cell lines: Contribution of hepatocyte growth factor, c-met, and transcription factor Ets-1. Biochem. Biophys. Res. Commun. 2001, 286, 1123–1130. [Google Scholar] [CrossRef] [PubMed]
  88. Gambarotta, G.; Boccaccio, C.; Giordano, S.; Andŏ, M.; Stella, M.C.; Comoglio, P.M. Ets up-regulates MET transcription. Oncogene 1996, 13, 1911–1917. [Google Scholar] [PubMed]
  89. Sementchenko, V.I.; Watson, D.K. Ets target genes: Past, present and future. Oncogene 2000, 19, 6533–6548. [Google Scholar] [CrossRef] [PubMed] [Green Version]
  90. Pap, Z.; Pávai, Z.; Dénes, L.; Kovalszky, I.; Jung, J. An immunohistochemical study of colon adenomas and carcinomas: E-cadherin, Syndecan-1, Ets-1. Pathol. Oncol. Res. 2009, 15, 579–587. [Google Scholar] [CrossRef]
  91. Ishii, Y.; Nakasato, Y.; Kobayashi, S.; Yamazaki, Y.; Aoki, T. A study on angiogenesis-related matrix metalloproteinase networks in primary hepatocellular carcinoma. J. Exp. Clin. Cancer Res. 2003, 22, 461–470. [Google Scholar]
  92. Behrens, A.; Sibilia, M.; David, J.P.; Möhle-Steinlein, U.; Tronche, F.; Schütz, G.; Wagner, E.F. Impaired postnatal hepatocyte proliferation and liver regeneration in mice lacking c-jun in the liver. EMBO J. 2002, 21, 1782–1790. [Google Scholar] [CrossRef] [Green Version]
  93. Eferl, R.; Ricci, R.; Kenner, L.; Zenz, R.; David, J.P.; Rath, M.; Wagner, E.F. Liver tumor development. c-Jun antagonizes the proapoptotic activity of p53. Cell 2003, 112, 181–192. [Google Scholar] [CrossRef] [Green Version]
  94. Yuen, M.F.; Wu, P.C.; Lai, V.C.; Lau, J.Y.; Lai, C.L. Expression of c-Myc, c-Fos, and c-jun in hepatocellular carcinoma. Cancer 2001, 91, 106–112. [Google Scholar] [CrossRef]
  95. Fullár, A.; Dudás, J.; Oláh, L.; Hollósi, P.; Papp, Z.; Sobel, G.; Karászi, K.; Paku, S.; Baghy, K.; Kovalszky, I. Remodeling of extracellular matrix by normal and tumor-associated fibroblasts promotes cervical cancer progression. BMC Cancer 2015, 15, 256. [Google Scholar] [CrossRef] [PubMed] [Green Version]
  96. Karászi, K.; Vigh, R.; Máthé, M.; Fullár, A.; Oláh, L.; Füle, T.; Papp, Z.; Kovalszky, I. Aberrant Expression of Syndecan-1 in Cervical Cancers. Pathol. Oncol. Res. 2020, 20, 22–24. [Google Scholar] [CrossRef] [PubMed]
  97. Wiksten, J.P.; Lundin, J.; Nordling, S.; Lundin, M.; Kokkola, A.; von Boguslawski, K.; Haglund, C. Epithelial and stromal syndecan-1 expression as predictor of outcome in patients with gastric cancer. Int. J. Cancer 2001, 95, 1–6. [Google Scholar] [CrossRef]
  98. Hasengaowa; Kodama, J.; Kusumoto, T.; Shinyo, Y.; Seki, N.; Hiramatsu, Y. Prognostic significance of syndecan-1 expression in human endometrial cancer. Ann. Oncol. 2005, 16, 1109–1115. [Google Scholar] [CrossRef]
  99. Máthé, M.; Suba, Z.; Németh, Z.; Tátrai, P.; Füle, T.; Borgulya, G.; Barabás, J.; Kovalszky, I. Stromal syndecan-1 expression is an adverse prognostic factor in oral carcinomas. Oral Oncol. 2006, 42, 493–500. [Google Scholar] [CrossRef]
  100. Götte, M.; Kersting, C.; Ruggiero, M.; Tio, J.; Tulusan, A.H.; Kiesel, L.; Wülfing, P. Predictive value of syndecan-1 expression for the response to neoadjuvant chemotherapy of primary breast cancer. Anticancer Res. 2006, 26, 621–627. [Google Scholar]
  101. Nguyen, T.L.; Grizzle, W.E.; Zhang, K.; Hameed, O.; Siegal, G.P.; Wei, S. Syndecan-1 overexpression is associated with nonluminal subtypes and poor prognosis in advanced breast cancer. Am. J. Clin. Pathol. 2013, 140, 468–474. [Google Scholar] [CrossRef] [Green Version]
  102. Kusumoto, T.; Kodama, J.; Seki, N.; Nakamura, K.; Hongo, A.; Hiramatsu, Y. Clinical significance of syndecan-1 and versican expression in human epithelial ovarian cancer. Oncol. Rep. 2010, 23, 917–925. [Google Scholar] [CrossRef] [PubMed] [Green Version]
  103. Dagouassat, M.; Suffee, N.; Hlawaty, H.; Haddad, O.; Charni, F.; Laguillier, C.; Vassy, R.; Martin, L.; Schischmanoff, P.O.; Gattegno, L.; et al. Monocyte chemoattractant protein-1 (MCP-1)/CCL2 secreted by hepatic myofibroblasts promotes migration and invasion of human hepatoma cells. Int. J. Cancer 2010, 126, 1095–1108. [Google Scholar] [CrossRef] [PubMed]
  104. Gharbaran, R. Advances in the molecular functions of syndecan-1 (SDC1/CD138) in the pathogenesis of malignancies. Crit. Rev. Oncol. Hematol. 2015, 94, 1–17. [Google Scholar] [CrossRef] [PubMed]
  105. Wei, W.; Hu, Z.; Fu, H.; Tie, Y.; Zhang, H.; Wu, Y.; Zheng, X. MicroRNA-1 and microRNA-499 downregulate the expression of the ets1 proto-oncogene in HepG2 cells. Oncol. Rep. 2012, 28, 701–706. [Google Scholar] [CrossRef] [Green Version]
Figure 1. Immunofluorescence images of HepG2 and Hep3B cells after transfection with empty enhanced green fluorescent protein (EGFP) vector, as well as full-length and truncated syndecan-1 EGFP constructs. A diffuse green signal was seen after transfection with the empty vector. Upon transfection with the full-length syndecan-1 construct, the fluorescent signal localized to the cell membrane. Although truncated syndecan-1 partly localized to the cytoplasm, the signal was enriched at the plasma membrane, indicating that truncated syndecan-1, lacking the extracellular domain, was sorted successfully. Representative images are at 1000× magnification (scale bar 15 μm).
Biomolecules 10 01356 g001
Figure 2. Hepatocyte-like differentiation of HepG2 and Hep3B cells upon overexpression of full-length or truncated syndecan-1. (A) H&E stained empty vector transfected control cells were oval or spindle shape with prominent nuclei and high nucleus-to-cytoplasm ratio, and featured frequent cell divisions. In the syndecan-1-transfected cell lines, the numbers of poorly differentiated and dividing cells decreased, and groups of cells with a more hepatocyte-like morphology appeared. Cells showing signs of differentiation were characterized by a lower nucleus-to-cytoplasm ratio; (B) As a sign of cell differentiation, desmoplakin immunocytochemistry showed relocalization of the protein to the cell surface in syndecan-1-transfected cells. In the native hepatoma cell lines, desmoplakin mainly localized to the cytoplasm. Red, desmoplakin and blue, nuclei; (C) Numerous albumin-positive cells were detected among the truncated syndecan-1 transfectants. Green, albumin and red, nuclei. Representative images are at 1000× magnification (scale bar 15 μm), 600× magnification (scale bar 30 μm), and 200× magnification (scale bar 100 μm).
Biomolecules 10 01356 g002aBiomolecules 10 01356 g002b
Figure 3. Syndecan-1 mRNA and protein levels in the empty vector and syndecan-1 transfected HepG2 and Hep3B cell lines. (A) Transcripts coding for the extracellular domain (ED) and the cytoplasmic domain (CD) of syndecan-1 were elevated in the full-length transfectants, while the expression of the CD only was increased in the truncated transfectants, whereas that of the ectodomain-coding transcript remained unchanged; (B) High amounts of full-length (ectodomain-containing) syndecan-1 protein were detected on the surface of both full-length and truncated syndecan-1 transfectants by immunofluorescence using an ectodomain-specific antibody; (C) ELISA confirmed elevation of full-length syndecan-1 in both transfectants; (D) A comparison with the empty vector-transfected cells, shows that the abundance of AO4B08-reactive (internal 2-O-sulfated/6-O-sulfated) HS epitopes are decreased, whereas the amount of HS4C3-reactive (highly sulfated, 3-O-sulfated) epitopes are increased in both Hep3B cell lines containing syndecan-1 constructs. Data points represent the mean ± standard deviation (SD), n = 3; * p < 0.05; ** p < 0.01; *** p < 0.001 versus the empty vector control. Representative images are at 600× magnification (scale bar 30 μm) and 400× magnification (scale bar 50 μm).
Biomolecules 10 01356 g003
Figure 4. Shedding of syndecan-1 ectodomain. The amount of shed (soluble) syndecan-1 ectodomain was measured from cell culture media (CCM) by ectodomain-specific antibody. Shedding of the ectodomain was increased in full-length transfectants, whereas it remained unchanged in truncated transfectants in spite of the overall increased abundance of endogenous syndecan-1 (see Figure 3B). Data points represent the mean ± SD, n = 2; * p < 0.05; *** p < 0.001 versus the empty vector transfectant; # p < 0.05; ## p < 0.01 versus the full-length sdc-1 transfectant.
Biomolecules 10 01356 g004
Figure 5. The effect of syndecan-1 overexpression on the proliferation of HepG2 and Hep3B cell lines. (A) Transfection with the truncated syndecan-1 construct significantly slowed down the proliferation of both HepG2 and Hep3B cell lines. A moderate decrease in the proliferation of HepG2 full-length transfectant was also observed. Notably, overexpression of full-length syndecan-1 in Hep3B cells led to a decrease in double time from 33.89 to 25.27 h (by 25.4%); (B) The log phase of growth curves; (C) Doubling time calculated from the log phase of growth curves. Data points represent the mean ± SD, n = 8; *** p < 0.001 versus the empty vector transfectant.
Biomolecules 10 01356 g005
Figure 6. The effect of syndecan-1 constructs on MMP-7 expression. (A) Except for HepG2 transfected with full-length syndecan-1, all other syndecan-1 transfectants displayed decreased MMP7 mRNA expression and (B) protein levels as compared with the empty vector transfected cells. Red, MMP-7 and blue, nuclei. Data points represent the mean ± SD, n = 3; * p < 0.05 versus the empty vector transfectant. Representative images are at 1000× magnification (scale bar 15 μm) and 600× magnification (scale bar 30 μm).
Biomolecules 10 01356 g006
Figure 7. Decreased activity of Ets-1 and AP-1 upon syndecan-1 overexpression. (A) Intensive nuclear Ets-1 immunopositivity was present in the empty vector-transfected hepatoma cell lines. A modest decrease of the staining intensity was found in the full-length syndecan-1 transfected cells, whereas nuclei of truncated syndecan-1 transfectants showed hardly any Ets-1 immunoreaction. The protein was partially (full-length) or totally (truncated) sequestered in the cytoplasm; (B) In HepG2, decreased Ets-1 response element-driven promoter activity was found in the truncated transfectants, whereas AP-1 response element-driven promoter activity was suppressed in both full-length and truncated syndecan-1 cell lines. In Hep3B, both syndecan-1 constructs interfered with Ets-1 and AP-1 response element-driven promoter activity; (C) Transfection with either syndecan-1 construct inhibited the activation of ERK1/2 and p38 MAP kinases. Data points represent the mean ± SD, (B) n = 3, (C) n = 2; * p < 0.05; ** p < 0.01; *** p < 0.001 versus the empty vector transfectant. Representative images are at 600× magnification (scale bar 30 μm) and 400× magnification (scale bar 50 μm).
Biomolecules 10 01356 g007
Figure 8. Silencing of Ets-1 by RNA interference in HepG2 and Hep3B cells. (A) As indicated by the qRT-PCR results, knockdown of Ets-1 expression was successful in both cell lines; (B) The silencing constructs effectively hindered Ets-1 protein expression; (C) Except for miR-362, Western blots confirmed the downregulation of Ets-1; however, inactivation of ERK1/2 was mostly detected in Hep3B cell line. Data points represent the mean ± SD, (A) n = 3, (C) n = 2; * p < 0.05; ** p < 0.01; *** p < 0.001 versus miR-lacZ transfectant. Representative images are at 600× magnification (scale bar 30 μm).
Biomolecules 10 01356 g008
Figure 9. Changes in cell morphology upon Ets-1 silencing. With regard to inhibition of MMP-7 and differentiation, miRNAs targeting Ets-1 failed to fully replicate the changes observed after syndecan-1 transfection. The miR-641 did not inhibit the expression of MMP-7 and only modest desmoplakin relocalization was detected. H&E staining showed very few differentiated cells throughout the various transfectants. Representative images are at 1000× magnification (scale bar 15 μm) and 200× magnification (scale bar 100 μm).
Biomolecules 10 01356 g009
Figure 10. A schematic model to explain the effects of syndecan-1 overexpression. The central event is the accumulation of intact syndecan-1 molecules on the cell surface. This is achieved directly in cells transfected with the full-length construct and indirectly in cells transfected with the truncated syndecan-1 construct. The downstream effect is reduced Ets-1- and AP-1-mediated promoter activation with subsequent inhibition of cell proliferation and differentiation. RE, response element and GAG, glycosaminoglycan.
Biomolecules 10 01356 g010

