_Kwok.png)
Intact Transition Epitope Mapping—Force Interferences by Variable Extensions (ITEM-FIVE)

 ,
,
Abstract
:
1. Introduction
2. Materials and Methods
2.1. Preparation of Foldon and Biotinylated Foldon Solutions
2.2. Desalting of Biotinylated Foldon Solution
2.3. Protein Concentration Determination
2.4. Generation of Mixtures Consisting of Foldon Homo-Trimers, Biotinylated Foldon Homotrimers, and of Hetero-Trimers
2.5. Nanospray Needle Preparation
2.6. Off-Line nanoESI-MS Instrument Settings and Data Acquisition Conditions
2.7. ITEM-FIVE Experiments
2.8. Mass Spectral Data Analysis and Calculation of Apparent Kinetic and Quasi-Thermodynamic Values
2.9. In Silico Simulation and Molecular Modeling of Homo-Trimer and Hetero-Trimer Complexes
3. Results
3.1. Characterization of T4Ff and Biotinylated T4Ff Starting Materials
3.2. Dissociation of the (Biotinylated) T4Ff Homo-Trimers and Hetero-Trimers in the Gas Phase
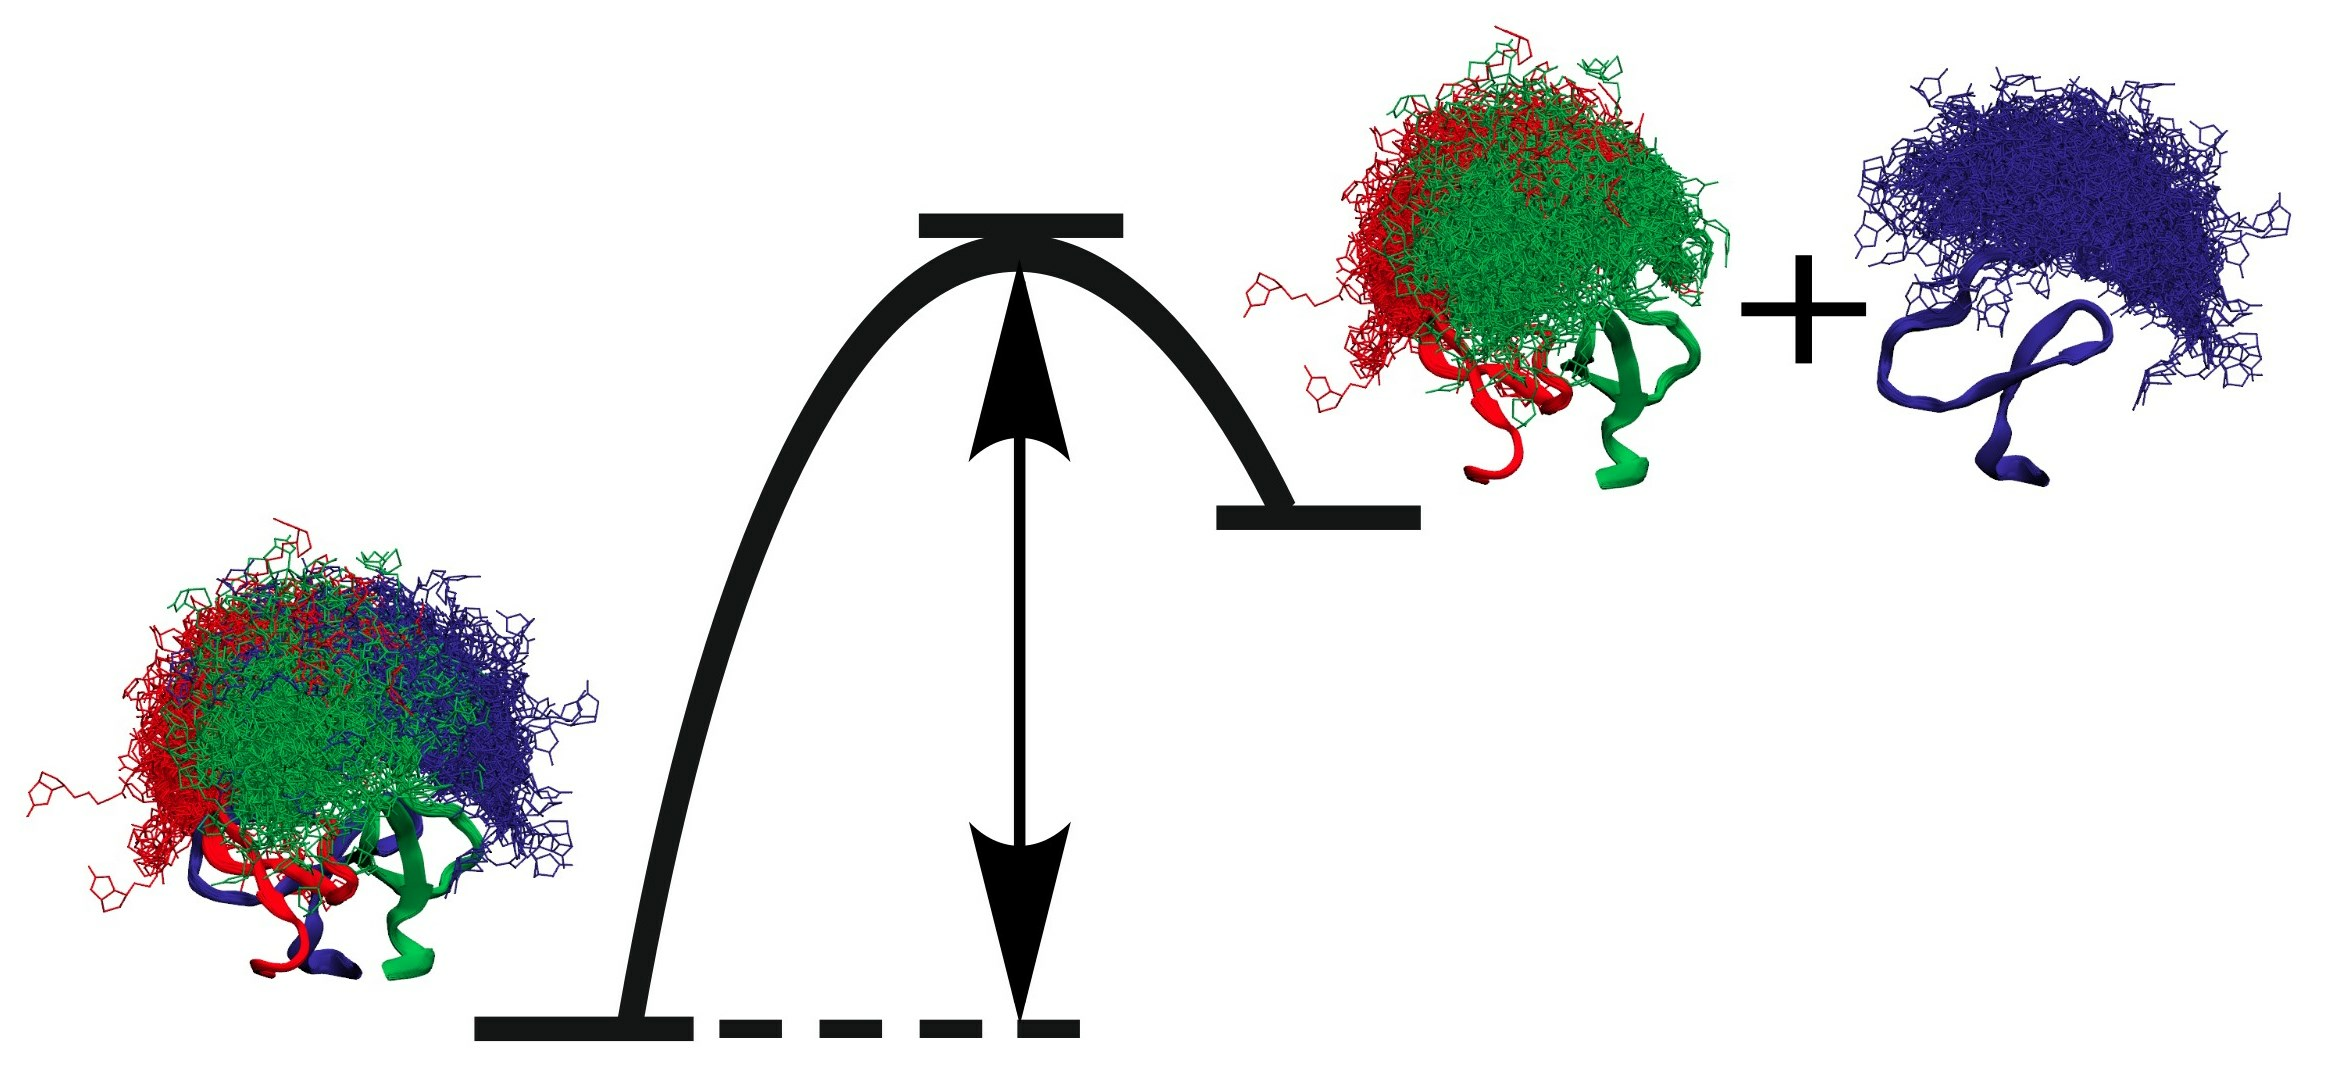
3.3. Molecular Dynamics and Entropic Spring Concept
4. Discussion
Supplementary Materials
Author Contributions
Funding
Institutional Review Board Statement
Informed Consent Statement
Data Availability Statement
Acknowledgments
Conflicts of Interest
References
- Wright, P.E.; Dyson, H.J. Intrinsically unstructured proteins: Re-assessing the protein structure-function paradigm. J. Mol. Biol. 1999, 293, 321–331. [Google Scholar] [CrossRef] [PubMed]
- Brocca, S.; Šamalíková, M.; Uversky, V.N.; Lotti, M.; Vanoni, M.; Alberghina, L.; Grandori, R. Order propensity of an intrinsically disordered protein, the cyclin-dependent-kinase inhibitor Sic1. Proteins Struct. Funct. Bioinform. 2009, 76, 731–746. [Google Scholar] [CrossRef] [PubMed]
- Tompa, P. Intrinsically disordered proteins: A 10-year recap. Trends Biochem. Sci. 2012, 37, 509–516. [Google Scholar] [CrossRef] [PubMed]
- Gógl, G.; Kornev, A.P.; Reményi, A.; Taylor, S.S. Disordered Protein Kinase Regions in Regulation of Kinase Domain Cores. Trends Biochem. Sci. 2019, 44, 300–311. [Google Scholar] [CrossRef] [PubMed]
- Dyla, M.; Kjaergaard, M. Intrinsically disordered linkers control tethered kinases via effective concentration. Proc. Natl. Acad. Sci. USA 2020, 117, 21413–21419. [Google Scholar] [CrossRef] [PubMed]
- Keppel, T.R.; Sarpong, K.; Murray, E.M.; Monsey, J.; Zhu, J.; Bose, R. Biophysical Evidence for Intrinsic Disorder in the C-terminal Tails of the Epidermal Growth Factor Receptor (EGFR) and HER3 Receptor Tyrosine Kinases. J. Biol. Chem. 2017, 292, 597–610. [Google Scholar] [CrossRef] [PubMed]
- Keul, N.D.; Oruganty, K.; Schaper Bergman, E.T.; Beattie, N.R.; McDonald, W.E.; Kadirvelraj, R.; Gross, M.L.; Phillips, R.S.; Harvey, S.C.; Wood, Z.A. The entropic force generated by intrinsically disordered segments tunes protein function. Nature 2018, 563, 584–588. [Google Scholar] [CrossRef] [PubMed]
- Güthe, S.; Kapinos, L.; Möglich, A.; Meier, S.; Grzesiek, S.; Kiefhaber, T. Very Fast Folding and Association of a Trimerization Domain from Bacteriophage T4 Fibritin. J. Mol. Biol. 2004, 337, 905–915. [Google Scholar] [CrossRef]
- Habazettl, J.; Reiner, A.; Kiefhaber, T. NMR Structure of a Monomeric Intermediate on the Evolutionarily Optimized Assembly Pathway of a Small Trimerization Domain. J. Mol. Biol. 2009, 389, 103–114. [Google Scholar] [CrossRef]
- Boudko, S.; Frank, S.; Kammerer, R.A.; Stetefeld, J.; Schulthess, T.; Landwehr, R.; Lustig, A.; Bächinger, H.P.; Engel, J. Nucleation and propagation of the collagen triple helix in single-chain and trimerized peptides: Transition from third to first order kinetics11Edited by R. Huber. J. Mol. Biol. 2002, 317, 459–470. [Google Scholar] [CrossRef]
- Danquah, B.D.; Röwer, C.; Opuni, K.F.-M.; El-Kased, R.F.; Frommholz, D.; Illges, H.; Koy, C.; Glocker, M.O. Intact Transition Epitope Mapping—Targeted High-Energy Rupture of Extracted Epitopes (ITEM-THREE). Mol. Cell. Proteom. 2019, 18, 1543–1555. [Google Scholar] [CrossRef] [PubMed]
- Danquah, B.D.; Yefremova, Y.; Opuni, K.F.M.; Röwer, C.; Koy, C.; Glocker, M.O. Intact Transition Epitope Mapping—Thermodynamic Weak-force Order (ITEM—TWO). J. Proteom. 2020, 212, 103572. [Google Scholar] [CrossRef] [PubMed]
- Yefremova, Y.; Melder, F.T.I.; Danquah, B.D.; Opuni, K.F.M.; Koy, C.; Ehrens, A.; Frommholz, D.; Illges, H.; Koelbel, K.; Sobott, F.; et al. Apparent Activation Energies of ProteinPprotein Complex Dissociation in the Gas Phase Determined by Electrospray Mass Spectrometry. Anal. Bioanal. Chem. 2017, 409, 6549–6558. [Google Scholar] [CrossRef] [PubMed]
- Röwer, C.; Ortmann, C.; Neamtu, A.; El-Kased, R.F.; Glocker, M.O. Intact Transition Epitope Mapping—Force Differences between Original and Unusual Residues (ITEM-FOUR). Biomolecules 2023, 13, 187. [Google Scholar] [CrossRef]
- Rappsilber, J.; Ishihama, Y.; Matthias, M. Stop and go extraction tips for matrix-assisted laser desorption/ionization, nanoelectrospray, and LC/MS sample pretreatment in proteomics. Anal. Chem. 2003, 75, 663–670. [Google Scholar] [CrossRef] [PubMed]
- Wölter, M.; Russ, M.; Okai, C.A.; Rath, W.; Pecks, U.; Glocker, M.O. Comparison of blood serum protein analysis by MALDI-MS from either conventional frozen samples or storage disc-deposited samples: A study with human serum from pregnant donors and from patients with intrauterine growth restriction. Eur. J. Mass Spectrom. 2019, 25, 381–390. [Google Scholar] [CrossRef] [PubMed]
- Yefremova, Y.; Opuni, K.F.-M.; Danquah, B.D.; Thiesen, H.-J.; Glocker, M.O. Intact Transition Epitope Mapping (ITEM). J. Am. Soc. Mass. Spectrom. 2017, 28, 1612–1622. [Google Scholar] [CrossRef]
- Perez-Riverol, Y.; Csordas, A.; Bai, J.; Bernal-Llinares, M.; Hewapathirana, S.; Kundu, D.J.; Inuganti, A.; Griss, J.; Mayer, G.; Eisenacher, M.; et al. The PRIDE database and related tools and resources in 2019: Improving support for quantification data. Nucleic Acids Res. 2019, 47, D442–D450. [Google Scholar] [CrossRef]
- Danquah, B.D.; Opuni, K.F.-M.; Roewer, C.; Koy, C.; Glocker, M.O. Mass Spectrometric Analysis of Antibody-Epitope Peptide Complex Dissociation: Theoretical Concept and Practical Procedure of Binding Strength Characterization. Molecules 2020, 25, 16. [Google Scholar] [CrossRef]
- Koy, C.; Opuni, K.F.M.; Danquah, B.D.; Neamtu, A.; Glocker, M.O. Mass Spectrometric and Bio-Computational Binding Strength Analysis of Multiply Charged RNAse S Gas-Phase Complexes Obtained by Electrospray Ionization from Varying In-Solution Equilibrium Conditions. Int. J. Mol. Sci. 2021, 22, 10183. [Google Scholar] [CrossRef]
- Berman, H.M.; Westbrook, J.; Feng, Z.; Gilliland, G.; Bhat, T.N.; Weissig, H.; Shindyalov, I.N.; Bourne, P.E. The Protein Data Bank. Nucleic Acids Res. 2000, 28, 235–242. [Google Scholar] [CrossRef] [PubMed]
- Zhu, K.; Day, T.; Warshaviak, D.; Murrett, C.; Friesner, R.; Pearlman, D. Antibody structure determination using a combination of homology modeling, energy-based refinement, and loop prediction. Proteins Struct. Funct. Bioinform. 2014, 82, 1646–1655. [Google Scholar] [CrossRef] [PubMed]
- Banks, J.L.; Beard, H.S.; Cao, Y.; Cho, A.E.; Damm, W.; Farid, R.; Felts, A.K.; Halgren, T.A.; Mainz, D.T.; Maple, J.R.; et al. Integrated Modeling Program, Applied Chemical Theory (IMPACT). J. Comput. Chem. 2005, 26, 1752–1780. [Google Scholar] [CrossRef]
- Jorgensen, W.L.; Chandrasekhar, J.; Madura, J.D.; Impey, R.W.; Klein, M.L. Comparison of simple potential functions for simulating liquid water. J. Chem. Phys. 1983, 79, 926–935. [Google Scholar] [CrossRef]
- Bowers, K.J.; Chow, D.E.; Xu, H.; Dror, R.O.; Eastwood, M.P.; Gregersen, B.A.; Klepeis, J.L.; Kolossvary, I.; Moraes, M.A.; Sacerdoti, F.D.; et al. Scalable Algorithms for Molecular Dynamics Simulations on Commodity Clusters. In Proceedings of the 2006 ACM/IEEE Conference on Supercomputing, Tampa, FL, USA, 11–17 November 2006; Volume 11, p. 43. [Google Scholar]
- Martyna, G.J.; Klein, M.L.; Tuckerman, M. Nosé–Hoover chains: The canonical ensemble via continuous dynamics. J. Chem. Phys. 1992, 97, 2635–2643. [Google Scholar] [CrossRef]
- Martyna, G.J.; Tobias, D.J.; Klein, M.L. Constant pressure molecular dynamics algorithms. J. Chem. Phys. 1994, 101, 4177–4189. [Google Scholar] [CrossRef]
- Bonomi, M.; Bussi, G.; Camilloni, C.; Tribello, G.A.; Banáš, P.; Barducci, A.; Bernetti, M.; Bolhuis, P.G.; Bottaro, S.; Branduardi, D.; et al. Promoting transparency and reproducibility in enhanced molecular simulations. Nat. Methods 2019, 16, 670–673. [Google Scholar]
- Tribello, G.A.; Bonomi, M.; Branduardi, D.; Camilloni, C.; Bussi, G. PLUMED 2: New feathers for an old bird. Comput. Phys. Commun. 2014, 185, 604–613. [Google Scholar] [CrossRef]
- Humphrey, W.; Dalke, A.; Schulten, K. VMD: Visual molecular dynamics. J. Mol. Graph. 1996, 14, 33–38. [Google Scholar] [CrossRef]
- Chingin, K.; Barylyuk, K. Charge-State-Dependent Variation of Signal Intensity Ratio between Unbound Protein and Protein-Ligand Complex in Electrospray Ionization Mass Spectrometry: The Role of Solvent-Accessible Surface Area. Anal. Chem. 2018, 90, 5521–5528. [Google Scholar] [CrossRef]
- Jørgensen, T.J.D.; Delforge, D.; Remacle, J.; Bojesen, G.; Roepstorff, P. Collision-induced dissociation of noncovalent complexes between vancomycin antibiotics and peptide ligand stereoisomers: Evidence for molecular recognition in the gas phase11Dedicated to Brian Green on the occasion of his 65th birthday. Int. J. Mass Spectrom. 1999, 188, 63–85. [Google Scholar] [CrossRef]
- Guth, E.; Mark, H. Zur innermolekularen Statistik, insbesondere bei Kettenmolekülen I. Monatshefte Chem. Verwandte Teile Wiss. 1934, 65, 93–121. [Google Scholar]
- Hanson, D.E.; Barber, J.L. A new paradigm for the molecular basis of rubber elasticity. Contemp. Phys. 2015, 56, 319–337. [Google Scholar] [CrossRef]
- Pereira, M.C.F.; Brackley, C.A.; Lintuvuori, J.S.; Marenduzzo, D.; Orlandini, E. Entropic elasticity and dynamics of the bacterial chromosome: A simulation study. J. Chem. Phys. 2017, 147, 044908. [Google Scholar] [CrossRef]
- Xie, H.-Q.; Chang, C.-H. Chemical potential formalism for polymer entropic forces. Commun. Phys. 2019, 2, 24. [Google Scholar] [CrossRef]
- Kartsovnik, V.I.; Volchenkov, D. Elastic Entropic Forces in Polymer Deformation. Entropy 2022, 24, 1260. [Google Scholar] [CrossRef]
- Shen, M.; Hall, W.F.; Dewames, R.E. Molecular Theories of Rubber-like Elasticity and Polymer Viscoelasticity. J. Macromol. Sci. Part C 1968, 2, 183–224. [Google Scholar] [CrossRef]
- Stingaciu, L.R.; Ivanova, O.; Ohl, M.; Biehl, R.; Richter, D. Fast antibody fragment motion: Flexible linkers act as entropic spring. Sci. Rep. 2016, 6, 22148. [Google Scholar] [CrossRef] [PubMed]
- Prieß, M.; Schäfer, L.V. Release of Entropic Spring Reveals Conformational Coupling Mechanism in the ABC Transporter BtuCD-F. Biophys. J. 2016, 110, 2407–2418. [Google Scholar] [CrossRef]
- Smagghe, B.J.; Huang, P.-S.; Ban, Y.-E.A.; Baker, D.; Springer, T.A. Modulation of Integrin Activation by an Entropic Spring in the β-Knee. J. Biol. Chem. 2010, 285, 32954–32966. [Google Scholar] [CrossRef]
- Linke, W.A.; Kulke, M.; Li, H.; Fujita-Becker, S.; Neagoe, C.; Manstein, D.J.; Gautel, M.; Fernandez, J.M. PEVK Domain of Titin: An Entropic Spring with Actin-Binding Properties. J. Struct. Biol. 2002, 137, 194–205. [Google Scholar] [CrossRef] [PubMed]
- Dunker, A.K.; Lawson, J.D.; Brown, C.J.; Williams, R.M.; Romero, P.; Oh, J.S.; Oldfield, C.J.; Campen, A.M.; Ratliff, C.M.; Hipps, K.W.; et al. Intrinsically disordered protein. J. Mol. Graph. Model. 2001, 19, 26–59. [Google Scholar] [CrossRef] [PubMed]
- Baker, J.E. Cells solved the Gibbs paradox by learning to contain entropic forces. Sci. Rep. 2023, 13, 16604. [Google Scholar] [CrossRef] [PubMed]
- Holehouse, A.S.; Kragelund, B.B. The molecular basis for cellular function of intrinsically disordered protein regions. Nat. Rev. Mol. Cell Biol. 2024, 25, 187–211. [Google Scholar] [CrossRef]
- Kikuchi, K.; Fukuyama, T.; Uchihashi, T.; Furuta, T.; Maeda, Y.T.; Ueno, T. Protein Needles Designed to Self-Assemble through Needle Tip Engineering. Small 2022, 18, 2106401. [Google Scholar] [CrossRef] [PubMed]
- Inaba, H.; Ueno, T. Artificial bio-nanomachines based on protein needles derived from bacteriophage T4. Biophys. Rev. 2018, 10, 641–658. [Google Scholar] [CrossRef] [PubMed]
- Raman, S.; Machaidze, G.; Lustig, A.; Olivieri, V.; Aebi, U.; Burkhard, P. Design of Peptide Nanoparticles Using Simple Protein Oligomerization Domains. Open Nanomed. Nanotechnol. J. 2009, 6, 15–26. [Google Scholar] [CrossRef]
- Gómez-González, J.; Peña, D.G.; Barka, G.; Sciortino, G.; Maréchal, J.-D.; Vázquez López, M.; Vázquez, M.E. Directed Self-Assembly of Trimeric DNA-Bindingchiral Miniprotein Helicates. Front. Chem. 2018, 6, 520. [Google Scholar] [CrossRef] [PubMed]
- Corbett, K.S.; Edwards, D.K.; Leist, S.R.; Abiona, O.M.; Boyoglu-Barnum, S.; Gillespie, R.A.; Himansu, S.; Schäfer, A.; Ziwawo, C.T.; DiPiazza, A.T.; et al. SARS-CoV-2 mRNA vaccine design enabled by prototype pathogen preparedness. Nature 2020, 586, 567–571. [Google Scholar] [CrossRef]
- Pekarik, V. Secreted trimeric viral envelope proteins as a tool for new vaccine design and biochemical assays. J. Met. Nanotechnol. 2016, 4, 12–21. [Google Scholar]
- Mulligan, M.J.; Lyke, K.E.; Kitchin, N.; Absalon, J.; Gurtman, A.; Lockhart, S.; Neuzil, K.; Raabe, V.; Bailey, R.; Swanson, K.A.; et al. Phase I/II study of COVID-19 RNA vaccine BNT162b1 in adults. Nature 2020, 586, 589–593. [Google Scholar] [CrossRef] [PubMed]
- Sahin, U.; Muik, A.; Derhovanessian, E.; Vogler, I.; Kranz, L.M.; Vormehr, M.; Baum, A.; Pascal, K.; Quandt, J.; Maurus, D.; et al. COVID-19 vaccine BNT162b1 elicits human antibody and TH1 T cell responses. Nature 2020, 586, 594–599. [Google Scholar] [CrossRef] [PubMed]
- Patel, S.P.; Patel, G.S.; Suthar, J.V. Inside the story about the research and development of COVID-19 vaccines. Clin. Exp. Vaccine Res. 2021, 10, 154–170. [Google Scholar] [CrossRef] [PubMed]
- Walsh, E.E.; Frenck, R.W.; Falsey, A.R.; Kitchin, N.; Absalon, J.; Gurtman, A.; Lockhart, S.; Neuzil, K.; Mulligan, M.J.; Bailey, R.; et al. Safety and Immunogenicity of Two RNA-Based COVID-19 Vaccine Candidates. N. Engl. J. Med. 2020, 383, 2439–2450. [Google Scholar] [CrossRef] [PubMed]
- Sliepen, K.; van Montfort, T.; Melchers, M.; Isik, G.; Sanders, R.W. Immunosilencing a Highly Immunogenic Protein Trimerization Domain. J. Biol. Chem. 2015, 290, 7436–7442. [Google Scholar] [CrossRef] [PubMed]
- Al-Majdoub, M.; Koy, C.; Lorenz, P.; Thiesen, H.J.; Glocker, M.O. Mass spectrometric and peptide chip characterization of an assembled epitope: Analysis of a polyclonal antibody model serum directed against the Sjogren/systemic lupus erythematosus autoantigen TRIM21. J. Mass Spectrom. 2013, 48, 651–659. [Google Scholar] [CrossRef] [PubMed]
- El-Kased, R.F.; Koy, C.; Deierling, T.; Lorenz, P.; Qian, Z.; Li, Y.; Thiesen, H.-J.; Glocker, M.O. Mass Spectrometric and Peptide Chip Epitope Mapping of Rheumatoid Arthritis Autoantigen RA33. Eur. J. Mass Spectrom. 2009, 15, 747–759. [Google Scholar] [CrossRef]
- Linnebacher, M.; Lorenz, P.; Koy, C.; Jahnke, A.; Born, N.; Steinbeck, F.; Wollbold, J.; Latzkow, T.; Thiesen, H.-J.; Glocker, M.O. Clonality characterization of natural epitope-specific antibodies against the tumor-related antigen topoisomerase IIa by peptide chip and proteome analysis: A pilot study with colorectal carcinoma patient samples. Anal. Bioanal. Chem. 2012, 403, 227–238. [Google Scholar] [CrossRef]
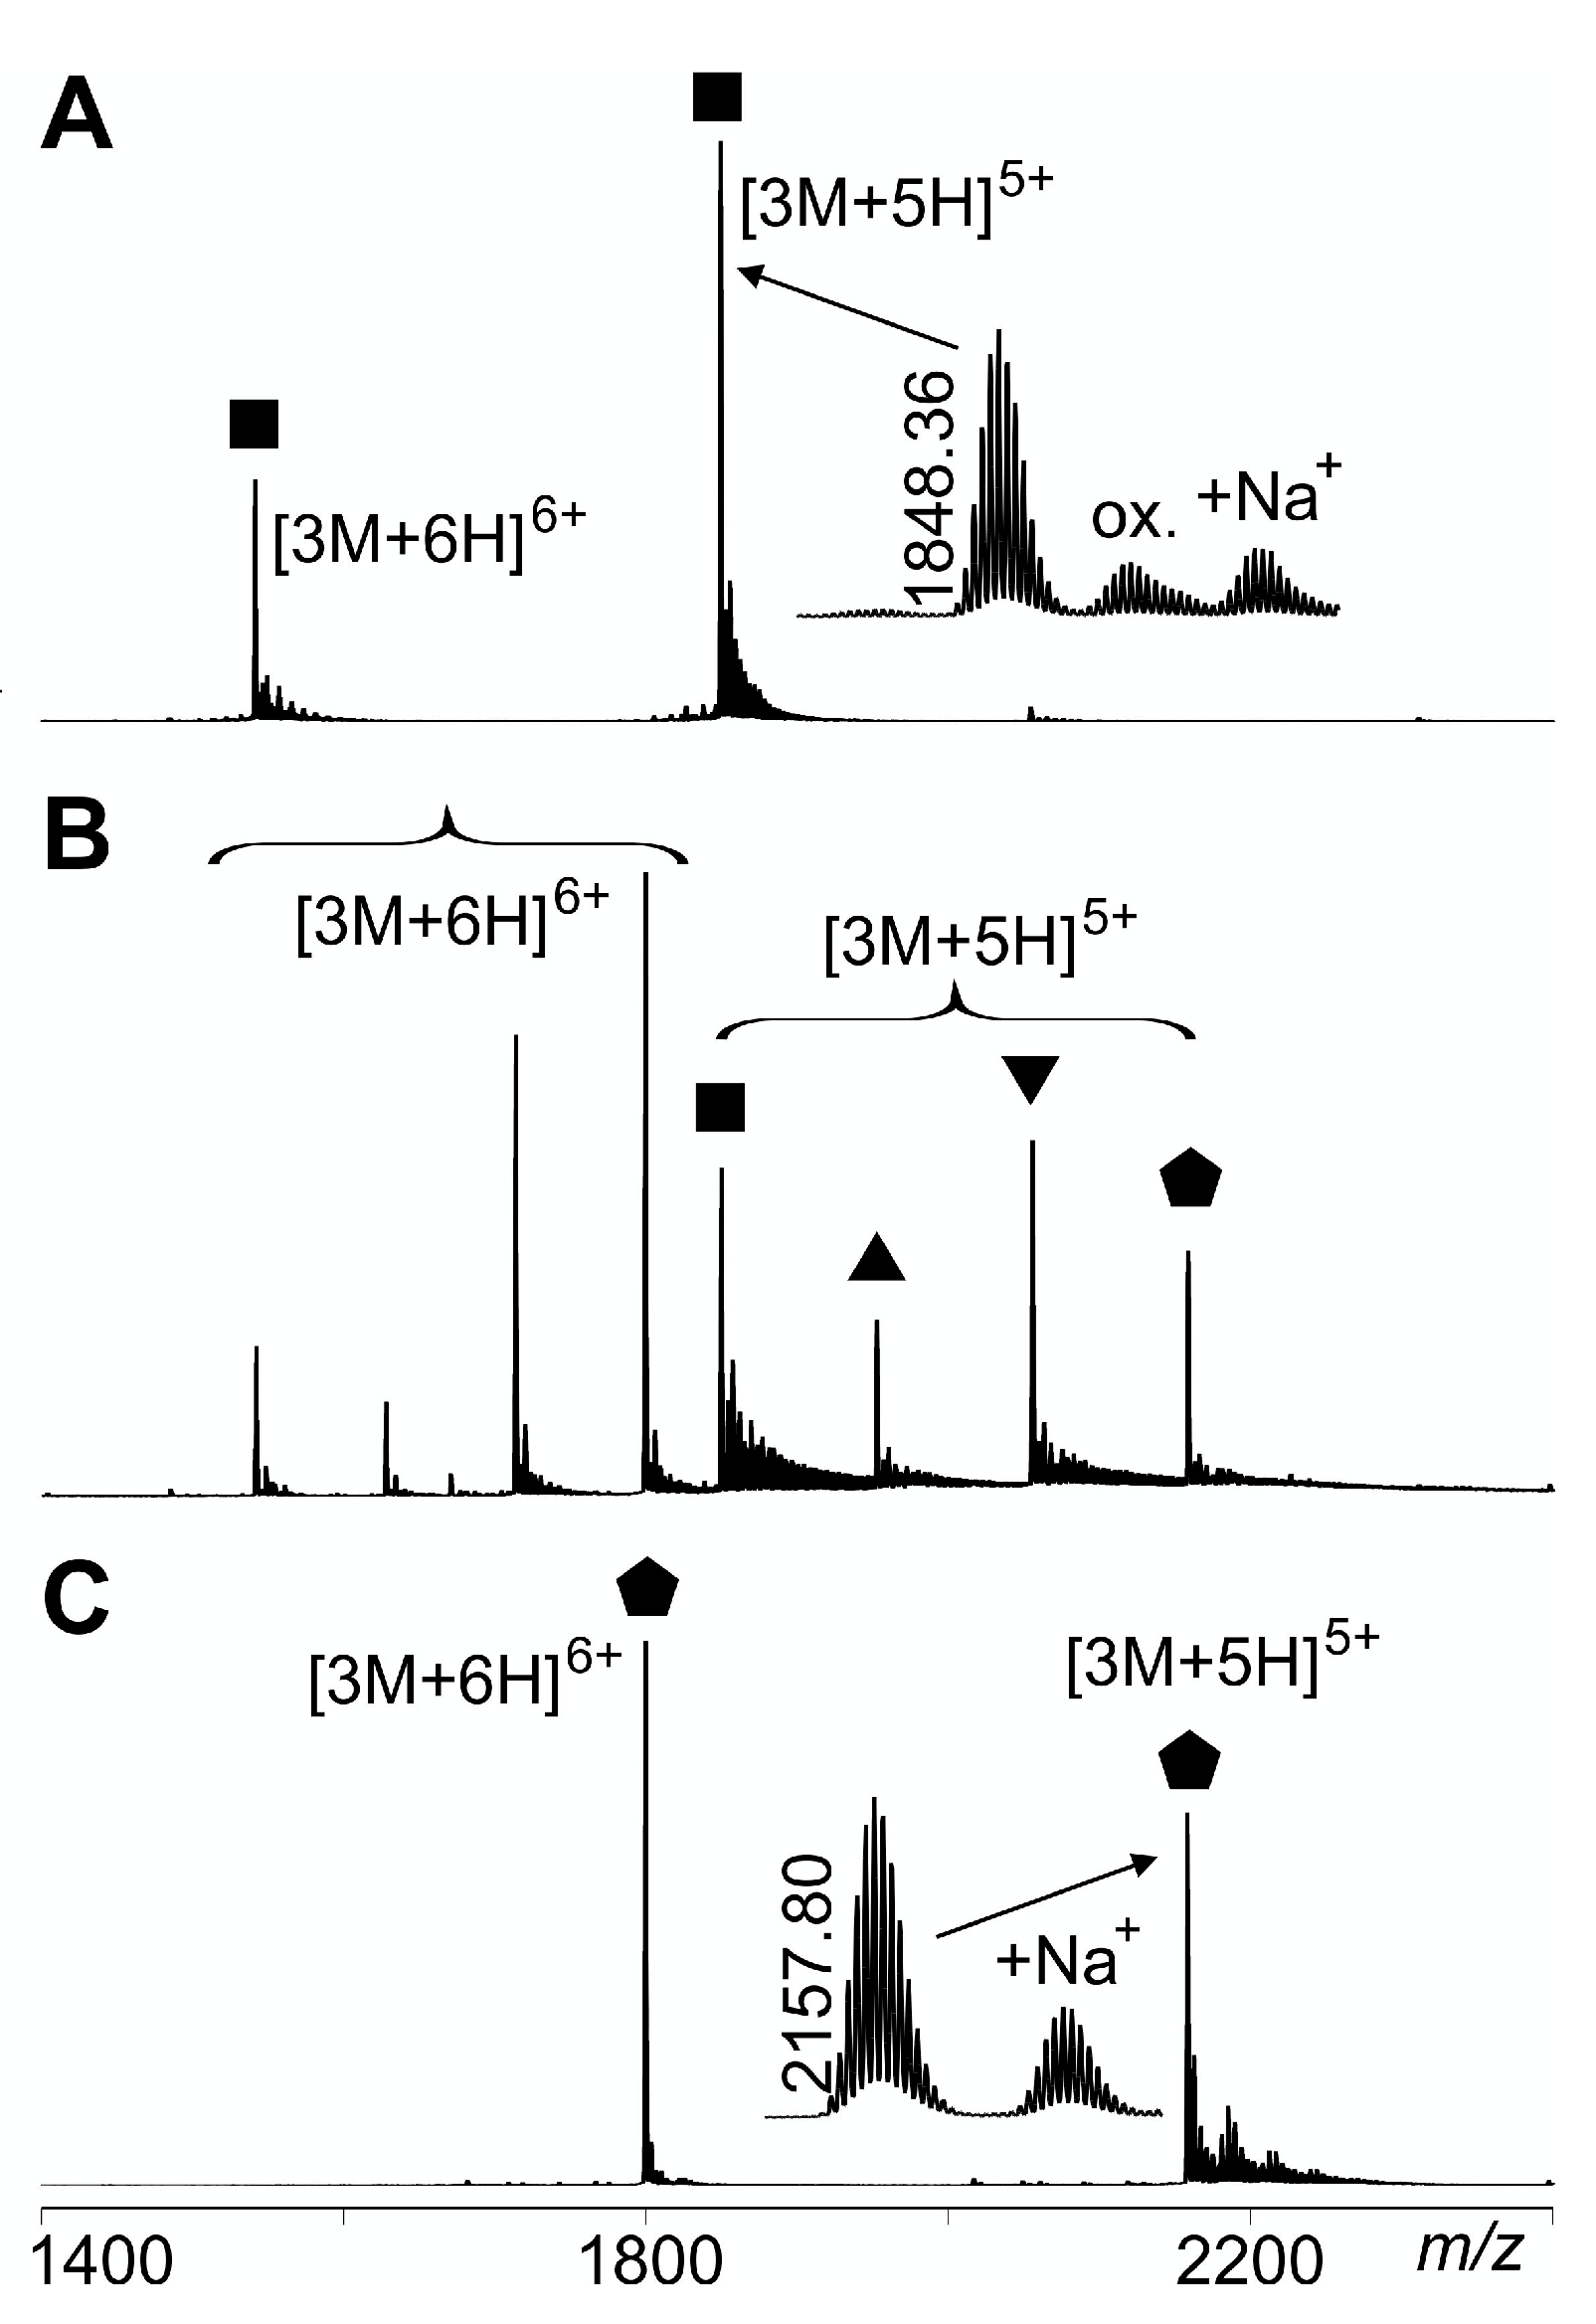
 ; singly biotinylated T4Ff hetero-trimer:
  ; doubly biotinylated T4Ff hetero-trimer:
  ; triply biotinylated T4Ff homo-trimer:
  . For symbol assignment see Table 1. Solvent: 200 mM ammonium acetate, pH 6.7.
; singly biotinylated T4Ff hetero-trimer: ; doubly biotinylated T4Ff hetero-trimer: ; triply biotinylated T4Ff homo-trimer: . For symbol assignment see Table 1. Solvent: 200 mM ammonium acetate, pH 6.7.
. For symbol assignment see Table 1. Solvent: 200 mM ammonium acetate, pH 6.7.
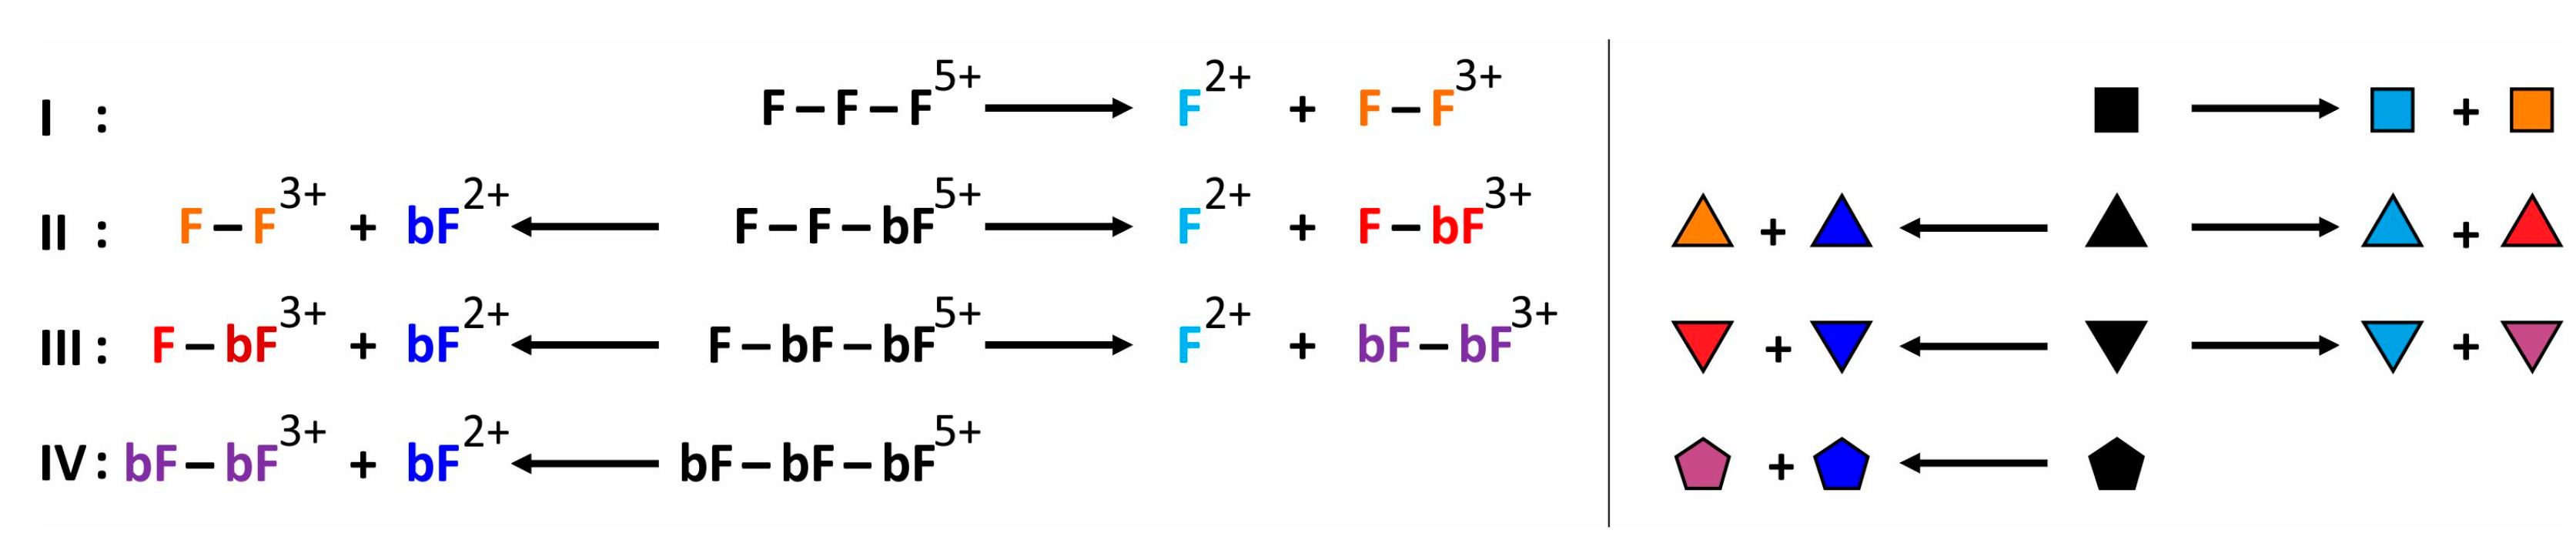
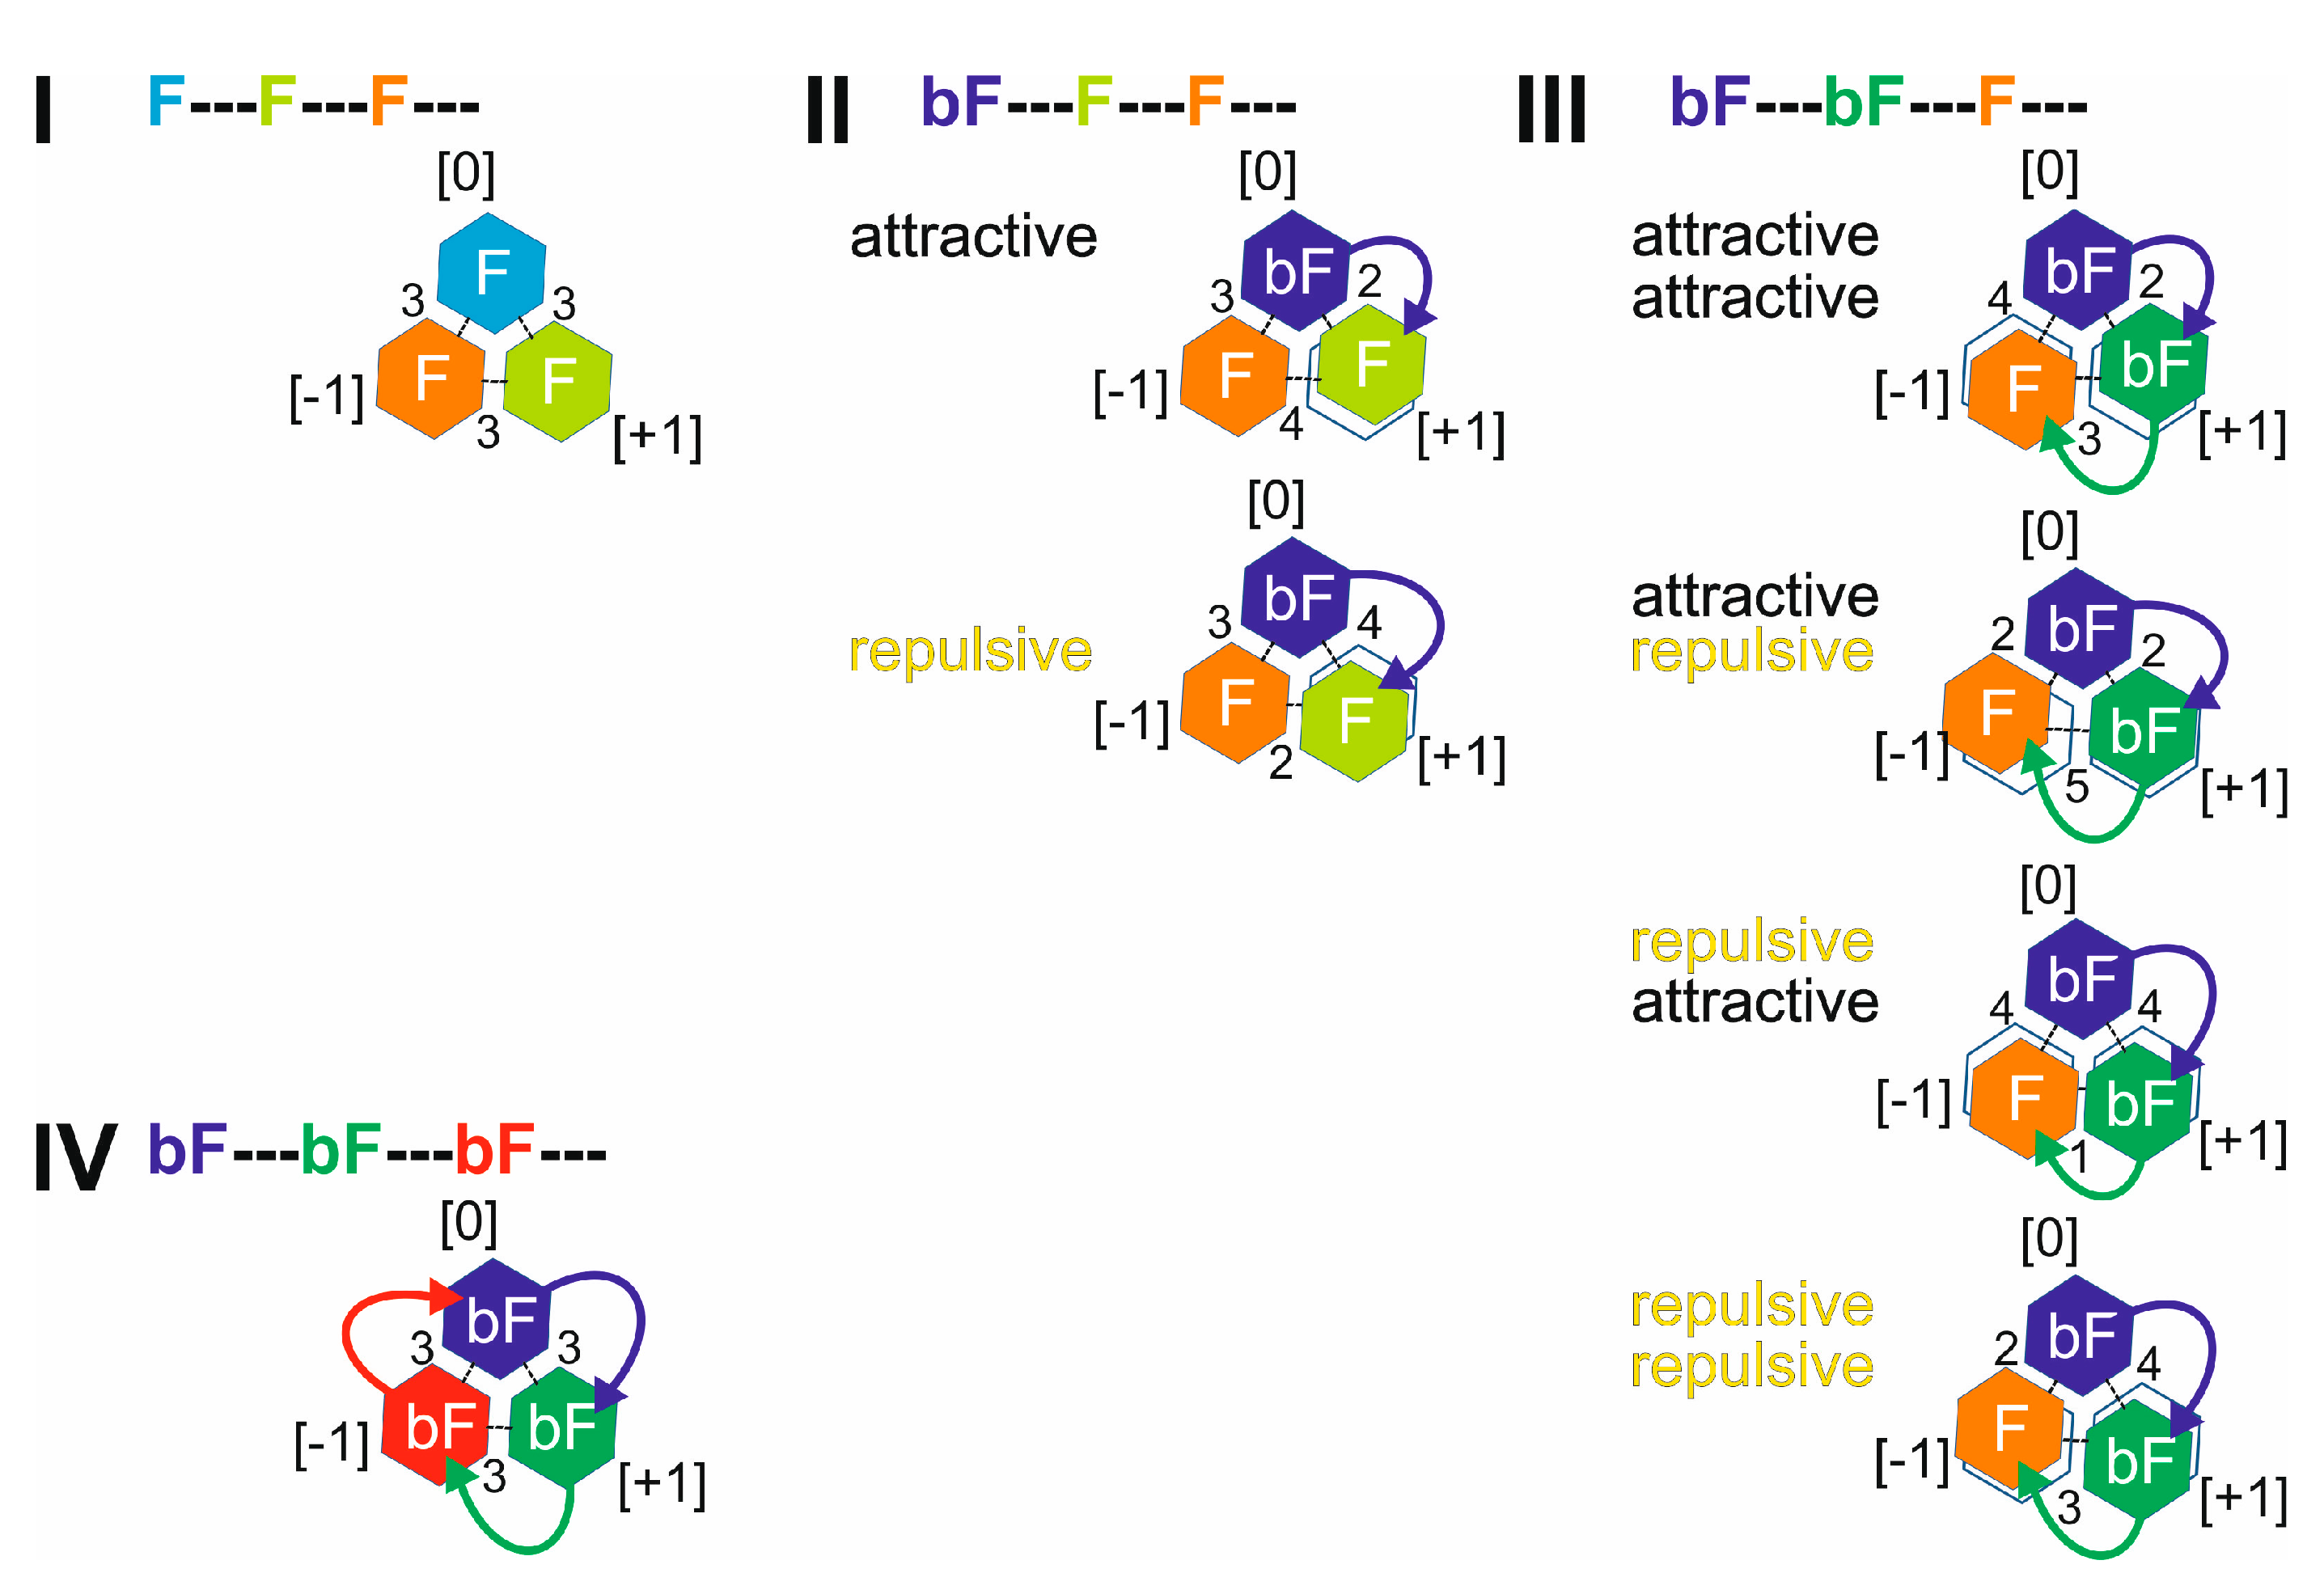
; singly biotinylated T4Ff hetero-trimer: ; doubly biotinylated T4Ff hetero-trimer: ; triply biotinylated T4Ff homo-trimer: . For symbol assignment see Table 1. Solvent: 200 mM ammonium acetate, pH 6.7. . II: Singly biotinylated T4Ff hetero-trimer, . III: Doubly biotinylated T4Ff hetero-trimer, . IV: Triply biotinylated T4Ff homo-trimer, . The symbols not only represent the respective product structures but also give information about the educt from which they originate from; for symbol assignments, see also Table 1.
. II: Singly biotinylated T4Ff hetero-trimer, . III: Doubly biotinylated T4Ff hetero-trimer, . IV: Triply biotinylated T4Ff homo-trimer, . The symbols not only represent the respective product structures but also give information about the educt from which they originate from; for symbol assignments, see also Table 1.
. II: Singly biotinylated T4Ff hetero-trimer, . III: Doubly biotinylated T4Ff hetero-trimer, . IV: Triply biotinylated T4Ff homo-trimer, . The symbols not only represent the respective product structures but also give information about the educt from which they originate from; for symbol assignments, see also Table 1. ) (educts), as well as for the released T4Ff dimers (
 ) and monomers (
 ) (products). T4Ff concentration was 0.21 µg/µL. For intensities and m/z values of ion signals, see Supplemental Table S1. For symbol assignments, see Table 1 and Figure 2.
) (educts), as well as for the released T4Ff dimers () and monomers () (products). T4Ff concentration was 0.21 µg/µL. For intensities and m/z values of ion signals, see Supplemental Table S1. For symbol assignments, see Table 1 and Figure 2.
) (products). T4Ff concentration was 0.21 µg/µL. For intensities and m/z values of ion signals, see Supplemental Table S1. For symbol assignments, see Table 1 and Figure 2.
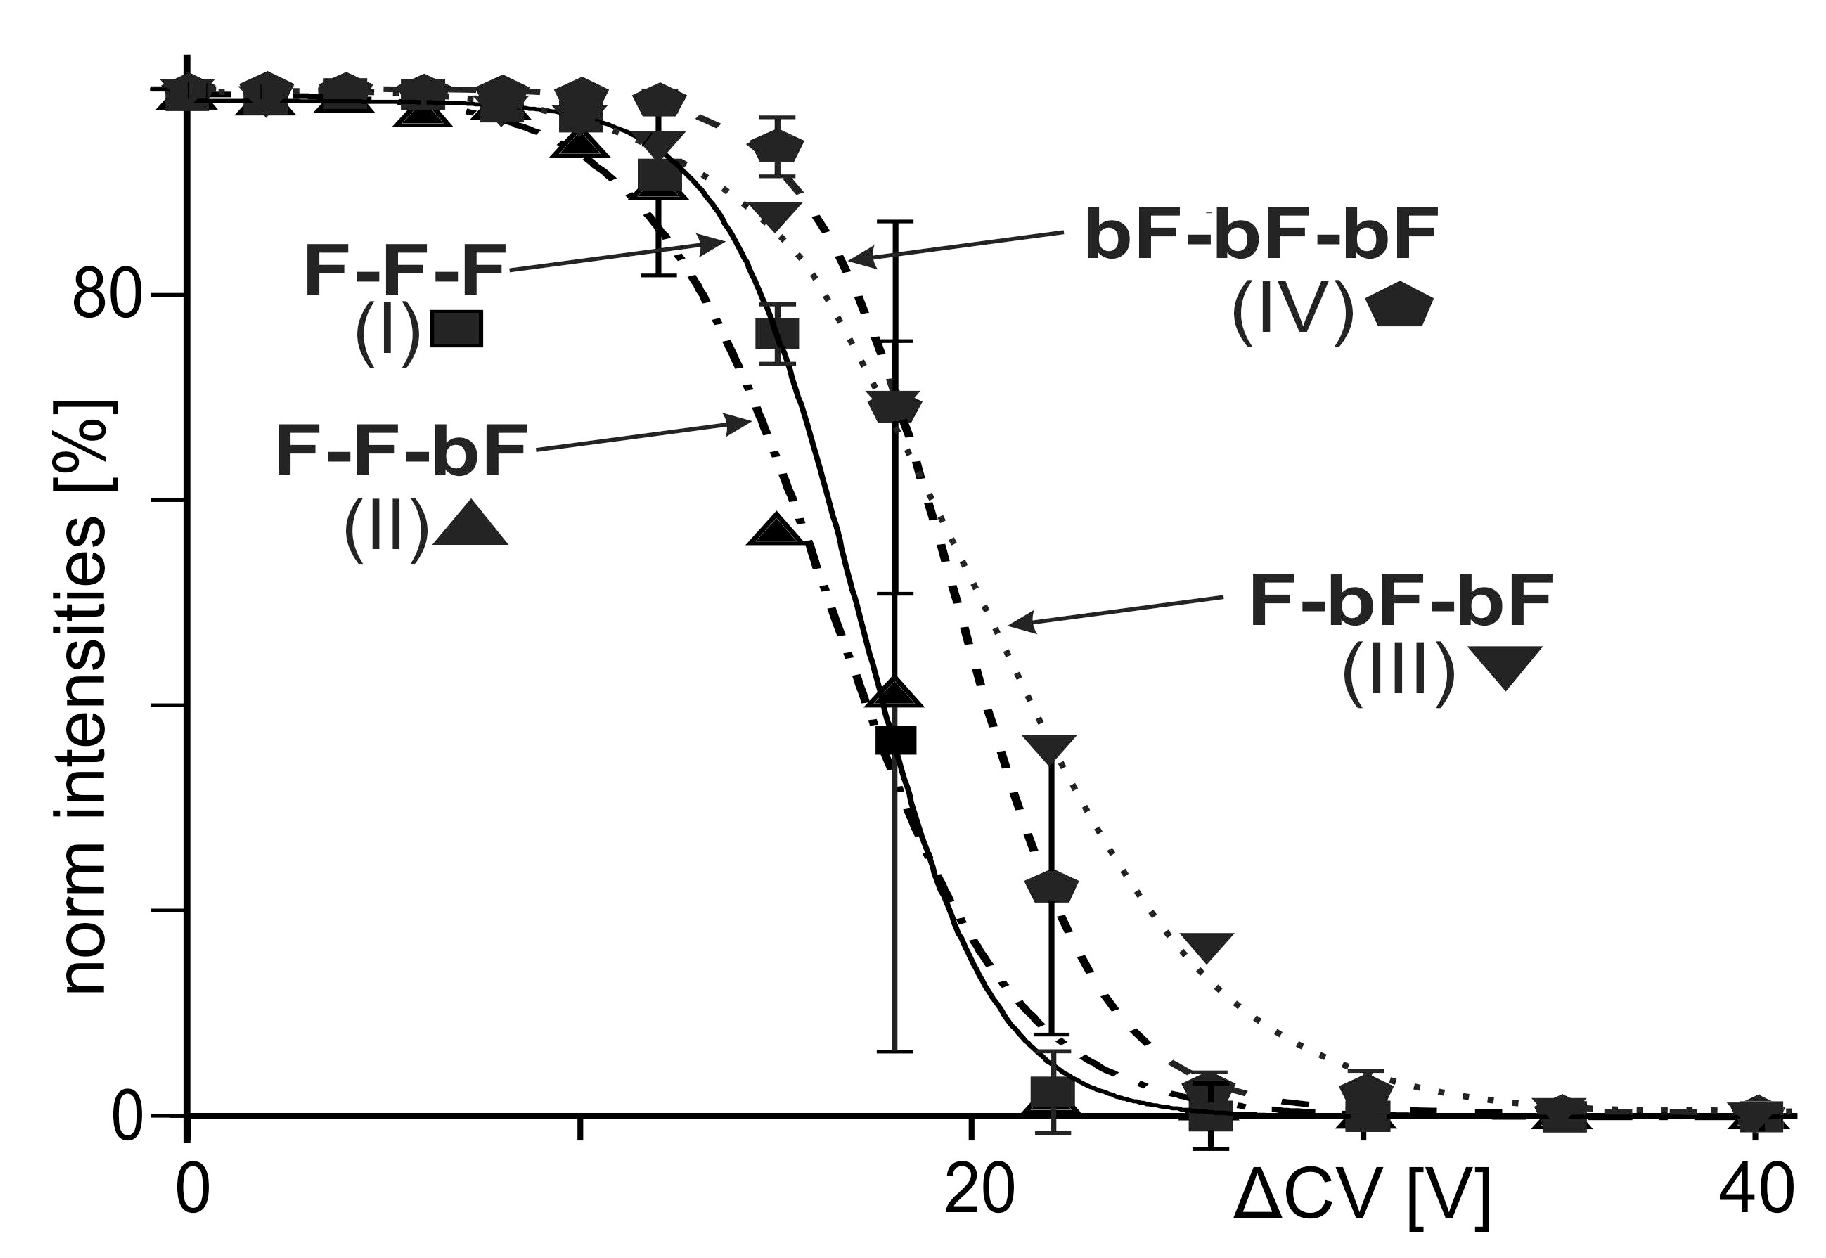
) (educts), as well as for the released T4Ff dimers () and monomers () (products). T4Ff concentration was 0.21 µg/µL. For intensities and m/z values of ion signals, see Supplemental Table S1. For symbol assignments, see Table 1 and Figure 2.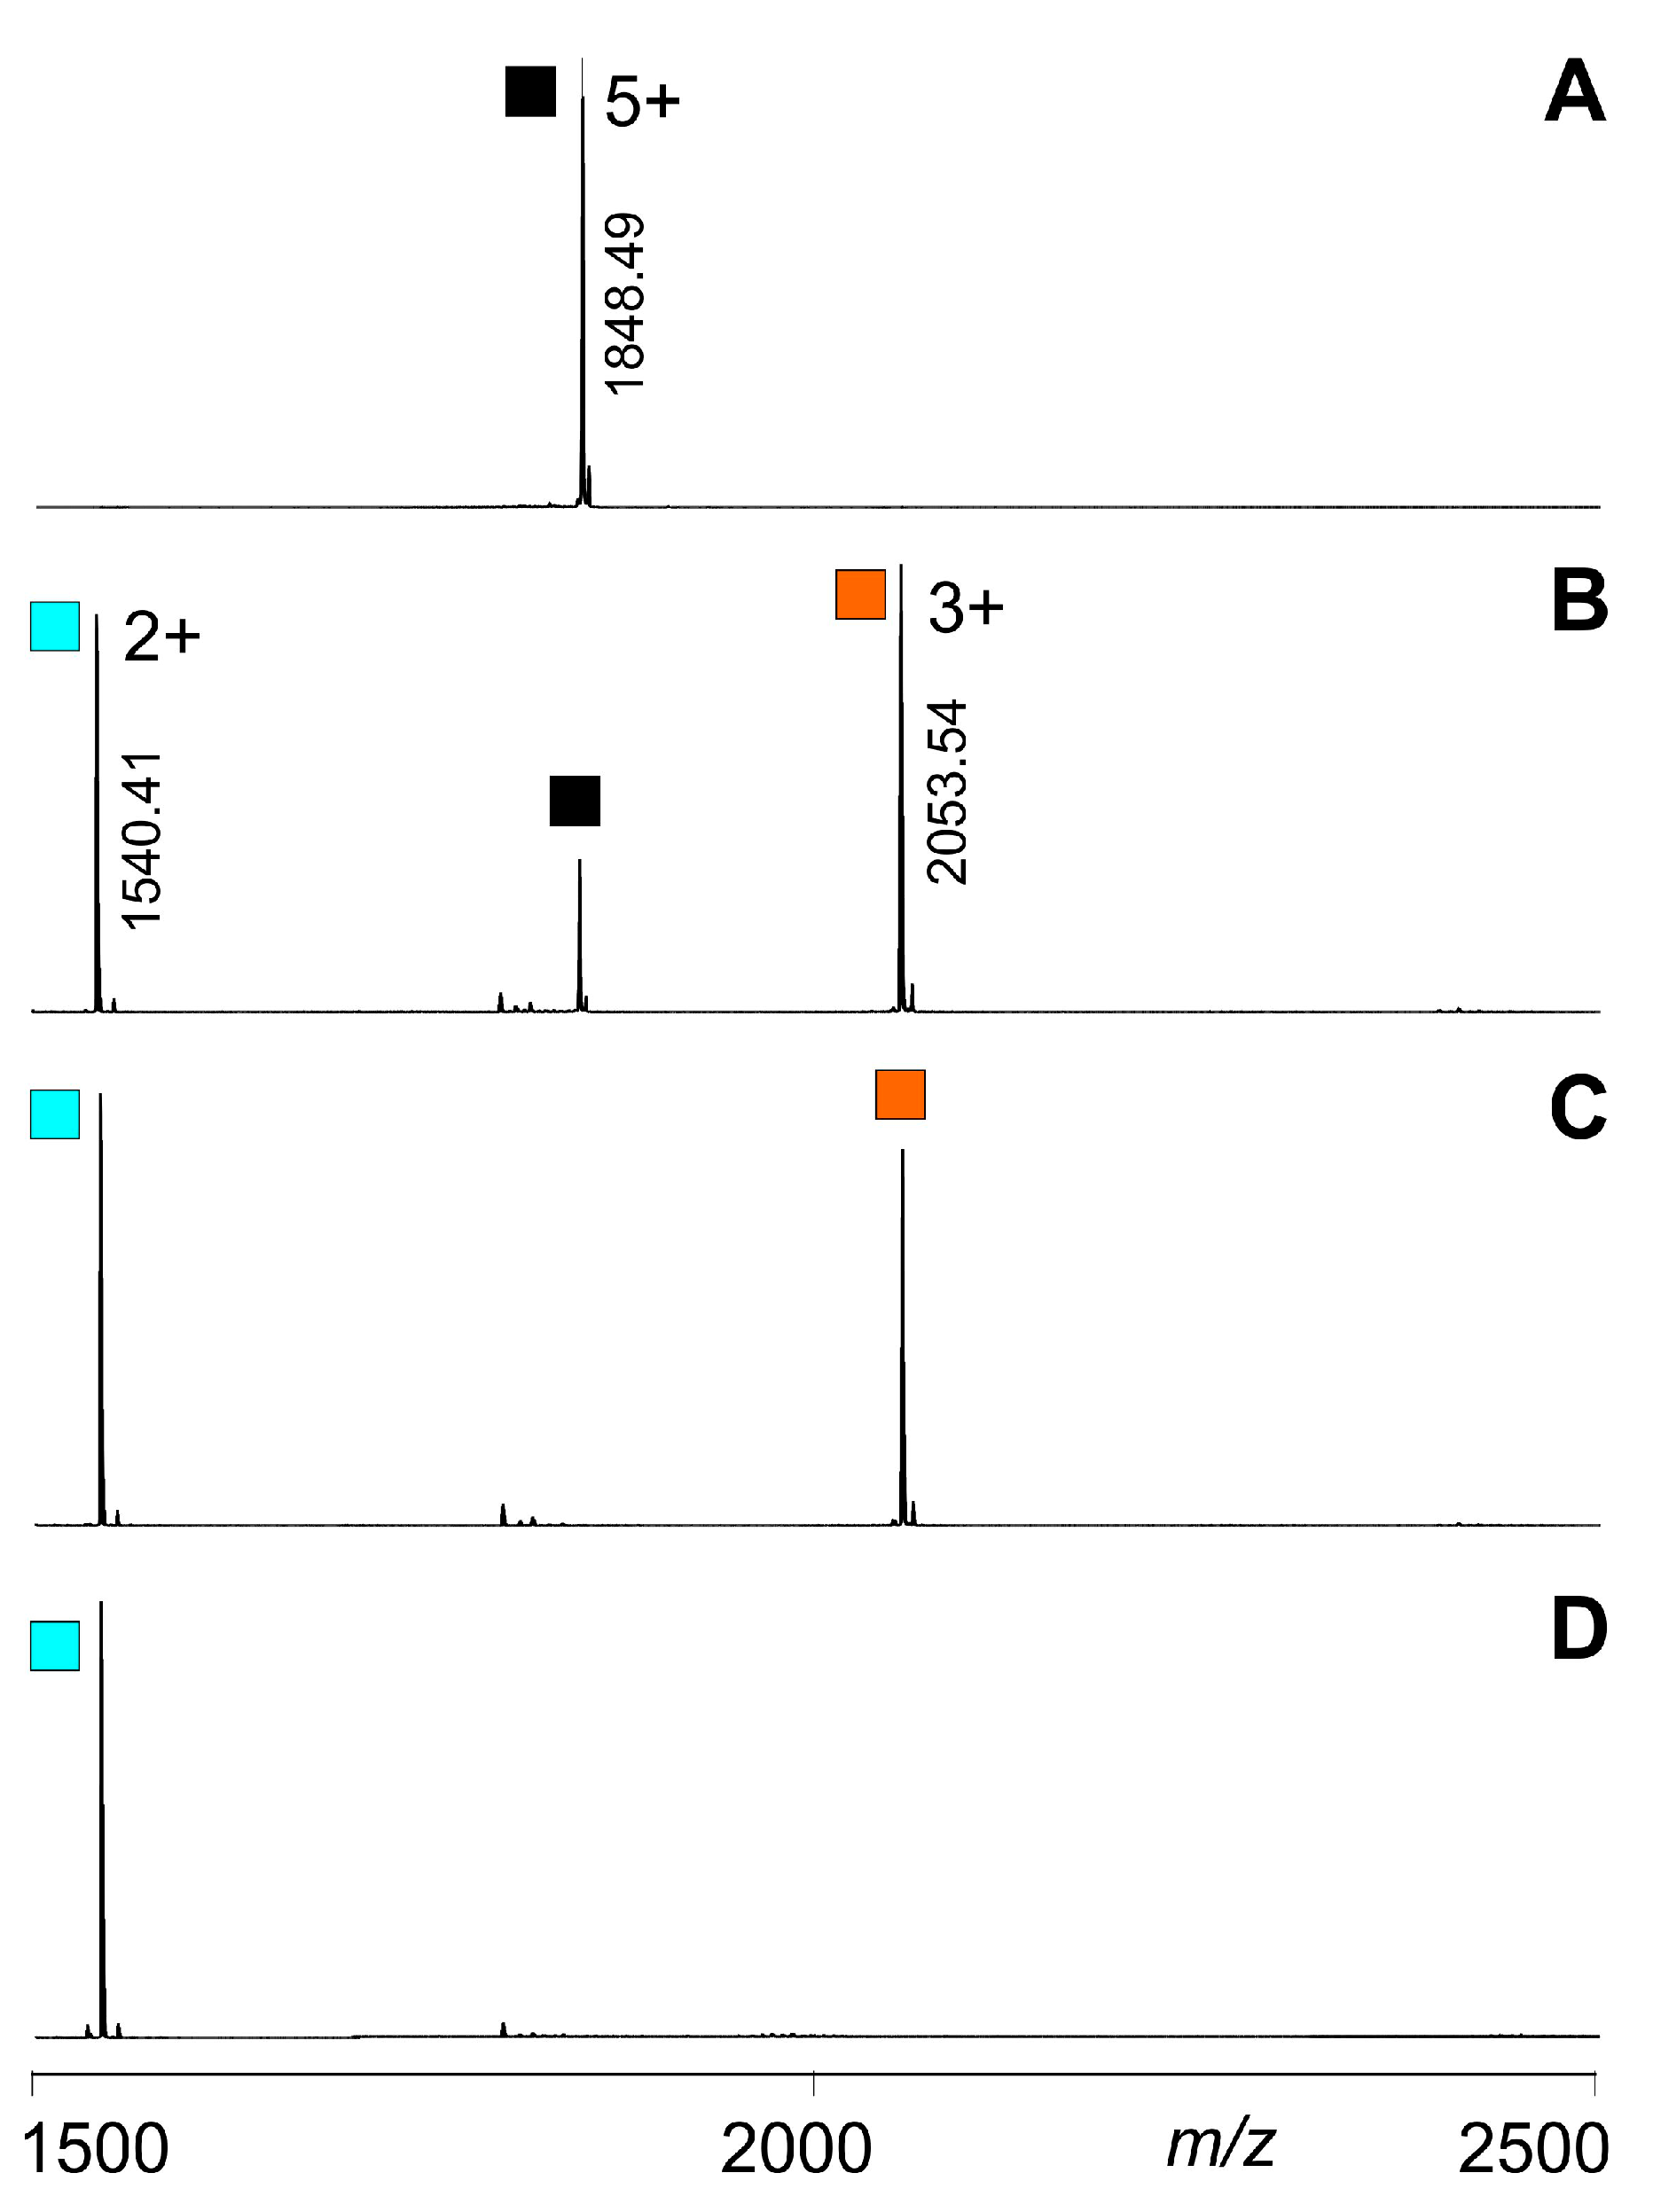 ; singly biotinylated T4Ff hetero-trimer: ; doubly biotinylated T4Ff hetero-trimer: ; triply biotinylated T4Ff homo-trimer: . Each data point is the mean of two independent measurements, and standard deviations are shown by vertical bars. Curves were fitted using Boltzmann functions (cf. Table 2). For symbol assignments, see Table 1 and Figure 2.
; singly biotinylated T4Ff hetero-trimer: ; doubly biotinylated T4Ff hetero-trimer: ; triply biotinylated T4Ff homo-trimer: . Each data point is the mean of two independent measurements, and standard deviations are shown by vertical bars. Curves were fitted using Boltzmann functions (cf. Table 2). For symbol assignments, see Table 1 and Figure 2.
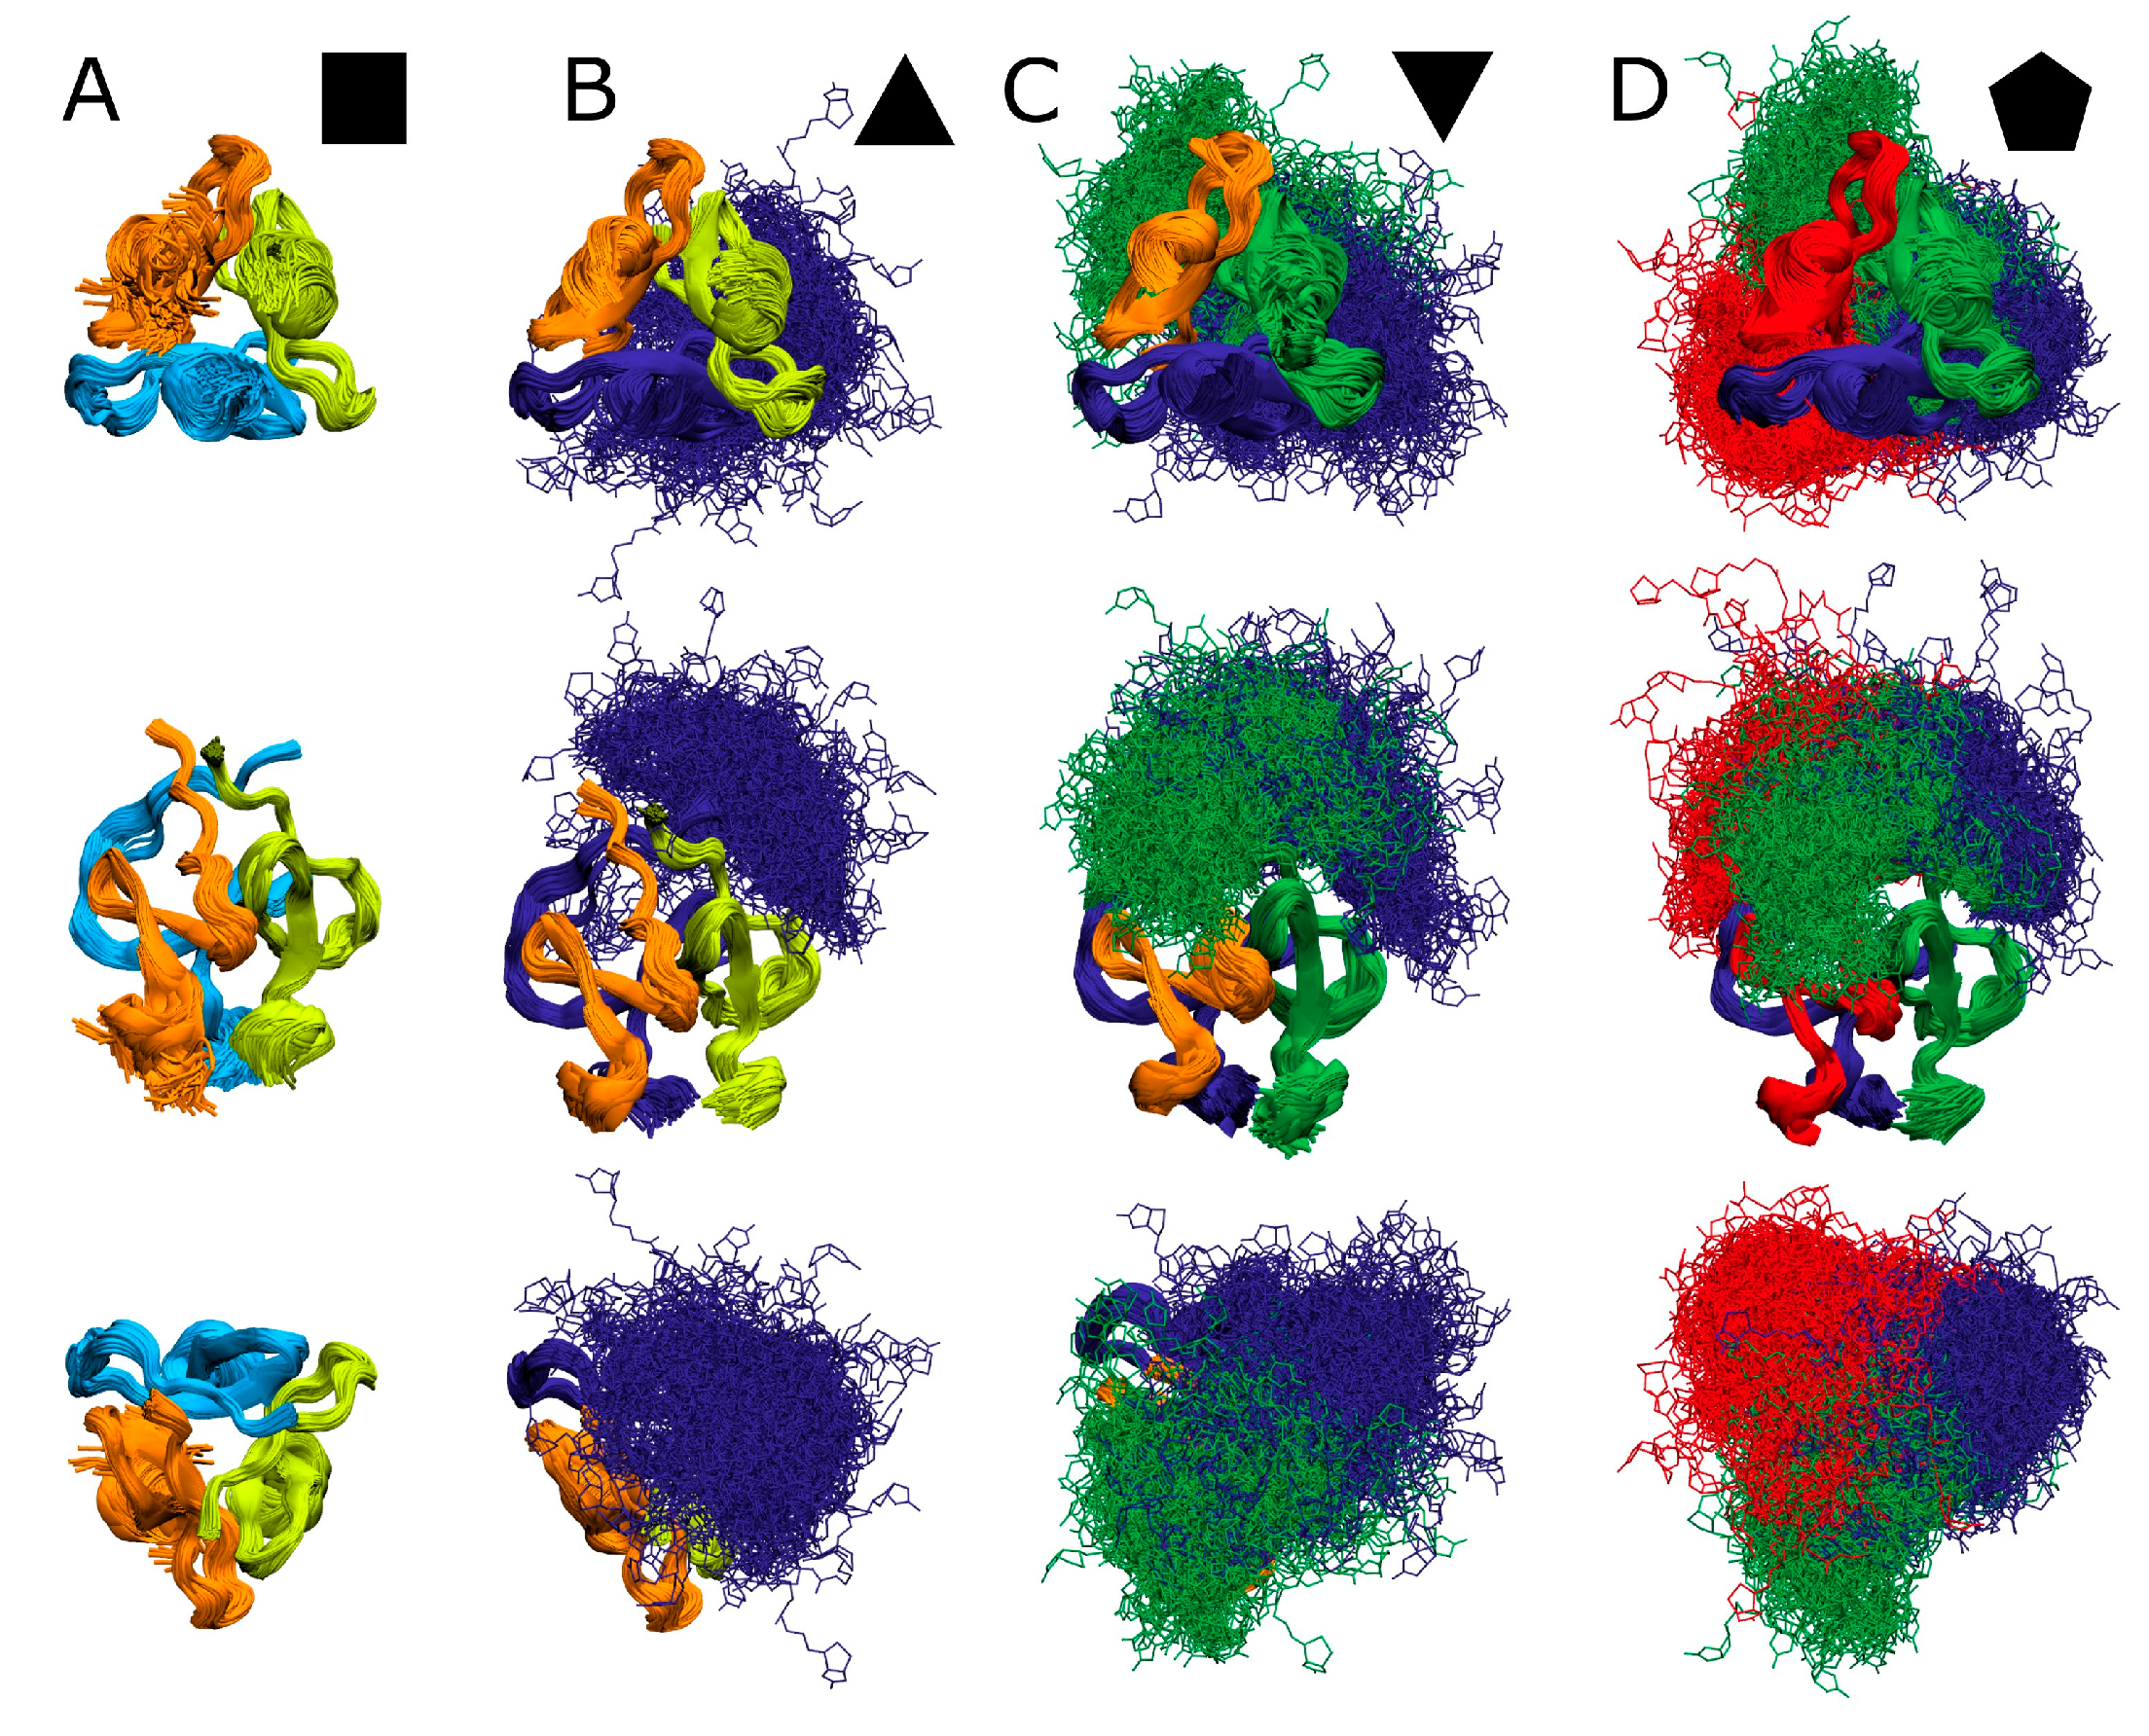
; singly biotinylated T4Ff hetero-trimer: ; doubly biotinylated T4Ff hetero-trimer: ; triply biotinylated T4Ff homo-trimer: . Each data point is the mean of two independent measurements, and standard deviations are shown by vertical bars. Curves were fitted using Boltzmann functions (cf. Table 2). For symbol assignments, see Table 1 and Figure 2. ). (B): Singly biotinylated T4Ff hetero-trimer (). (C): Doubly biotinylated T4Ff hetero-trimer (). (D): Triply biotinylated T4Ff homo-trimer (). Center panels show side views of molecules, top panels top views, and bottom panels bottom views of (biotinylated) T4Ff trimers. Monomers are color coded. Light color: T4Ff. Dark color: biotinylated T4Ff.
). (B): Singly biotinylated T4Ff hetero-trimer (). (C): Doubly biotinylated T4Ff hetero-trimer (). (D): Triply biotinylated T4Ff homo-trimer (). Center panels show side views of molecules, top panels top views, and bottom panels bottom views of (biotinylated) T4Ff trimers. Monomers are color coded. Light color: T4Ff. Dark color: biotinylated T4Ff.
). (B): Singly biotinylated T4Ff hetero-trimer (). (C): Doubly biotinylated T4Ff hetero-trimer (). (D): Triply biotinylated T4Ff homo-trimer (). Center panels show side views of molecules, top panels top views, and bottom panels bottom views of (biotinylated) T4Ff trimers. Monomers are color coded. Light color: T4Ff. Dark color: biotinylated T4Ff.


| Complex/ Protein | Symbols (a) | m/z (calcd) (b) | m/z (exp.) (b) | z | Atom No. (c) |
|---|---|---|---|---|---|
| F-F-F | | 1848.75 | 1848.49 | 5+ | 1299 |
| F-F-bF | | 1951.79 | 1951.52 | 5+ | 1371 |
| F-bF-bF | | 2054.84 | 2054.54 | 5+ | 1443 |
| bF-bF-bF | | 2157.89 | 2157.78 | 5+ | 1515 |
| F-F | / | 2054.05 | 2054.29 | 3+ | 866 |
| F-bF |  / / | 2225.79 | 2225.25 | 3+ | 938 |
| bF-bF |  / / | 2397.55 | 2398.04 | 3+ | 1010 |
| F | / / / | 1540.79 | 1540.41 | 2+ | 433 |
| bF |  / / / / | 1798.41 | 1797.98 | 2+ | 505 |
| No. | Complex/ Symbol (a) | Initial [%] (b) | Final [%] (c) | ∆CV50 [V] | dx [V] | Slope [%/V] | R2 |
|---|---|---|---|---|---|---|---|
| I | F-F-F | 98.78 | 0.00 | 17.03 | 1.70 | −14.54 | 0.999 |
| II | F-F-bF | 99.64 | 0.00 | 16.93 | 2.32 | −10.74 | 0.995 |
| III | F-bF-bF | 100.00 | 0.00 | 20.51 | 2.95 | −8.47 | 0.999 |
| IV | bF-bF-bF | 100.00 | 0.26 | 19.57 | 1.84 | −13.55 | 0.999 |
| No. | Complex/ Symbol (a) | [1/s] | [Ø] (b) | [kJ/mol] | [kJ/mol] | [kJ/mol] (c) |
|---|---|---|---|---|---|---|
| I | F-F-F | 2.17 × 10⁷ | 3.16 × 10⁻¹² | 65.61 | 3.32 | −62.29 |
| II | F-F-bF | 9.16 × 10⁸ | 3.58 × 10⁻¹² | 65.30 | 1.86 | −63.44 |
| III | F-bF-bF | 7.83 × 10⁸ | 3.62 × 10⁻¹² | 65.27 | 1.08 | −64.19 |
| IV | bF-bF-bF | 8.68 × 10⁶ | 3.06 × 10⁻¹² | 65.68 | 3.85 | −61.84 |
| No. | Complex/Symbol (b) | Ile 3 | Leu 23 | ||
|---|---|---|---|---|---|
| Average | Std. Dev. | Average | Std. Dev. | ||
| I | F-F-F | 6.18 | 0.22 | 9.43 | 0.50 |
| II | F-F-bF | 6.20 | 0.21 | 9.50 | 0.49 |
| III | F-bF-bF | 6.26 | 0.22 | 9.64 | 0.51 |
| IV | bF-bF-bF | 6.33 | 0.26 | 9.52 | 0.52 |
Disclaimer/Publisher’s Note: The statements, opinions and data contained in all publications are solely those of the individual author(s) and contributor(s) and not of MDPI and/or the editor(s). MDPI and/or the editor(s) disclaim responsibility for any injury to people or property resulting from any ideas, methods, instructions or products referred to in the content. |
© 2024 by the authors. Licensee MDPI, Basel, Switzerland. This article is an open access article distributed under the terms and conditions of the Creative Commons Attribution (CC BY) license (https://creativecommons.org/licenses/by/4.0/).
Share and Cite
Koy, C.; Röwer, C.; Thiesen, H.-J.; Neamtu, A.; Glocker, M.O. Intact Transition Epitope Mapping—Force Interferences by Variable Extensions (ITEM-FIVE). Biomolecules 2024, 14, 454. https://doi.org/10.3390/biom14040454
Koy C, Röwer C, Thiesen H-J, Neamtu A, Glocker MO. Intact Transition Epitope Mapping—Force Interferences by Variable Extensions (ITEM-FIVE). Biomolecules. 2024; 14(4):454. https://doi.org/10.3390/biom14040454
Chicago/Turabian StyleKoy, Cornelia, Claudia Röwer, Hans-Jürgen Thiesen, Andrei Neamtu, and Michael O. Glocker. 2024. "Intact Transition Epitope Mapping—Force Interferences by Variable Extensions (ITEM-FIVE)" Biomolecules 14, no. 4: 454. https://doi.org/10.3390/biom14040454
APA StyleKoy, C., Röwer, C., Thiesen, H.-J., Neamtu, A., & Glocker, M. O. (2024). Intact Transition Epitope Mapping—Force Interferences by Variable Extensions (ITEM-FIVE). Biomolecules, 14(4), 454. https://doi.org/10.3390/biom14040454