Abstract
Atomic force microscopy (AFM) imaging enables the visualization of protein molecules with high resolution, providing insights into their shape, size, and surface topography. Here, we use AFM to study the aggregation process of protein S100A9 in physiological conditions, in the presence of calcium at a molar ratio 4Ca2+:S100A9. We find that S100A9 readily assembles into a worm-like fibril, with a period dimension along the fibril axis of 11.5 nm. The fibril’s chain length extends up to 136 periods after an incubation time of 144 h. At room temperature, the fibril’s bending stiffness was found to be Nm2, indicating that the fibrils are relatively flexible. Additionally, the values obtained for the Young’s modulus ( Pa and Pa) are four orders of magnitude lower than those typically reported for canonical amyloid fibrils. Our findings suggest that, under the investigated conditions, a distinct aggregation mechanism may be in place in the presence of calcium. Therefore, the findings reported here could have implications for the field of biomedicine, particularly with regard to Alzheimer’s disease.
1. Introduction
Among the various techniques available for imaging biological systems, Atomic Force Microscopy (AFM) stands out due to its remarkable versatility, high resolution and precision. Since its invention in the mid-1980s [1], AFM imaging and spectroscopy have been used to study a variety of biological systems such as antigen/antibody binding [2], protein assemblies [3] and biomolecular interactions [4], lipid layers [5], DNA/small peptides [6], cells [7], bacteria [8,9], yeast [10,11] soft-matter systems [12] and also other systems such as nanocomposites [13] and lignocellulosic polymers [14]. AFM revolutionized the field of structural biology by providing high-resolution images of proteins in their native environments, without requiring extensive sample preparation [15]. When studying biomolecular systems, this feature makes AFM more attractive than other scanning probes microscopy (SPM) techniques, or electron microscopies (TEM) [16].
Protein aggregation is a complex biomolecular process that results from protein–protein association [17]. A possible outcome of protein aggregation is the formation of insoluble amyloid fibrils, which are often associated with the onset of the so-called conformational disorders. While Parkinson’s and Alzheimer’s diseases are, perhaps, the most well-known examples, more than 40 pathologies have been linked to amyloids [18]. According to recently published epidemiological data, there are 10 million new cases of neurological disorders worldwide [19], with 276 million of disability-adjusted life years (DALY) patients exhibiting cognitive decline [20]. Furthermore, it is anticipated that neurodegenerative illnesses will account for roughly 9.0 million deaths annually and that this number will nearly triple over the next three decades [21].
The outcome of protein self-association is not necessarily amyloid since it may also lead to amorphous aggregates lacking a well-defined structure. Intermediate species formed along the aggregation cascade include soluble and insoluble oligomers, protofibrils, and fibrils [22]. In the case of protein aggregation, AFM stands out as a particularly powerful tool, enabling the visualization and the characterization of protein aggregates with high resolution and detail. In this framework, it is relevant to use AFM with ultrashort cantilevers to gather AFM images in a few seconds (high-speed AFM) [23] or the molecular recognition imaging working at low-force regimes that makes it possible to localize the single protein:ligand interaction events [24].
Additionally, AFM provides accurate information about the size, shape, and morphology of oligomers, fibrils, and other aggregated species formed in real time [25].
Protein S100A9 is a member of the family of the so-called S100 proteins, which are calcium-binding proteins [26,27]. The latter are signaling molecules that play a plethora of intra- and extracellular functions, including signal transduction, cell differentiation, proteostasis, and inflammation, just to mention a few examples [28]. The S100A9 protein is abundant in the brain, and increased levels of S100A9 have been found in the brains of Alzheimer’s Disease (AD) patients [29], making it a robust biomarker for AD [30]. Some studies have shown that S100A9 can interact with other proteins and modulate their aggregation propensity (see, e.g., [31,32]). Moreover, it has been reported that S100A9 is able to rapidly form amyloid fibrils under physiological conditions in the absence of calcium [33]. Interestingly, recent results indicate that calcium concentration is an important modulator of the S100A9 fibrillation, being actually able to inhibit the formation of amyloid fibrils [34].
Here, we use AFM to study the dynamics, morphological and mechanical properties of oligomeric fibrils resulting from S100A9 aggregation in physiological conditions in the presence of calcium at a molar ratio of 4Ca2+:S100A9.
2. Materials and Methods
2.1. Sample Preparation
Human recombinant S100A9 protein was purified to homogeneity as previously described [35,36] and was a kind gift from Dr. Cláudio Gomes (BioISI, Faculdade de Ciências, Universidade de Lisboa), supplied in the native apo homodimeric state (100 M) and as oligomers formed upon incubation of 100 M S100A9 in 50 mM Tris-HCl, pH 7.4 with a 4-fold excess of CaCl2 at 37 °C under continuous agitation (250 rpm).
2.2. Mica Preparation and AFM Measurements
Approximately 10 L of each S100A9 solution was deposited onto freshly cleaved mica (Agar Scientific, Stansted, UK). Before imaging, the samples were allowed to rest in air for about 20 min to ensure that both the fibrils and S100A9 proteins remained attached to the mica surface. Afterwards, they were rinsed with Milli-Q water to remove the buffer and salt components and dried in air at room temperature.
The topography/morphology of the samples was characterized by AFM using a Pico SPM LE (Molecular Imaging) system. The images were obtained in air at room temperature, first with HQ:NSC 35/Hard/Al BS (force constants 5.4 N/m, 8.9 N/m, and 16 N/m, tip radius < 20 nm) µmasch cantilevers in dynamic mode which reduces the damage to biological samples. Some selected samples were analyzed with HiRes-C14/Cr–Au (force constant 5 N/m, tip radius < 1 nm) probes which are optimized for imaging relatively soft samples and obtain a better phase contrast reducing surface deformations caused by the AFM tip. To confirm the height measurements of the structures detected under dry conditions, AFM images of the samples in an aqueous environment were also obtained.
2.3. Data Analysis
For each sample, the existing structures were systematically imaged, and the images analyzed. Images were processed using Gwyddion v2.56 [37].
2.3.1. Height Measurements
Height measurements were made from scan sizes of 5 × 5 m2, 2 × 2 m2, or 1 × 1 m2 by measuring height profiles normal to the fibril axis and using the full width at half maximum (FWHM) of the peak height of the profile. Heights for the different fibril species were obtained by averaging measurements from >20 individual fibrils, with errors being calculated as two standard deviations (2) from the mean.
2.3.2. Mechanical Properties
In what follows, we model a protein fibril as a polymer chain in two dimensions. The bending stiffness, B, of a polymeric chain can be obtained from the persistence length, , according to
where is the Boltzmann constant and T is the absolute temperature. It can be shown [38] that, in two dimensions, can be calculated by using the end-to-end distance, R, and the contour length, , according to the equation
On the other hand, the Young’s modulus, E, can be obtained from the bending stiffness [39] by using
where I is the area moment of inertia (or second moment of inertia) of the polymer chain. In the case of a filled ellipse with radius a along the x-axis and radius b along the y-axis with respect to an axis running through the center of the ellipse and parallel to the x-axis, the components of I are
and with respect to the perpendicular axis is
The polymer’s contour length, , and the end-to-end distance, R, were measured with Gwyddion [37].
To obtain the fibrils’ persistence length, , a fit of the worm-like chain model (2) to the experimental data was performed with Mathematica [40].
3. Results and Discussion
3.1. The S100A9 Protein
S100 proteins adopt different quaternary structures, including homo- and heterodimers, and high order multimers [27]. The native structure of the S100A9 protein is an homodimer of two S100A9 monomers. Each monomer is composed of two EF-hand motifs (i.e., helix–loop–helix structures capable of binding calcium ions). The N-terminal motif comprises helices I and II and is connected to the C-terminal motif, which comprises helices III and IV, by a short flexible linker. The two EF-hand motifs provide two calcium (Ca2+) binding sites (Figure 1).
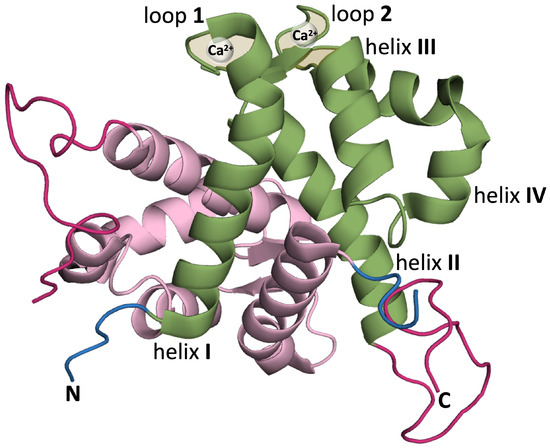
Figure 1.
Ribbon representation of homodimeric S100A9 protein (PDB:ID 5I8N) [41] using PyMol [42] (version 2.4.0) with one of the monomers colored in green and the other in pink. The monomer colored in green highlights helix I (Q7-S23), helix II (Q34-D44), calcium binding loop 1 (V24-N33), helix III (E56-L66) (helix E of canonical EF hand), calcium binding loop 2 (D67-S75), and helix IV (F76-M94) (helix F of canonical EF hand) [28]. In each monomer, the N-terminal is shown in blue and the (unstructured) C-terminus in dark pink.
3.2. Formation of Fibrillar Oligomers
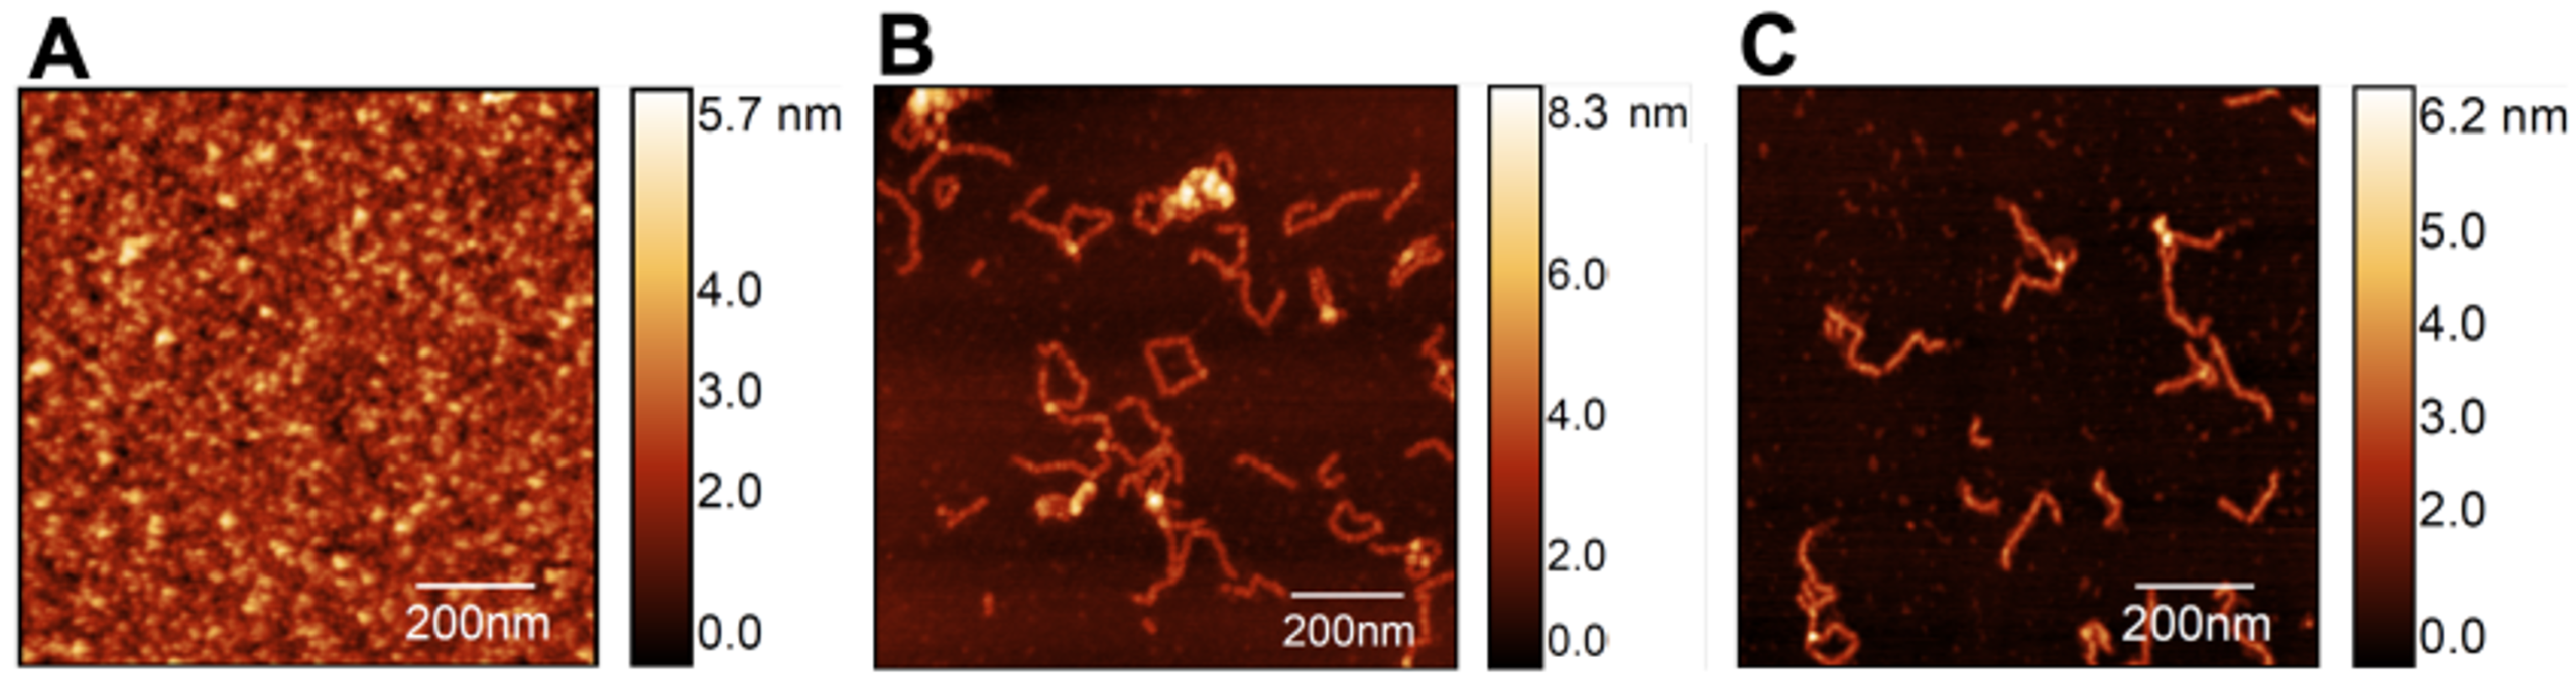
Mica surfaces with S100A9 were analyzed with AFM to investigate the dynamics of self-association starting from the apo S100A9 native dimers with a concentration of 100 M (Figure 2A). The latter were incubated at 37 °C (pH 7.4) with an agitation speed of 250 revolutions per minute (rpm) for up to 48 h, giving rise to a heterogeneous equilibrium population of soluble oligomers differing in size and morphology. It is possible to observe relatively long, slender filaments with a worm-like shape (i.e., worm-like fibrils), as well as some closed-ring shapes and a few branched structures (Figure 2B).
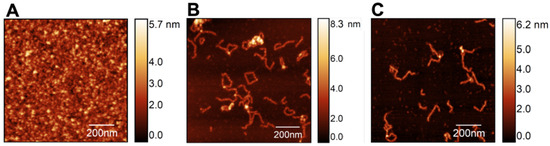
Figure 2.
AFM imaging of S100A9 fibrillar structures formed at 37 °C (pH 7.4) starting from native dimers (A) incubated in the absence (B) and in the presence (C) of calcium at a molar ratio of 4Ca2+:S100A9. Scan sizes are 1 × 1 m2.
It has been shown that Ca2+ ions play a crucial role in modulating the structure, function, regulation, signaling activity [35], and self-association [34] of S100A being able to suppress the formation of amyloid fibrils. Here, we focused on the self-association of S100A9 in the presence of calcium at a molar ratio of 4Ca2+:S100A9 to access its impact on the formation and morphology of fibrillar structures. We find that a similar equilibrium population is observed after 48 h both in the absence (Figure 2B) and in the presence of calcium (Figure 2C), indicating that, when present at the molar ratio of 4Ca2+:S100A9, calcium has no noticeable effect on the morphology of the oligomer’s population.
To gain further insight on the dynamics of self-association in the presence of calcium, we performed a time-resolved AFM analysis. In particular, AFM images were collected after 5 h, 15 h, 24 h, 48 h, 72 h, and 144 h (Figure 3). For each incubation time, at least 5 samples were prepared, and a minimum of 20 individual fibrils were analyzed.
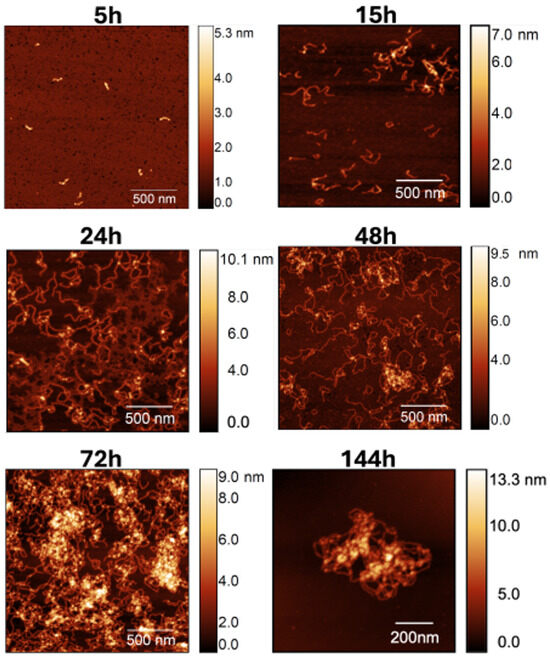
Figure 3.
AFM images of S100A9 fibril population observed for increasing incubation time in the presence of calcium at a molar ratio of 4Ca2+:S100A9. Scan sizes are 2 × 2 m2 for 5, 15, 24, 48, and 72 h, and 1 × 1 m2 in the 144 h image.
It is possible to see that a significant number of the worm-like fibrils is already formed after 15 h, and that the former increases significantly afterwards. Indeed, due to the large quantity of material accumulated after 144 h of incubation time, obtaining high-quality images proved to be challenging. Consequently, we present an image of a sample fibril within a 1 × 1 m2 area to provide an example of a typical observed structure.
3.3. Fibril Height
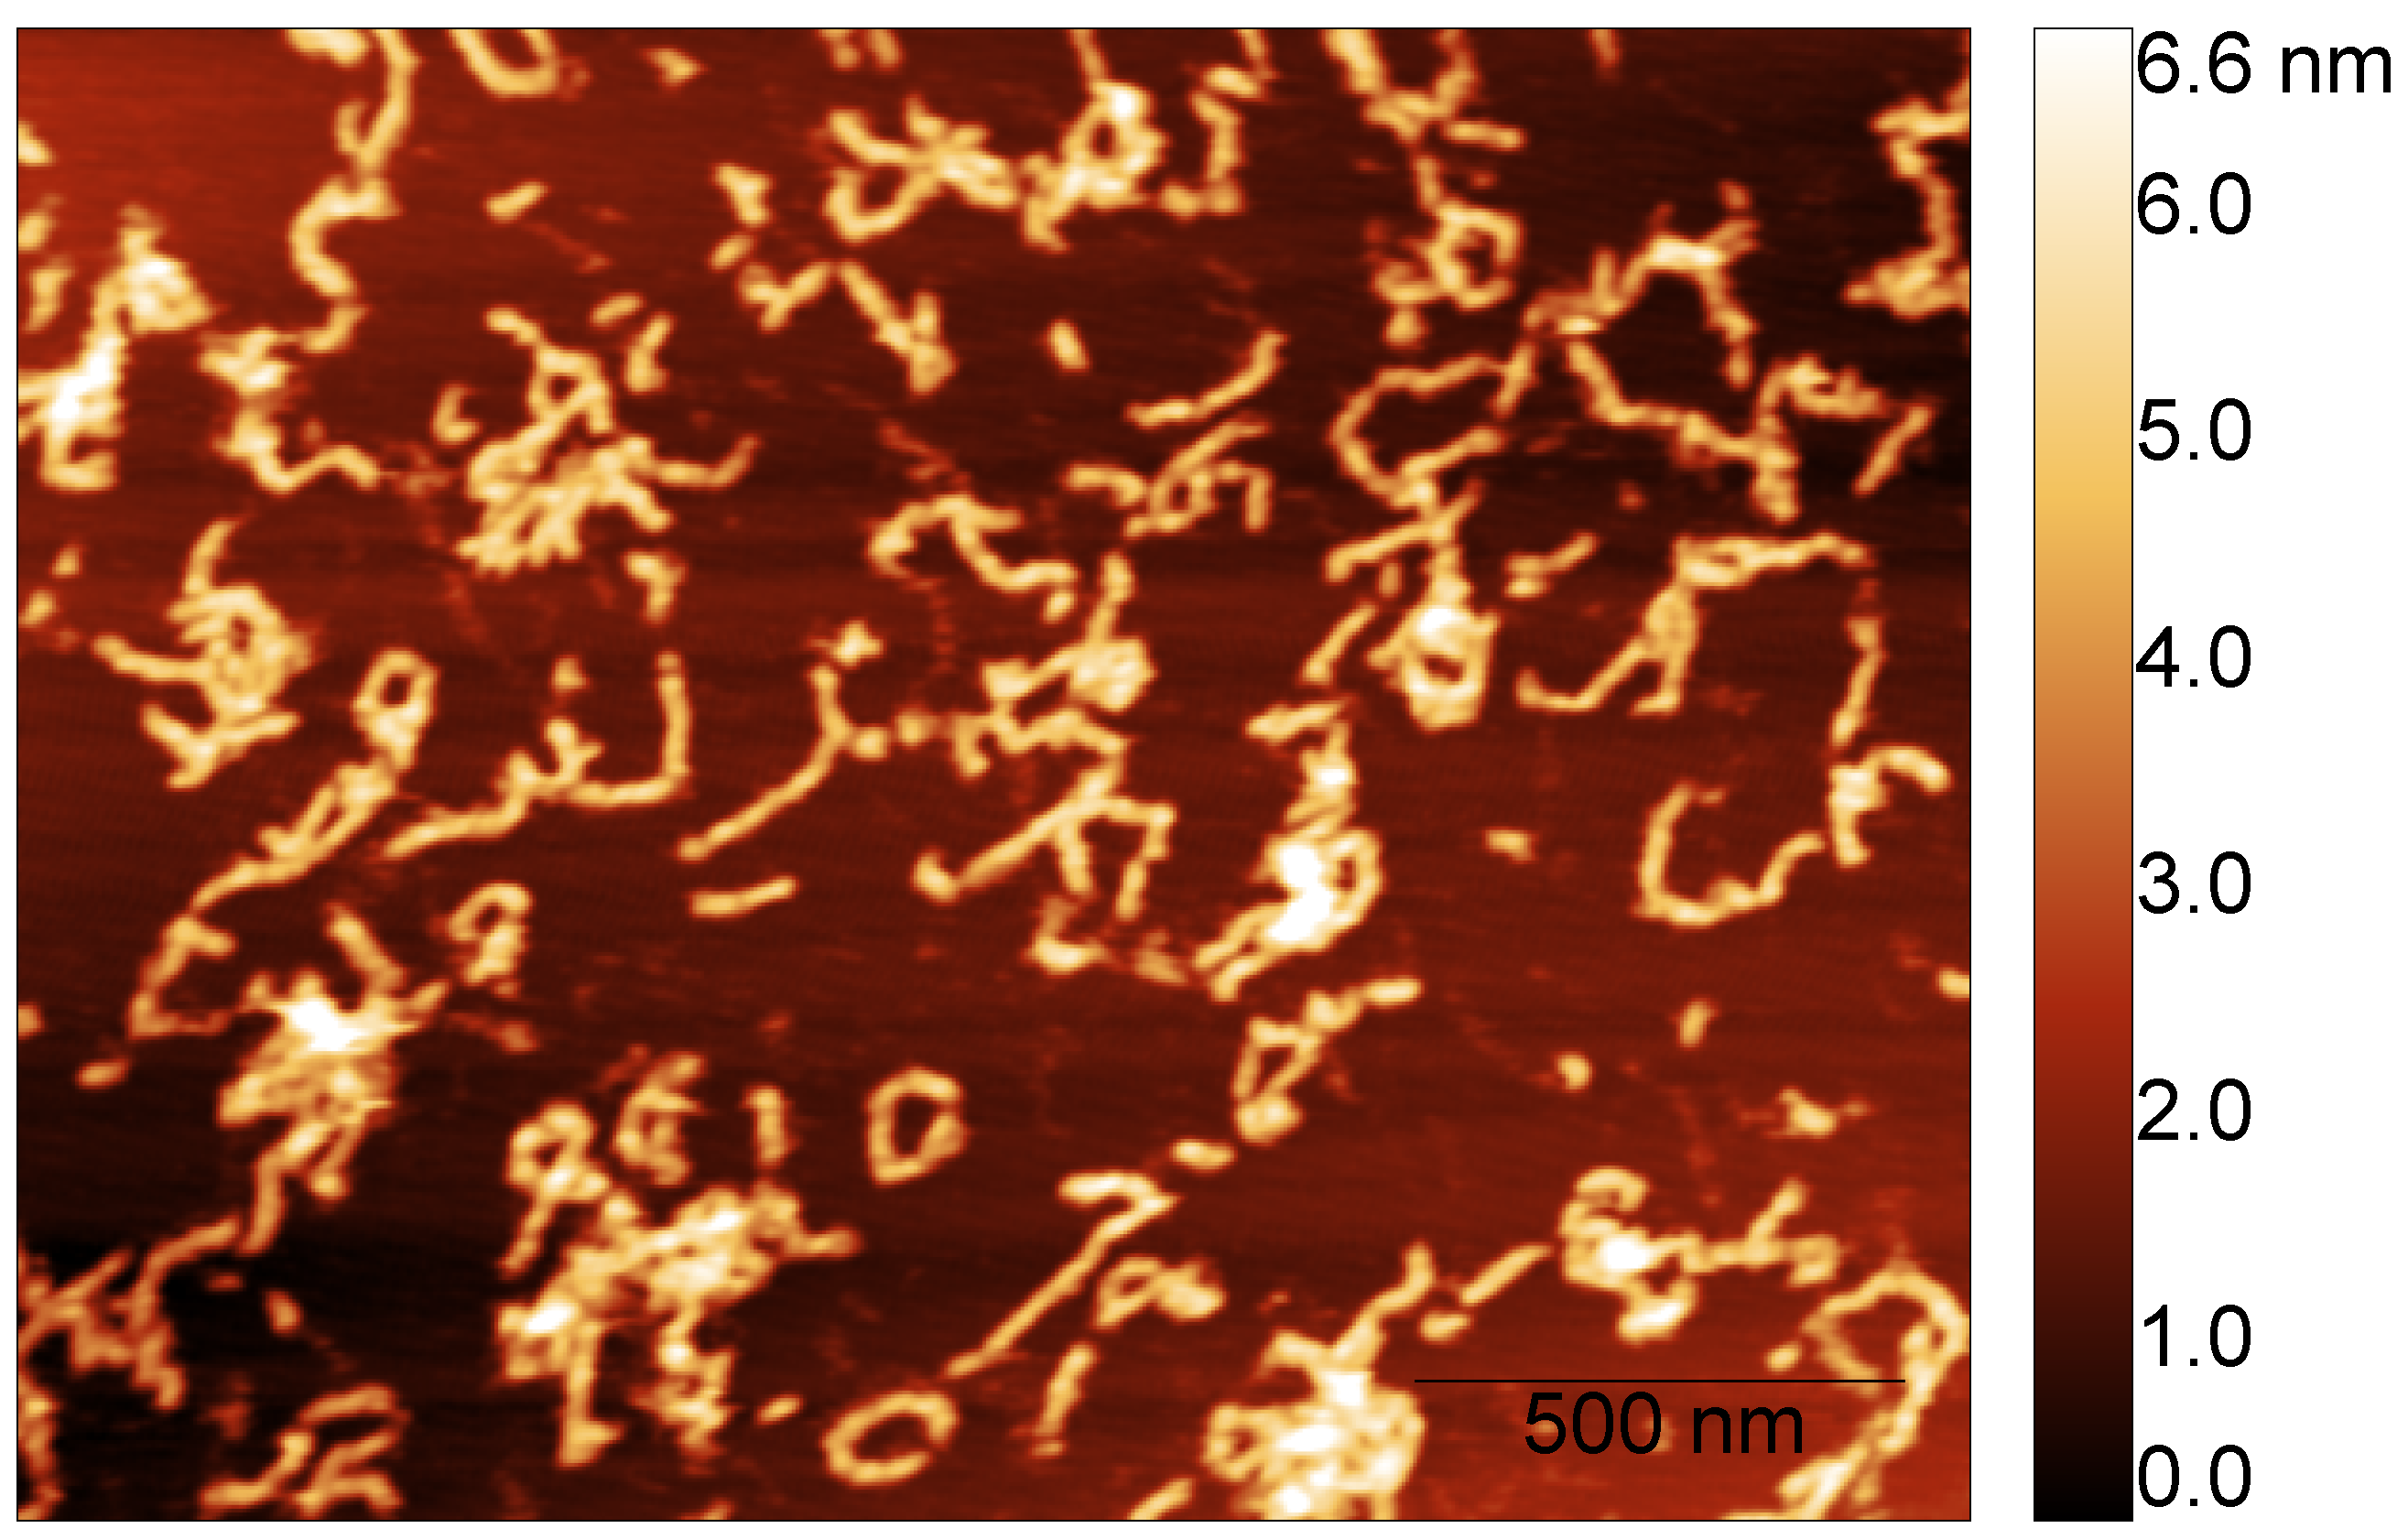
To measure the fibril’s height, we considered the images corresponding to the S100A9 + 4Ca2+ fibril populations formed after different incubation times. AFM imaging and AFM statistical analysis show that the fibril’s height is conserved over time. S100A9 self-associates into fibrils with median height in the AFM images of nm after 24 h (dry) and nm after 48 h (liquid) (Figure 4).

Figure 4.
Example of S100A9 fibril population imaged in liquid after 48 h of incubation time in the presence of calcium at a molar ratio of 4Ca2+:S100A9.
3.4. Period and Fibril Length
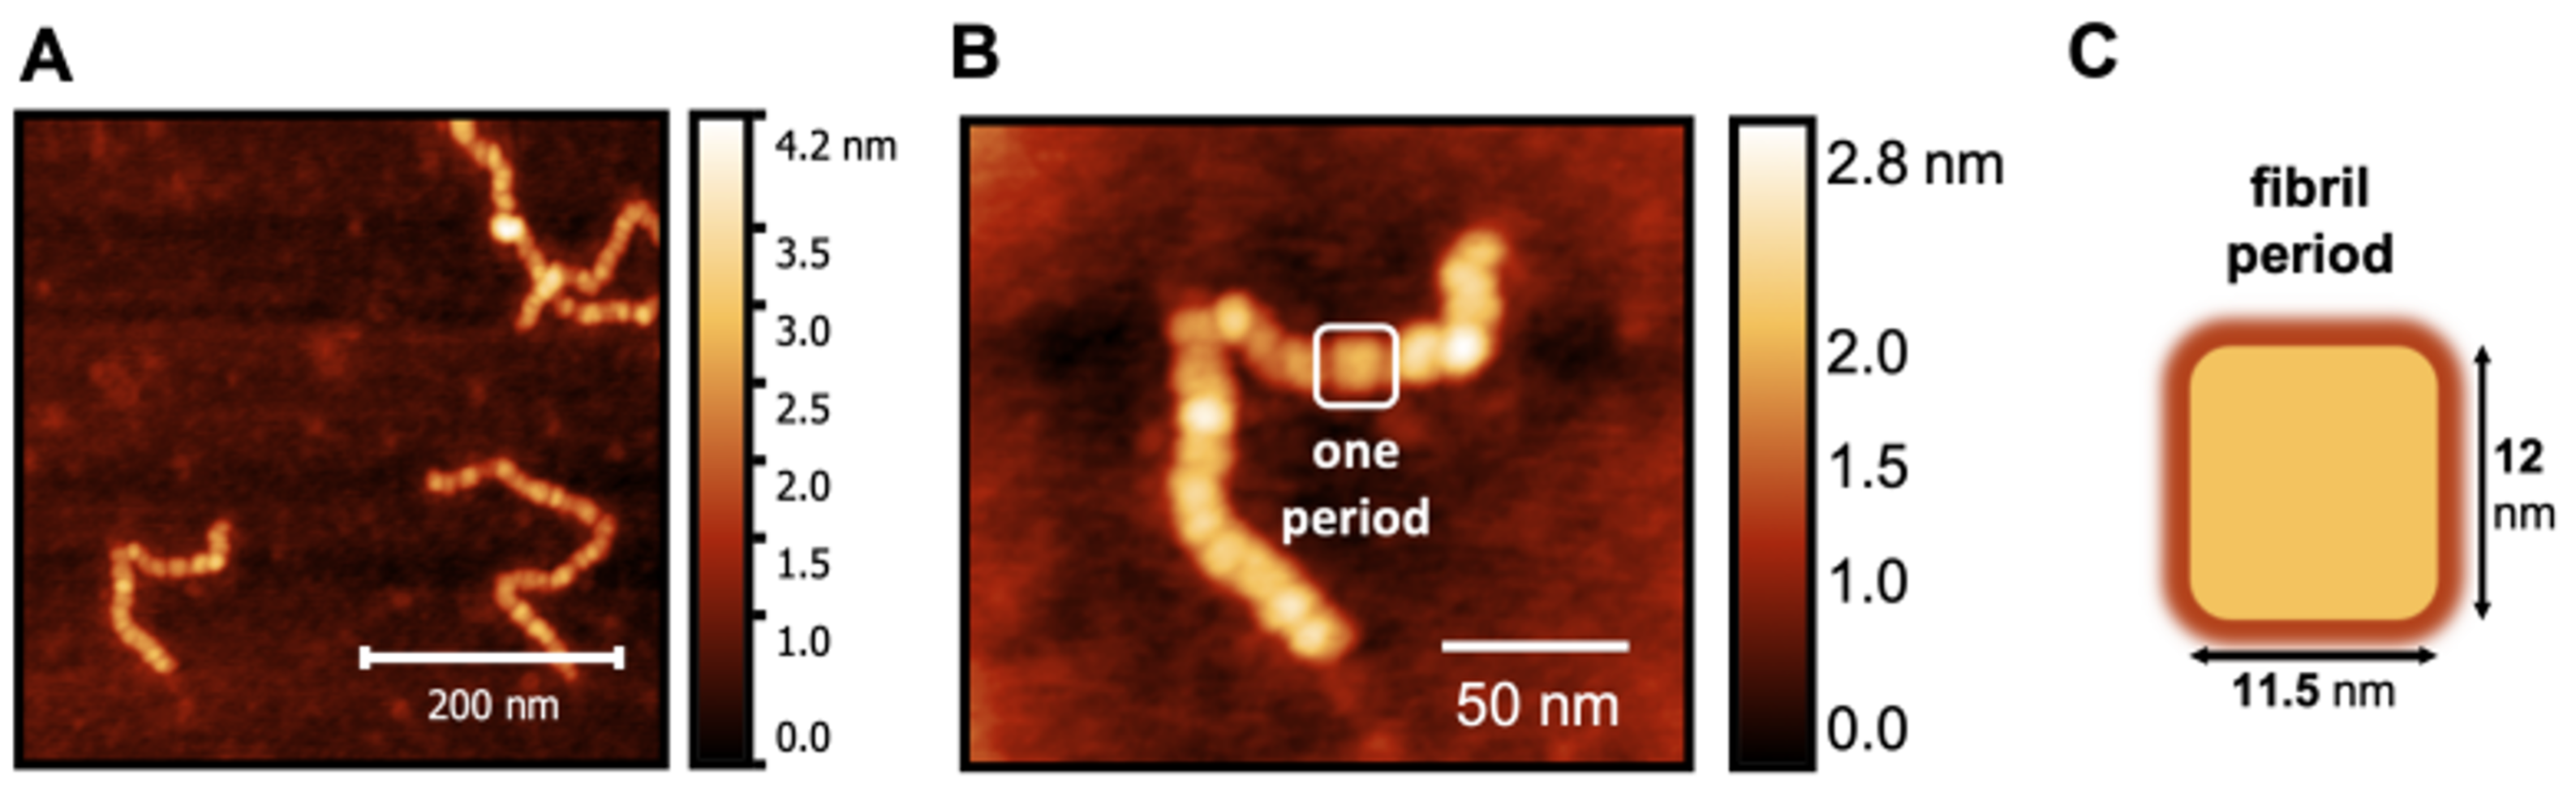
To obtain a more fine-grained picture of the worm-like fibrillar structures, we considered the images corresponding to 24 h because the number of species formed in the corresponding samples makes it possible to isolate and perform a detailed analysis of the structures therein. It is possible to see that the worm-like fibrillar structures appear to be tandem repeats of a geometrically regular unit (Figure 5) with dimensions 12 ± 2 nm (width) and 11.5 ± 1 nm (width along the other direction), which will be taken as the fibril period. Having identified the fibril period, we take the fibril length as the number of periods. We observe a moderate linear correlation between fibril length and incubation time (Figure 6) starting from 6 periods (5 h) to 136 periods (144 h).

Figure 5.
AFM image of a magnified S100A9 fibril (A,B) formed after 24 h showing that it consists of a tandem repeat of geometrically regular units that we identify as the fibril period (C).
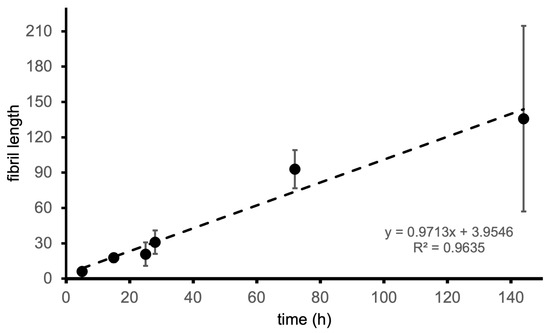
Figure 6.
Fibril length (measured as the number of periods) as a function of incubation time.
3.5. Mechanical Properties and Biophysical Characterization of Fibrillar Oligomers
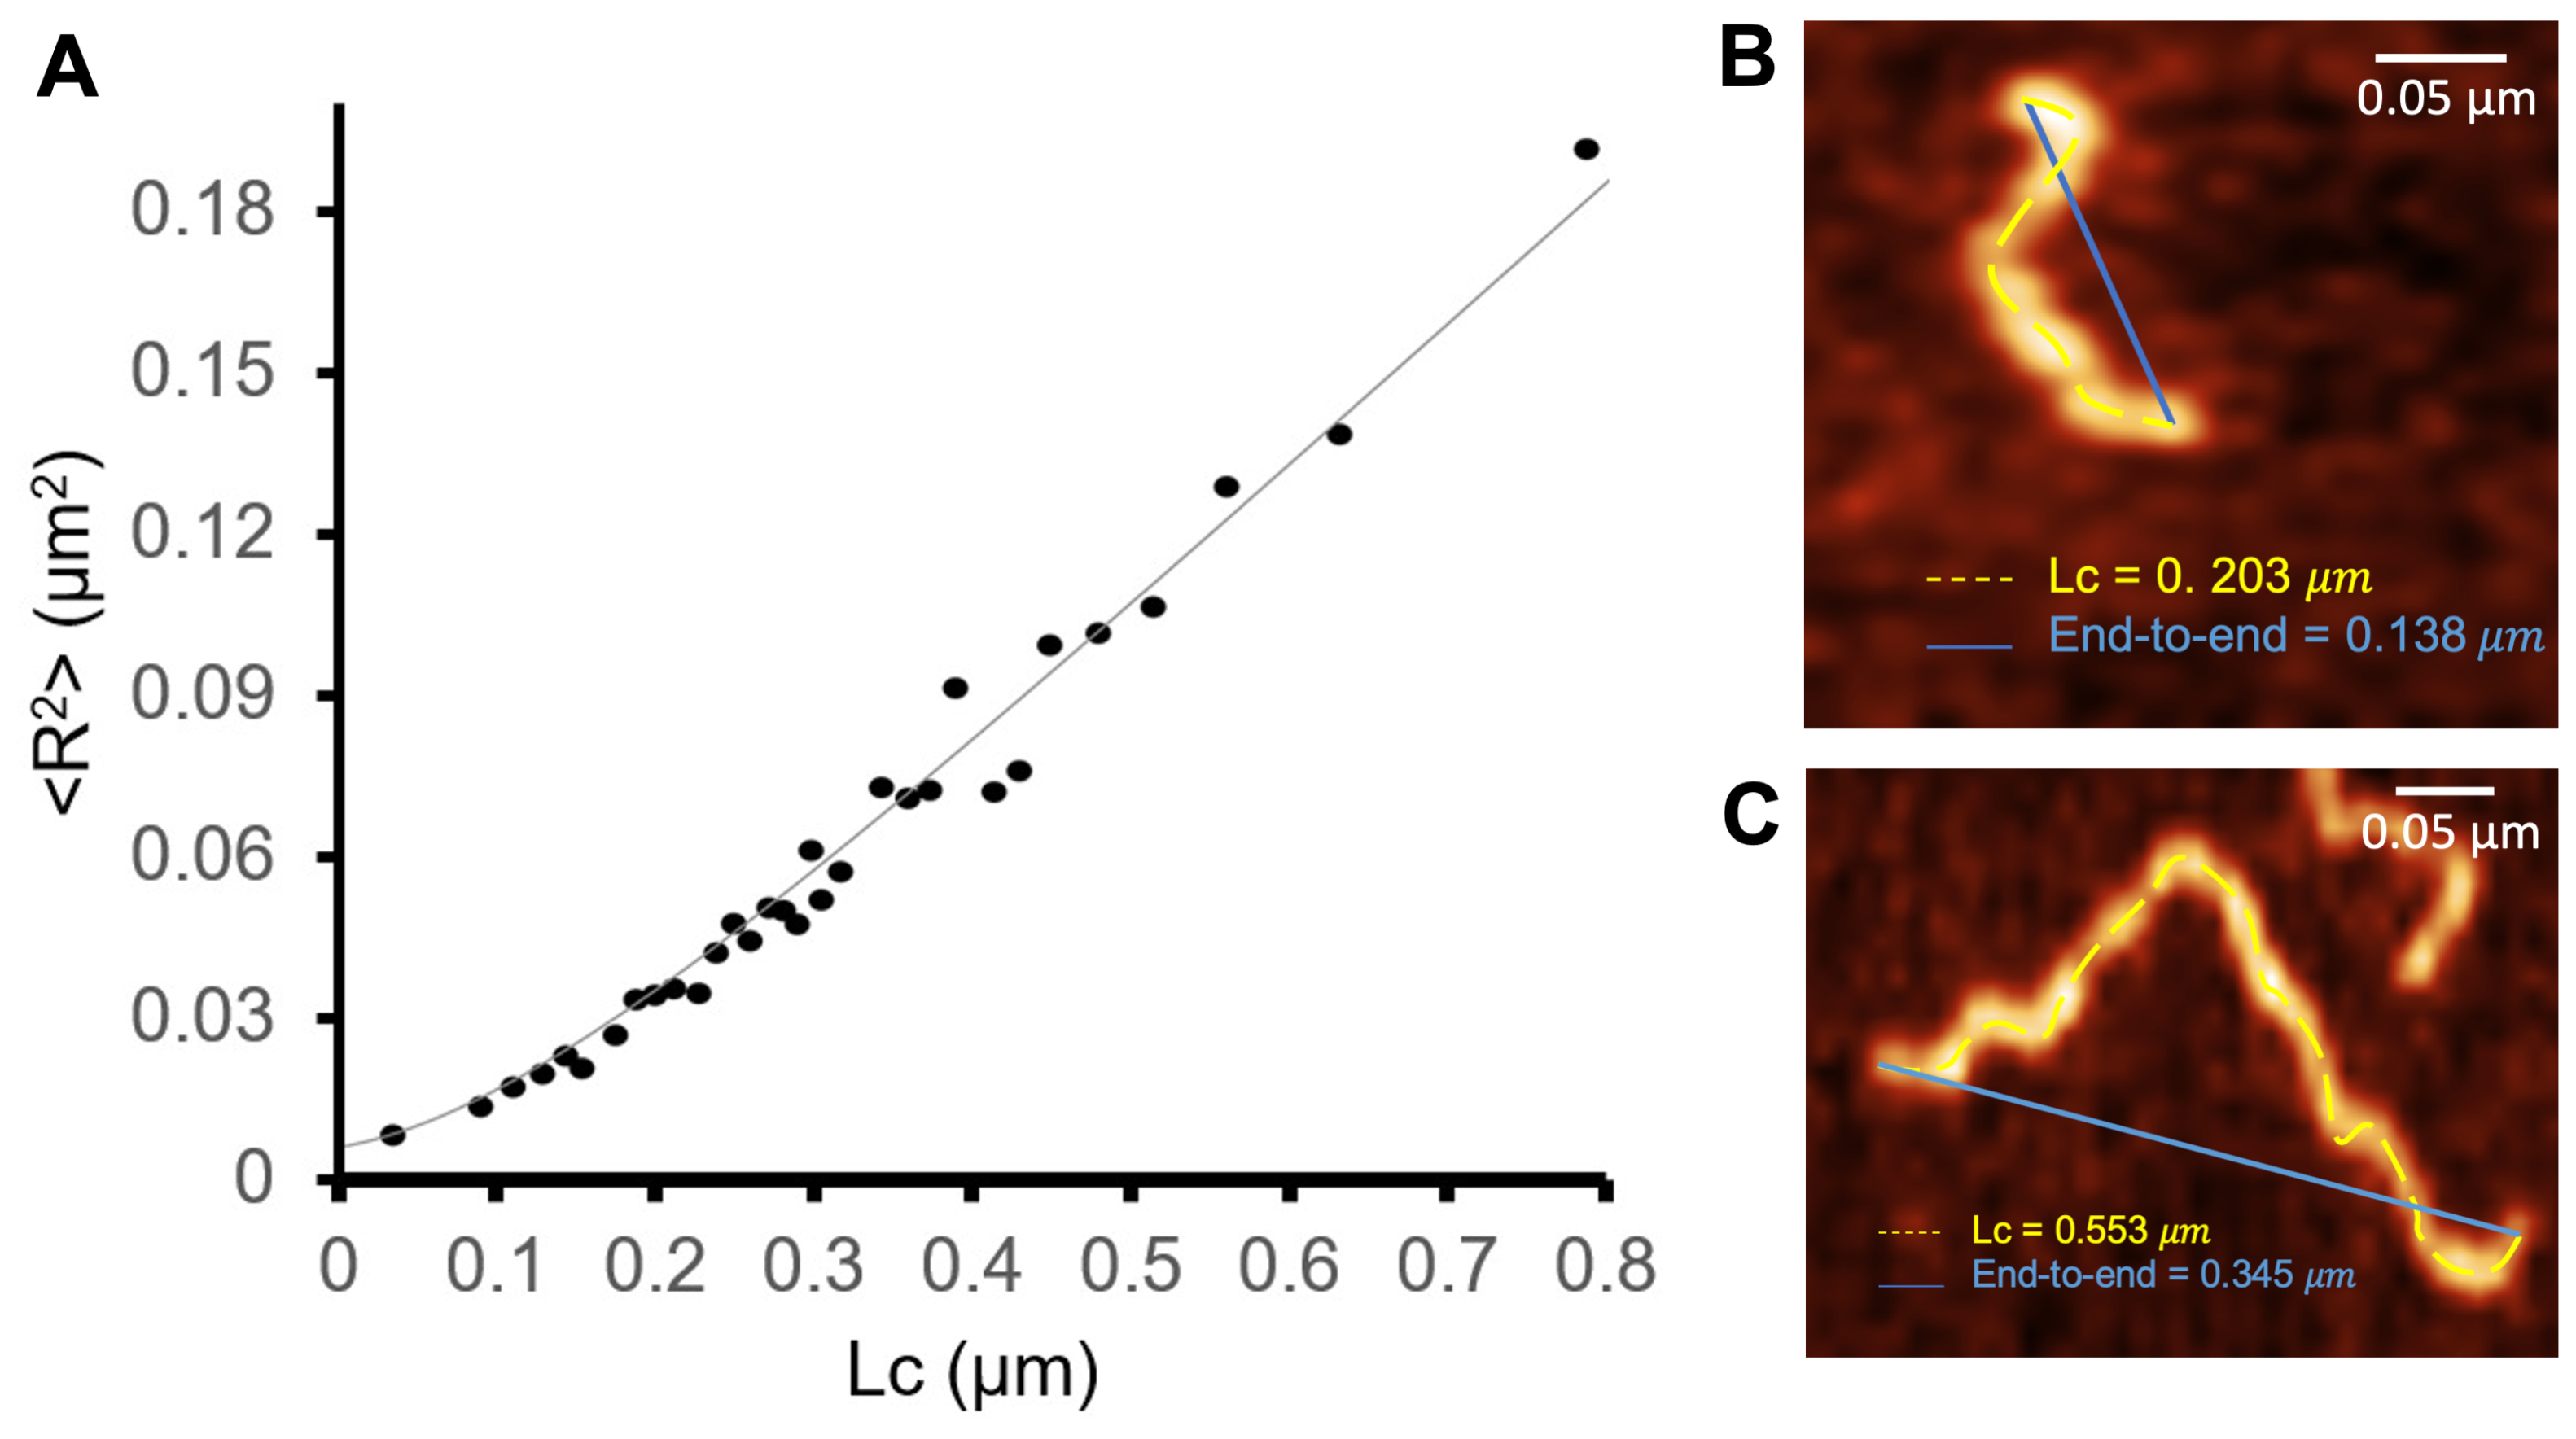
Assuming that the fibrils interact weakly with the mica surface and relax to a two-dimensional equilibrium conformation, the persistence length can be obtained from the shape of the fibril, as given by Equation (2). To measure , we considered a sample composed of 354 fibrils obtained after 48 h. The contour length and end-to-end distance of each fibril were measured with Gwyddion. Maximum height measurements were used to characterize the fibril’s cross-sections. The latter were used to evaluate the moments of inertia as given by Equations (4) and (5). By performing a statistical analysis of AFM images, we were able to precisely determine the cross-section of S100A9 fibrils.
Figure 7 reports the dependence of on .

Figure 7.
Dependence of the mean square value of the end-to-end distance as a function of the contour length. The fit corresponds to the worm-like chain model in two dimensions, ; nm ( = 1.6 nm); Nm2; was used as a fitting parameter (A). The end-to-end distance and contour length (B,C) were measured with Gwyddion in images obtained with 48 h of incubation time.
The persistence length, , characterizes the flexibility and stiffness of a polymer chain. It quantifies how effectively the polymer maintains its initial direction over a certain distance upon being perturbed by thermal energy. A longer persistence length indicates a stiffer polymer chain, i.e., one that tends to maintain its shape and orientation over greater distances, while a shorter persistence length implies a more flexible and easily deformable polymer chain. In the S100A9 fibrils, the measured persistent length is nm nm), showing that they are relatively flexible. This value of is of the same order of magnitude but 23% smaller as that reported in [43] for worm-like -lactoglobulin amyloid fibrils, and 1.7 orders of magnitude smaller that the persistence length of straight amyloid fibrils formed by the same protein.
The bending stiffness describes a material’s resistance to bending deformation when subjected to an external force. It represents the ability of a structural element to resist bending and maintain its shape under bending loads. At room temperature, the bending stiffness was found to be Nm2 (Figure 7). This rather low value supports the view that the S100A9 fibrils are relatively flexible and can easily undergo bending deformations.
The Young’s modulus quantifies the stiffness of a material and its resistance to deformation when subjected to tensile or compressive forces within the elastic range. It is a scalar quantity that represents the ratio of stress to strain within the material. We found that, along the x direction, the Young’s modulus is Pa, being Pa along the y direction (with an uncertainty lower than Pa). These values for the Young’s modulus are orders of magnitude lower than those reported in the literature for amyloid fibers (3–20 GPa) [25,44,45], indicating an atypical nature of S100A9 fibrils formed in the presence of calcium.
4. Conclusions
Conventional AFM imaging makes it possible to identify and characterize distinct species formed at particular stages of protein aggregation [46,47]. It was reported that, in the absence of calcium, S100A9 self-associates into amyloid fibrils following a two-step nucleation-autocatalytic growth model [33]. Here, we used AFM imaging to explore the aggregation pathway of the S100A9 protein in the presence of calcium in physiological conditions. We found that, in these conditions, S100A9 readily forms worm-like fibrils. Furthermore, the average fibril’s length, measured as the number of periods, exhibits a moderately linear dependence on the incubation time. By calculating selected mechanical properties, we found that the fibrils are rather flexible, being able to undergo bending deformations. The fibril’s mechanical properties, in particular the Young’s modulus, are quantitatively distinct from those of typical amyloid fibrils, suggesting that calcium may modulate S100A9 self-association and assembly. Previous reports [34] showed that the presence of calcium at high concentration (in the mM range and, therefore, well above the M physiological threshold [48]) inhibits the formation of S100A9 amyloid fibrils. Overall, these results suggest that, in the presence of calcium, S100A9 worm-like fibrils may follow a different aggregation pathway, presumably because they possess unique structural characteristics compared to amyloid fibrils. Further research into the specific structural features (e.g., to obtain a fine-grained description of the fibril’s period) and functional implications of these worm-like fibrils could shed light on their biological significance and potential applications in the field of biomedicine, in particular in the context of Alzheimer’s disease.
Author Contributions
Conceptualization, A.P.C., P.F.N.F. and M.S.R.; data acquisition, A.P.C. and C.M.; formal analysis, A.P.C., C.M., P.F.N.F. and M.S.R.; writing—original draft preparation, A.P.C.; writing—review and editing, P.F.N.F.; visualization, A.P.C., C.M. and P.F.N.F. All authors have read and agreed to the published version of the manuscript.
Funding
This research was funded by Fundação para a Ciência e a Tecnologia through project UIDB/04046/2020 (https://doi.org/10.54499/UIDB/04046/2020 accessed on 1 January 2020), UIDP/04046/2020 (10.54499/UIDP/04046/2020). This study was also partly supported by the European Union (TWIN2PIPSA—Twinning for Excellence in Biophysics of Protein Interactions and Self-Assembly, GA 101079147). A.P.C. thanks FCT for her work contract CEECIND/00031/2017/CP1387/CT0028 (https://doi.org/10.54499/CEECIND/00031/2017/CP1387/CT0028 accessed on 1 October 2019).
Institutional Review Board Statement
Not applicable.
Informed Consent Statement
Not applicable.
Data Availability Statement
Data are contained within the article.
Acknowledgments
We would like to express our gratitude to Cláudio Gomes and Mariana Romão from the Protein Misfolding and Amyloids in Biomedicine Lab at BioISI—Faculdade de Ciências, Universidade de Lisboa, for generously providing the S100A9 samples used in this study. The assistance and expertise offered by Cláudio Gomes’s lab were invaluable in the preparation and analysis of the samples.
Conflicts of Interest
The authors declare no conflicts of interest.
Abbreviations
The following abbreviations are used in this manuscript:
| AD | Alzheimer’s disease |
| AFM | Atomic force microscopy |
| TEM | Transmission electron microscopy |
| SPM | Scanning probe microscopy |
References
- Binnig, G.; Quate, C.F.; Gerber, C. Atomic force microscope. Phys. Rev. Lett. 1986, 56, 930. [Google Scholar] [CrossRef] [PubMed]
- Hu, J.; Gao, M.; Wang, Z.; Chen, Y.; Song, Z.; Xu, H. Direct imaging of antigen–antibody binding by atomic force microscopy. Appl. Nanosci. 2021, 11, 293–300. [Google Scholar] [CrossRef]
- Moreira, G.G.; Cantrelle, F.X.; Quezada, A.; Carvalho, F.S.; Cristóvão, J.S.; Sengupta, U.; Puangmalai, N.; Carapeto, A.P.; Rodrigues, M.S.; Cardoso, I.; et al. Dynamic interactions and Ca2+-binding modulate the holdase-type chaperone activity of S100B preventing tau aggregation and seeding. Nat. Commun. 2021, 12, 6292. [Google Scholar] [CrossRef]
- Willemsen, O.H.; Snel, M.M.E.; Cambi, A.; Greve, J.; De Grooth, B.G.; Figdor, C.G. Biomolecular Interactions Measured by Atomic Force Microscopy. Biophys J. 2000, 79, 3267–3281. [Google Scholar] [CrossRef] [PubMed]
- Sofińska, K.; Lupa, D.; Chachaj-Brekiesz, A.; Czaja, M.; Kobierski, J.; Seweryn, S.; Skirlińska-Nosek, K.; Szymonski, M.; Wilkosz, N.; Wnętrzak, A.; et al. Revealing local molecular distribution, orientation, phase separation, and formation of domains in artificial lipid layers: Towards comprehensive characterization of biological membranes. Adv. Colloid Interface Sci. 2022, 301, 102614. [Google Scholar] [CrossRef] [PubMed]
- Costa, L.; Rodrigues, M.S.; Newman, E.; Zubieta, C.; Chevrier, J.; Comin, F. Imaging material properties of biological samples with a force feedback microscope. J. Mol. Recognit. 2013, 26, 689–693. [Google Scholar] [CrossRef]
- Viji Babu, P.K.; Rianna, C.; Mirastschijski, U.; Radmacher, M. Nano-mechanical mapping of interdependent cell and ECM mechanics by AFM force spectroscopy. Sci. Rep. 2019, 9, 12317. [Google Scholar] [CrossRef]
- Hassan, A.A.; Vitorino, M.V.; Robalo, T.; Rodrigues, M.S.; Sá-Correia, I. Variation of Burkholderia cenocepacia cell wall morphology and mechanical properties during cystic fibrosis lung infection, assessed by atomic force microscopy. Sci. Rep. 2019, 9, 16118. [Google Scholar] [CrossRef]
- Marcuello, C.; Chambel, L.; Rodrigues, M.S.; Ferreira, L.P.; Cruz, M.M. Magnetotactic Bacteria: Magnetism beyond Magnetosomes. IEEE Trans. Nanobioscience 2018, 17, 555–559. [Google Scholar] [CrossRef]
- Gibbs, E.; Hsu, J.; Barth, K.; Goss, J.W. Characterization of the nanomechanical properties of the fission yeast (Schizosaccharomyces pombe) cell surface by atomic force microscopy. Yeast 2021, 38, 480–492. [Google Scholar]
- Francois, J.M.; Formosa, C.; Schiavone, M.; Pillet, F.; Martin-Yken, H.; Dague, E. Use of atomic force microscopy (AFM) to explore cell wall properties and response to stress in the yeast Saccharomyces cerevisiae. Curr. Genet. 2013, 59, 187–196. [Google Scholar] [CrossRef] [PubMed]
- Joshua, A.; Cheng, G.; Lau, E. Soft matter analysis via atomic force microscopy (AFM): A review. Appl. Surf. Sci. Adv. 2023, 17, 100448. [Google Scholar] [CrossRef]
- Rao, A.; Schoenenberger, M.; Gnecco, E.; Glatzel, T.; Meyer, E.; Brändlin, D.; Scandella, L. Characterization of nanoparticles using Atomic Force Microscopy. J. Phys. Conf. Ser. 2007, 61, 971. [Google Scholar] [CrossRef]
- Carapeto, A.P.; Ferraria, A.M.; Boufi, S.; Vilar, M.R.; do Rego, A.M.B. Ion reduction in metallic nanoparticles nucleation and growth on cellulose films: Does substrate play a role? Cellulose 2015, 22, 173–186. [Google Scholar] [CrossRef]
- Dufrêne, Y.F.; Viljoen, A.; Mignolet, J.; Mathelié-Guinlet, M. AFM in cellular and molecular microbiology. Cell. Microbiol. 2021, 23, e13324. [Google Scholar] [CrossRef]
- Müller, D.J.; Dufrene, Y.F. Atomic force microscopy as a multifunctional molecular toolbox in nanobiotechnology. Nat. Nanotechnol. 2008, 3, 261–269. [Google Scholar] [CrossRef]
- Gomes, C.M.; Faísca, P.F.; Gomes, C.M.; Faísca, P.F. Protein Folding: An Introduction; Springer: Berlin/Heidelberg, Germany, 2019. [Google Scholar]
- Chiti, F.; Dobson, C.M. Protein misfolding, functional amyloid, and human disease. Annu. Rev. Biochem. 2006, 75, 333–366. [Google Scholar] [CrossRef]
- Feigin, V.L.; Vos, T.; Nichols, E.; Owolabi, M.O.; Carroll, W.M.; Dichgans, M.; Deuschl, G.; Parmar, P.; Brainin, M.; Murray, C. The global burden of neurological disorders: Translating evidence into policy. Lancet Neurol. 2020, 19, 255–265. [Google Scholar] [CrossRef]
- Li, X.; Feng, X.; Sun, X.; Hou, N.; Han, F.; Liu, Y. Global, regional, and national burden of Alzheimer’s disease and other dementias, 1990–2019. Front. Aging Neurosci. 2022, 14, 937486. [Google Scholar] [CrossRef]
- Barnes, D.E.; Yaffe, K. The projected effect of risk factor reduction on Alzheimer’s disease prevalence. Lancet Neurol. 2011, 10, 819–828. [Google Scholar] [CrossRef]
- Dobson, C.M. Protein folding and misfolding. Nature 2003, 426, 884–890. [Google Scholar] [CrossRef] [PubMed]
- Ando, T. Functional Implications of Dynamic Structures of Intrinsically Disordered Proteins Revealed by High-Speed AFM Imaging. Biomolecules 2022, 12, 1876. [Google Scholar] [CrossRef]
- Marcuello, C.; de Miguel, R.; Lostao, A. Molecular Recognition of Proteins through Quantitative Force Maps at Single Molecule Level. Biomolecules 2022, 12, 594. [Google Scholar] [CrossRef]
- Adamcik, J.; Jung, J.M.; Flakowski, J.; De Los Rios, P.; Dietler, G.; Mezzenga, R. Understanding amyloid aggregation by statistical analysis of atomic force microscopy images. Nat. Nanotechnol. 2010, 5, 423–428. [Google Scholar] [CrossRef] [PubMed]
- Donato, R. Functional roles of S100 proteins, calcium-binding proteins of the EF-hand type. Biochim. Biophys. Acta (Bba) Mol. Cell Res. 1999, 1450, 191–231. [Google Scholar] [CrossRef]
- Fritz, G.; Botelho, H.M.; Morozova-Roche, L.A.; Gomes, C.M. Natural and amyloid self-assembly of S100 proteins: Structural basis of functional diversity. FEBS J. 2010, 277, 4578–4590. [Google Scholar] [CrossRef] [PubMed]
- Markowitz, J.; Carson, W.E. Review of S100A9 biology and its role in cancer. Biochim. Biophys. Acta 2013, 1835, 100–109. [Google Scholar] [CrossRef] [PubMed]
- Cristóvão, J.S.; Gomes, C.M. S100 proteins in Alzheimer’s disease. Front. Neurosci. 2019, 13, 463. [Google Scholar] [CrossRef]
- Wang, C.; Klechikov, A.G.; Gharibyan, A.L.; Wärmländer, S.K.; Jarvet, J.; Zhao, L.; Jia, X.; Shankar, S.; Olofsson, A.; Brännström, T.; et al. The role of pro-inflammatory S100A9 in Alzheimer’s disease amyloid-neuroinflammatory cascade. Acta Neuropathol. 2014, 127, 507–522. [Google Scholar] [CrossRef]
- Zhao, L.N.; Zhang, T.; Zhang, C.; Wang, C.; Morozova-Roche, L.A.; Chew, L.Y.; Mu, Y. S100A9 induces aggregation-prone conformation in Abeta peptides: A combined experimental and simulation study. RSC Adv. 2013, 3, 24081–24089. [Google Scholar] [CrossRef]
- Toleikis, Z.; Ziaunys, M.; Baranauskiene, L.; Petrauskas, V.; Jaudzems, K.; Smirnovas, V. S100A9 Alters the Pathway of Alpha-Synuclein Amyloid Aggregation. Int. J. Mol. Sci. 2021, 22, 7972. [Google Scholar] [CrossRef]
- Iashchishyn, I.A.; Sulskis, D.; Nguyen Ngoc, M.; Smirnovas, V.; Morozova-Roche, L.A. Finke–Watzky Two-Step Nucleation–Autocatalysis Model of S100A9 Amyloid Formation: Protein Misfolding as “Nucleation” Event. ACS Chem. Neurosci. 2017, 8, 2152–2158. [Google Scholar] [CrossRef] [PubMed]
- Sanders, E.; Csondor, R.; Šulskis, D.; Baronaitė, I.; Smirnovas, V.; Maheswaran, L.; Horrocks, J.; Munro, R.; Georgiadou, C.; Horvath, I.; et al. The Stabilization of S100A9 Structure by Calcium Inhibits the Formation of Amyloid Fibrils. Int. J. Mol. Sci. 2023, 24, 13200. [Google Scholar] [CrossRef] [PubMed]
- Vogl, T.; Leukert, N.; Barczyk, K.; Strupat, K.; Roth, J. Biophysical characterization of S100A8 and S100A9 in the absence and presence of bivalent cations. Biochim. Biophys. Acta (Bba) Mol. Cell Res. 2006, 1763, 1298–1306. [Google Scholar] [CrossRef] [PubMed]
- Ehrchen, J.M.; Sunderkötter, C.; Foell, D.; Vogl, T.; Roth, J. The endogenous Toll–like receptor 4 agonist S100A8/S100A9 (calprotectin) as innate amplifier of infection, autoimmunity, and cancer. J. Leukoc. Biol. 2009, 86, 557–566. [Google Scholar] [CrossRef]
- Nečas, D.; Klapetek, P. Gwyddion: An open-source software for SPM data analysis. Cent. Eur. J. Phys. 2012, 10, 181–188. [Google Scholar] [CrossRef]
- Rivetti, C.; Guthold, M.; Bustamante, C. Scanning Force Microscopy of DNA Deposited onto Mica: EquilibrationversusKinetic Trapping Studied by Statistical Polymer Chain Analysis. J. Mol. Biol. 1996, 264, 919–932. [Google Scholar] [CrossRef]
- Landau, E.M.L.L.D. Statistical Physics, Part I; Pergamon Press: Oxford, UK, 1980. [Google Scholar]
- Wolfram Research, Inc. Mathematica; Version 14.0; Wolfram Research, Inc.: Champaign, IL, USA, 2024. [Google Scholar]
- Chang, C.C.; Khan, I.; Tsai, K.L.; Li, H.; Yang, L.W.; Chou, R.H.; Yu, C. Blocking the interaction between S100A9 and RAGE V domain using CHAPS molecule: A novel route to drug development against cell proliferation. Biochim. Biophys. Acta (Bba) Proteins Proteom. 2016, 1864, 1558–1569. [Google Scholar] [CrossRef]
- Schrödinger, LLC.; DeLano, W. PyMOL. Version = 2.4.0. Available online: http://www.pymol.org/pymol (accessed on 20 May 2020).
- vandenAkker, C.C.; Engel, M.F.M.; Velikov, K.P.; Bonn, M.; Koenderink, G.H. Morphology and Persistence Length of Amyloid Fibrils Are Correlated to Peptide Molecular Structure. J. Am. Chem. Soc. 2011, 133, 18030–18033. [Google Scholar] [CrossRef]
- Nyrkova, I.; Semenov, A.; Aggeli, A.; Bell, M.; Boden, N.; McLeish, T. Self-assembly and structure transformations in living polymers forming fibrils. Eur. Phys. J. Condens. Matter Complex Syst. 2000, 17, 499–513. [Google Scholar] [CrossRef]
- Schleeger, M.; vandenAkker, C.C.; Deckert-Gaudig, T.; Deckert, V.; Velikov, K.P.; Koenderink, G.; Bonn, M. Amyloids: From molecular structure to mechanical properties. Polymer 2013, 54, 2473–2488. [Google Scholar] [CrossRef]
- Ruggeri, F.S.; Šneideris, T.; Vendruscolo, M.; Knowles, T.P. Atomic force microscopy for single molecule characterisation of protein aggregation. Arch. Biochem. Biophys. 2019, 664, 134–148. [Google Scholar] [CrossRef] [PubMed]
- Housmans, J.A.J.; Wu, G.; Schymkowitz, J.; Rousseau, F. A guide to studying protein aggregation. FEBS J. 2023, 290, 554–583. [Google Scholar] [CrossRef] [PubMed]
- Kawamoto, E.M.; Vivar, C.; Camandola, S. Physiology and Pathology of Calcium Signaling in the Brain. Front. Pharmacol. 2012, 3, 61. [Google Scholar] [CrossRef]


Disclaimer/Publisher’s Note: The statements, opinions and data contained in all publications are solely those of the individual author(s) and contributor(s) and not of MDPI and/or the editor(s). MDPI and/or the editor(s) disclaim responsibility for any injury to people or property resulting from any ideas, methods, instructions or products referred to in the content. |
© 2024 by the authors. Licensee MDPI, Basel, Switzerland. This article is an open access article distributed under the terms and conditions of the Creative Commons Attribution (CC BY) license (https://creativecommons.org/licenses/by/4.0/).