Abstract
Estimating disaster relief supplies is crucial for governments coordinating and executing disaster relief operations. Rapid and accurate estimation of disaster relief supplies can assist the government to optimize the allocation of resources and better organize relief efforts. Traditional approaches for estimating disaster supplies are based on census data and regional risk assessments. However, these methods are often static and lack timely updates, which can result in significant disparities between the availability and demand of relief supplies. Social media, network maps, and other sources of big data contain a large amount of real-time disaster-related information that can promptly reflect the occurrence of a disaster and the relief requirements of the affected residents in a given region. Based on this information, this study presents a model to estimate the demand for disaster relief supplies using social media data. This study employs a deep learning approach to extract real-time disaster information from social media big data and integrates it with a spatial information diffusion model to estimate the population in need of relief in the affected regions. Additionally, this study estimates the demand for emergency materials based on the population in need of relief. These findings indicate that social media data can capture information on the demand for relief materials in disaster-affected regions. Moreover, integrating social media big data with traditional static data can effectively improve the accuracy and timeliness of estimating the demand for disaster relief supplies.
1. Introduction
Typhoons are one of the most severe natural disasters on a global scale and are characterized by their frequent incidence, wide geographical reach, and significant capacity for destruction. Typhoons inflict significant casualties and economic losses on the countries and regions they traverse. Global warming and rapid urbanization have led to a noticeable increase in the intensity and frequency of typhoons [1]. Consequently, coastal regions have experienced increasing vulnerability and susceptibility to natural disasters. Strong winds, heavy rainfall, and storm surges caused by typhoons significantly affect the livelihoods and assets of individuals living in coastal areas [2,3]. It is critical for government agencies, humanitarian aid organizations, and other groups to quickly realize and respond to the needs of the people affected by typhoons [4].
Estimating and preparing relief materials for typhoon disaster response continues to be a significant and complex issue in emergency management. This process assists governments and civil society organizations in effectively allocating relief resources and delivering prompt disaster relief assistance. Flooding is often the result of powerful winds and copious precipitation, which are characteristic of typhoon calamities. This is due to the extensive ramifications and formidable destructive potential associated with such weather events. The transportation and communication infrastructure in the affected regions is vulnerable to damage, leading to delays, insufficiency, and inaccuracy in the dissemination of information regarding the need for emergency relief supplies in these areas [2]. The efficient coordination and organization of emergency relief supplies during the initial phase of a disaster are predominantly contingent on promptly conducting onsite assessments within a constrained timeframe. These prediction methods often depend on empirical judgments, which are inherently subjective and inefficient. Furthermore, these methods are prone to inconsistencies in the balance between supply and demand, resulting in a continuous increase in disaster losses [5]. Considering the aforementioned concerns, the exploration of a scientific, expedient, and effective approach for estimating the demand for relief supplies during typhoons is of substantial practical significance. This study aims to address the issues of inadequate coordination and irrationality in the organization of emergency relief supplies, improve the response time of emergency relief efforts, and reduce the losses caused by typhoons.
Many scholars have undertaken comprehensive research on the demand estimation for relief supply. Demand-forecasting objectives can be divided into two distinct categories: direct and indirect. Direct forecasting methods are predominantly used to develop predictive models that establish a correlation between disaster information and relief supply availability. Liu et al. (2011) proposed an approach for predicting the demand for relief supplies by integrating risk analysis and case-based reasoning (CBR) [6]. This method aims to address the unique attributes associated with forecasting relief supply and demand. Sahebi and Jafarnejad (2017) introduced a methodology based on CBR to predict the demand for disaster relief resources, particularly for earthquakes in order to forecast the relief supplies required for disasters [7]. Sheu (2010) considered the existence of information uncertainty in the event of a disaster and employed a supply segmentation strategy to construct a dynamic model to predict the demand for emergency supplies [8]. Taskin and Lodree (2016) conducted a study aimed at investigating the relationship between the demand for emergency supplies and the severity of hurricanes. They used a Bayesian network algorithm to predict the demand for these types of resources [9]. Bedi and Toshniwal (2019) introduced a deep learning framework that employed artificial intelligence methodologies to predict future demand through the analysis of extensive historical data. The framework integrated the notion of active learning for shifting windows, thereby augmenting the precision of the prediction outcomes [10].
The indirect forecasting method primarily involves estimating the demand for emergency materials by predicting the number of injured individuals in disaster-stricken regions in conjunction with a material calculation formula. As the significance of forecasting emergency supplies has increased, researchers have found that the utilization of indirect forecasting methods is more congruent with the actual demand for emergency supplies in disaster-stricken regions [11,12]. Chen and Liu (2015) introduced a gray model to forecast mortality rates duringAs the significance of forecasting emergency supplies has increased, researchers have found that the utilization of indirect forecasting methods is more congruent with the actual demand for emergency supplies in disaster-stricken regions earthquakes [13]. Masuya et al. (2015) conducted a study aimed at analyzing the spatial distribution of potential shelters in two subareas of Dhaka, Bangladesh, with a specific emphasis on flood hazards. The population affected by floods was estimated by considering various parameters, such as flood extent, depth, census data, and building information [14]. Gao et al. (2023) conducted a comprehensive analysis of a large earthquake dataset to provide recommendations for relief material needs by considering the affected population and the number of injuries as input variables [12].
However, traditional forecasting methods are prone to overestimating or underestimating relief needs, because they mostly use historical census data and cannot quickly change to reflect the real needs of people affected by disasters [15,16]. The emergence of big data, derived from various sources such as web-based mapping services, social media, remote sensing, and other methodologies, offers an alternative data resource to traditional census data obtained from official agencies [17,18,19]. The use of crowdsourced big data presents diverse data sources that hold significant promise for capturing the dynamic distribution of urban populations in real time. Consequently, this approach can be effectively employed in disaster assessment and post-disaster relief efforts owing to its ability to collect data rapidly and at low cost [17,20].
With the emergence of big data, the incorporation of conventional approaches with big data has the potential to augment the precision of relief supply estimates. This integration has the potential to facilitate a more accurate assessment of the quantity of relief supplies required by crisis-affected individuals. Lin et al. (2020) introduced a novel approach for estimating dynamic population figures using Baidu Big Data. In this approach, the input variables consist of dynamic population, seasonal coefficients, and regional coefficients. A flood emergency material demand estimation model was constructed using a learning machine method [20]. Sheu et al. (2019) integrated social media data with authoritative data from disaster-affected regions to model the requirements for hospital rescue operations during disaster scenarios [21]. However, the sparse and unequal distribution of social media data poses a challenge, because the information extracted from such data often fails to encompass all affected regions. Information islands exist within the study area that have not been mentioned in social media platforms. This lack of coverage significantly impedes the integration of statistical and social media big data, thereby limiting the ability to infer the extent of disaster situations in affected areas.
Considering the aforementioned issues, this study presents a novel approach for estimating the demand for relief supplies in typhoon-affected regions. The proposed model integrates a dynamic estimation framework with a spatial information-diffusion model. The estimation model for disaster relief supplies was enhanced in terms of timeliness and accuracy by incorporating data mining techniques derived from social media platforms. This initiative aims to improve the efficient coordination of relief supplies in areas affected by typhoons, thereby ensuring the timely delivery of assistance to meet the needs of affected individuals.
2. Methodology
2.1. Overview
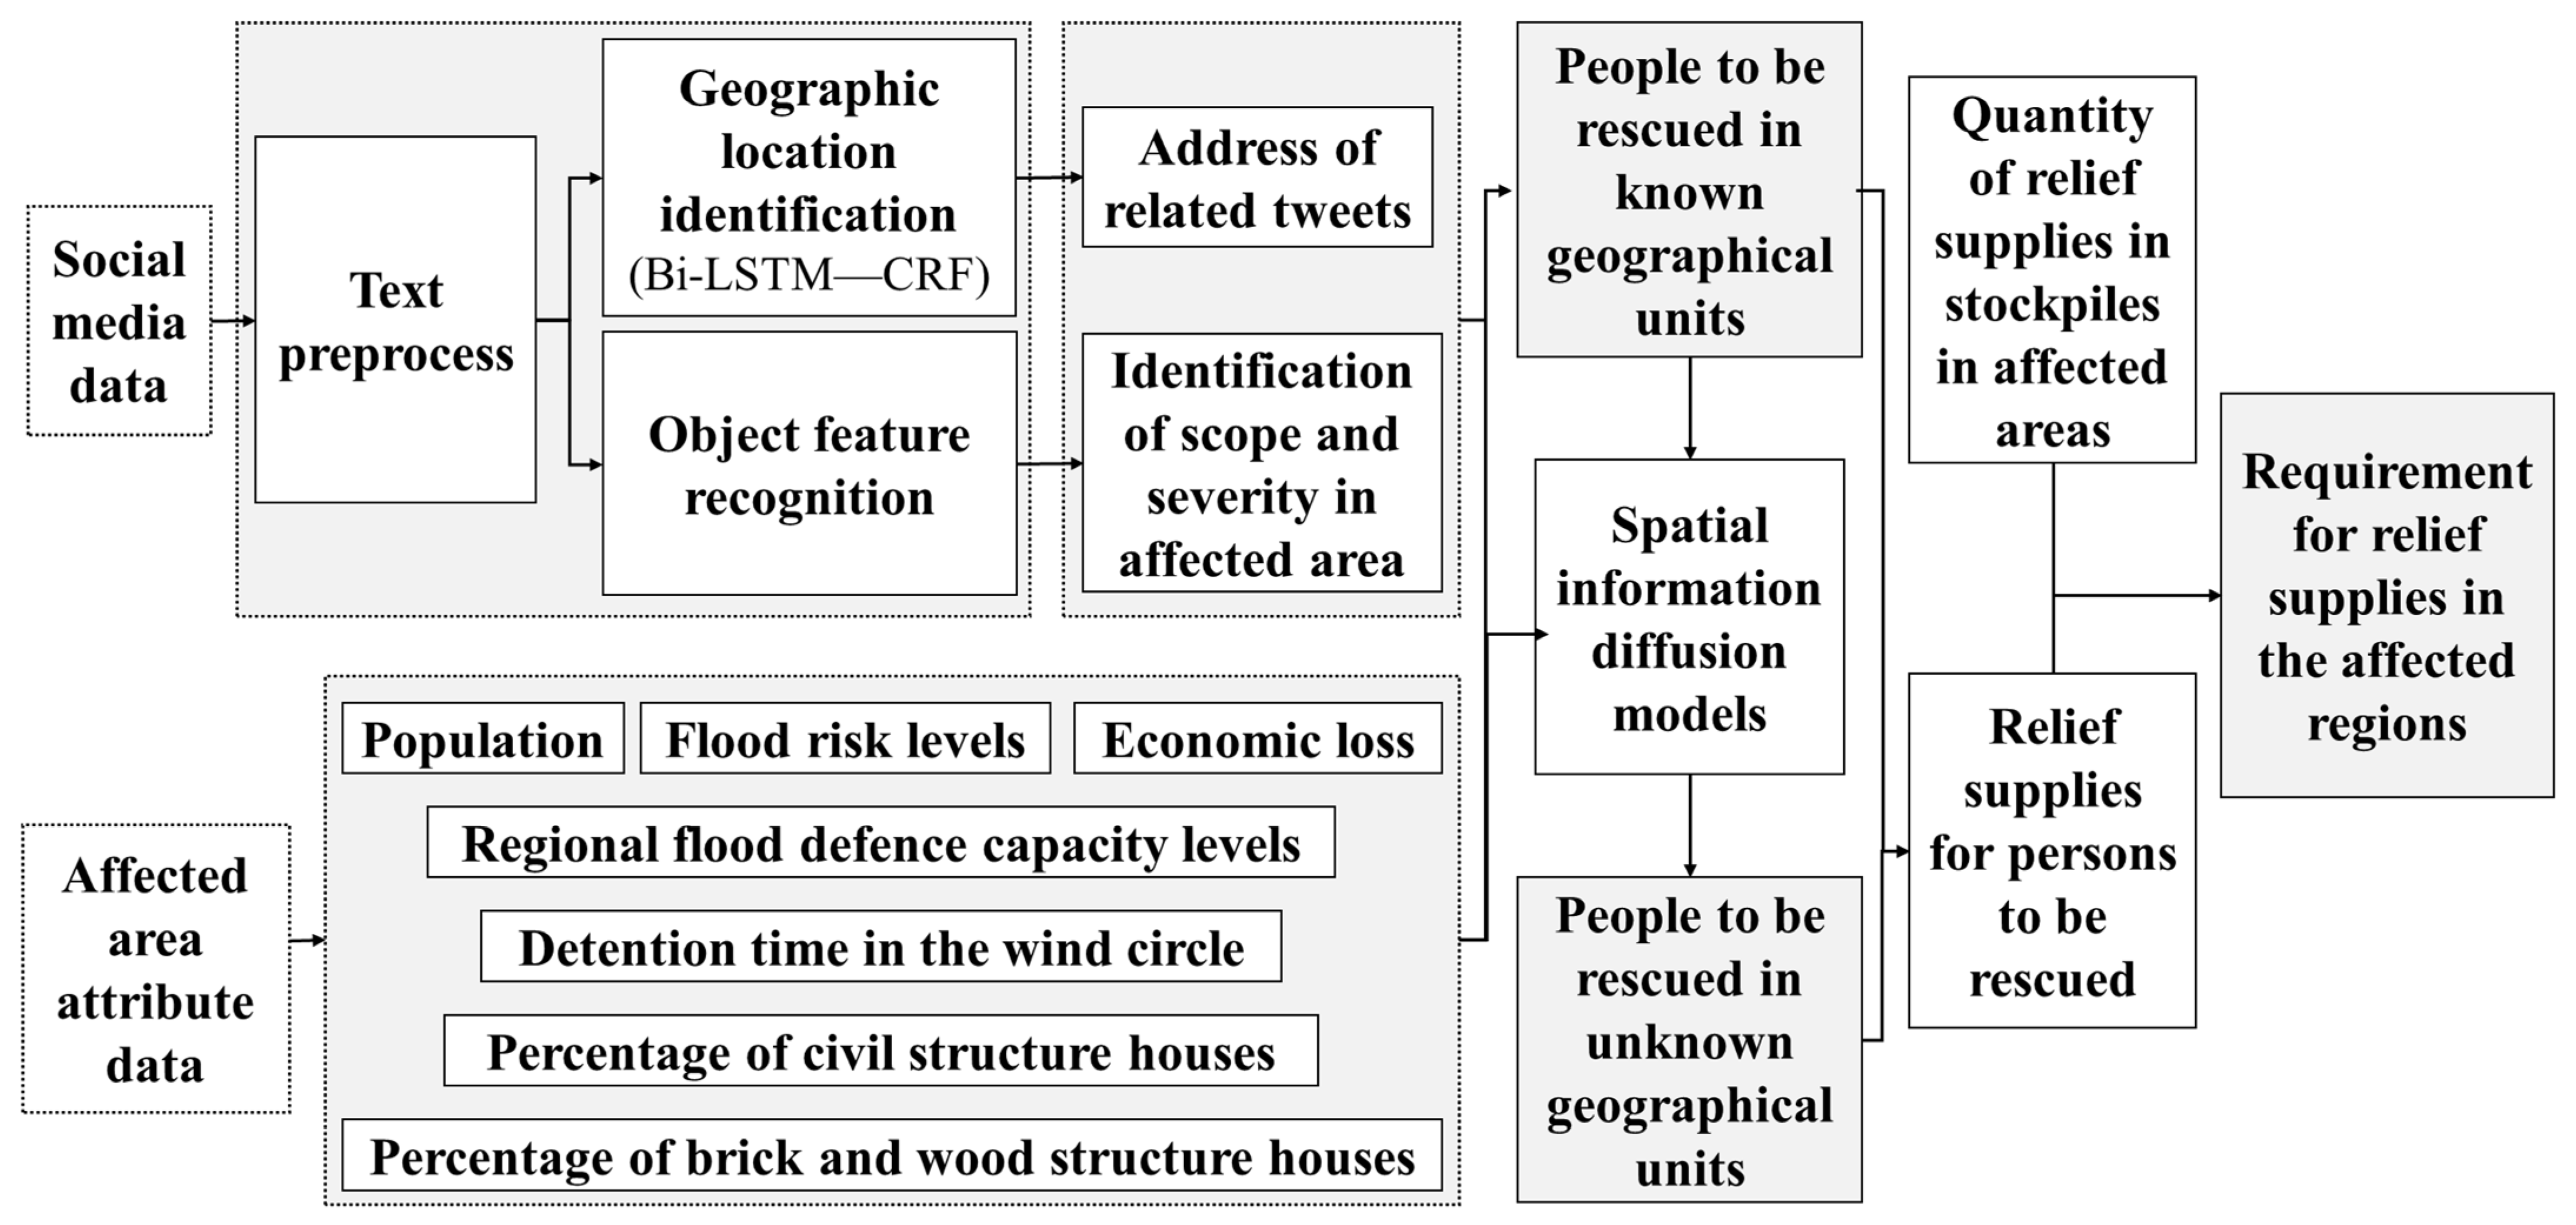
Natural language processing algorithms were used to analyze vast quantities of social media big data to acquire relief supplies. Vital information on typhoons was acquired from data collected on social media platforms. This information encompasses the geographical location as well as the extent and severity of a disaster. The use of a spatial information diffusion model facilitates the dissemination of established geospatial information to unfamiliar geographical regions, thereby addressing concerns regarding unrepresented areas in social media data. By acquiring a thorough spatial distribution, we can proficiently evaluate the extent and severity of the disaster. The affected population can be estimated by assessing the extent and severity of the disasters. A mathematical model was developed to enhance the efficient evaluation of relief tents, folding beds, relief clothing, and other materials. Finally, a quantitative relationship between the population and the necessary relief supplies was established. A flowchart depicting the algorithm for estimating relief goods is shown in Figure 1.
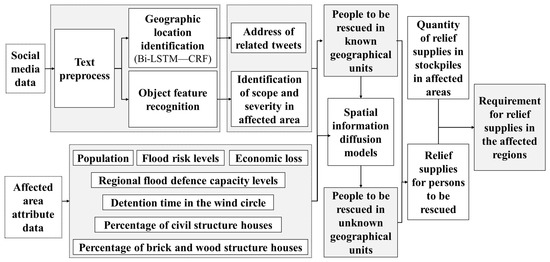
Figure 1.
Flowchart for estimating relief supplies based on social media data.
2.2. Named Entity Recognition: Bi-LSTM-CRF
The primary goal of Named Entity Recognition (NER) is to identify and extract words associated with individuals, organizational entities, geographical locations, and other pertinent categories within a text [22]. In the field of Chinese text entity recognition, various established NER recognizers such as HanNLP, HIT NLP, and Fudan NLP have exhibited superior performance in the identification of generic named entities [23]. However, challenges remain in the identification and categorization of non-generically named entities. In the present study, the Bi-LSTM-CRF method was utilized to extract place name information from microblogs with a focus on typhoon disaster themes. Additionally, the flooded areas in the affected regions were spatially located using geocoding [24].
The Bi-LSTM-CRF method incorporates bidirectional long- and short-term memory (Bi-LSTM) networks using the Conditional Random Fields (CRF) algorithm. Bi-LSTM models have demonstrated a remarkable level of accuracy in predicting the output of individual words, particularly in the context of entity recognition, where they excel in accurately labeling entities [25].
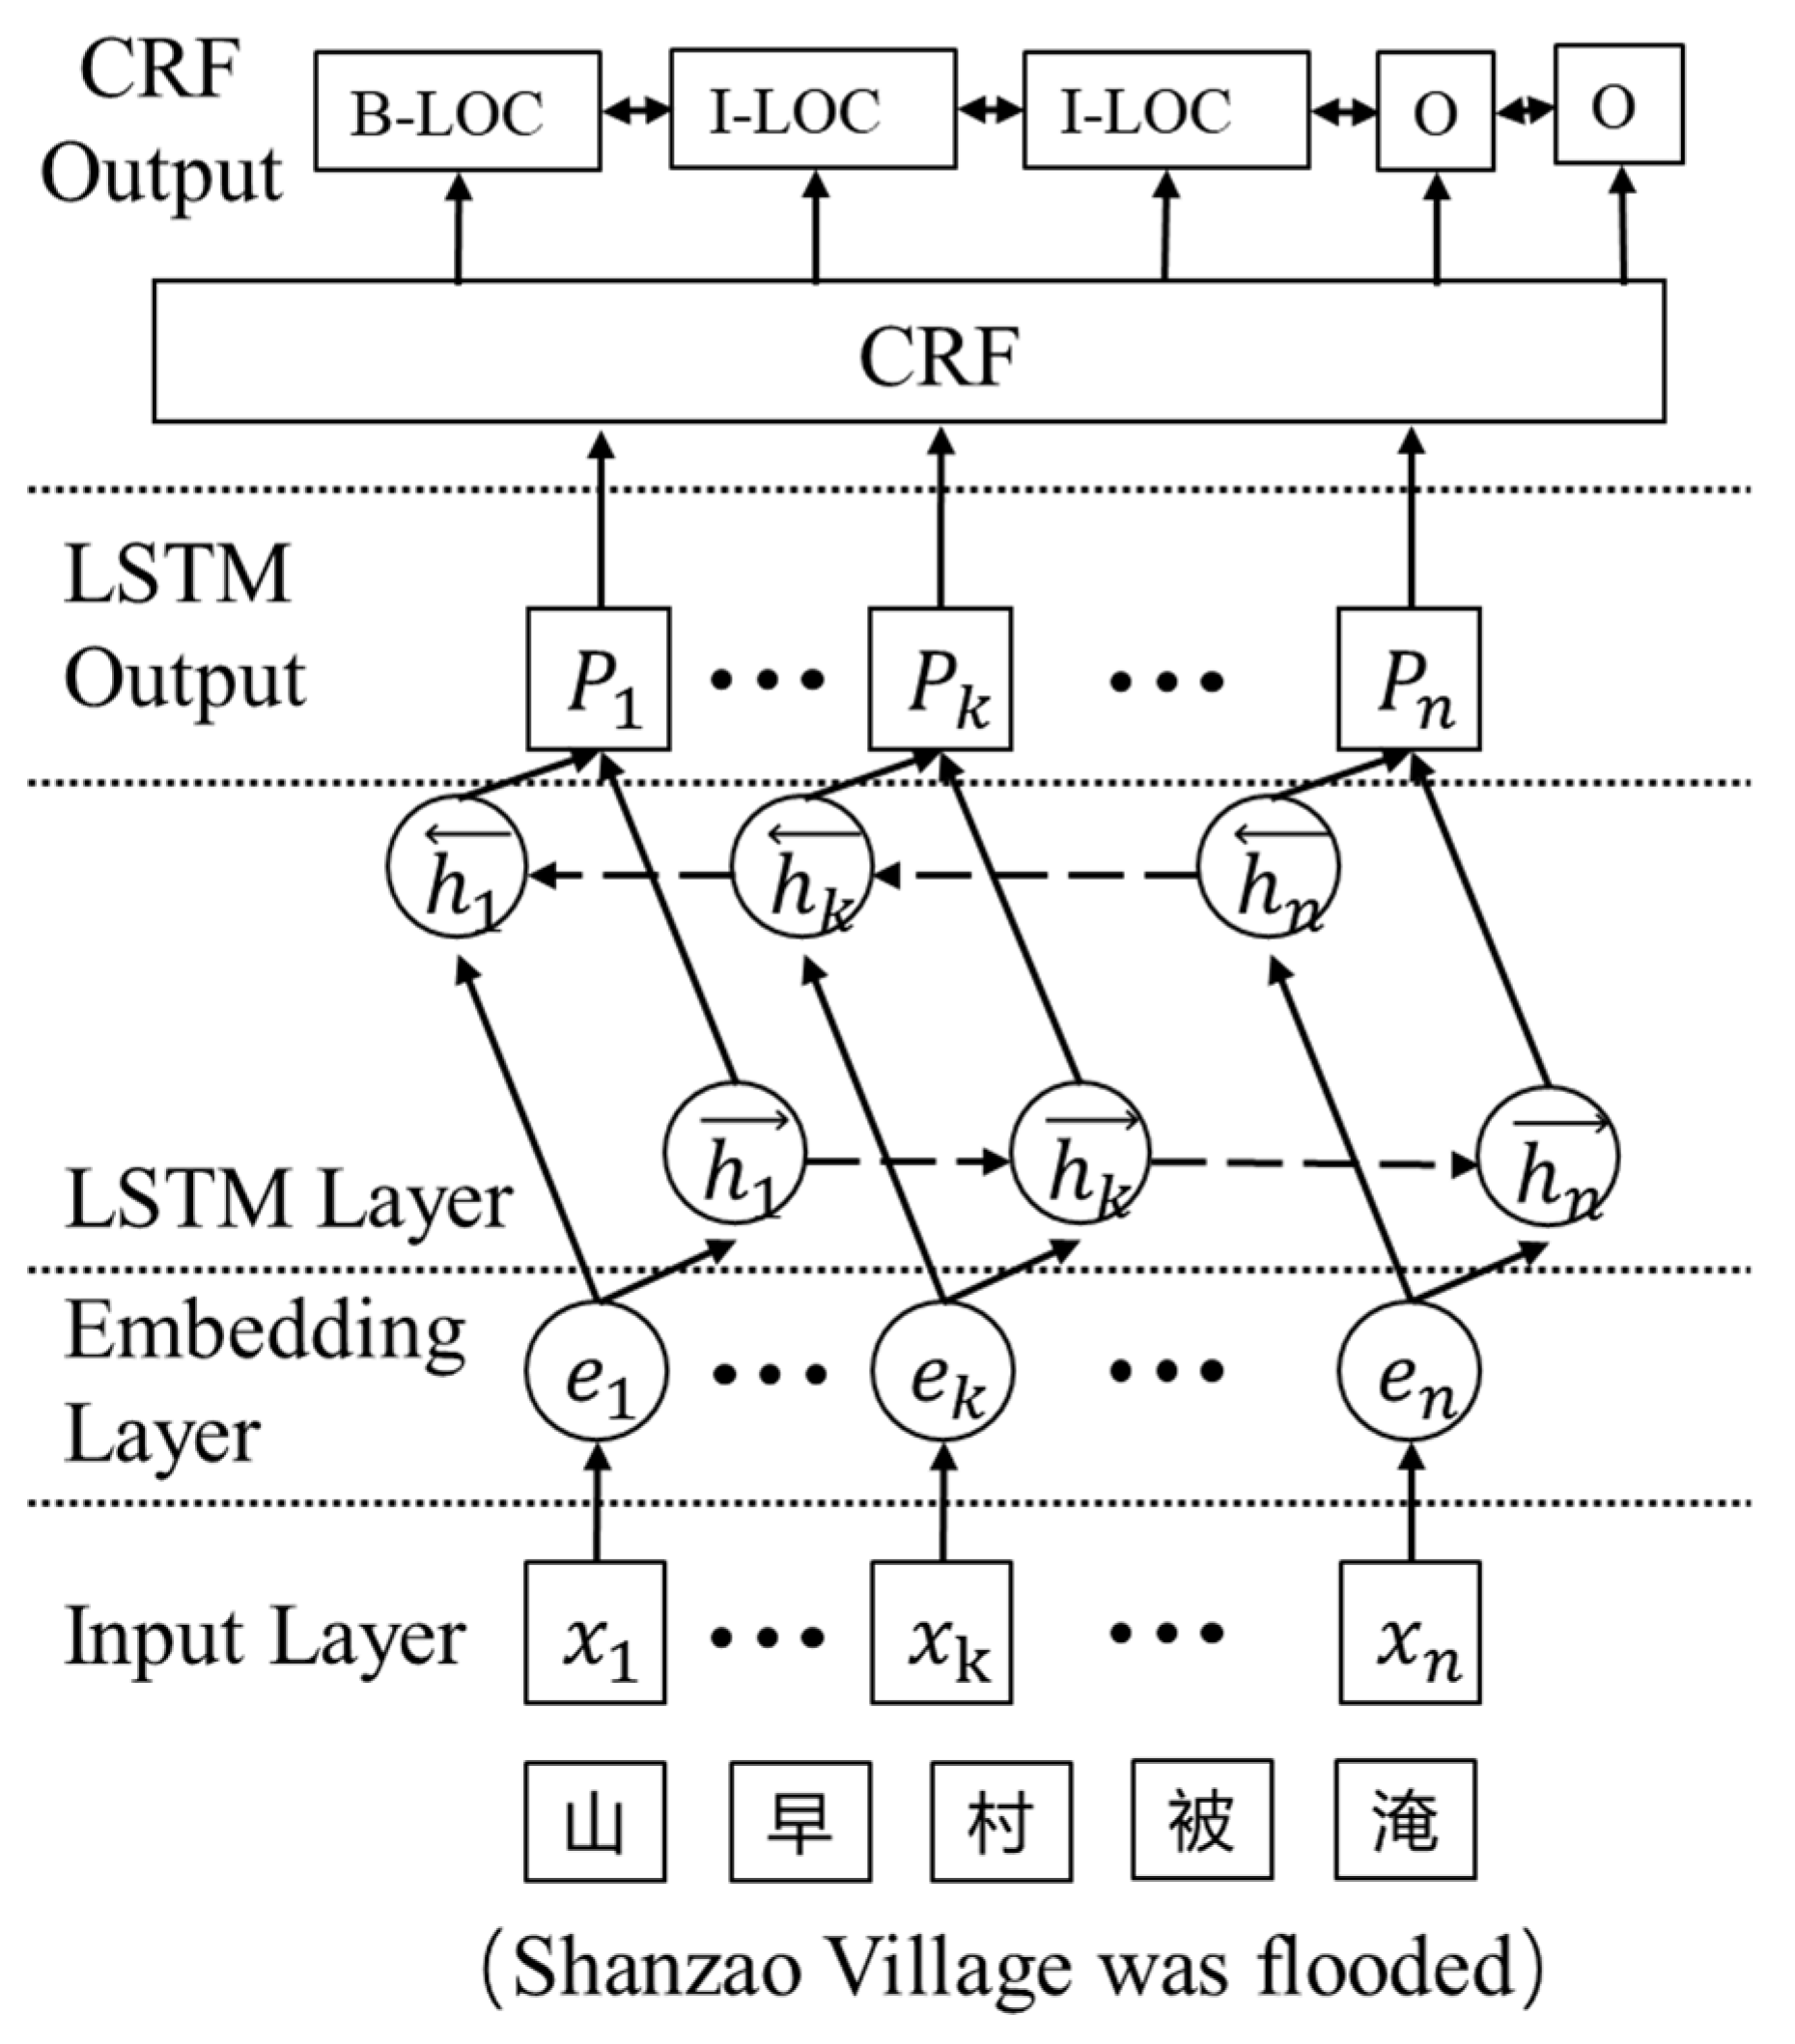
Bi-LSTM training involves the iterative propagation of the input and hidden layer values to establish correlations between them. However, this study did not establish any statistically significant correlation between the assigned labels and the output of each word. CRF algorithms can be applied to enforce constraints to maintain grammatical accuracy in line with the principles of natural language, and the CRF algorithm can be applied to enforce constraints. This process ensures that the final result, as illustrated in Figure 2, conforms to grammatical accuracy [26]. For instance, the entity label “B” signifies the commencement of a word, while “I” denotes the absence of word initiation. Furthermore, the abbreviation “PER” is utilized to denote an individual’s name, whereas “LOC” is employed to indicate a location name. This legal context imposes limitations on consecutive tags that are considered permissible. These limitations include the following patterns: an initial tag indicating a person’s name (B-PER), followed by a subsequent tag indicating a non-initial part of the person’s name (I-PER), and an initial tag indicating a place name (B-LOC) followed by a subsequent tag indicating a non-initial part of the name of the place (I-LOC). If two consecutive output labels are observed as “B-PER” followed by “I-PER”, they are deemed valid. If the consecutive output labels consist of “B-LOC” followed by “I-PER”, it is considered invalid, as it violates the rule that prohibits a person’s name from immediately following a place name. The utilization of the CRF algorithm allows the estimation of the probability of a complete sequence by considering the states between sequences. The state in the CRF is not solely determined by the preceding state but is also influenced by the subsequent state. The conditional probability in the CRF is calculated as follows [25]:
where P is the conditional probability, and are the weights, is the transfer function, is the normalization factor, and is the state function.
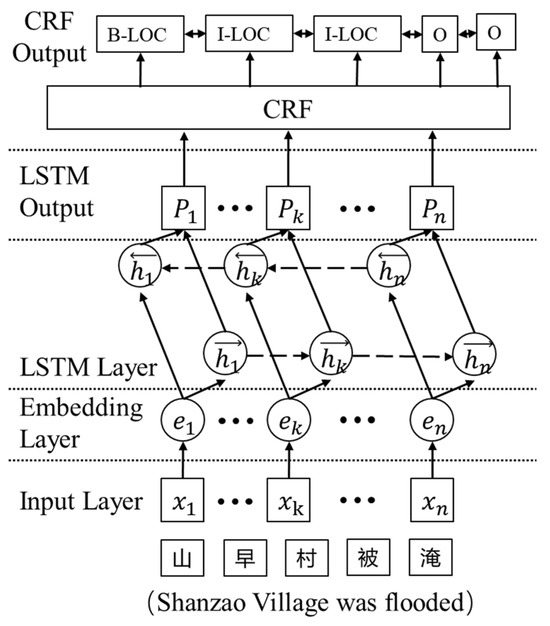
Figure 2.
Flowchart of the Bi-LSTM-CRF algorithm.
2.3. Object Information Extraction and Recognition
The objective of this study is to analyze the extent and severity of flooding in areas affected by typhoons by extracting relevant data from microblog posts. In this study, a novel approach for extracting relevant object information from microblog texts associated with typhoon disaster events is proposed [27]. The proposed methodology incorporates lexical rules and features word matching to efficiently discern and classify object names, along with their corresponding attribute features and behavioral feature information. Given the unique characteristics of the entities affected by typhoon disasters, a standardized vocabulary is utilized to describe their related characteristics. For instance, the sentence “the entire tree was blown down to the ground” exemplifies the utilization of the grammatical rule “noun–verb” to identify the corresponding lexical collocation pair “tree–blown down” within the given text. This statement not only elucidates the executed action but also delineates the precise entity upon which the action is performed and the characteristics linked to that entity.
Given the colloquial nature of language expressions in microblog texts, and the complexity and diversity of the forms of expression, there is a relative insufficiency in the coverage of seed word pairs. Hence, this study utilizes seed word pairs as the foundation and employs a word vector model (skip-gram) to identify words with similar distances from the seed words. This approach aims to supplement and expand seed word pairs by incorporating complementary words [28].
Various methods are available for calculating the similarity between word vectors. In this study, the cosine similarity measure is used to calculate the cosine value, which signifies the angle between two word vectors. The correlation between the two entities strengthens as the cosine value increases. The calculation of the cosine function for word vectors is as follows:
The cosine function produces values ranging from 0 to 1. The degree of similarity among word vectors can be assessed using the cosine value, where a value approaching 1 signifies a greater similarity and a value approaching 0 indicates a lower similarity [27].
Considering the significant influence of negative adverbs on textual expression, this study aims to analyze microblog texts to identify and annotate adverbs that carry negative connotations. Subsequently, a comprehensive list of negative words was constructed. Simultaneously, regulations were developed to handle the semantic aspects of negative terms within a text [23]:
- (1)
- Within microblog texts, the occurrence of a negative word preceding a feature word can have a contrasting impact on the inherent semantics of the feature word: “There is currently an uninterrupted water supply in the local vicinity”.
- (2)
- Within the context of a micro-blog text, it has been observed that the presence of a double negative does not change the original semantic meaning of the word being discussed: “Therefore, the operational efficiency of high-speed railways is inevitably affected”.
Table 1 provides a partial representation of the depth and extent of flood inundation, along with their corresponding classifications. Generally, Level 1 denotes the absence of a flood disaster, whereas Level 2 signifies the occurrence of a flood disaster in a specific localized area. At Level 2, the depth of the flood significantly affects the livelihoods of specific inhabitants, presenting a heightened risk to regions with inadequate flood resilience. Level 3 denotes a substantial influence of the flood, encompassing an extensive geographic region and involving a flood depth exceeding 1 m. Consequently, the well-being and safety of the residents of the affected regions are significantly compromised.

Table 1.
Flood disaster text classification codes.
We utilized the linguistic expressions presented in Table 1 as the base word and proceeded to amplify and enrich the initial term using a cosine similarity calculation.
By performing data mining on microblog texts originating from affected regions, valuable insights pertaining to the current flooding conditions in specific areas can be acquired. These data include detailed accounts of the location, extent of inundation, and depth of flooding in the affected areas. Given the restricted dissemination of microblog text and the interconnectivity of inundated regions, this study proposes that the same street or township encounters comparable consequences owing to flooding. Building on the aforementioned assumptions, this study incorporated previous research and social media data to calculate the typhoon flooding disaster index for a particular geographic area. This was achieved using the following methodology.
where is the typhoon flooding index of region k, i denotes the level of flood inundation depth in the social media text, j denotes the level of flood inundation range in the social media text, denotes the number of texts with both inundation depth and range, denotes the number of texts with only flood depth descriptions, and denotes the number of texts with only flood range descriptions.
2.4. Spatial Information Diffusion Models
Not all disaster information is reflected in social media data. Despite the recurrent occurrence of typhoons and floods near townships and streets, it cannot be assumed that residents openly share their experiences and emotions on social media platforms. For regions that have been impacted but have not been documented on social media platforms, it is suggested that spatial information diffusion modeling be used to collect data on the extent of the affected areas [29].
The information diffusion model is a mathematical approach that uses fuzzy logic to handle set-value samples. It aims to optimize the utilization of samples in order to address the issue of insufficient information. This methodology converts a sample with observations into a fuzzy set, thereby converting a single-value sample into a set-value sample. The ultimate objective is to determine the probability of an event with a low probability [30]. There are three primary reasons for selecting a spatial information diffusion model. First, the model can identify nonlinear relationships. Second, the model is not limited by the continuity hypothesis of the spatial parameters. Notably, the samples obtained from various sampling points may contain contradictory data points, which can lead to nonconvergence of learning. Fuzzy centralization allows data non-convergence, although this phenomenon does not occur in artificial neural networks [31].
Let U be the discussion domain of the typhoon disaster index, denoted as ; then, the probability that the disaster index exceeds is , and the probability distribution is called the risk of disaster index. Assume that represents a sample set of n observations of natural hazards in the region. A single observation sample can diffuse the information it carries to all members of U according to the diffusion formula , where denotes the amount of information distributed to the specific point by the observed sample value, is the information absorption point, and h is the diffusion coefficient, which can be determined according to the maximum value a and minimum value b in the sample and the number of sample points n [31]:
Assuming that , the normalized information distribution of the disaster sample is . Assuming that , , then the frequency value of the disaster sample point at is . If considered as an estimate of the probability, the probability value beyond is , which is the requested estimate of the beyond-probability risk.
2.5. Estimation Model for Relief-Supply Demand
After a typhoon, it is imperative to forecast the requirements for relief provisions by considering the number of individuals in need of rescue measures. Thus, it is hypothesized that regions characterized by a high disaster index will experience a greater impact than regions with a low disaster index. The number of individuals in need of assistance is determined by two factors: the extent and severity of the disaster, and the population size in the region. Based on the disaster situation index, a calculation method was employed to determine the percentage of individuals requiring rescue services in the affected areas. Subsequently, the total number of individuals requiring rescue in the county affected by the disaster was obtained by aggregating the number of individuals requiring rescue across all streets and towns. The formula used to calculate the number of individuals requiring rescue is as follows:
where is the number of people in need of rescue, is the disaster index, and and are the lower and upper limits of the interval in which u resides; specifically . When, , the region k is little damaged, ; when , , there is flood disaster in region k, but the scope and depth of the flood are limited, and represents the relatively poor population in the disaster region, whose ability to resist disasters is weak. Before the typhoon, local governments often mobilized people for emergency evacuation. When , , the region k is very seriously flooded and needs emergency assistance; here, represents the entire population of the area.
In this study, the safety stock theory was applied to estimate the correlation between the population in need of assistance and the availability of nonexpendable materials in regions affected by typhoon disasters [32]. Additionally, a prediction model was developed to forecast the demand for emergency materials during typhoons, which allowed for indirect forecasting of the demand for these materials.
The initial moment of relief operations in the affected area after the typhoon was 0. is the demand for emergency supplies K in affected region i at time t, is the number of people transferred within disaster area i at time t, and is the quantity of emergency materials K demanded by each person in need of assistance during the time period. is the service level of relief supplies, that is, the extent to which supplies meet the needs of the people in the disaster area; is the coefficient of the corresponding level of supply of materials under the conditions of the level of service; represents the standard deviation of the average demand for emergency materials K per unit time of disaster area i at time t; is the time of the latest distribution of the material; is the storage capacity of the material K in the affected area i, which can be calculated according to the service level of relief supplies , the area of emergency materials for per refugee , and the use area of the warehouse ; is the quantity of material K arriving in disaster area i at time ; and is the average value of . Combined with the theory of safety stock, an emergency supply relief model based on the number of people to be rescued is established as follows:
3. Study Cases and Data
3.1. Study Cases
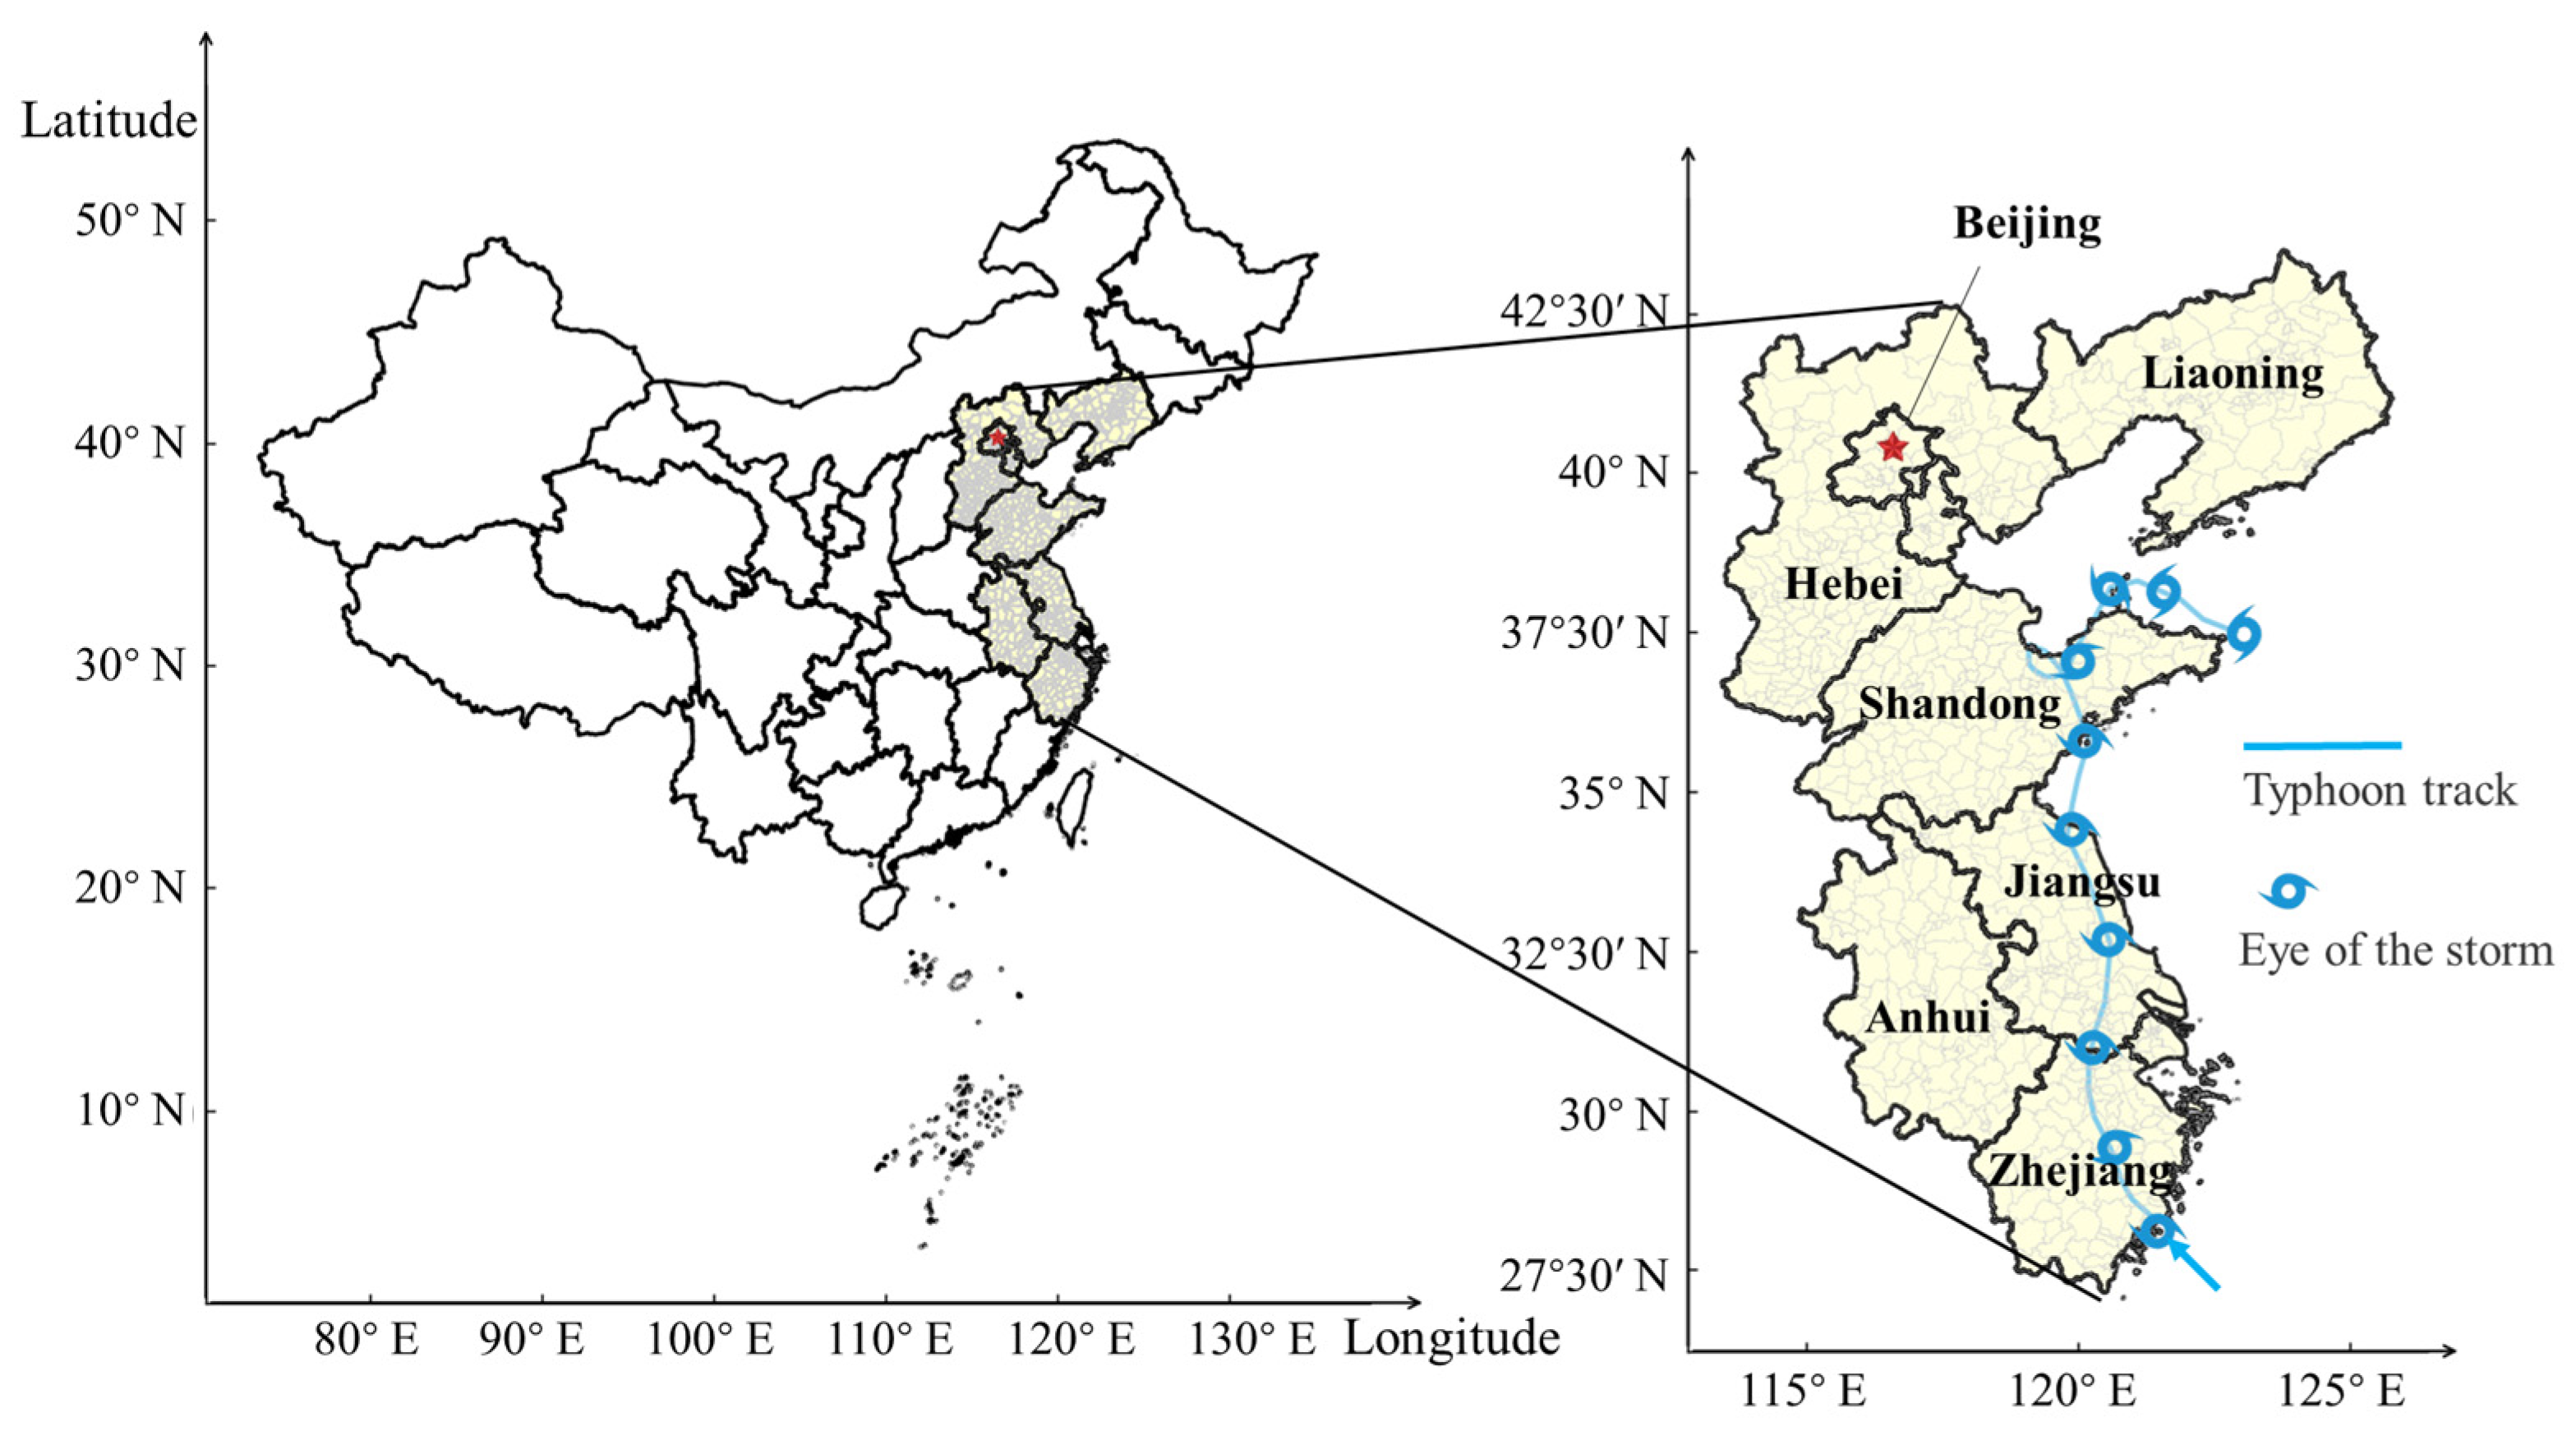
Typhoon Lekima, the fifth most powerful typhoon that has impacted China since 1949, was selected as the subject of this study. Typhoon Lekima made landfall in Zhejiang, China, at 01:00 h on 10 August 2019, accompanied by a maximum wind speed of Level 16 (52 m/s). The route subsequently passed through Zhejiang and Jiangsu Provinces before reaching the Yellow Sea. The typhoon made its second landfall in Qingdao, Shandong Province, China, at 20:00 h on 11 August. At the time of landfall, it had a maximum wind speed of Level 9 (23 m/s). On 13 August, the typhoon underwent reclassification and was reclassified as a tropical depression. Typhoon Lekima caused the displacement of a significant population of 14.024 million individuals in China, leading to substantial direct economic losses of 53.72 billion CNY. The regions that were predominantly affected include Zhejiang, Jiangsu, Anhui, Shandong, Shanghai, Liaoning, and other adjacent areas. The extent of the land area affected by typhoon rainstorms with precipitation levels of 100 mm or higher was measured at 361,000 km2. Additionally, the land area that experienced rainstorms with precipitation levels of 250 mm or higher was recorded as 66,000 km2. In specific regions of Zhejiang and Shandong Provinces, the total amount of precipitation exceeded 400 mm, whereas the wind speed in certain localized areas reached or exceeded level 17 (56.1~61.2 m/s). The area affected by moderate and severe typhoons encompasses a total area of 248,000 km2. The geographical regions affected by Typhoon Lekima are shown in Figure 3.
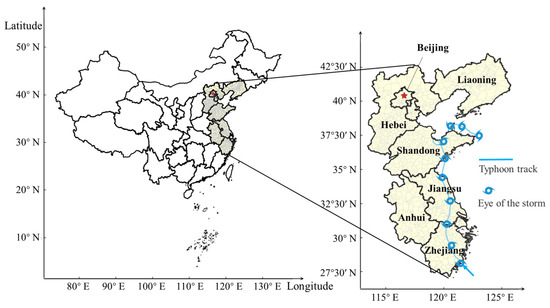
Figure 3.
Description of the study area.
3.2. Research Data
This study utilized data mining techniques to extract regional disaster information from social media big data. A spatial information diffusion model is used to disseminate the extracted information, thereby providing a comprehensive understanding of disaster situations throughout the region. Subsequently, information acquired regarding the disaster was used to estimate the number of individuals in need of rescue services. Additionally, the demand for emergency materials was estimated based on a population count. Three distinct data categories were used in this study. The first category encompasses historical statistical data on typhoon disasters, primarily obtained from national disaster reduction networks and local civil affairs websites. This dataset encompasses various aspects of typhoon events, including their duration, proximity to the typhoon trajectory, and quantity of emergency supplies distributed to affected populations. These supplies included tents, quilts, and folded beds. The second category encompasses regional statistical data, such as gross domestic product (GDP), resident population, flood risk level, flood control capacity level, housing structure proportion, and regional resident income distribution. The third category of data was obtained from social media, specifically from the microblog platform, by employing a crawling technique using the keyword “Typhoon Lekima”. In this study, a total of 1.56 million short text data were collected from the microblog platform. After de-emphasizing the text, more than 900,000 short text data remained.
4. Results and Discussion
4.1. Geospatial Named Entity Recognition
In this study, the Bi-LSTM-CRF algorithm was implemented to facilitate the recognition of geolocational entities. The model was implemented using the deep-learning framework PyTorch version 1.6.0. The training data used in this study consist of a microblog Chinese-text entity corpus. Words containing lexical ns, indicating place names, were extracted to generate the BIO datasets required for training. Each word in the BIO dataset was annotated with the labels ‘B’ (denoting that the separate word was at the beginning of a phase or sentence), ‘I’ (denoting that the word was not at the beginning of a word), or ‘O’ (denoting that the word was not in the target vocabulary). Furthermore, words within the designated vocabulary were classified into specific categories, including individual names (PER), geographical locations (LOC), and names of organizations (ORG).
Three metrics—Precision, Recall, and F1—were used to evaluate the accuracy of the extracted place names. Precision is a metric that measures the accuracy of place names extracted from tweets. It specifically quantifies the proportion of extracted place names that correspond to actual names. However, recall quantifies the completeness of the extracted place names, specifically indicating the percentage of tweets that contain the extracted place names out of all tweets that include place names. F1 is a composite metric that integrates precision and recall to assess model effectiveness. The results for the three metrics are shown in Table 2. Based on the evaluation indexes, the Bi-LSTM-CRF model exhibited a recognition accuracy and recall rate exceeding 0.9 when applied to microblog text data. This level of performance satisfactorily fulfills the research requirements in terms of recognizing geographic names. The specific recognition results show that the Bi-LSTM-CRF model is proficient at extracting specific geographical names mentioned in the text, such as “Dingqiao Town” and “Wenhui Street”. Furthermore, the model could detect geographical names over a wider range, such as “Hangzhou” and “Pudong”. Moreover, the model demonstrates a high level of accuracy in identifying consecutive place names, such as the Pudong Avenue Station East Exit, Jindu Road, Minhang District, and Shanghai. The model successfully demonstrates the recognition outcomes and exhibited a significant level of precision in correctly identifying and categorizing the outcomes of identification based on administrative divisions. For datasets that consist of a single level of geographic information, such as “Dingqiao Town”, we utilized a method to compensate for any missing information that involves extracting published or registered location data from microblogs and incorporating them into a dataset. This approach helps mitigate the occurrence of duplicate names within a confined geographical region, such as Dongcheng Street, Huangyan District, Taizhou City, Dongcheng Street, Dongying District, and Dongying City. The Bi-LSTM-CRF model demonstrated sufficient capability to accurately identify geographic entities, thereby satisfying the information recognition requirements of the study.
Table 2.
Geographic information recognition model parameters.
4.2. Distribution of People Transferred and Resettled Based on Social Media Data
4.2.1. Heat Map of Social Media Data
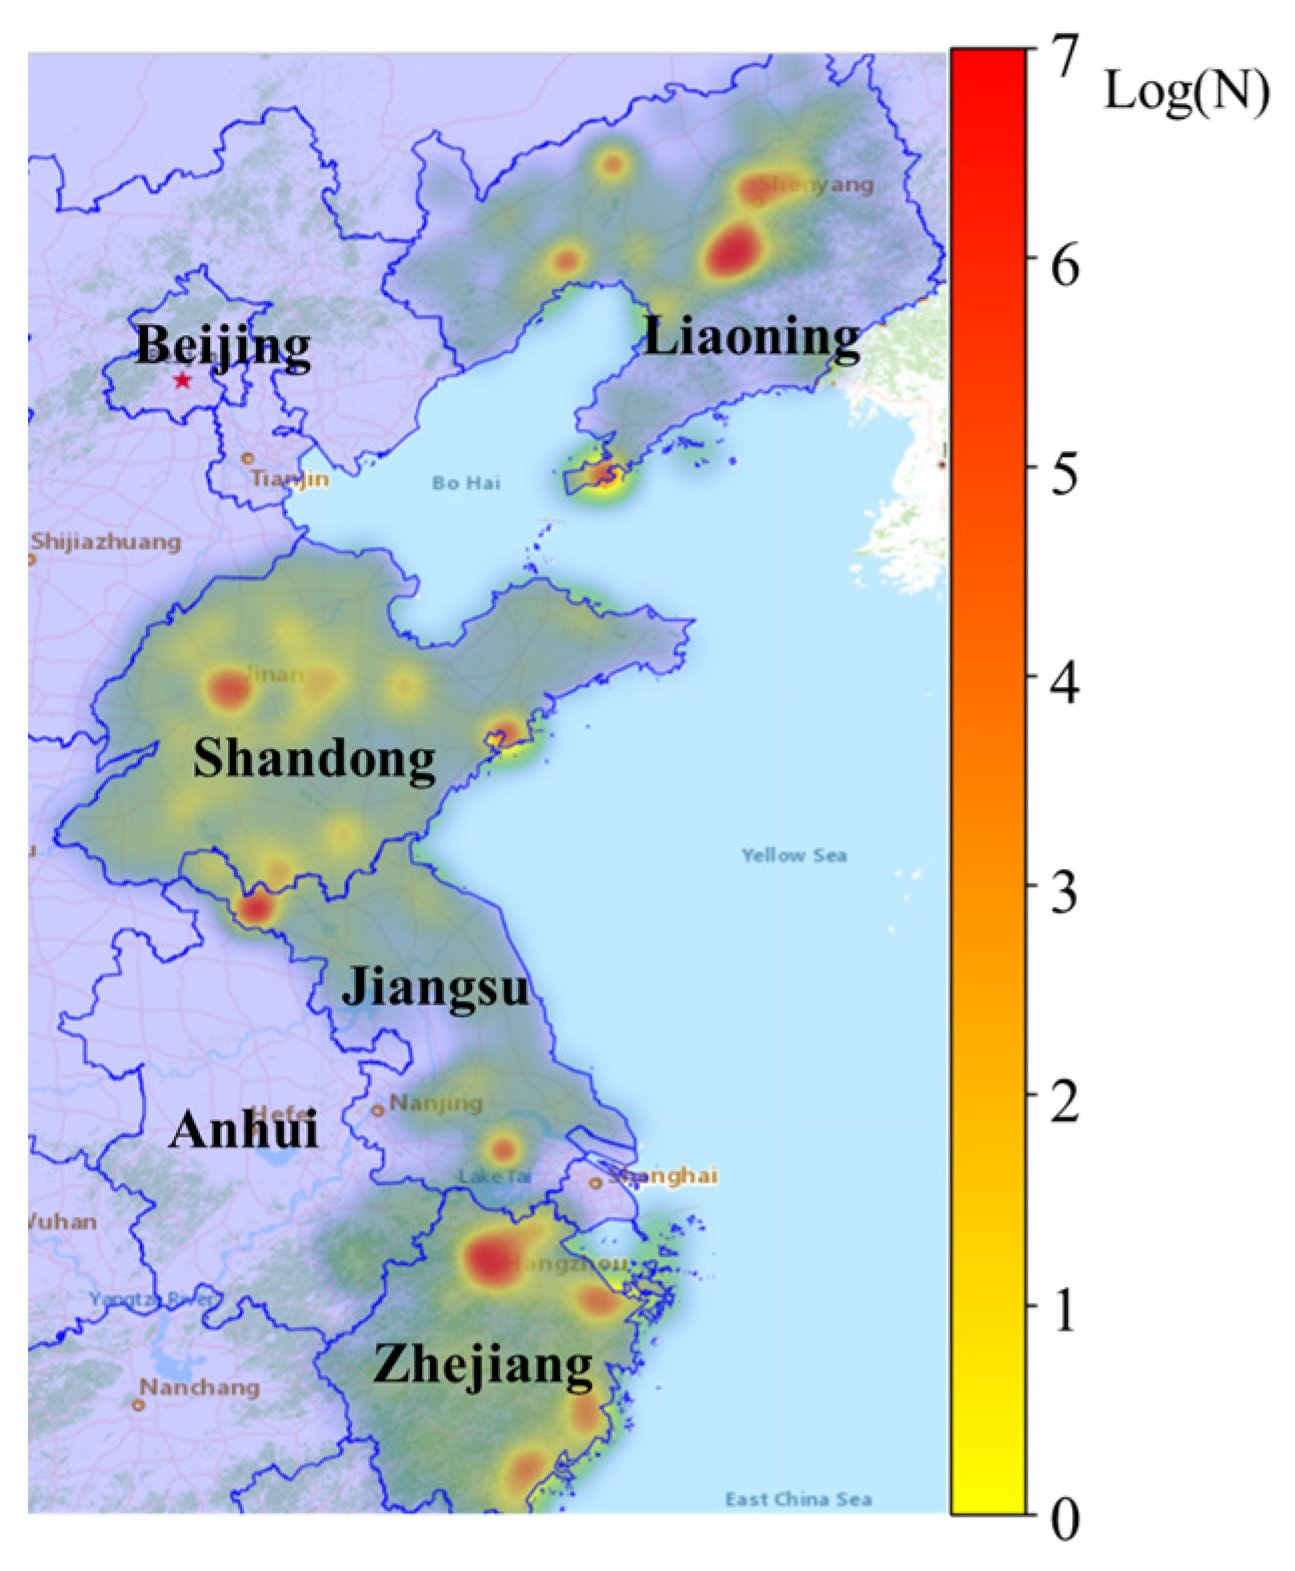
This study used the keyword “Typhoon Lekima” to extract textual data from microblog social media platforms. The researchers proceeded to conduct a quantitative analysis of the quantity of micro-blog posts within each region affected by the typhoon. Figure 4 illustrates the distribution of micro-blog posts across different regions, showing the substantial level of discourse surrounding Typhoon Lekima in the coastal regions of Zhejiang, the central and western areas of Shandong, the central part of Liaoning, and densely populated cities such as Hangzhou, Dalian, and Shanghai. Conversely, there seems to be a relatively limited discourse surrounding typhoons in Jiangsu Province.

Figure 4.
Social media data hot-spot map. “N” represents the number of microblogs from the affected regions, Log(N) represents the value obtained by taking the logarithm of N.
4.2.2. Assessment of Direct Economic Losses
Using an economic loss assessment method previously established by researchers [25], a comprehensive evaluation of the direct economic losses was conducted for the area affected by Typhoon Lekima. The assessment model was used to evaluate the direct economic damage resulting from the typhoon in various prefecture-level cities, such as Zhejiang, Jiangsu, Shandong, Shanghai, and Liaoning. Table 3 presents the error parameter values for the assessment of the economic losses. From the analysis of the assessment results, it can be inferred that the model employed for economic loss assessment demonstrates a significant degree of consistency. Additionally, the estimated direct economic losses in most regions closely aligned with the actual values, indicating a reasonable level of accuracy.
Table 3.
Model performance for the testing data sets.
To assess the accuracy of the direct economic loss assessment model, we calculated the mean absolute error (MAE), root mean square error (RMSE), and discrepancy between the estimated and actual values. This analysis indicated that the correlation coefficient () between the estimated and actual values was 0.715. The observed data revealed a robust and significant positive correlation between the estimated and actual values, implying that the model employed is proficient in accurately predicting economic losses in the impacted regions.
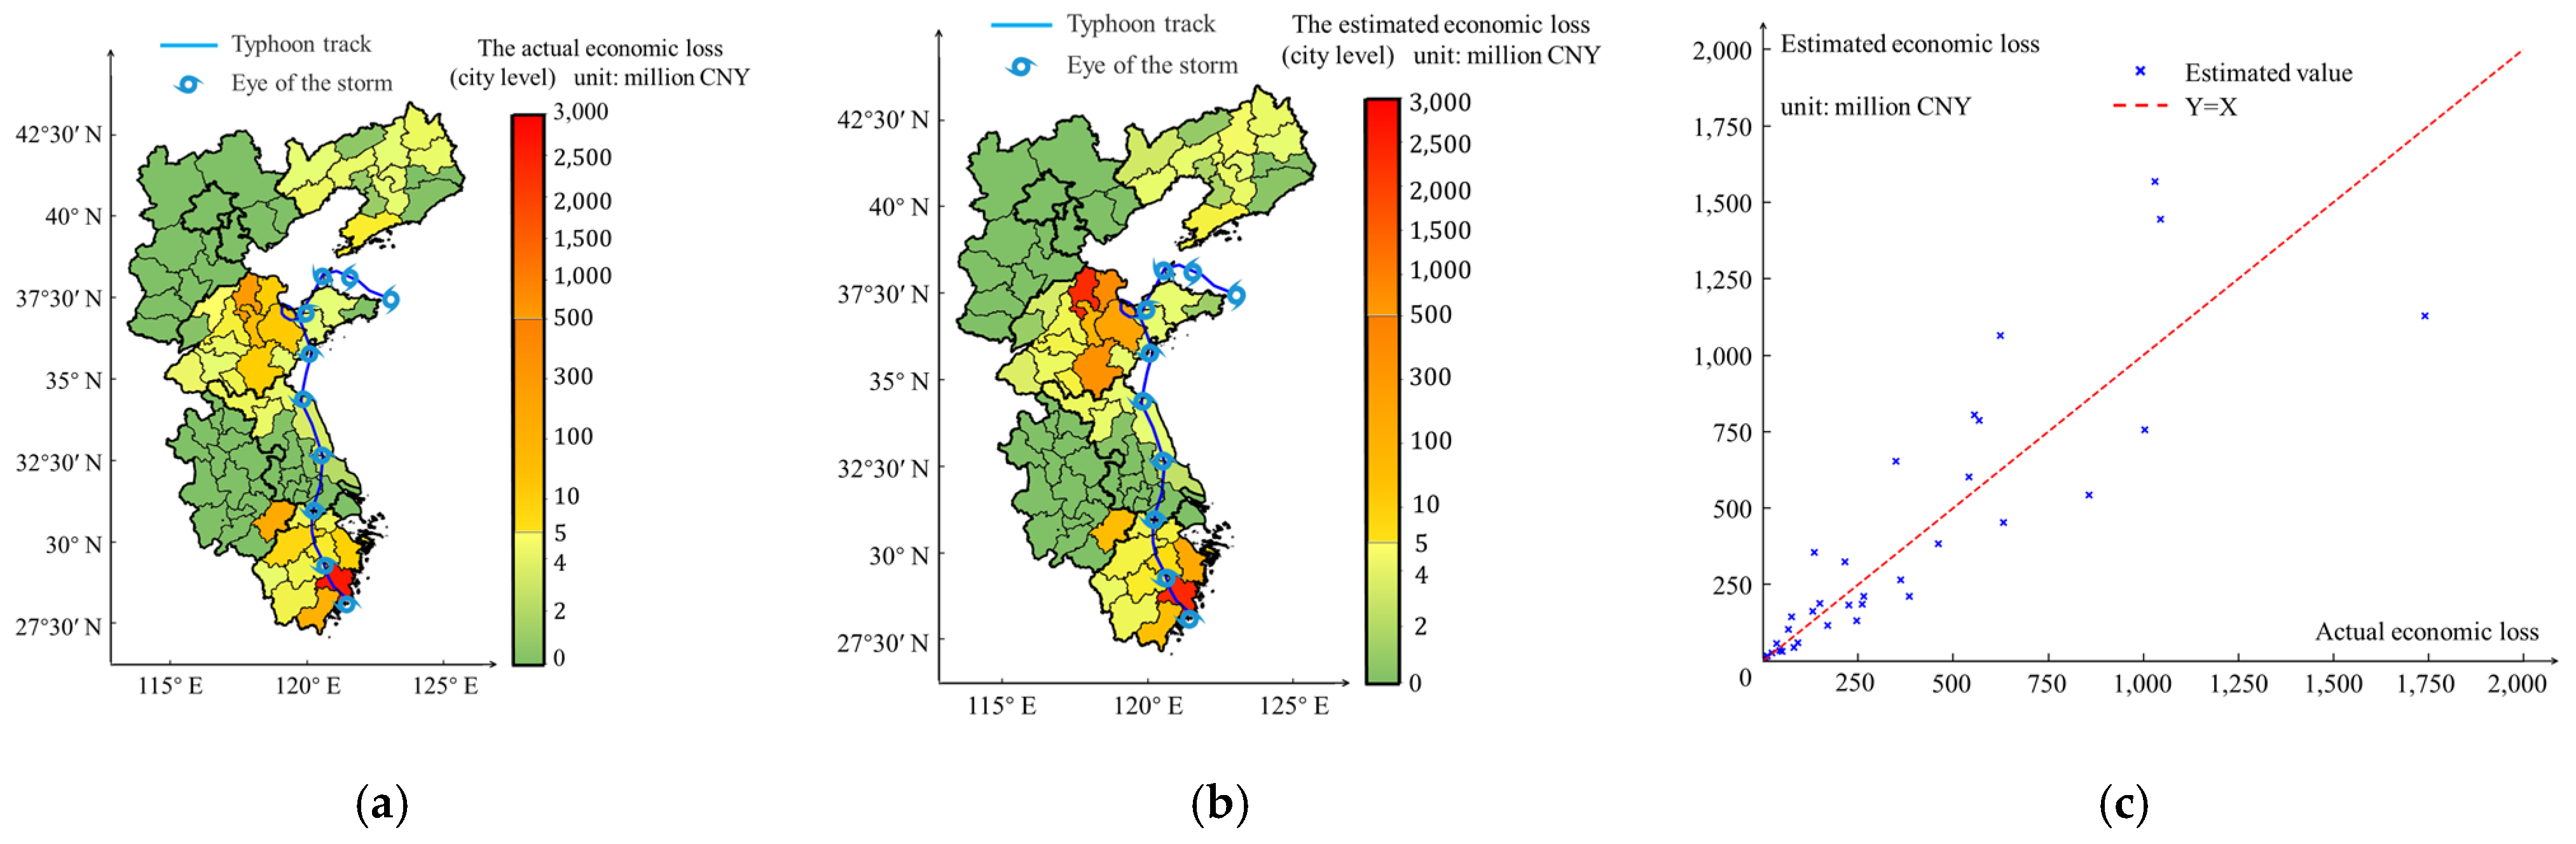
To facilitate a comprehensive analysis of the correlation between social media disaster information and economic losses in various regions, it is imperative to obtain precise data on direct economic losses at the district and county levels in the affected areas. Considering the comparable level of impact caused by disasters in various districts and counties within prefecture-level cities, we chose to distribute the estimated economic losses in prefecture-level cities based on the GDP of the district and county. This approach enables the evaluation of economic losses at district and county levels. The results pertaining to economic losses are depicted in Figure 5.
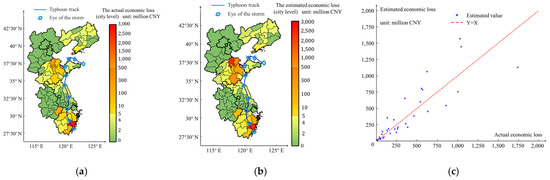
Figure 5.
Estimated distribution of direct economic losses. (a) Actual economic loss; (b) estimated economic loss; (c) scatter plot distribution.
4.2.3. Distribution of the Population in Need of Rescue Based on the Information Diffusion Model
The distribution of the population in need within the affected area was determined using an information diffusion model. To quantitatively evaluate the correlation between the population in need and geographic unit data, gray correlation analysis was performed on the population in need and geographic unit information. Gray correlation analysis is a widely recognized and effective method for addressing the complex correlation issues that may arise when dealing with multiple factors and variables. The fundamental concept underlying gray correlation analysis involves evaluating the geometric similarity between a reference data series and several comparable data series. The gray correlation value, which ranges from 0 to 1, indicates the degree of similarity between the trends of the two series. A higher gray correlation value indicates a stronger influence of the comparable data series on the reference series, suggesting a closer similarity trend. The data series in this study encompassed various factors such as the regional resident population, direct economic loss, wind circle impact coefficient, regional flood risk level, regional flood protection capacity level, and the vulnerability coefficient of residential houses. In contrast, the reference series pertains to the population in the typhoon-affected region that needs to be rescued, specifically referring to individuals who require relocation. Table 4 displays the gray correlation coefficients between the comparable and reference series, showing that the gray correlation value of the comparable series within the study area of GDP is lower than the value of direct economic loss. Therefore, we decided to depart from the traditional approach of utilizing GDP as the geographical unit of analysis and instead selected the estimated value of direct economic loss as the geographical unit of analysis. The gray scale correlation values of the remaining comparable series were higher, indicating that these influencing factors had a more pronounced impact on the number of individuals rescued from the region.
Table 4.
Gray correlation between the influencing factors and the population in need of rescue.
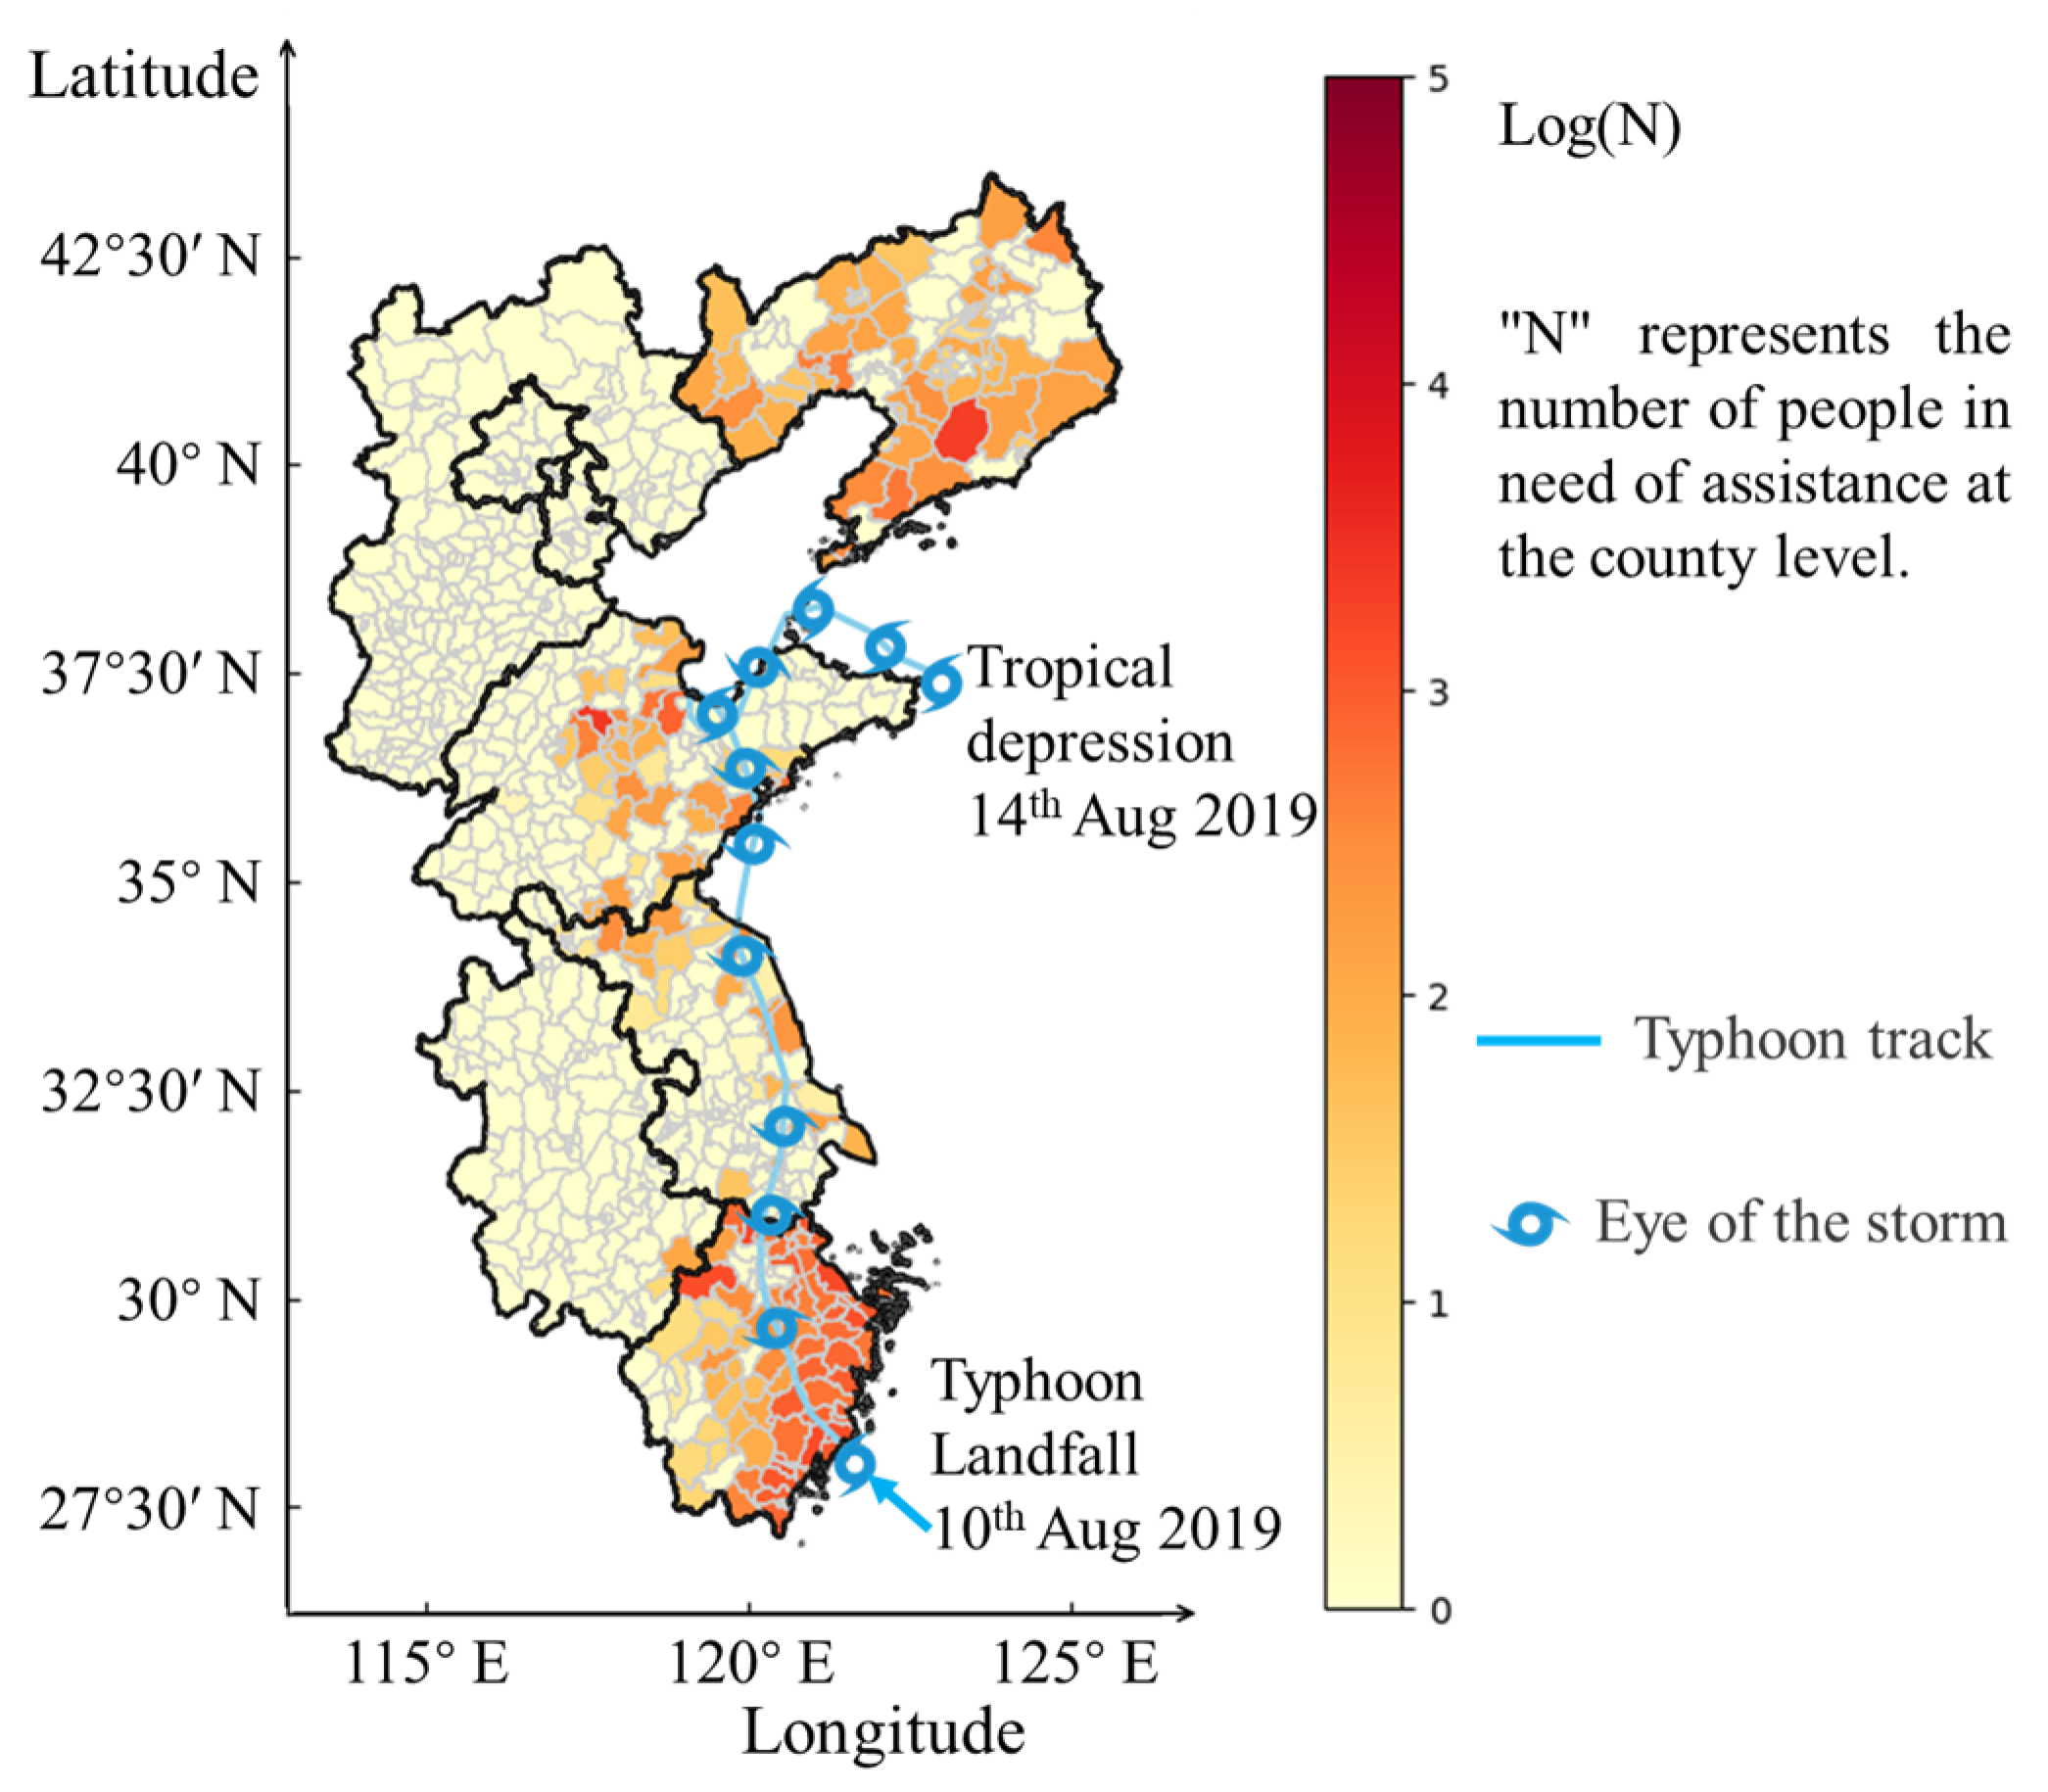
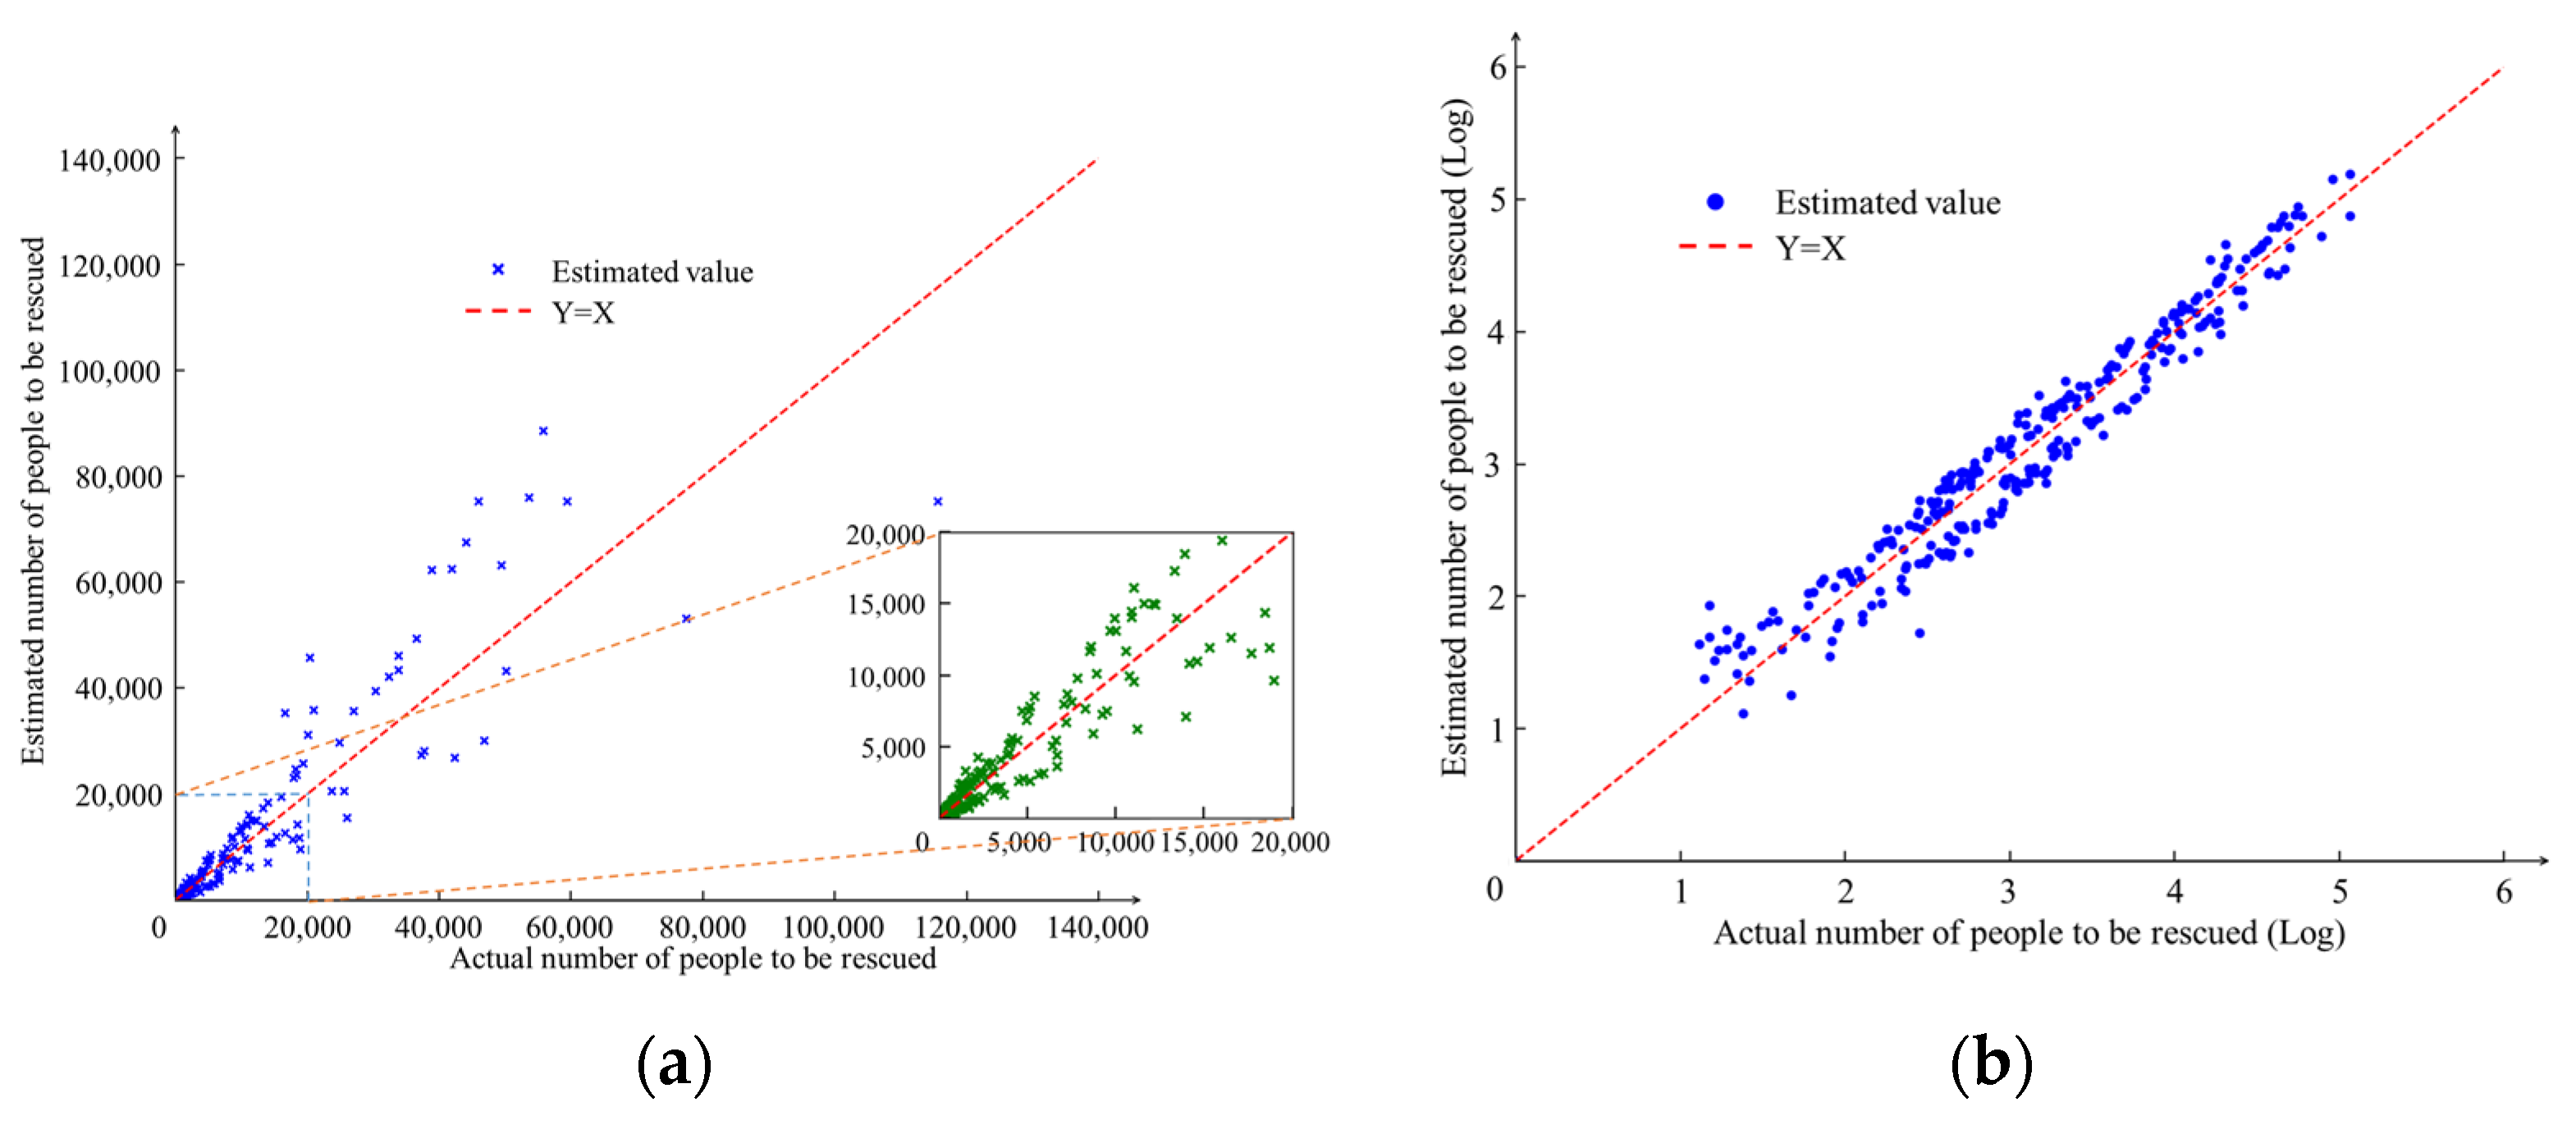
The number of individuals requiring rescue in each region affected by the typhoon was estimated using a geographic information diffusion model. The distribution of these individuals is illustrated in Figure 6. The population is predominantly distributed across different regions of Zhejiang and Liaoning Provinces, with some concentrations in specific areas of Shandong Province. Individuals requiring aid were mainly distributed in the coastal regions of Zhejiang, central regions of Shandong, and coastal regions of Liaoning. To evaluate the accuracy of the methodology, a scatter plot was used to compare the actual and estimated values of individuals requiring assistance. Figure 7a,b displays the scatter plot after applying a common logarithmic transformation (i.e., base 10) to the values in Figure 7a. As depicted in the figure, the estimated and actual values of the population in need of assistance obtained using the geographic information diffusion model exhibited a distribution aligned with the y = x line. The distribution of data indicates a close correspondence between the estimated number of individuals requiring assistance and the actual value, indicating a degree of feasibility in the estimation model.

Figure 6.
Geographical distribution map of the number of people in need of assistance at the county level.
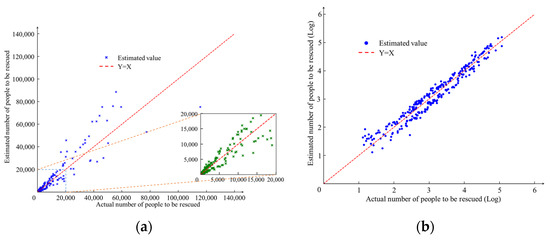
Figure 7.
Distribution of estimated versus actual number of persons in need of assistance. (a) Scatter plot of number of people to be rescued; (b) scatter plot applying a logarithmic transformation to the number of people to be rescued.
4.3. Results of the Estimated Demand for Relief Supplies
Currently, the categorization of relief materials for typhoon disasters predominantly encompasses consumable and non-consumable items. Consumable materials generally include provisions that are gradually exhausted, such as food, potable water, and medication. Non-consumable materials include items that can be reused or recycled, such as tents, quilts, clothing, and lifesaving instruments. The demand for consumable and non-consumable materials is often influenced by the population size of individuals needing assistance. Table 5 displays a curated set of criteria pertaining to emergency supplies. This study aimed to develop a model that assesses the demand for emergency materials during a typhoon by considering the estimated number of residents in need of assistance.
Table 5.
Criteria for relief supplies requirements in the subsistence category [33].
Table 6 and Table 7 list the quantities of tents, quilts, folding beds, and other materials per unit area in the reserve depots at different levels. It is assumed that all districts and counties have established corresponding material reserve depots.
Table 6.
Specification size and number of stacks per unit area of stockpile material in the reserve warehouse.
Table 7.
Storage area of the material reserve warehouse.
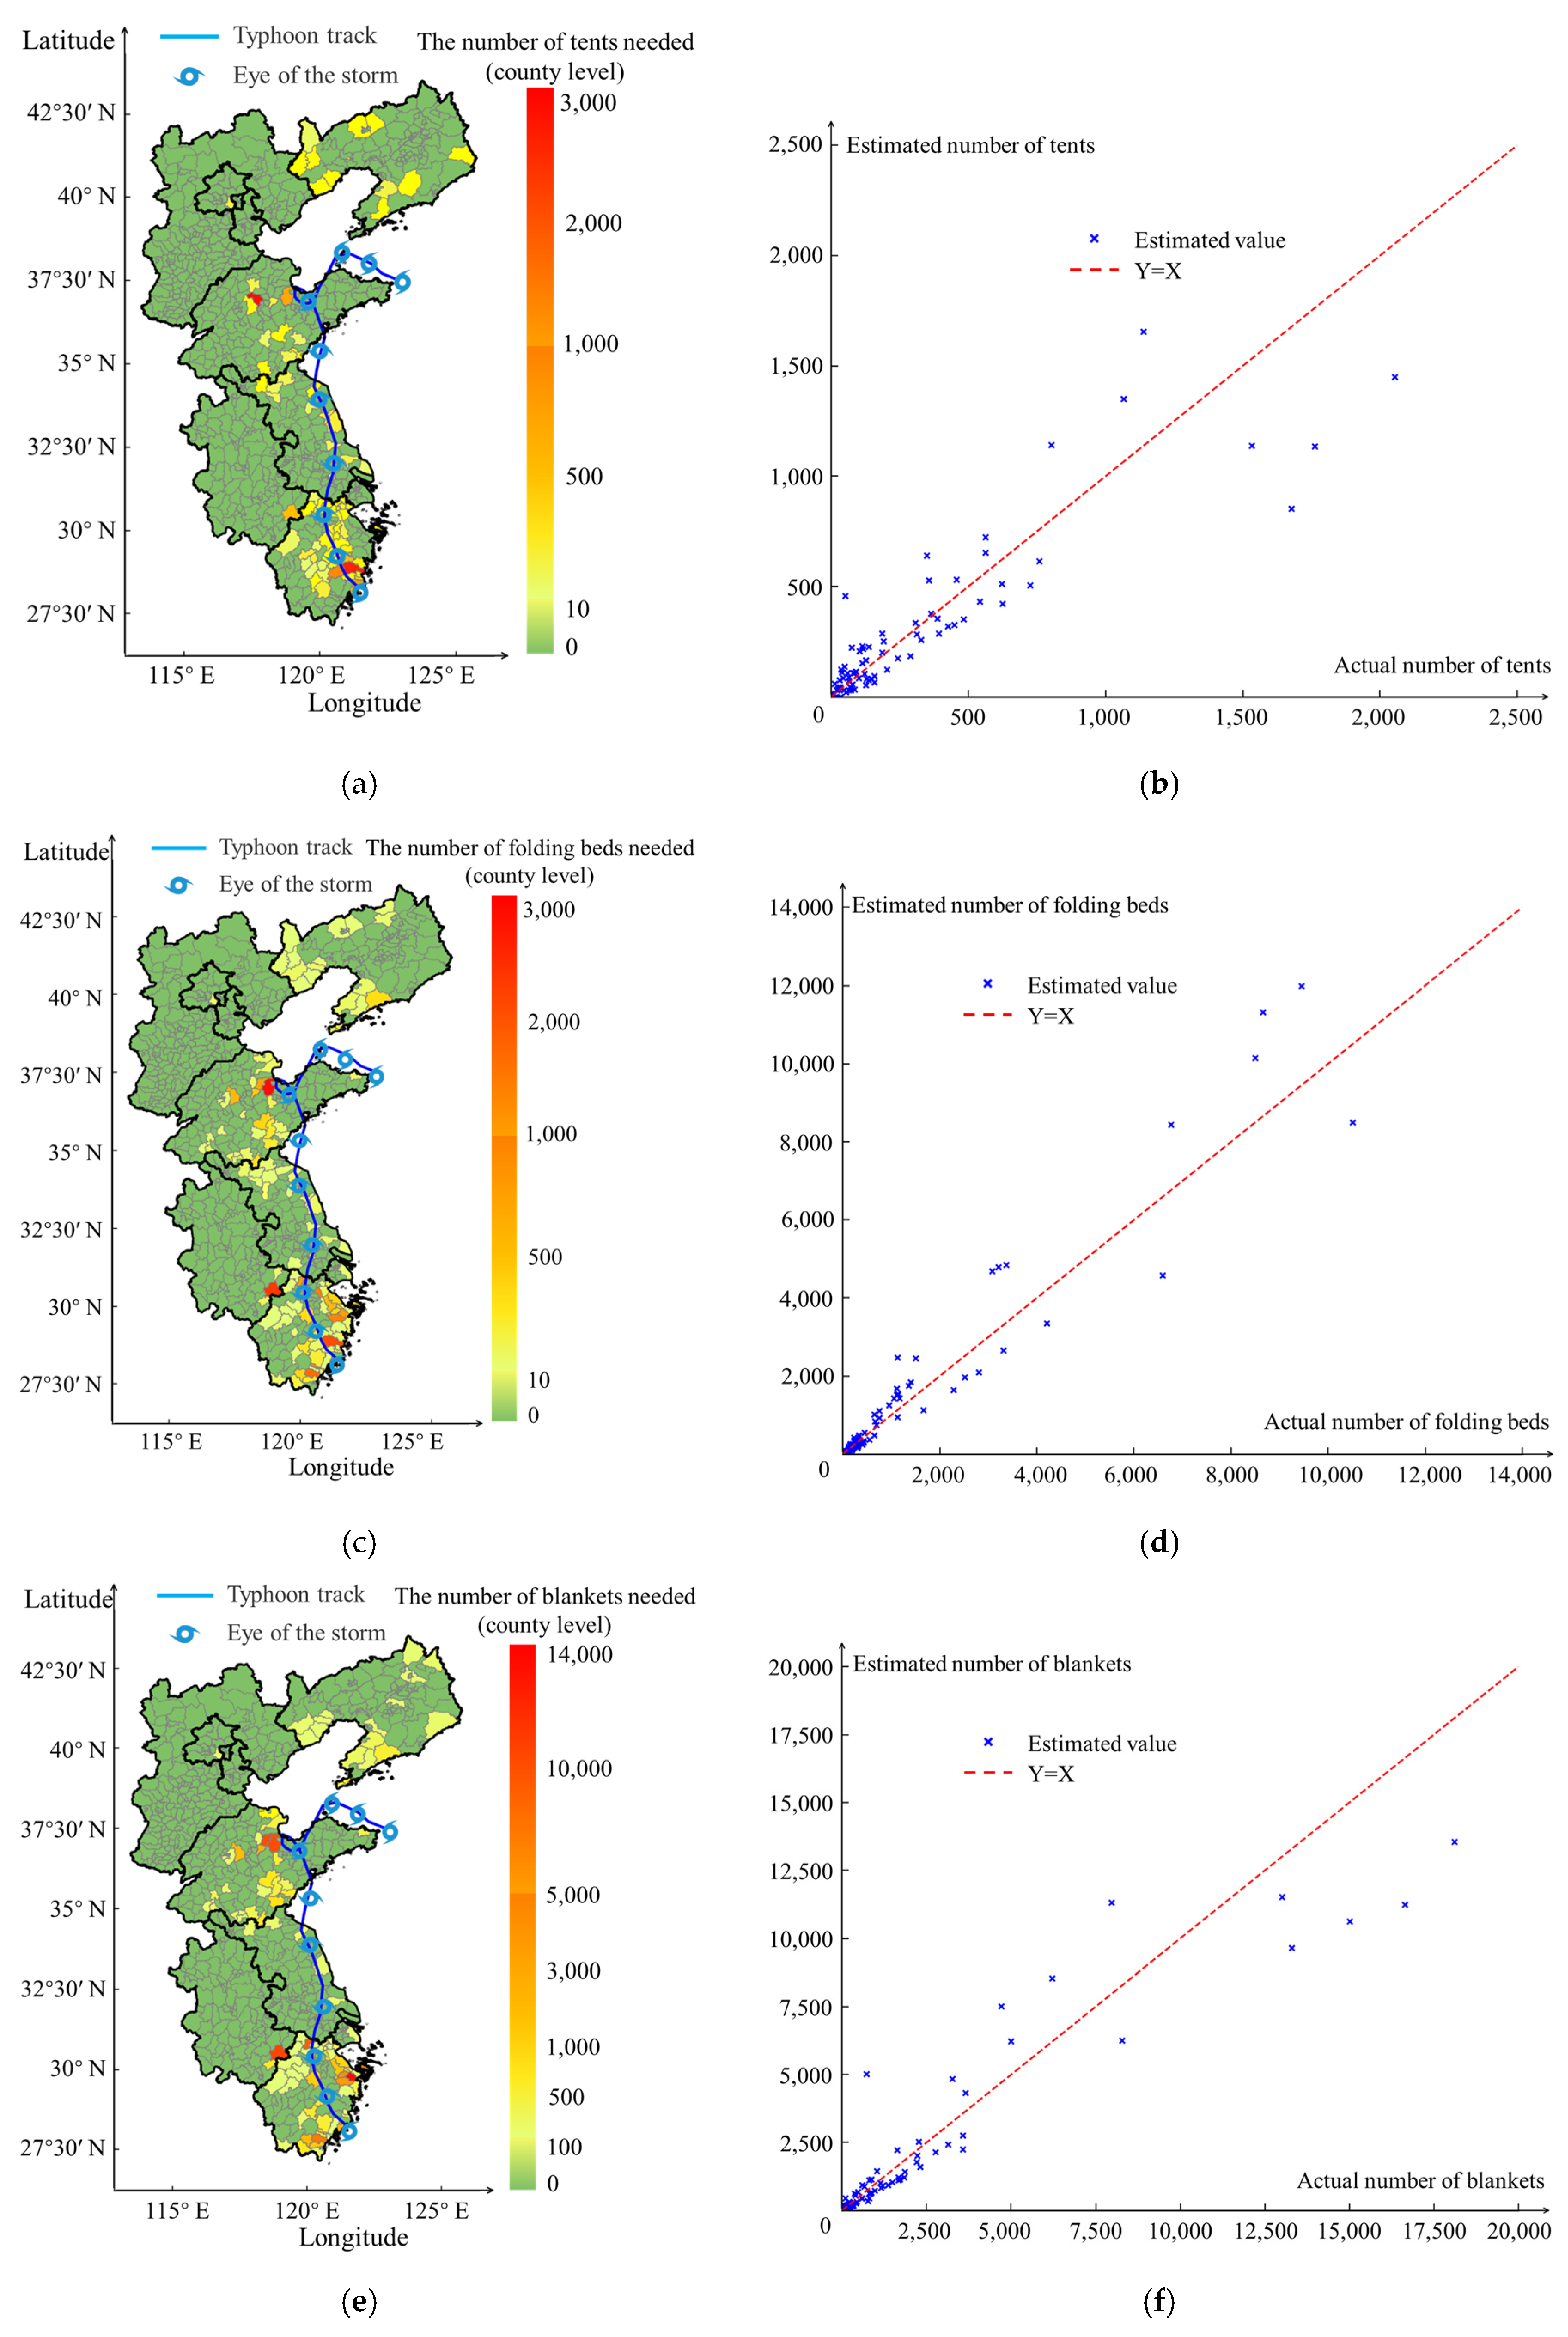
Figure 8a–c illustrate the estimated results of the regional distribution of supplementary emergency provisions required by each county-level city during typhoon disasters. According to the findings of the regional distribution analysis, Taizhou and Wenzhou in Zhejiang Province, Xuancheng in Anhui Province, and Weifang in Shandong Province required a substantial quantity of relief supplies. Additionally, some coastal regions of Liaoning required limited relief. Figure 8d–f illustrate the scatter distribution depicting the relationship between the estimated results of the supplementary emergency supplies required by each county-level city during typhoon disasters and the corresponding government statistics of the dispatched supplies. The distributions of the actual and estimated values of the emergency materials were observed on both sides of the y = x line. The error between the estimated and actual values decreases as the values approach the axis. The scatter distribution diagram of the three types of emergency materials revealed that the estimation model for disaster relief materials could effectively assess the feasibility of utilizing tents, folding beds, and quilts during typhoons.
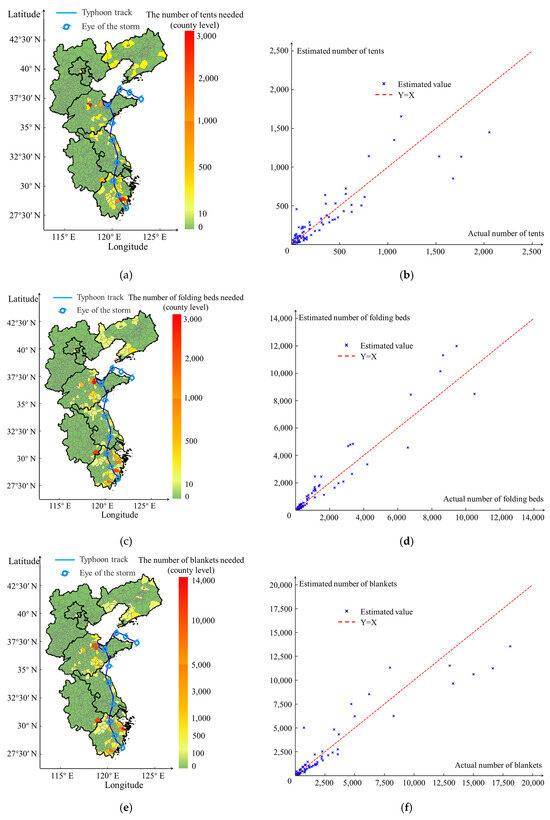
Figure 8.
Distribution maps and scatter plots of actual and estimated quantities of emergency supplies. (a) Map of estimated number of tents (county level); (b) scatter plot of number of tents; (c) map of estimated number of folding beds (county level); (d) scatter plot of number of folding beds; (e) map of estimated number of blankets (county level); (f) scatter plot of number of blankets.
To conduct a quantitative analysis of the emergency supply estimation model, an examination of errors and correlation tests was conducted on the actual and estimated values for tents, clothing, and folding beds. The test results are presented in Table 8. As indicated by the data in Table 8, the mean absolute error and the root mean square error between the observed values and the estimated values of the three categories of emergency supplies are within the acceptable range. All values were greater than 0.8, indicating that the estimation results were obtained from the emergency supply estimation model. The model exhibited an enhanced predictive capability.
Table 8.
Parameters for assessing the contingency material estimation model.
5. Conclusions
Estimating disaster relief requirements in the case of significant natural disasters is frequently impeded by uncertain and incomplete information. To mitigate this, this study proposes the integration of social media data as a complementary source of information to enhance the accuracy of disaster-relief demand estimation models. Data on the extent of flood inundation and the severity of damage in areas affected by typhoon disasters were acquired through information mining using social media big data. A spatial information diffusion model was employed to effectively extend information coverage to areas previously undetected on social media. Comprehensive information regarding the flooded areas within the typhoon impact zone was obtained. The population requiring assistance was estimated from available data on the extent of the flooded area. Based on an assessment of the population requiring rescue in the flooded regions, the material resources required for rescue operations were estimated. This estimation was then combined with existing emergency material reserves in flooded areas, resulting in a final estimation of the emergency material resources required for rescue operations in the affected regions.
However, vulnerability and exposure to disaster-bearing vectors exhibited significant regional variations. The selection of certain conventionally significant variables for evaluating the effects of disasters in research is frequently a topic of debate and lacks a logical basis. Furthermore, the scarcity of social media data in specific geographical areas presents difficulties in accurately assessing disaster-relief needs. To mitigate these issues, the proposed methodology requires acquisition of supplementary datasets pertaining to analogous calamities. Through a comparative and analytical examination of these datasets, our objective was to enhance the precision of disaster characterization and quantification. In addition, we verified the suitability and universality of the proposed model.
Author Contributions
Conceptualization, Shaopan Li; methodology, Shaopan Li; software, Shaopan Li and Yiping Lin; validation, Shaopan Li and Yiping Lin; formal analysis, Shaopan Li and Hong Huang; investigation, Shaopan Li; resources, Hong Huang; data curation, Shaopan Li and Yiping Lin; writing—original draft preparation, Shaopan Li and Yiping Lin; writing—review and editing, Hong Huang; visualization, Shaopan Li and Hong Huang; supervision, Hong Huang; project administration, Hong Huang; funding acquisition, Hong Huang. All authors have read and agreed to the published version of the manuscript.
Funding
This research was funded by China National Natural Science Foundation grant number No. 72091512. And The APC was funded by China National Natural Science Foundation.
Data Availability Statement
Data will be made available on request.
Conflicts of Interest
The authors declare no conflicts of interest.
References
- Grahn, T.; Nyberg, L. Assessment of pluvial flood exposure and vulnerability of residential areas. Int. J. Disaster Risk Reduc. 2017, 21, 367–375. [Google Scholar] [CrossRef]
- Rubinato, M.; Nichols, A.; Peng, Y.; Zhang, J.; Lashford, C.; Cai, Y.; Lin, P.; Tait, S. Urban and river flooding: Comparison of flood risk management approaches in the UK and China and an assessment of future knowledge needs. Water Sci. Eng. 2019, 12, 274–283. [Google Scholar] [CrossRef]
- Shen, G.; Hwang, S.N. Spatial–Temporal snapshots of global natural disaster impacts Revealed from EM-DAT for 1900–2015. Geomat. Nat. Hazards Risk 2019, 10, 912–934. [Google Scholar] [CrossRef]
- Shao, J.; Liang, C.; Liu, Y.; Xu, J.; Zhao, S. Relief demand forecasting based on intuitionistic fuzzy case-based reasoning. Socio Econ. Plann. Sci. 2021, 74, 100932. [Google Scholar] [CrossRef]
- Mohammadi, R.; Fatemi Ghomi, S.M.T.; Zeinali, F. A new hybrid evolutionary based RBF networks method for forecasting time series: A case study of forecasting emergency supply demand time series. Eng. Appl. Artif. Intell. 2014, 36, 204–214. [Google Scholar] [CrossRef]
- Liu, W.; Hu, G.; Li, J. Emergency resources demand prediction using case-based reasoning. Saf. Sci. 2012, 50, 530–534. [Google Scholar] [CrossRef]
- Sahebi, I.G.; Jafarnejad, A. Demand Forecasting of Emergency Resource in Humanitarian Supply Chain. In Proceedings of the 103rd IRES International Conference, Zurich, Switzerland, 16–17 February 2018; Volume 4. [Google Scholar]
- Sheu, J.-B. Dynamic relief-demand management for emergency logistics operations under large-scale disasters. Transp. Res. E 2010, 46, 1–17. [Google Scholar] [CrossRef]
- Taskin, S.; Lodree, E.J. A Bayesian decision model with Hurricane Forecast updates for emergency supplies inventory management. In Operational Research for Emergency Planning in Healthcare; Mustafee, N., Ed.; The OR Essentials Series; Palgrave Macmillan UK: London, UK, 2016; Volume 1, pp. 330–352. [Google Scholar] [CrossRef]
- Bedi, J.; Toshniwal, D. Deep learning framework to forecast electricity demand. Appl. Energy 2019, 238, 1312–1326. [Google Scholar] [CrossRef]
- Freire, S.; Aubrecht, C. Integrating population dynamics into mapping human exposure to seismic hazard. Nat. Hazards Earth Syst. Sci. 2012, 12, 3533–3543. [Google Scholar] [CrossRef]
- Gao, N. Models on Rapid Judgement for the Emergent Rescue Needs during Earthquake—By Analysis on Post Earthquake Events. Resour. Sci. 2001, 23, 69–76. Available online: https://www.semanticscholar.org/paper/MODELS-ON-RAPID-JUGEMENT-FOR-THE-EMERGENT-RESCUE-ON-Gao/986dfedd65d810c70cb558c77a1989408e25d3e3 (accessed on 19 October 2023).
- Chen, X.; Liu, Z. Demand Forecast of Emergency Supplies Based on Gray Model; Atlantis Press: Amsterdam, The Netherlands, 2015; pp. 1357–1361. [Google Scholar] [CrossRef]
- Masuya, A.; Dewan, A.; Corner, R.J. Population evacuation: Evaluating spatial distribution of flood shelters and vulnerable residential units in Dhaka with geographic information systems. Nat. Hazards 2015, 78, 1859–1882. [Google Scholar] [CrossRef]
- Nadi, A.; Edrisi, A. Adaptive multi-agent relief assessment and emergency response. Int. J. Disaster Risk Reduc. 2017, 24, 12–23. [Google Scholar] [CrossRef]
- Wu, K.; Wu, J.; Ye, M. A review on the application of social media data in natural disaster emergency management. Prog. Geogr. 2020, 39, 1412–1422. [Google Scholar] [CrossRef]
- Rizk, Y.; Jomaa, H.S.; Awad, M.; Castillo, C. A Computationally Efficient Multi-Modal Classification Approach of Disaster-Related Twitter Images; ACM: Limassol, Cyprus, 2019; pp. 2050–2059. [Google Scholar] [CrossRef]
- Steiger, E.; de Albuquerque, J.P.; Zipf, A. An Advanced Systematic Literature Review on Spatiotemporal Analyses of Twitter Data. Trans. GIS 2015, 19, 809–834. [Google Scholar] [CrossRef]
- Dalla Mura, M.; Prasad, S.; Pacifici, F.; Gamba, P.; Chanussot, J.; Benediktsson, J.A. Challenges and opportunities of multimodality and data fusion in remote sensing. Proc. IEEE 2015, 103, 1585–1601. [Google Scholar] [CrossRef]
- Lin, A.; Wu, H.; Liang, G.; Cardenas-Tristan, A.; Wu, X.; Zhao, C.; Li, D. A big data-driven dynamic estimation model of relief supplies demand in urban flood disaster. Int. J. Disaster Risk Reduc. 2020, 49, 101682. [Google Scholar] [CrossRef]
- Schempp, T.; Zhang, H.; Schmidt, A.; Hong, M.; Akerkar, R. A framework to integrate social media and authoritative data for disaster relief detection and distribution optimization. Int. J. Disaster Risk Reduc. 2019, 39, 101143. [Google Scholar] [CrossRef]
- Wu, F.; Liu, J.; Wu, C.; Huang, Y.; Xie, X. Neural Chinese named entity recognition via CNN-LSTM-CRF and joint training with word segmentation. In Proceedings of the WWW’19: World Wide Web Conference, San Francisco, CA, USA, 13–17 May 2019; pp. 3342–3348. [Google Scholar] [CrossRef]
- Ma, X.; Hovy, E. End-to-end sequence labeling via bi-directional LSTM-CNNs-CRF. In Proceedings of the 54th Annual Meeting of the Association for Computational Linguistics (Volume 1: Long Papers), Berlin, Germany, 7–12 August 2016; pp. 1064–1074. [Google Scholar] [CrossRef]
- Huang, Z.; Xu, W.; Yu, K. Bidirectional LSTM-CRF Models for Sequence Tagging. arXiv 2015, arXiv:1508.01991. [Google Scholar] [CrossRef]
- Panchendrarajan, R.; Amaresan, A. Bidirectional LSTM-CRF for named entity recognition. In Proceedings of the 32nd Pacific Asia Conference on Language, Information and Computation, Hong Kong, China, 1–3 December 2018. [Google Scholar]
- Chen, Z.; Lim, S. Social media data-based typhoon disaster assessment. Int. J. Disaster Risk Reduc. 2021, 64, 102482. [Google Scholar] [CrossRef]
- Mikolov, T.; Chen, K.; Corrado, G.; Dean, J. Efficient Estimation of Word Representations in Vector Space. arXiv 2013, arXiv:1301.3781. [Google Scholar] [CrossRef]
- Tian, W.; Huang, C. A Python approach to collecting disaster data for the Internet of Intelligences. In Risk Analysis Based on Data and Crisis Response Beyond Knowledge; CRC Press: Boca Raton, FL, USA, 2019. [Google Scholar]
- Huang, C.; Ruan, D. Fuzzy risks and an updating algorithm with new observations. Risk Anal. 2008, 28, 681–694. [Google Scholar] [CrossRef] [PubMed]
- Huang, C.; Wu, T.; Renn, O. A Risk Radar driven by Internet of intelligences serving for emergency management in community. Environ. Res. 2016, 148, 550–559. [Google Scholar] [CrossRef]
- Li, S.; Wang, Y.; Huang, H.; Huang, L.; Chen, Y. Study on typhoon disaster assessment by mining data from social media based on artificial neural network. Nat. Hazards 2022, 116, 2069–2089. [Google Scholar] [CrossRef]
- Sabouhi, F.; Bozorgi-Amiri, A.; Moshref-Javadi, M.; Heydari, M. An integrated routing and scheduling model for evacuation and commodity distribution in large-scale disaster relief operations: A case study. Ann. Oper. Res. 2019, 283, 643–677. [Google Scholar] [CrossRef]
- Young, H.; Harvey, P. The sphere project: The humanitarian charter and minimum standards in disaster response: Introduction. Disasters 2010, 28, 99. [Google Scholar] [CrossRef]
Disclaimer/Publisher’s Note: The statements, opinions and data contained in all publications are solely those of the individual author(s) and contributor(s) and not of MDPI and/or the editor(s). MDPI and/or the editor(s) disclaim responsibility for any injury to people or property resulting from any ideas, methods, instructions or products referred to in the content. |
© 2024 by the authors. Licensee MDPI, Basel, Switzerland. This article is an open access article distributed under the terms and conditions of the Creative Commons Attribution (CC BY) license (https://creativecommons.org/licenses/by/4.0/).