Abstract
The United Nations Convention on the Rights of People with Disabilities recognizes the right of people with disabilities to attain full social participation without discrimination on the basis of disability. Furthermore, mobility is one of the most important life habits for achieving such participation. Providing people with disabilities with information regarding accessible paths and accessible urban places therefore plays a vital role in achieving these goals. The accessibility of urban places and pedestrian networks depends, however, on the interaction between human capabilities and environmental factors, and may be subdivided into physical or social factors. An optimal analysis of accessibility requires both kinds of factors, social as well as physical. Although there has been considerable work concerning the physical aspects of the environment, social aspects have been largely neglected. In this paper, we highlight the importance of the social dimension of environments and consider a more integrated approach for accessibility assessment. We highlight the ways by which social factors such as policies can be incorporated into accessibility assessment of pedestrian networks for people with motor disabilities. Furthermore, we propose a framework to assess the accessibility of pedestrian network segments that incorporates the confidence level of people with motor disabilities. This framework is then used as a tool to investigate the influence of different policies on accessibility conditions of pedestrian networks. The methodology is implemented in the Saint-Roch neighborhood in Quebec City and the effectiveness of three policy actions is examined by way of illustration.
1. Introduction
Despite significant efforts over the last decades, improving social participation of people with disabilities (PWD) is still a very challenging issue for our societies. This is because there is an important gap between the current design of urban environments and the way people with disabilities live and interact with such environments. Current urban infrastructures and services are generally designed based on a standard view of people without any deficiencies and the specific needs of PWD are often not taken into account in the development of cities, public places, new technologies and services. PWD who cannot move autonomously will not be able to accomplish their daily activities (such as go to work or school, go shopping, or participate in community and family life). To enable PWD to live independently and participate fully in all aspects of their life including effective participation in valued life activities, achievement of culturally and developmentally appropriate social roles, contribution to various aspects of community life, and full citizenship [1], a whole range appropriate issues needs to be taken into account. According to the United Nation’s Convention on the Rights of PWD [2], which is ratified by over 160 countries including Canada, equal access to urban places and services must be enshrined in law for everyone, regardless of any functional limits. To achieve this goal, Canada has put in place a number of actions including the adaption of related legislations and providing financial support to help community-based projects to improve the accessibility of buildings, vehicles, information and communication technologies, etc. [3].
The UN convention has its roots in the social model of disability [4,5,6] which was developed to highlight the impact of environmental factors in the definition of disability. Before the 1970s, the role of the environment was not considered to be important in the definition of disability. According to the earlier medical model, disability was considered to be the result of or related to diseases and injuries [5,7,8,9]. Criticisms of this paradigm led to the development of the social model of disability. This model defined disability as a product of inadequate social organization. Within this approach, impairments are treated as physical properties of the body, while disability results when society fails to provide a barrier-free environment, which does not discriminate on the basis of impairment. Furthermore, social exclusion can lead to isolation and inadequate social participation. Hence, in the social model of disability, socio-economic systems are considered to be the main factors affecting disability, while the older medical model views disability as a characteristic of the human body [9].
The mobility of people with motor disabilities (PWMD) is one of the most important life habits that significantly contribute to the social participation of PWMD. In order to assist PWMD in their mobility and social participation we need to provide them with information on accessible routes and accessible urban places as a function of their specific needs. The accessibility of a place or a route is assessed based on the interactions between human capabilities and environmental factors. Capability is an attribute of human behavior that differs from one person to another and is defined as a person’s potential to accomplish a mental or physical activity [10]. On the other hand, the environment is composed of entities with different properties, each entity which may have several physical and social properties. In their physical dimensions, entities are characterized by their physical properties whereas in their social dimensions, socio-cultural and political-economic properties can be identified [11]. According to these properties, each entity in the environment affords several actions such as walk-ability or roll-ability, and these will, in turn, modulate issues such as accessibility and suitability. In some cases, a sidewalk may not afford accessibility regardless of human capabilities. For example, because of the presence of a barrier, a sidewalk may not afford walk-ability. These barriers may affect the level of accessibility of pedestrians and especially of those with disabilities.
As implied above, however, accessibility depends on the capability of a person too. While a path may be accessible for one person, it may be inaccessible for others. Therefore, an optimal analysis of accessibility requires integrating both human capabilities and environmental factors. Although environmental factors have two dimensions—physical and social—in early definitions of accessibility the focus has been defined primarily by architectural elements such as ramps and curb cuts, that is, physical properties. In this paper, the accessibility assessment process is carried out considering both the physical and social dimensions of the environment. The social environment involves many factors that may have no direct influence on the mobility of pedestrians (e.g., political systems, governmental structures, and judicial systems). However, it is increasingly being accepted that policies, norms, and regulations related to mobility should take into account explicitly the needs of people with disability.
Here we emphasize the way in which social factors, and in particular, policies, affect the accessibility of urban infrastructures. Linking policies to changes in accessibility can be explored by planners to test the creation of more accessible areas within policy interventions. Policies that regulate the design and construction of pedestrian networks may vary from one city to another or from one country to another depending on the context and the types of social decisions undertaken by different city authorities. For example, altering what is prioritized during snow removal may impact the importance of curb cuts as barrier reductions in countries that have high average snowfall such as Canada, Norway, and Russia; this in turn may impact the accessibility of urban environments for PWMD. In this paper, we propose an approach seeking to investigate the effectiveness of different policy actions on the accessibility of pedestrian networks and their constituent segments. The approach is implemented in Saint-Roch, Quebec City for three policy actions, namely enhancing the quality of existing curb cut pavements (width, slope, and surface quality), removing snow from intersections, and relocating existing electricity poles from the sidewalks.
The remainder of this paper is organized as follows. Section 2 reviews related work. Section 3 describes the proposed research methods. Section 4 explains the accessibility assessment process and illustrates its use in the study area as well as describing some policy actions that may affect accessibility. Section 5 investigates the results of policy tests on the accessibility maps and finally, Section 6 presents conclusions and future work.
2. Related Works
Over the past two decades, a great deal of research ([12,13,14,15,16,17,18,19,20,21]) has focused on the mobility of people with special needs. Matthews et al. (2003) and Beale et al. (2006) [12,13] developed a model for navigation of wheelchair users in urban spaces, called MAGUS. The main objective of the MAGUS project was developing, testing and applying a GIS-based system for modeling accessibility for wheelchair users in urban areas. The process was subdivided into five steps including identifying the most frequently cited urban barriers such as surface quality and slopes; building the pedestrian route network by digitizing the centerline of pedestrian networks; employing the dynamic segmentation approach to generate segments with uniform attributes; quantifying barriers such as by mapping the terrain barriers and extracting slope values; and calculating the cost value for each segment and incorporating these into the proposed model. Kasemsuppakorn and Karimi (2009) [14] developed a model to personalize routing for wheelchair users. The research was focused on user priorities and sidewalk parameters. Sidewalk parameters included slope, surface quality, sidewalk width, presence of steps, and sidewalk traffic. This research used three weighting methods for path optimization, including the Absolute Restriction Method (ARM), the Relative Restriction Method (RRM) and the Path Reduction Method (PRM). Each method was carried out in four steps: weighting the sidewalk parameters; quantifying the impedance value of each segment; modeling the routes for wheelchair users; and choosing the optimal route among many possible routes. The method successfully integrated Fuzzy and AHP (Analytic Hierarchy Process) approaches to develop a routing system for wheelchair navigation. Jonietz and Timpf (2013) [15,16] proposed a framework for modeling spatial suitability of pedestrian networks based on affordance theory. This framework sought to assess suitability determined by characteristics of humans and their environment, as well as interactions between these. Their model calculated a suitability value by combining pairs of environmental properties and human capabilities. Environmental properties such as trip distance and sidewalk slope were used to rate the suitability of paths. This model was implemented in a navigation scenario for five persons with different abilities with respect to segment slopes and the presence of stairs. Tajgardoon and Karimi (2015) [17] proposed a path determination approach based on a weighted linear model for different characteristics of sidewalk segments to evaluate the accessibility of sidewalks for PWMD. These characteristics included segment distance, slope, width, surface quality, and different sidewalk traffic zones. They developed this approach to simulate and visualize the accessibility for two groups of PWMD as well as for blind users. Finally, Gilart-Iglesias et al. (2015), Mora et al. (2016, 2017), and Pérez-Delhoyo et al. (2017) [18,19,20,21] proposed systems for the analysis and evaluation of the effectiveness of urban accessibility, specifically for people with disabilities, using the latest advances in the information and communication technologies, global positioning systems(GPS), geographic information systems (GIS), smart sensing, and cloud computing. The proposed models provide automatic monitoring tools to dynamically discover, assess, and classify the accessibility of urban environments.
Although, all of these studies considered human-environment interactions in the evaluation of accessibility of a pedestrian network, they only evaluated the physical dimensions of the environment and ignored the impact of the social dimensions on the accessibility of PWMD. There are a few studies in the literature which consider the social dimensions of the environment in their studies concerning the mobility of pedestrians [22,23,24,25]. For instance, Mackett et al. [22] developed a software tool called AMELIA to show the impacts of transport policy, as a social factor, on the social inclusion of elderly people and PWD. They tested the influences of applying four new policies to improve the accessibility of the St Albans city center for PWD. The influence of policies was quantified and visualized on the city map. They showed that providing benches as an urban design policy would provide the most cost-effective increase in accessibility of the pedestrian network. In other work, Tansawat et al. [23] showed that the average income of families has a significant negative relationship with respect to social inclusion. This study investigated the influence of a free train policy on the encouragement of low-income groups to participate more fully in a range of daily activities. Anciaes and Jones [24] analyzed the influence of interventions based on the reduction of barriers within the pedestrian network. These interventions included changing the layout of the local street networks and redesigning busy streets. They investigated how employing new interventions such as increasing the density and connectivity of the links available to pedestrians, adding crossing facilities, reducing the speed limit, or reallocating road space to pedestrians could affect the way pedestrians walk within the network. In another study, Morales et al. [25] aimed to investigate some design solutions to improve the accessibility of sidewalks for seniors, wheelchair and walker users during winter conditions. They showed that existing snow removal policies were not adequate to provide the accessibility required for PWMD. This research proposed applying new policies to remove snow from the sidewalks.
Although most of these studies propose solutions in order to increase social inclusion and consequently to improve life quality, to our knowledge, neither of them consider and quantify the impact of the social factors and policies in the estimation of the accessibility of the pedestrian networks in urban environment. In the present study, we analyzed the accessibility of the existing pedestrian network with the consideration of different policies and then estimate the effectiveness of proposed solutions and visualized them on the accessibility maps.
3. Methodology
Several definitions are presented for accessibility in different contexts. For example, in urban mobility, accessibility is often defined as the ease of reaching a destination with respect to distance, time and cost constraints [26]. In the case of pedestrian mobility, however, accessibility depends on the interactions between the individuals and the pedestrian network itself. In our methodology, we quantify the accessibility level of different segments (as a cost value) by integrating a measure of confidence on the part of PWMDs with regard to their mobility. Assessing the accessibility level of each segment in this way, the accessibility map of the pedestrian network is then generated. This map is used as a tool to investigate the influence of different policies on the accessibility of the pedestrian network. Figure 1 displays an overview of this methodology. First, the most important barriers are identified based on the perception of the PWMD themselves. These, combined with other relevant properties, are then used to segment the pedestrian network. A user profile database is created which incorporates a range of different factors, and these, in turn, are matched to factors previously stored in the network database. The aforementioned databases are then used as inputs to a fuzzy logic system used to calculate the cost value of each segment and then generate a map of the accessibility of the pedestrian network. Finally, in order to evaluate the influence of possible policies, the network database can be updated based on the effects of new policies. Using the updated database, all of the processing steps can be repeated to generate new accessibility maps and evaluate the effectiveness of proposed policies.
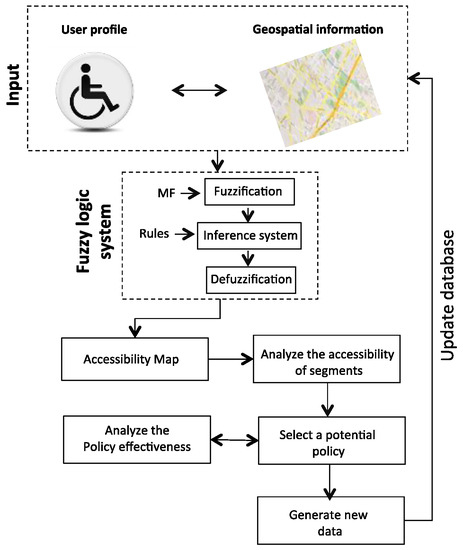
Figure 1.
An overview of the proposed methodology.
3.1. Accessibility Assessment Framework for People with Motor Disabilities
The accessibility assessment process is carried out in three steps including generating the pedestrian network and its segments, gathering user profile information, and evaluating the accessibility level of each segment based on user confidence.
3.1.1. Generating the Pedestrian Network Database
One of the major issues related to existing navigation systems is that the map data has generally been designed for car navigation and is not appropriate for pedestrians. Pedestrian networks are parts of urban areas that play a significant role in the outdoor mobility of PWMD. Pedestrian networks are typically classified into sidewalks, crosswalks, footpaths, building entrances, trails, pedestrian bridges, and tunnels [27]. Besides sidewalks, which have significant influence on the mobility of PWMD, intersections including crosswalks and curb cuts are also considered as important subclasses of pedestrian network elements for PWMD [28]. Crosswalks are designated to indicate the crossing places for pedestrians and curb cuts assist wheelchair users (or any wheeled device) to transit easily from sidewalk to crosswalk (or road surface in general) and vice-versa. In the literature, all of these classes are analyzed in similar ways. However, the perception of PWMD is different regarding each of these classes and their properties. For instance, from their perception, the influence of a pothole located on the crosswalk on their mobility is completely different than one located on the sidewalk.
Hence, in order to assess the accessibility of pedestrian networks for PWMD, there is a need to analyze each type of class separately. Thus, our pedestrian network includes three types of components, namely sidewalks, curb cuts, and crosswalks. In addition, in order to assess the accessibility level of each component, these are divided into segments with similar properties. Each segment has parameters that can be either static or temporal. As a result, the pedestrian network contains decision points connected by sidewalk, curb cut, and crosswalk segments, where each segment is represented as a vector with properties. In our previous work, we investigated in detail which of these properties were required for PWMD, and how these should be divided into static and temporal factors (for details see Gharebaghi et al. (2017)). Table 1 shows the barriers most frequently identified by PWMD, the range of values, their fuzzy classes, and their definitions. Thus, the properties (S, W, SuT, SuQ, SeT, SeL, HC as presented in Table 1) are categorized in the fuzzy set classes by predefined defined membership values. For example, the surface quality values are classified into three sets including Poor, Fair, and Good. A segment with quality value of 3.5, for example, belongs to the fuzzy set Poor with the membership value 0.5, and to the fuzzy set Fair with a membership value of 0.5 (for more details see [14]).

Table 1.
Most commonly identified potential barriers for people with motor disabilities (PWMD).
3.1.2. User Profile Database
The accessibility of the pedestrian network for PWMD is evaluated in relation to the interaction between the user’s capabilities and the surrounding environment. For example, a segment can be accessible for some while inaccessible for others even if the type of disability is the same. In order to evaluate the ability of a wheelchair user, approaches such as the Wheelchair Skill Test (WST) [29], the Wheelchair Circuit [30], and the Wheelchair Outcome Measure (WhOM) [31] have been proposed. In this paper, we measure the perceived ability (i.e., confidence) of a person for performing a given task. Confidence has been identified as a potential contributor to wheelchair mobility via a search of the wheelchair skills training literature [32] and the evidence suggests a user’s confidence is a stronger predictor of performance than the skill itself [33]. A person might be able to perform a given task but not be confident enough to carry it out. According to (Rushton, 2010; Rushton et al., 2011) confidence is a more reliable criterion than actual ability.
To quantify the confidence level of individuals, the wheelchair use confidence scale (WheelCon, Rushton, 2010) was employed. According to this approach, the user’s confidence level for a mobility task is expressed using a value between 0 (low confidence) to 100 (high confidence) (Rushton, 2010). Hence, we characterized the individual’s confidence regarding each class of barrier using a value in the range of [0, 100]. Figure 2 situates the relationship between the values of slope and width of a segment and confidence level for three different users. The confidence values were then fuzzified into fuzzy set classes by membership values including Very Low, Low, Medium, High, or Very High. For example, a segment with slope value of 8% is associated with the fuzzy set Moderate while Steep, which depends on the user profile, might belong to the fuzzy set of Medium confidence or Low confidence. So, we replace the values of variables (S, W, SuT, SuQ, SeT, SeL, HC, and Sn) with corresponding user confidence fuzzy values (, , , , , , , ).
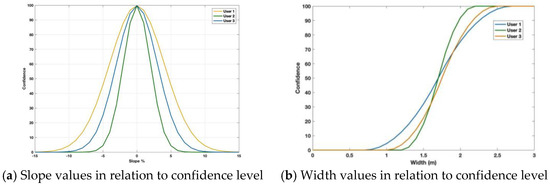
Figure 2.
A simulation of the relationship between the slope and width values of a segment with regard to confidence levels of users.
3.1.3. Computing the Cost Values
In order to evaluate the accessibility level of each segment, a cost value representing the accessibility level of that segment was calculated. To determine this cost value, the different values associated with the segment’s properties, which are crisp values, need to be aggregated. However, in many cases the precise quantitative values are often inadequate to describing real-life situations and people use a more qualitative way to characterize environmental factors that affect mobility (e.g., narrow sidewalks). In our study, the fuzzy logic approach is utilized to meet these requirements. Fuzzy logic, introduced by Zadeh et al. (1965), is widely used in many different applications including routing and transportation planning ((Kasemsuppakorn and Karimi 2009) and (Karimanzira et al., 2006)) to model the vagueness that is associated with human cognitive processes. To employ fuzzy logic, three steps must be followed: (1) build the rule set and define the membership functions (fuzzification); (2) develop a fuzzy inference system (FIS) using if-then rules and (3) merge the outputs of the rules and ensure defuzzification of the results using a different set of membership functions to derive output variables (Mamdani and Assilian, 1975).
To carry out the fuzzy logic approach, first, the transformation from the pre-determined accessibility values into a non-crisp fuzzy environment was conducted. This process is called fuzzification and is performed by defining membership functions. A membership function is a mathematical function which maps the association of a value to a set between 0 and 1 [34]. In this paper, the membership functions for all variables were expressed in trapezoidal fuzzy numbers. Thus, the accessibility values (S, W, SuT, SuQ, SeT, SeL, HC, and Sn) were transferred into fuzzy set classes using predefined membership values. For example, slope can be defined as gentle, moderate, or steep. A slope value, for example, 3%, corresponds to the gentle and moderate subsets according to the membership function. Following this, the fuzzy membership of each attribute of a segment must be transformed to generate a user confidence level (e.g., S_Con). In our case, there were five fuzzy sets including VL, L, M, H, and VH, and nine variables including S, W, SuQ, SuT, SeL, SeT, HC, and Sn. The If-Then rules were subsequently defined to aggregate the individual user confidences and, consequently, calculate the accessibility level of each segment as the output variable. For example:
If (the S_Con is very low) & (the SuQ_Con is low) Then (the segment is not accessible).
In order to cover all possible combinations of fuzzy sets for diverse variables, it is necessary to define rules where m is the fuzzy set number and n is the number of variables. Therefore, we needed to define rules. Table 2 presents the rule definitions, which are stated as if aggregation can only be applied to two components; in cases where more than two parameters result from an earlier aggregation, each element of a parameter pair is aggregated with the next parameter and this process is continued until the total confidence is obtained. Since these rules directly affect the result of the process, they need to be validated. In our research, an expert who is also a wheelchair user carried out the validation step. However, we understand that further investigation is needed for a more rigorous validation of these rules by participation of experts and wheelchair users.
Table 2.
Defined if-then rules between two variables of p & q.
Once the rules are defined and the aggregation step is performed, the accessibility index of each segment can be derived. To address this issue, a defuzzification technique should be applied to produce exact numerical values from the fuzzy values based on the defined membership functions and rules. The output values were utilized for determining the accessibility levels of pedestrian network segments via five categories: Not Accessible (NA), Low Accessible (LA), Medium Accessibility (MA), Accessible (A), and Very Accessible (VA).
3.2. The Influence of Policies and Regulations on Accessibility
Mobility initiatives for PWMD cannot be limited to the physical dimension of the problem only; social issues need to be addressed too [5,6]. In the Human Development Model—Disability Creation Process (HDM-DCP) [6,10], a model of disability widely used in rehabilitation, the environment is partitioned into two parts—physical and social. The social part of the environment involves many factors (see the taxonomy in Figure 3), many of which may have no direct influence on the mobility of pedestrians (e.g., political systems, governmental structures, and judicial systems). However, it is increasingly being accepted that policies, norms, and regulations related to mobility should take into account explicitly the needs of those who have special needs.
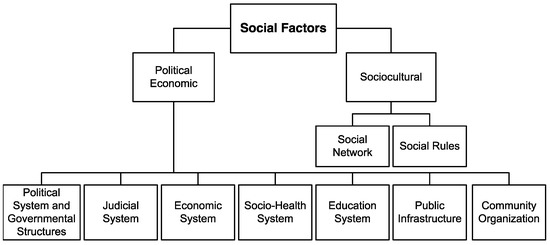
Figure 3.
Taxonomy of the relevant social factors.
In the context of pedestrian network accessibility, in some cases, the influence of social factors is more noticeable than their physical counterparts. For example, Figure 4 shows the physical entities on the sidewalk including accumulation of snow and presence of trash bins. These barriers affect the accessibility of sidewalk segments for everyone, but especially for PWMD. Although these entities belong to the physical environment, the main cause of the presence of these barriers is related to social behavior and hence these should be considered as social factors. This implies that these barriers should be considered in relation to the snow removal and weekly trash collection policies of a municipality, or to the culture or behavior of the people living in the neighborhood of the sidewalk. These are examples of social factors that affect the level of accessibility of the sidewalk.
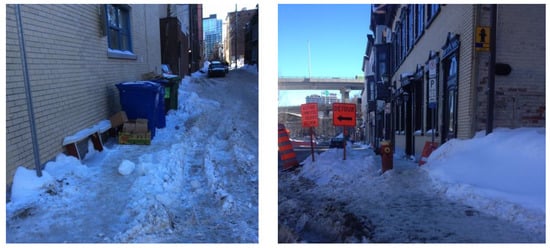
Figure 4.
Examples of barriers on the sidewalk.
In order to analyze the effective influence of social factors on the accessibility of pedestrian networks, we propose to investigate the influence of different policy actions on the generated accessibility map for wheelchair users. To address this issue, our proposed methodology quantifies the influence of applying the policies and applies the results to the accessibility map. To do so, first, we select the given policy action and generate new data corresponding that policy action. The generated data then replaces the original data in the pedestrian network database, the accessibility evaluation process is carried out again anew, and the resulting accessibility map is regenerated. Finally, the retrieved results and the effectiveness of that policy are investigated. In the following section, this whole process is implemented for the Saint-Roch neighborhood in Quebec City.
4. Implementing the Methodology
We applied the whole process of accessibility assessment to an area located in the old part of Quebec City and visualize the accessibility maps for manual wheelchair users. To fulfill this assessment each user determined his/her confidence level by choosing a corresponding number from 0 to 100 for different barriers. The data on users’ confidence for over 120 manual wheelchair users were collected. Table 3 shows the age distribution by gender of the participants. In this scenario the mean value of confidence was calculated for the wheelchair users and the accessibility assessment process is visualized for all participants as a result of their mean confidence (i.e., 52 out of 100).
Table 3.
Age distribution by gender of the participants.
On the other hand, we need to collect the detailed data regarding the pedestrian network. Collecting, preparing, and structuring such database is time consuming and costly tedious job. Nowadays, using data generated from the Volunteered Geographic Information (VGI) has become a hot topic for various applications including routing and navigation. However, there are still many concerns regarding the quality of such datasets [35,36,37,38,39]. In order to provide a reliable and accurate data for the pedestrian network database, in this paper, we used several existing data sources including the collections of the Ville de Québec, 2015, the web portal of the Ville de Québec (i.e., S, W, SeL, SuT, and SuT), and a complementary field survey (i.e., SuQ and HC). Additional data related to details of curb cuts including slope, width, surface quality, surface type, and snow were also collected in the field for over 200 segments. The snow data was collected on 17 February 2017. To visualize the accessibility map, the framework described here was executed in a web-based GIS tool (MobiliSIG application) [40]. Figure 5 illustrates the accessibility map generated for the Saint-Roch area of the city. In the accessibility map, “Not Accessible” segments are represented in red, “Low Accessible” segments are identified in yellow, “Accessible” segments are green, and “Very Accessible” segments are dark green. According to the statistical analysis, 81% of the segments in the study area are accessible, 5% of the segments are of low accessibility, and 14% of the segments are not accessible for a user whose confidence corresponds to the average confidence level obtained from all the wheelchair users.
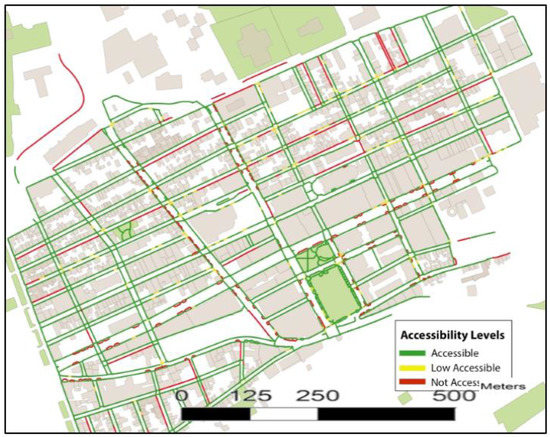
Figure 5.
Accessibility map for Saint Roch, Quebec City based on 127 wheelchair users.
According to the generated map, there are several sidewalk segments that are not accessible for the participants. One of the reasons might be a design policy poorly oriented towards the development of an inclusive city based on the universal design approach. For example, locating electric poles on the middle of sidewalks is one significant barrier, which is identified in the study area. The second reason for inaccessible segments is the existence of steep curb cuts in the area, another poor design feature. This sector is a part of the historical and cultural patrimony of the city and hence there are more restrictive rules for renovation activities. Hence, there is a need to implement new policies that respect those restrictions but consider the specific needs of PWMD at the same time. Modifying these criteria and regenerating the accessibility maps showcases the value of such changes in urban design policy. We investigated this potential by modifying three policies and simulating the changes in the accessibility maps. The chosen policies included “enhancing the quality of existing curb-cut pavements (width, slope, and surface quality)”, “cleaning snow from intersections and curb cuts by applying proper snow-removal policies” for intersections, and “relocating electricity poles from the sidewalks”. Because the implementation of these policies is tied to other issues such as economical factors, the study of the interconnection between these factors is beyond the scope of this paper.
• Policy 1: Improving the characteristics of existing curb cut pavements
According to our accessibility assessment process, a significant number of the inaccessible/low accessible segments were located at the intersections. This can be recognized on the generated maps (see Figure 6). On the other hand, the security of PWMD is highly affected while they are crossing the streets. Intersections usually are considered as challenging points for the mobility of PWMD in the pedestrian network where they make a transition from sidewalks to an intersecting road surface [41,42,43,44,45,46]. The risk of tipping over or falling from the wheelchair or having a car accident always threatens wheelchair users in the intersections.
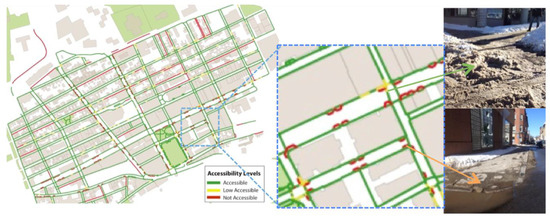
Figure 6.
The accessibility condition of the curb cuts in the study area.
Therefore, there is a need to pay more attention to the intersections as the most challenging places for the mobility of PWMD. The curb cuts are constructed to assist wheelchair users to ease transit from sidewalk to crosswalk and vice-versa. Curb cuts play an important role in these transitions. Here, we investigate the impact of improving the characteristics of the curb cuts on the accessibility of the pedestrian networks. To do so, in our case study we simulated the implementation of a policy of (A) eliminating steep segments; (B) improving surface quality, and (C) widening the narrow spans of existing curb cuts where possible in the Saint-Roch area of Quebec City. Indeed, applying each policy led to changes in the value of corresponding variables and then the cost value of that segment was recalculated considering the new data. For example, consider a segment i with the values of (Si, Wi, SuTi, SuQi, SeTi, SeLi, HCi, Sni) where Si is steep. By applying policy A, the slope value of this segment changes to moderate and then the accessibility level of this segment is recalculated. We evaluated the accessibility level of the segments after applying each policy change and then visualized the results in the accessibility map. Table 4 shows the influence of applying these policies on the accessibility of curb cuts, in such a way that each change is carried out independently of the others. The table clearly shows that the policy change could lead to substantial gains in segments normally considered to have low accessibility.
Table 4.
The results of the policy changes (a, b, c) on accessibility.
• Policy 2: Cleaning snow from curb cuts by applying proper snow-removal policies
Snow is always considered as a big challenge for PWMD in urban areas. It is ranked as the third most difficult item indicated by our pilot study of over 120 wheelchair users. This challenge is more highlighted in countries that have high average snowfall such as Canada, Norway, and Russia. Snow always affects the social participation of people especially PWMD living in these countries during the winter season. Although snow removal is prioritized on sidewalks during the winter, however, the level of accessibility of the pedestrian network for PWMD is still limited. For example, improper snow removal procedures will impede the accessibility for individuals with motor disabilities because of accumulated snow on places such as curb cuts. This issue is also investigated by incorporating new technologies to improve snow removal. For example [25] proposed using an electrical system for snow-melting under the curb cuts.
Here, we investigated how altering snow removal policies such as the use of novel technologies, may change the accessibility maps. To test this policy change, the data on the state of the curb cuts for over 200 curb cuts in our study area were collected. The data were collected on 17 February 2017, just two days after a snowfall in Quebec City. Table 5 demonstrates the accessibility level of segments before and after the simulated use of the new policy. As was the case for Policy 1, it is projected that this policy change would lead to improvements in low accessibility segments.
Table 5.
The results of the policy change “2” on the accessibility.
• Policy 3: Relocating the existing line of electricity poles on the sidewalks
As mentioned, electric poles on the middle of sidewalks are significant barriers that limit or block the mobility of wheelchair users. This can be clearly recognized by the generated accessibility maps (see Figure 7).
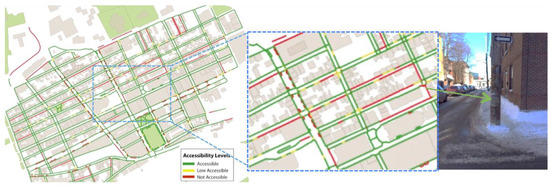
Figure 7.
The accessibility of sidewalks in the study area.
The existence of poles on the sidewalks leads to a reduction in the effective width of the sidewalk and consequently decreases accessibility. Relocating the existing line of electricity poles on the sidewalks can be investigated as another policy change that could impact the accessibility of sidewalks in our study area. The results obtained by simulating the implementation of this scenario showed that moving electrical and telecommunication lines underground would be an option to clear the sidewalk that allows PWMD to move without restrictions. Table 6 presents the accessibility level of curb cuts in the existing situation as well as after employing the policy change. In this case, segments formerly inaccessible become accessible. In the following section, we investigate the results of these proposed policy changes.
Table 6.
The results of the policy change “3” on sidewalk accessibility.
5. Analyzing the Effectiveness of Policy Changes
The results demonstrate that implementing policy 1-a (eliminating steep segments) leads to a projected reduction of 27 segments with low accessible curb cuts while implementing policy 1-b (improving the surface quality) improves the accessibility of only 20 segments. In addition, a significant impact of the implementation of policy 1-c (widening the narrow widths) is noted. Hence, in total the implementation of these policy changes may improve the accessibility of 45 segments. By comparison, cleaning the snow from curb cuts reduces only by 15 the inaccessible segments. The results are summarized and ordered in Table 7.
Table 7.
Order of the different policy actions.
We noticed that 19% of the reduction of inaccessible curb cuts is related to the width whereas 8% of the reduction is related to employing changes to snow removal policy. These two variables are related. However, the snow dataset was collected on 17 February 2017, two days after a snowfall event in Quebec City. The correlation would be more prominent if the snow dataset was collected during the day of the snowfall or a day after. As shown in Figure 6, the impacts of policy changes can be investigated separately. That is, the impacts of other barriers will be measurable only once an appropriate policy change is applied. It is quite obvious that inaccessible/low accessible segments would disappear if all barriers were removed concurrently. Figure 8 visualizes the impact of different policy tests on the curb cuts in some example intersections. For example, by implementing the policy change 1-c, we witness that the east side of the intersection that was inaccessible becomes accessible for PWMD.
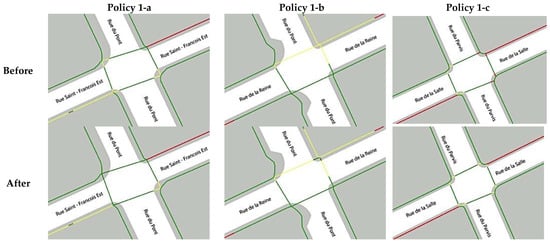
Figure 8.
Visualization of implementation of different policy changes on a curb cut.
Figure 9 shows a view of the study area after the implementation of the third policy change. In this figure, the accessibility map is re-generated by excluding the existing electricity poles from the sidewalks. As shown, the accessibility level of these parts of the sidewalk is changed from not accessible to accessible. According to the statistical results, the implementation of this policy test improves 13% of the not accessible segments in the study area.
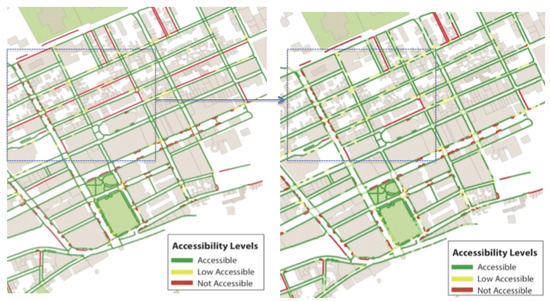
Figure 9.
Accessibility map after simulation of Policy 3 change.
6. Conclusions and Future Work
For people with disabilities to live independently and fully participate in all aspects of daily life, they need to have access on an equal basis to the physical environment, to the transportation infrastructure, and so forth. To address this issue, finding accessible paths within the pedestrian network is a way for enhancing their effective mobility and their social participation within society. In this paper, we focused on ways in which policies (i.e., social factors) can be considered in the assessment of the accessibility of a pedestrian network. We aimed to investigate the influence of the implementation of policy changes on the accessibility of the intersections and sidewalks by means of simulation. Among various policies, we tested the impact of three policies, namely enhancing the quality of existing curb cut pavements (width, slope, and surface quality), removing snow from intersections, and relocating the existing line of electricity poles on the sidewalks. The influence of these policies was quantified and visualized on the accessibility map generated for the Saint-Roch sector in Quebec City.
The results demonstrated the impact of the different policy changes on the accessibility of curb cuts for PWMD. It was shown that decreasing the slope of steep curb cuts, widening the narrow widths, and cleaning the snow from curb cuts would significantly improve the accessibility level of pedestrian networks for everyone, and especially for PWMD. We have seen that the impact of improving the surface quality of the curb cuts is almost negligible compared to that of other factors. In addition, the implementation of the third policy change was investigated and a significant improvement of the accessibility level of sidewalks was noted. The proposed scenario-based accessibility assessment analysis together with appropriately generated accessibility maps and the statistical results might be useful for city authorities to explore different policy options and to understand and quantify their impacts. Decision-makers can compare the impacts of different policies and decide which ones are the most effective. One of the most challenging issues in this research was to collect precise and detailed data about the pedestrian network, as this is a very time consuming and costly task. Therefore, we have limited the study area to perform our analysis. Furthermore, the environmental factors are temporal and change in time. Temporality of the characteristics of environment raises the complexity of the accessibility assessment process. Thus, as future work, we will develop an effective approach to generate a relatively quick and low-cost detailed spatiotemporal data for the accessibility assessment purposes. In addition, we plan to integrate other social factors that may play a prominent role in the accessibility of pedestrian networks for PWMD.
Acknowledgments
This work was supported by the Canadian Institutes of Health Research (CIHR) and the Natural Sciences and Engineering Research Council (NSERC). The authors would like to thank Patrick Morales-Coayla, who helped prepare the figures. We would also like to acknowledge interesting inputs from MobiliSIG team during our various group discussions.
Author Contributions
Amin Gharebaghi designed the research, performed the experiments, and wrote the manuscript; Mir-Abolfazl Mostafavi gave instructions of organizing the sections during the writing and revised the manuscript, and Seyed Hossein Chavoshi, Geoffrey Edwards, and Patrick Fougeyrollas helped with revision of the manuscript.
Conflicts of Interest
The authors declare no conflict of interest. The founding sponsors had no role in the design of the study; in the collection, analyses, or interpretation of data; in the writing of the manuscript, and in the decision to publish the results.
References
- Luc, N.; Edwards, G.; Boucher, N.; Routhier, F.; Vincent, C.; Gascon, H.; Fougeyrollas, P. Enhancing Independent Community Access and Participation: Services, Technologies, and Policies. In Oxford Textbook Neurorehabilitation; Oxford University Press: Oxford, UK, 2015; pp. 399–417. [Google Scholar]
- UN. “Defending”. In General Assembly; United Nations: New York, NY, USA, 2006. [Google Scholar]
- UN Committee on the Rights of Persons with Disabilities (CRPD). Consideration of Reports Submitted by States Parties under Article 35 of the Convention, Initial Reports of States Parties Due in 2012: Ethiopia. 2015. Available online: http://www.refworld.org/docid/57aae13b4.html (accessed on 20 January 2018).
- Shakespeare, T.; Watson, N. Defending the social model. Disabil. Soc. 1997, 12, 293–300. [Google Scholar] [CrossRef]
- Oliver, M. Understanding Disability: From Theory to Practice; St Martin’s Press: New York, NY, USA, 1996. [Google Scholar]
- Fougeyrollas, P. La Funambule, le Fil et la Toile. Transformations Réciproques du Sens du Handicap; Presses Université Laval: Quebec, QC, Canada, 2010. [Google Scholar]
- Oliver, M.; Bochel, H.M. The politics of disablement. Int. J. Rehabil. Res. 1991, 14, 185. [Google Scholar] [CrossRef]
- Shakespeare, T. The social model of disability. Disabil. Stud. Read. 2006, 2, 197–204. [Google Scholar]
- Edwards, G.; Noreau, L.; Boucher, N.; Fougeyrollas, P.; Grenier, Y.; McFadyen, B.J.; Morales, E.; Vincent, C. Disability, Rehabilitation Research and Post-Cartesian Embodied Ontologies—Has the Research Paradigm Changed; Emerald Group Publishing: Bingley, UK, 2014; pp. 73–102. [Google Scholar]
- Fougeyrollas, P. The Quebec Classification: Disability Creation Process; CSICIDH; INDCP, International Network on the Disability Creation Process: Quebec, QC, Canada, 1998. [Google Scholar]
- Gharebaghi, A.; Mostafavi, M.A. A new ontological perspective for integration of social and physical environments: Disability and rehabilitation context. ISPRS Ann. Photogramm. Remote Sens. Spat. Inf. Sci. 2016, 3, 137–142. [Google Scholar] [CrossRef]
- Matthews, H.; Beale, L.; Picton, P.; Briggs, D. Modelling Access with GIS in Urban Systems (MAGUS): Capturing the experiences of wheelchair users. Area 2003, 35, 34–45. [Google Scholar] [CrossRef]
- Beale, L.; Field, K.; Briggs, D.; Picton, P.; Matthews, H. Mapping for Wheelchair Users: Route Navigation in Urban Spaces. Cartogr. J. 2006, 43, 68–81. [Google Scholar] [CrossRef]
- Kasemsuppakorn, P.; Karimi, H.A. Personalised Routing for Wheelchair Navigation. J. Locat. Based Serv. 2009, 3, 24–54. [Google Scholar] [CrossRef]
- Jonietz, D.; Timpf, S. An affordance-based simulation framework for assessing spatial suitability. In Spatial Information Theory; Springer: Berlin, Germany, 2013; pp. 169–184. [Google Scholar]
- Jonietz, D.; Schuster, W.; Timpf, S. Modelling the Suitability of Urban Networks for Pedestrians: An Affordance-Based Framework. In Geographic Information Science at the Heart of Europe; Springer International Publishing: Cham, Switzerland, 2013; pp. 369–382. [Google Scholar]
- Tajgardoon, M.; Karimi, H.A. Simulating and visualizing sidewalk accessibility for wayfinding of people with disabilities. Int. J. Cartogr. 2015, 1, 79–93. [Google Scholar] [CrossRef]
- Gilart-Iglesias, V.; Mora, H.; Pérez-delHoyo, R.; García-Mayor, C. A computational method based on radio frequency technologies for the analysis of accessibility of disabled people in sustainable cities. Sustainability 2015, 7, 14935–14963. [Google Scholar] [CrossRef]
- Mora, H.; Gilart-Iglesias, V.; Pérez-Delhoyo, R.; Andujar-Montoya, M.D.; Gabucio, H.J.C. Interactive cloud system for the analysis of accessibility in smart cities. Int. J. Des. Nat. Ecodyn. 2016, 11, 447–458. [Google Scholar] [CrossRef]
- Mora, H.; Gilart-Iglesias, V.; Hoyo, R.P.; Andújar-Montoya, M.D. A comprehensive system for monitoring urban accessibility in smart cities. Sensors 2017, 17, 1834. [Google Scholar] [CrossRef] [PubMed]
- Pérez-Delhoyo, R.; García-Mayor, C.; Mora, H.; Gilart-Iglesias, V.; Andújar-Montoya, M.D. Improving urban accessibility: A methodology for urban dynamics analysis in smart, sustainable and inclusive cities. Int. J. Sustain. Dev. Plan. 2017, 12, 357–367. [Google Scholar] [CrossRef]
- Mackett, R.L.; Achuthan, K.; Titheridge, H. AMELIA: A tool to make transport policies more socially inclusive. Transp. Policy 2008, 15, 372–378. [Google Scholar] [CrossRef]
- Tansawat, T.; Kanitpong, K.; Kishi, K.; Utainarumol, S.; Jiwattanakulpaisarn, P. The Impact of Public Transport Subsidy on Social Inclusion: The Case of Free Train Policy in Thailand. J. East. Asia Soc. Transp. Stud. 2015, 11, 2558–2574. [Google Scholar]
- Anciaes, P.R.; Jones, P. Effectiveness of Changes in Street Layout and Design for Reducing Barriers to Walking. Transp. Res. Rec. J. Transp. Res. Board 2016, 2586, 39–47. [Google Scholar] [CrossRef]
- Morales, E.; Gamache, S.; Edwards, G. Winter: Public enemy # 1 for accessibility exploring new solutions. J. Access. Des. All Jacces 2014, 4, 30–52. [Google Scholar]
- Handy, S.L.; Niemeier, D.A. Measuring accessibility: An exploration of issues and alternatives. Environ. Plan. A 1997, 29, 1175–1194. [Google Scholar] [CrossRef]
- Karimi, H.A.; Kasemsuppakorn, P. Pedestrian network map generation approaches and recommendation. Int. J. Geogr. Inf. Sci. 2013, 27, 947–962. [Google Scholar] [CrossRef]
- Mobasheri, A. A rule-based spatial reasoning approach for openstreetmap data quality enrichment; case study of routing and navigation. Sensors 2017, 17, 2498. [Google Scholar] [CrossRef] [PubMed]
- Kirby, R.L.; Swuste, J.; Dupuis, D.J.; MacLeod, D.A.; Monroe, R. The Wheelchair Skills Test: A pilot study of a new outcome measure. Arch. Phys. Med. Rehabil. 2002, 83, 10–18. [Google Scholar] [CrossRef] [PubMed]
- Kilkens, O.J.; Dallmeijer, A.J.; de Witte, L.P.; van der Woude, L.H.; Post, M.W. The wheelchair circuit: Construct validity and responsiveness of a test to assess manual wheelchair mobility in persons with spinal cord injury. Arch. Phys. Med. Rehabil. 2004, 85, 424–431. [Google Scholar] [CrossRef] [PubMed]
- Mortenson, W.B.; Miller, W.C.; Miller-Pogar, J. Measuring wheelchair intervention outcomes: Development of the wheelchair outcome measure. Disabil. Rehabil. Assist. Technol. 2007, 2, 275–285. [Google Scholar] [CrossRef] [PubMed]
- Best, K.L.; Kirby, R.L.; Smith, C.; MacLeod, D.A. Wheelchair skills training for community-based manual wheelchair users: A randomized controlled trial. Arch. Phys. Med. Rehabil. 2005, 86, 2316–2323. [Google Scholar] [CrossRef] [PubMed]
- Rushton, P. Measuring Confidence with Manual Wheelchair Use: A Four Phase, Mixed-Methods Study; University of British Columbia: Vancouver, BC, Canada, 2010. [Google Scholar]
- Beynon, M. The application of fuzzy decision tree analysis in an exposition of the antecedents of audit fees. Omega 2004, 32, 231–244. [Google Scholar] [CrossRef]
- Mirri, S.; Prandi, C.; Salomoni, P.; Callegati, F.; Campi, A. On Combining Crowdsourcing, Sensing and Open Data for an Accessible Smart City. In Proceedings of the 2014 Eighth International Conference on Next Generation Mobile Apps, Services and Technologies (Ngmast), Oxford, UK, 10–12 September 2014; pp. 294–299. [Google Scholar]
- Qin, H.; Rice, R.M.; Fuhrmann, S.; Rice, M.T.; Curtin, K.M.; Ong, E. Geocrowdsourcing and accessibility for dynamic environments. Geojournal 2016, 81, 699–716. [Google Scholar] [CrossRef]
- Zipf, A.; Mobasheri, A.; Rousell, A.; Hahmann, S. Crowdsourcing for individual needs—The case of routing and navigation for mobility-impaired persons. In European Handbook of Crowdsourced Geographic Information; Ubiquity Press Ltd.: London, UK, 2016; pp. 325–337. [Google Scholar]
- Mobasheri, A.; Sun, Y.; Loos, L.; Ali, A.L. Are crowdsourced datasets suitable for specialized routing services? Case study of OpenStreetMap for routing of people with limited mobility. Sustainability 2017, 9, 997. [Google Scholar] [CrossRef]
- Mobasheri, A.; Huang, H.; Degrossi, L.; Zipf, A. Enrichment of OpenStreetMap Data Completeness with Sidewalk Geometries Using Data Mining Techniques. Sensors 2018, 18, 509. [Google Scholar] [CrossRef] [PubMed]
- Mostafavi, M.A.; Noreau, L. MobiliSIG: An Adaptive Mobile Geospatial Technology for the Mobility of People with Disabilities. In Embedded Systems and Assistive Technology for Last Mile Mobility; Magoulès, F., Monacelli, E., Noreau, L., Eds.; Institute of Computer Sciecnes Press (ICS): Hong Kong, China, 2017. [Google Scholar]
- Calder, R.; Jill, C.; Kirby, L. Fatal wheelchair-related accidents in the United States. Am. J. Phys. Med. Rehabil. 1990, 69, 184–190. [Google Scholar] [CrossRef] [PubMed]
- Ummat, S.; Kirby, R.L. Nonfatal wheelchair-related accidents reported to the national electronic injury surveillance system. Am. J. Phys. Med. Rehabil. 1994, 73, 163–167. [Google Scholar] [CrossRef] [PubMed]
- Gaal, R.P.; Rebholtz, N.; Hotchkiss, R.D.; Pfaelzer, P.F. Wheelchair rider injuries: Causes and consequences for wheelchair design and selection. J. Rehabil. Res. Dev. 1997, 34, 58. [Google Scholar] [PubMed]
- Xiang, G.A.; Chany, H.; Smith, A.-M. Wheelchair related injuries treated in US emergency departments. Inj. Prev. 2006, 12, 8–11. [Google Scholar] [CrossRef] [PubMed]
- Kirby, R.L.; Ackroyd-Stolarz, S.A.; Brown, M.G.; Kirkland, S.A.; Macleod, D.A. Wheelchair-related accidents caused by tips and falls among non-institutionalized users of manually propelled wheel- chairs in Nova Scotia. Am. J. Phys. Med. Rehabil. 1994, 73, 319–330. [Google Scholar] [CrossRef] [PubMed]
- Bennett, S.; Kirby, R.L.; Macdonald, B. Wheelchair accessibility: Descriptive survey of curb ramps in an urban area. Disabil. Rehabil. Assist. Technol. 2009, 4, 17–23. [Google Scholar] [CrossRef] [PubMed]


© 2018 by the authors. Licensee MDPI, Basel, Switzerland. This article is an open access article distributed under the terms and conditions of the Creative Commons Attribution (CC BY) license (http://creativecommons.org/licenses/by/4.0/).