Article

Effects of Different Planting Densities on Photosynthesis in Maize Determined via Prompt Fluorescence, Delayed Fluorescence and P700 Signals

1
Jiangsu Key Laboratory of Crop Genetics and Physiology, Co-Innovation Center for Modern Production Technology of Grain Crops, Key Laboratory of Plant Functional Genomics of the Ministry of Education, Joint International Research Laboratory of Agriculture & Agri-Product Safety of the Ministry of Education, Yangzhou University, Yangzhou 225009, China
2
Huaiyin Institute of Agricultural Sciences of Xuhuai Region in Jiangsu, Huaian 223001, China
*
Author to whom correspondence should be addressed.
Those authors contributed equally to this work.
Plants 2021, 10(2), 276; https://doi.org/10.3390/plants10020276
Submission received: 6 January 2021 / Revised: 24 January 2021 / Accepted: 26 January 2021 / Published: 31 January 2021
(This article belongs to the Section Plant Physiology and Metabolism)

Abstract

:
The mutual shading among individual field-grown maize plants resulting from high planting density inevitably reduces leaf photosynthesis, while regulating the photosynthetic transport chain has a strong impact on photosynthesis. However, the effect of high planting density on the photosynthetic electron transport chain in maize currently remains unclear. In this study, we simultaneously measured prompt chlorophyll a fluorescence (PF), modulated 820 nm reflection (MR) and delayed chlorophyll a fluorescence (DF) in order to investigate the effect of high planting density on the photosynthetic electron transport chain in two maize hybrids widely grown in China. PF transients demonstrated a gradual reduction in their signal amplitude with increasing planting density. In addition, high planting density induced positive J-step and G-bands of the PF transients, reduced the values of PF parameters PIABS, RC/CSO, TRO/ABS, ETO/TRO and REO/ETO, and enhanced ABS/RC and N. MR kinetics showed an increase of their lowest point with increasing high planting density, and thus the values of MR parameters VPSI and VPSII-PSI were reduced. The shapes of DF induction and decay curves were changed by high planting density. In addition, high planting density reduced the values of DF parameters I1, I2, L1 and L2, and enhanced I2/I1. These results suggested that high planting density caused harm on multiple components of maize photosynthetic electron transport chain, including an inactivation of PSII RCs, a blocked electron transfer between QA and QB, a reduction in PSI oxidation and re-reduction activities, and an impaired PSI acceptor side. Moreover, a comparison between PSII and PSI activities demonstrated the greater effect of plant density on the former.

1. Introduction

Maize is the most productive crop in the world and an important food and feed crop. Improving planting density is a key strategy used to achieve a high yield in maize [1,2]. However, maize is a high-stalk crop with long and wide leaves, thus high planting density inevitably causes mutual shading and the subsequent depression of photosynthesis in leaves around the ear. The photosynthetic performance of leaves around the ear is crucial for the determination of maize yield. Therefore, improving our understanding of the effects of mutual shading caused by high planting density on maize ear-leaf photosynthesis can aid in the advancement of plant density strategies for the development of dense-planting-resistant maize varieties.
During photosynthesis, green plants (including algae) simultaneously absorb light energy, convert carbon dioxide and water into energy-rich organic matter, and release oxygen [3]. The photosynthetic process generally comprises of light-induced linear electron transport and the Calvin cycle for CO2 fixation. Linear electron transport employs photosystem II (PSII) and photosystem I (PSI) to produce ATP and NADPH, two important chemical compounds used to fuel the Calvin cycle for CO2 fixation [4]. The majority of previous research applies chlorophyll content, photosynthetic rate, leaf area index and other indicators to determine the effects of different planting densities on the photosynthetic characteristics of maize. An increase in planting density has been observed to gradually reduce the relative chlorophyll content and net photosynthetic rate of maize leaves and increase leaf area index [5,6]. However, there is currently a lack of comprehensive information on the effect of close plant density on the linear electron transport of photosynthesis in maize.
Multifunctional plant efficiency analysis (M-PEA) has recently become a popular tool for the investigation of photosynthetic linear electron transport. M-PEA can simultaneously measure prompt chlorophyll a fluorescence (PF), delayed chlorophyll a fluorescence (DF) and modulated 820 nm reflection (MR). The kinetics of PF and delayed chlorophyll a fluorescence (DF) directly depend on the redox state of the PSII reaction center (P680), while those of MR are a function of the redox state of the PSI reaction center (P700). As PSI and PSII work coordinately and dynamically with a number of other electron carriers in the photosynthetic electron transport chain, fluctuations in any component of the electron chain can directly or indirectly alter the kinetics of PF, DF and MR [7]. Therefore, the three signals measured by the M-PEA provide parallel and complementary information on the entire photosynthetic linear electron transport chain, including the PSII donor side, the electron transfer between PSII and PSI and the PSI acceptor side.
We hypothesized that high planting density may affect one or multiple components of the photosynthetic linear electron chain. In the current study, we employed M-PEA to simultaneously measure the PF, DF and MR signals of Zhengdan958 and Xianyu335, the two most widely planted hybrids in China. The purpose of the study was to investigate the effect of increased planting density on the photosynthetic electron transport chain of maize and to analyze which components of the photosynthetic electron transport chain is more sensitive to increased density. The results will provide new information on the effect of high planting density on maize photosynthesis, with a direct focus on the photosynthetic electron transport chain.

2. Results

2.1. Effect of Planting Density on Yield

The ANOVA results demonstrated the significant effect of plant density on yield in both years (Table 1). In addition, the interaction between hybrid and planting density was observed to show significant effect on yield in 2020, but not in 2019. The yield of the two maize hybrids first gradually increased from the lowest level at D1 planting density to a maximum at D3 planting density, and then decreased to a relative lower level at D4 planting density.

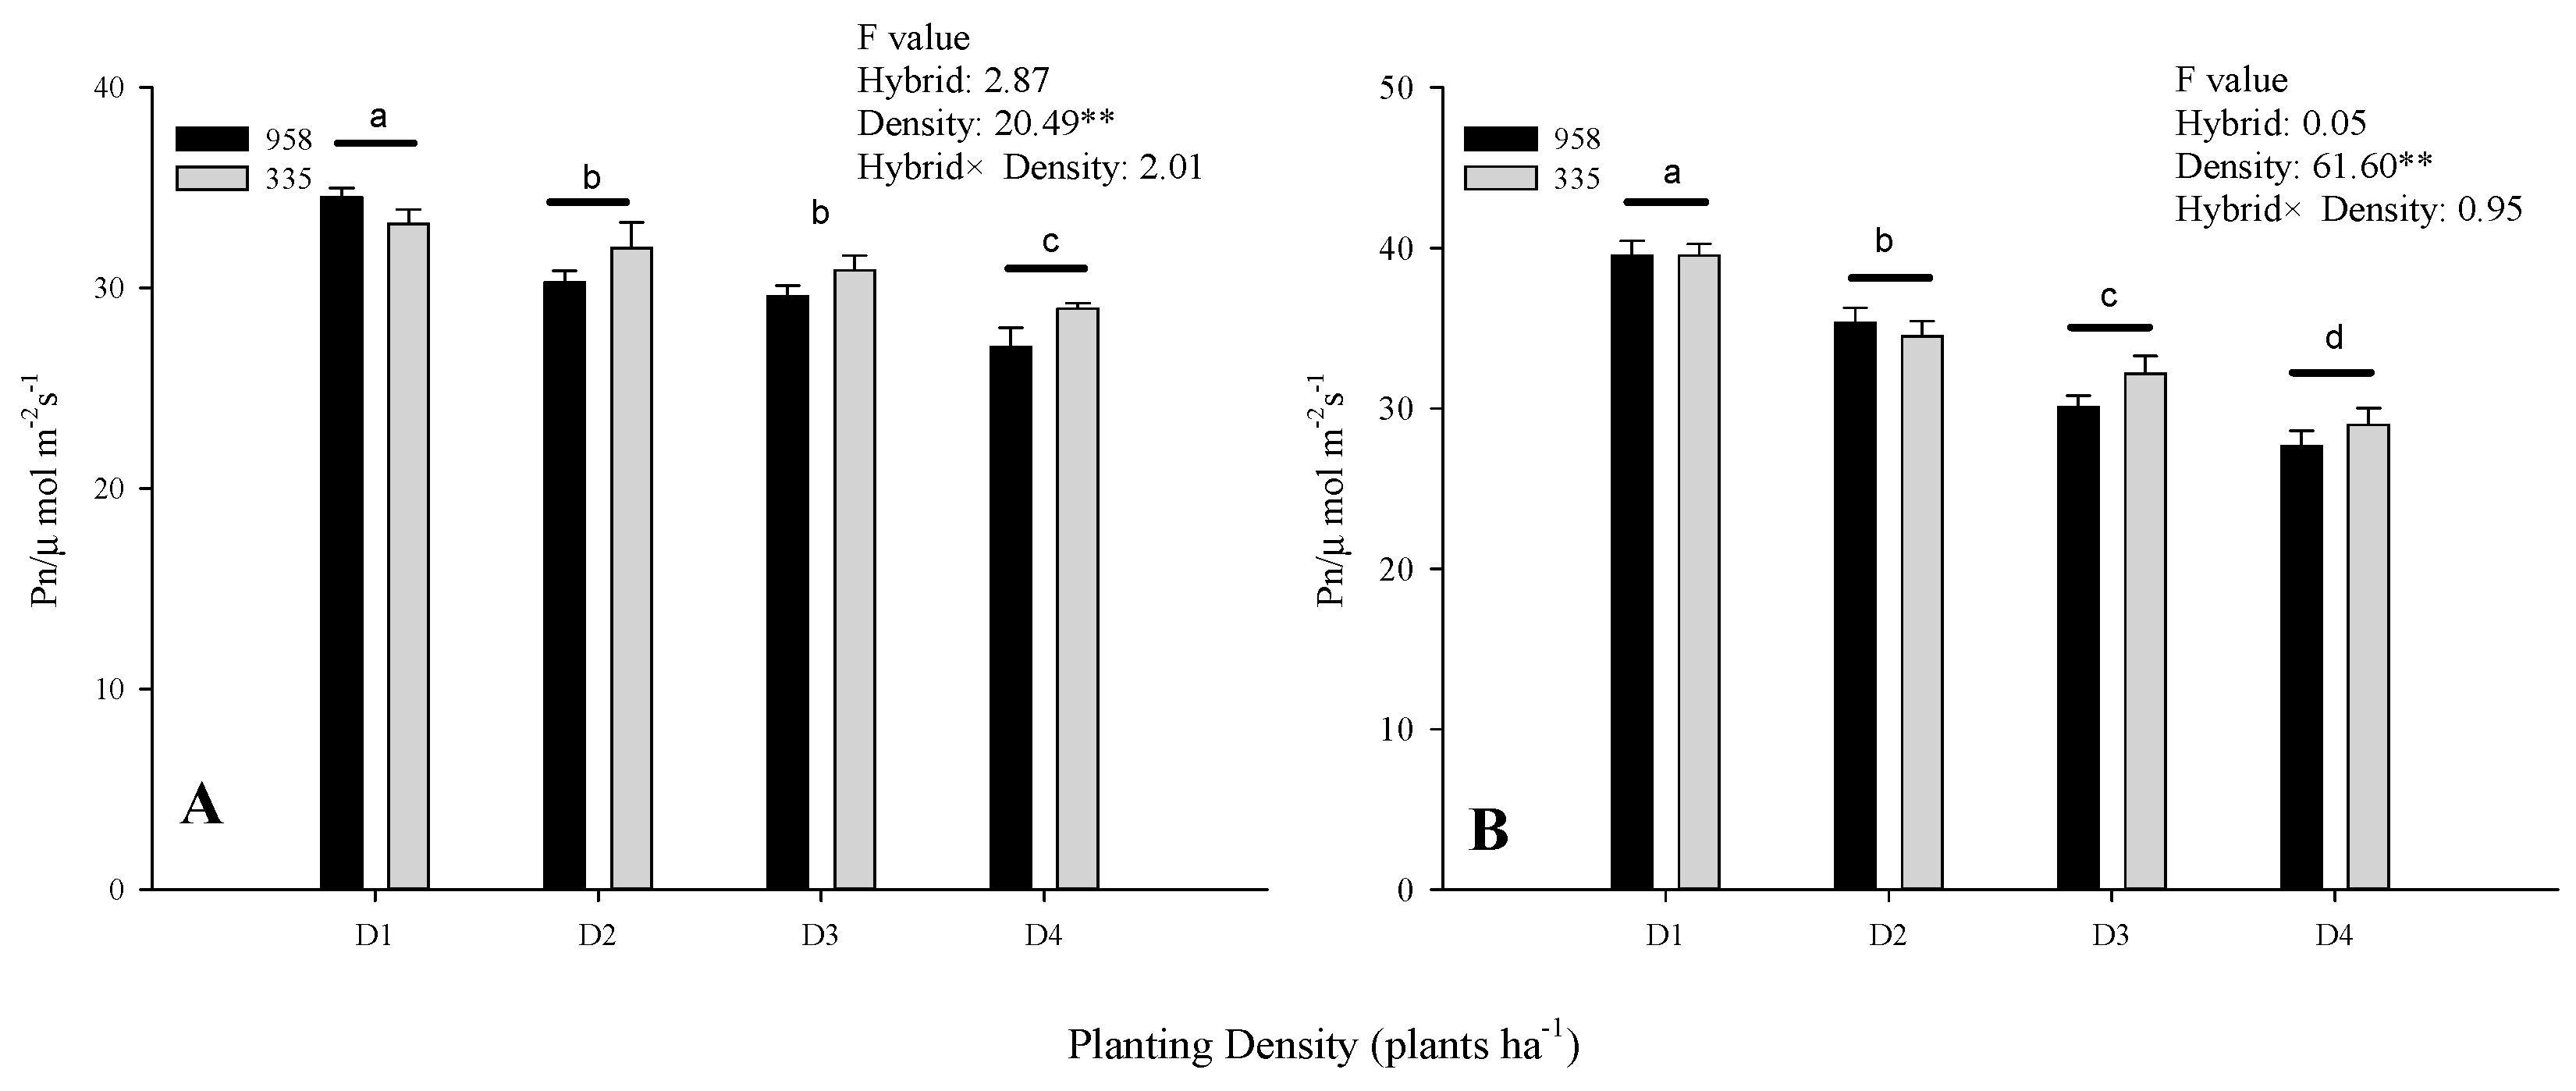
2.2. Effect of Planting Density on the Net Photosynthetic Rate

The net photosynthetic rate (Pn) was significantly affected by planting density in both years, but not by hybrid and the interaction between hybrid and planting density (Figure 1). Pn values were observed to gradually decrease with increasing planting density across hybrids and years (Figure 1). In particular, the Pn of Zhengdan958 in 2019 decreased by 12.33%, 14.39% and 21.71% with the increase in density compared to Pn D1 levels. The equivalent reductions for Xianyu335 were 3.61%, 6.99% and 12.71%, respectively. In 2020, these values were 10.60%, 23.89% and 29.99% for Zhengdan958, and 12.8%, 18.64% and 26.71% for Xianyu335, respectively.

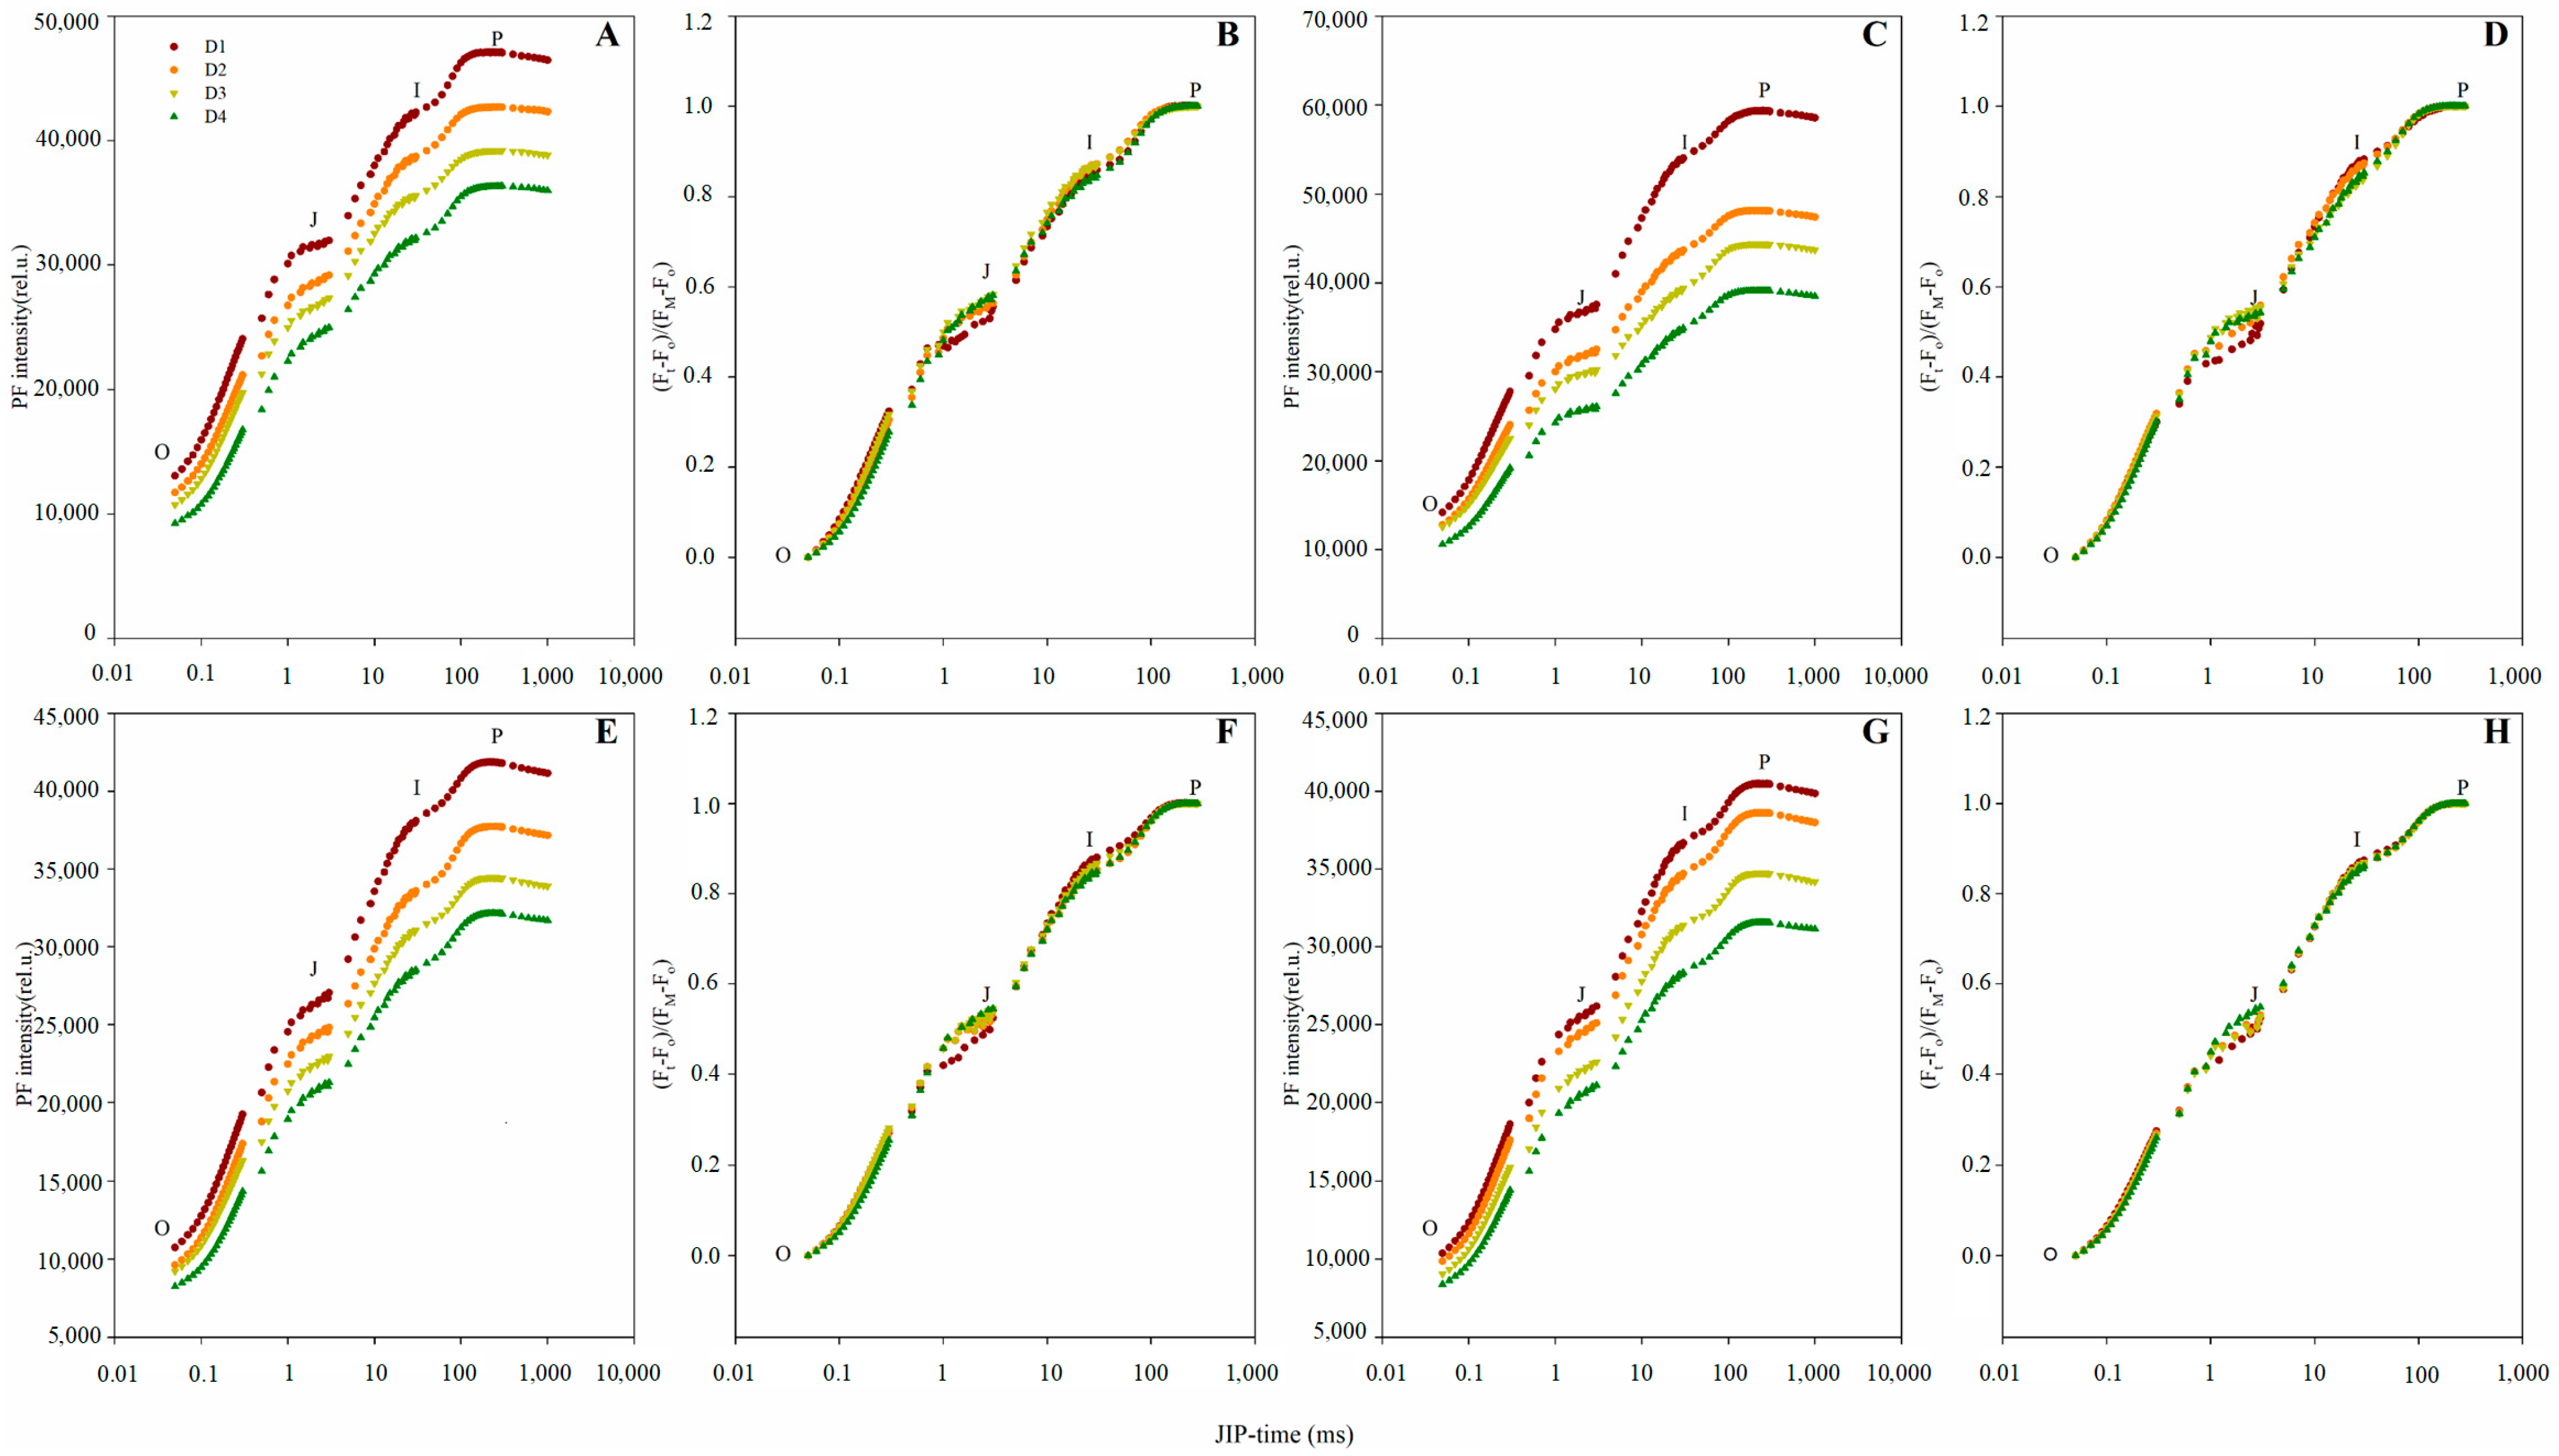
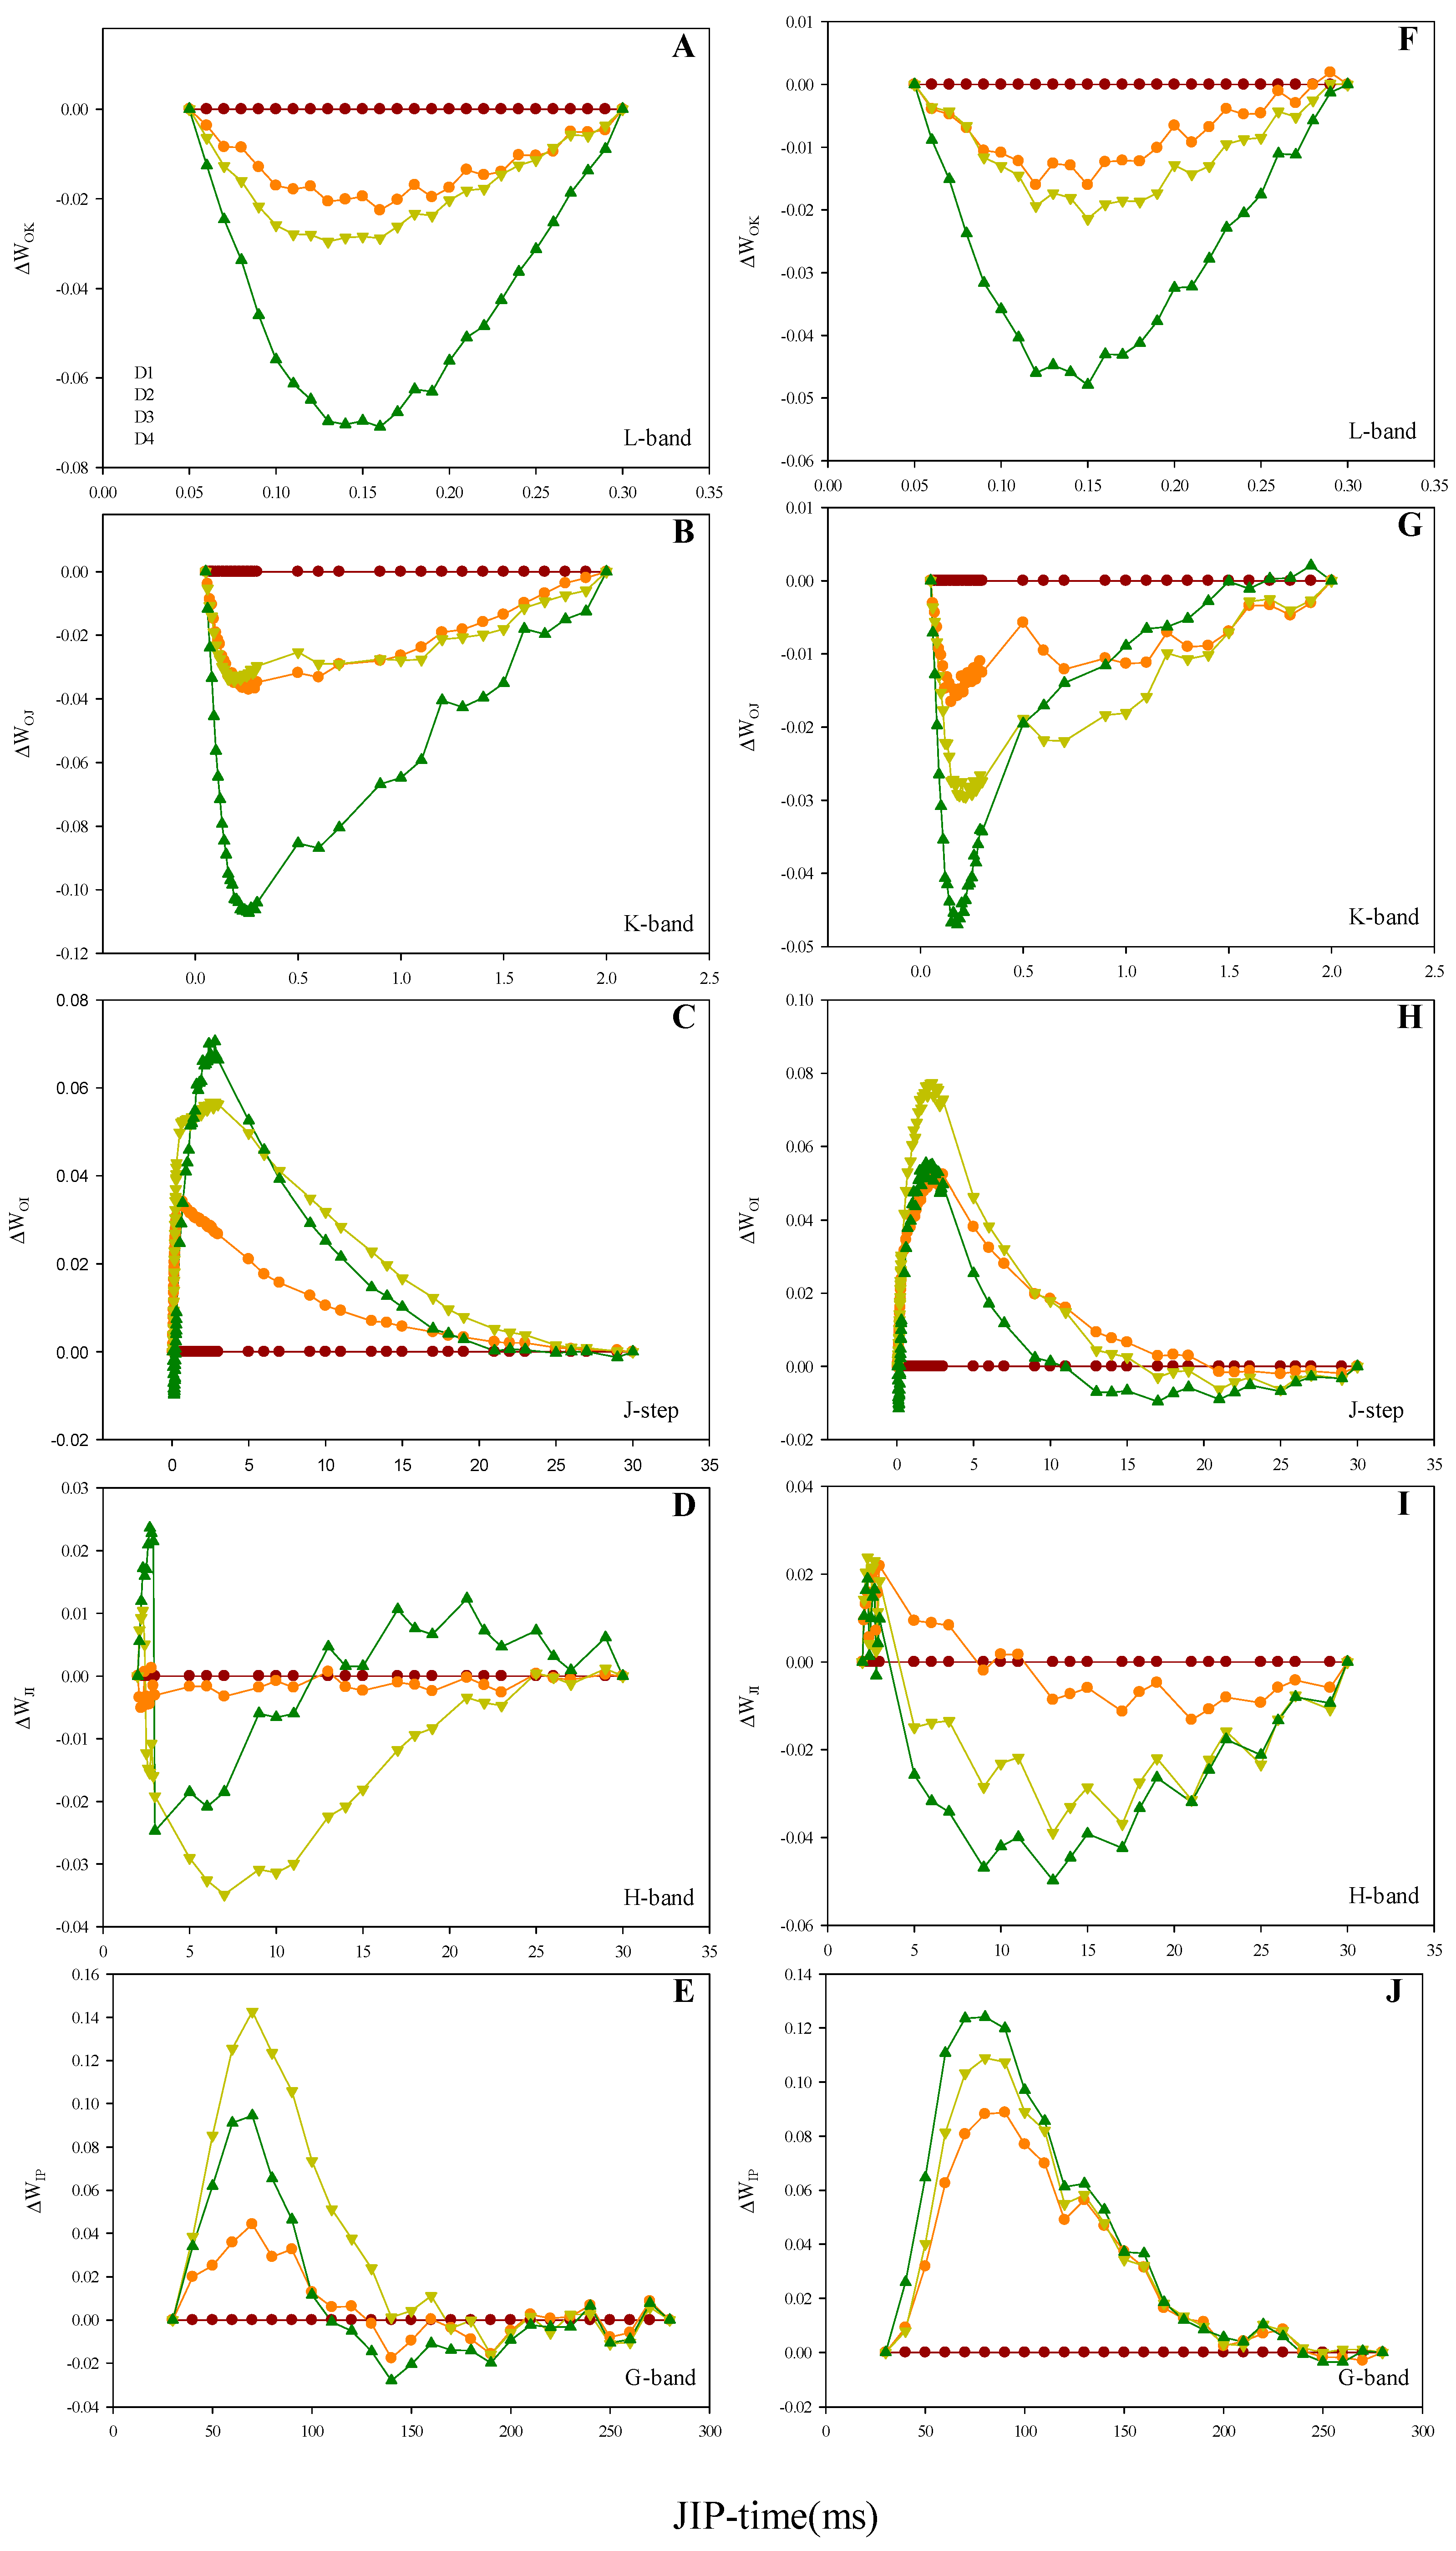
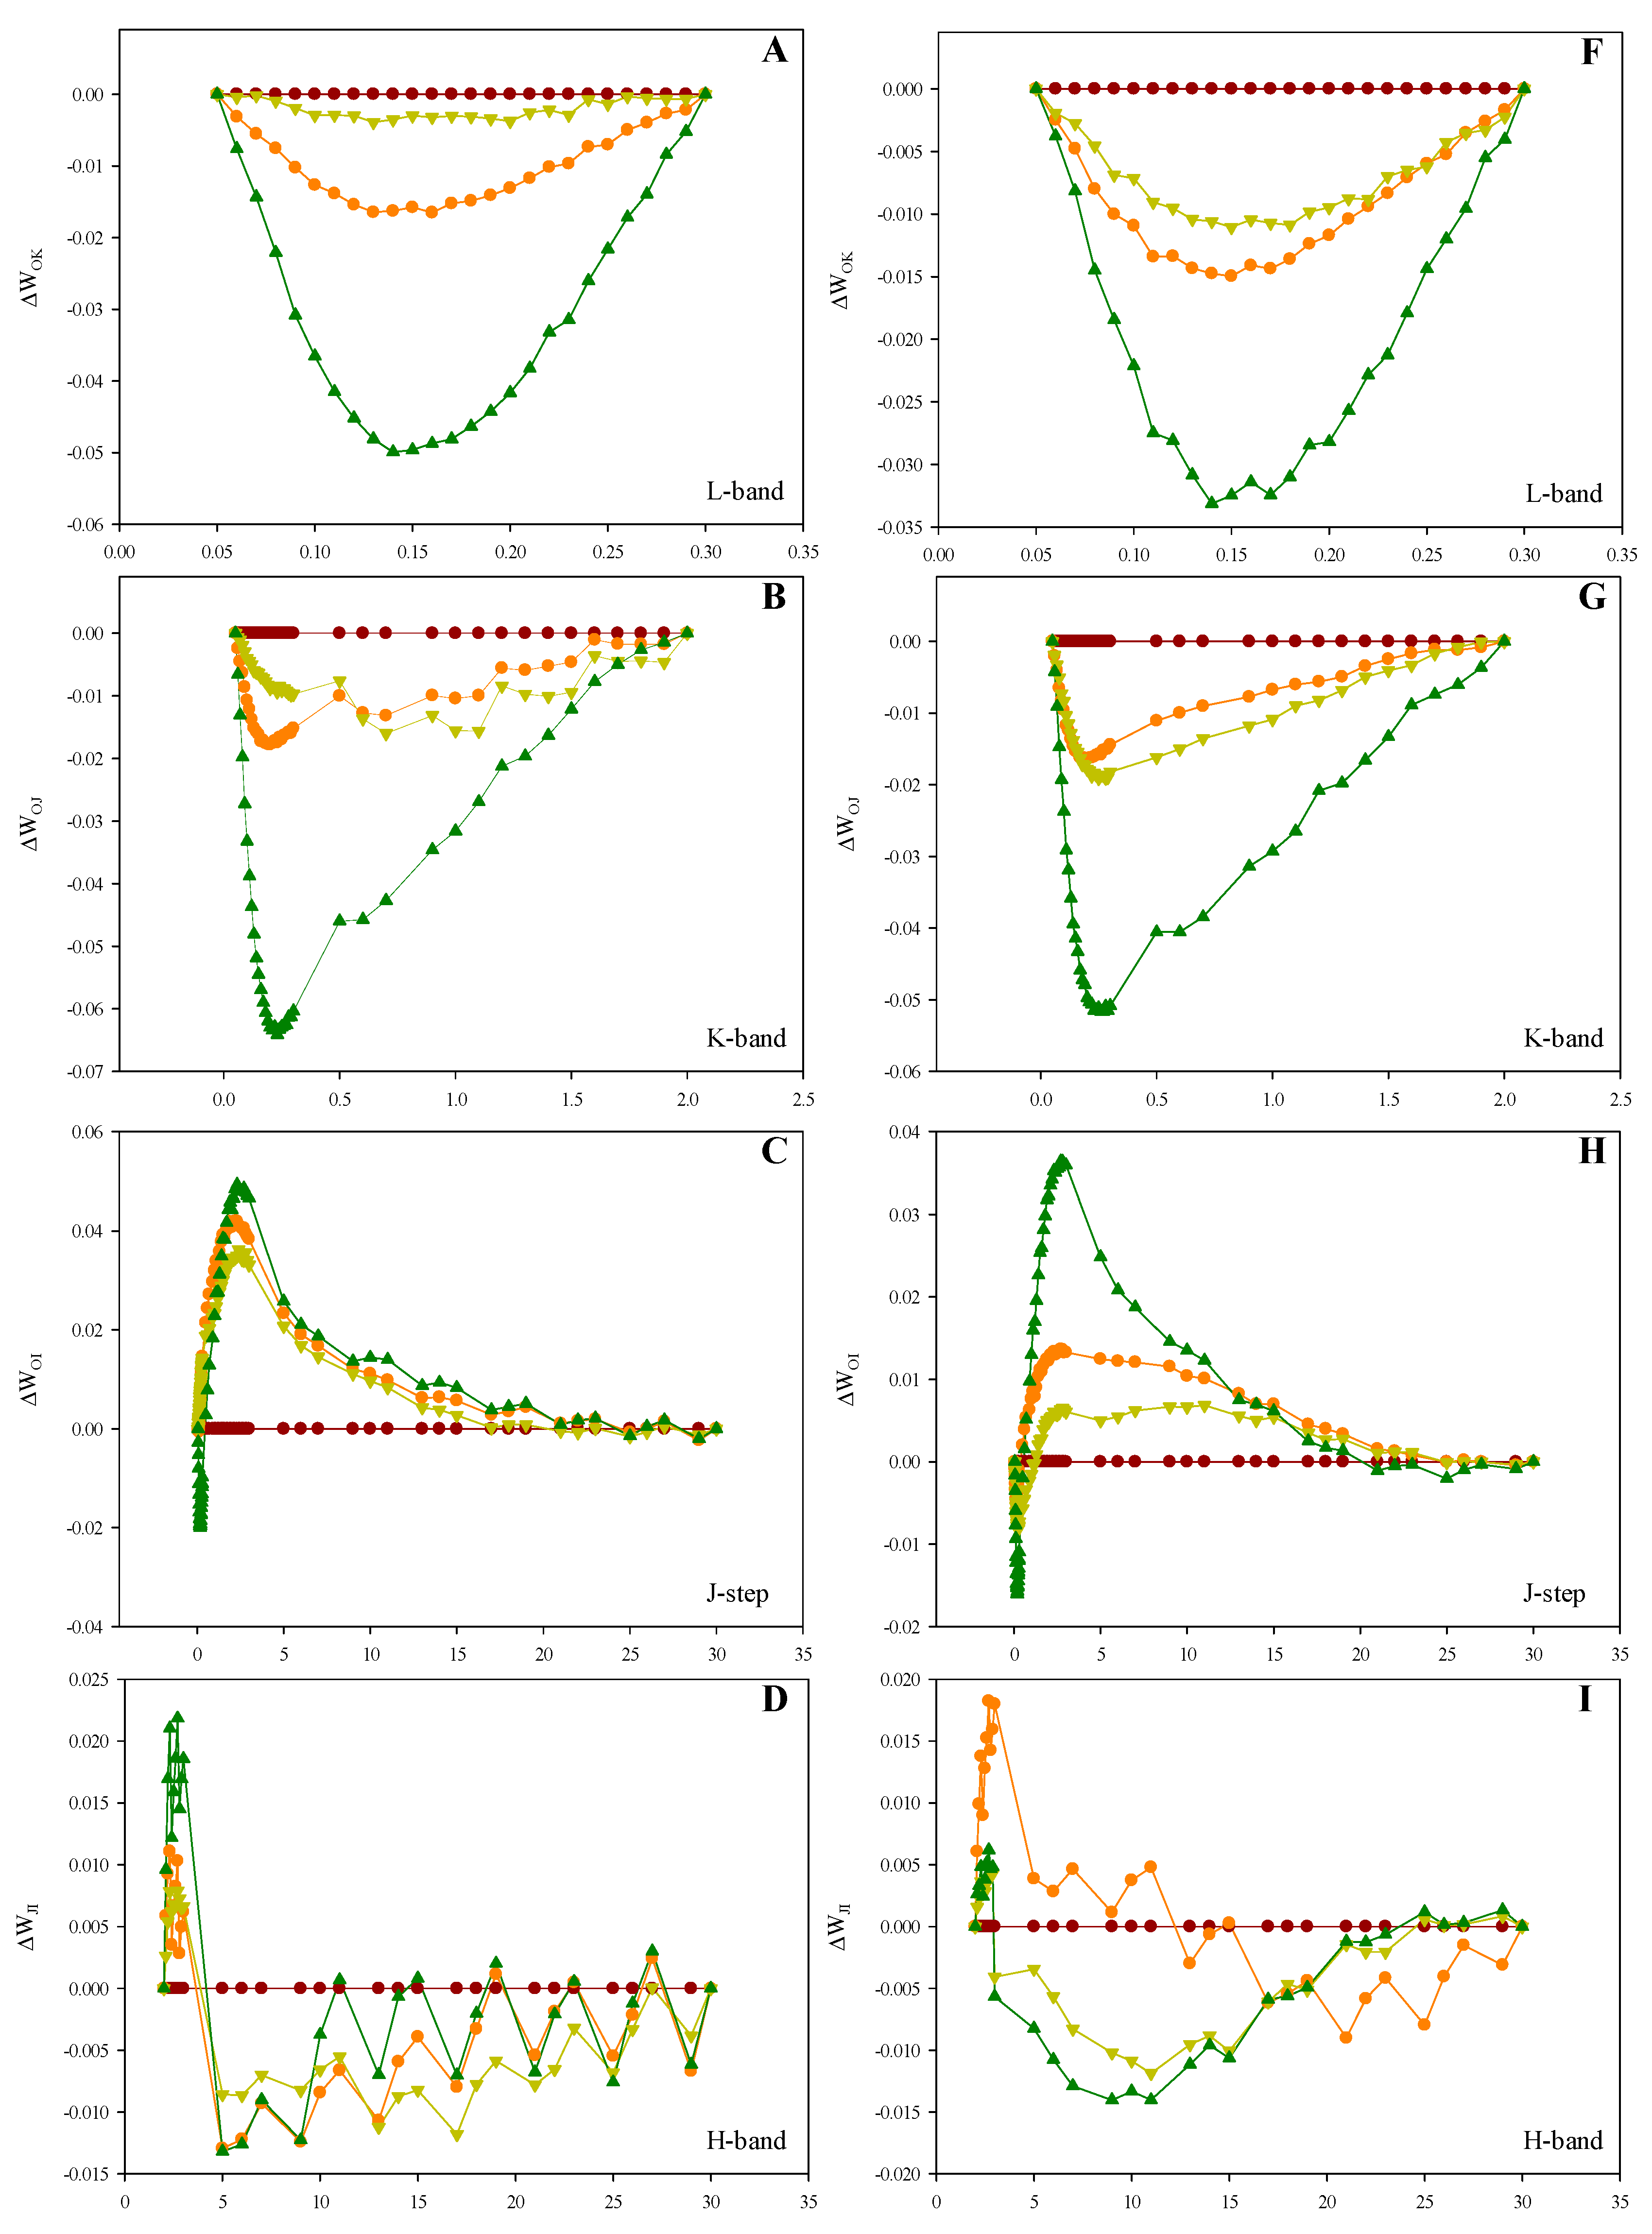
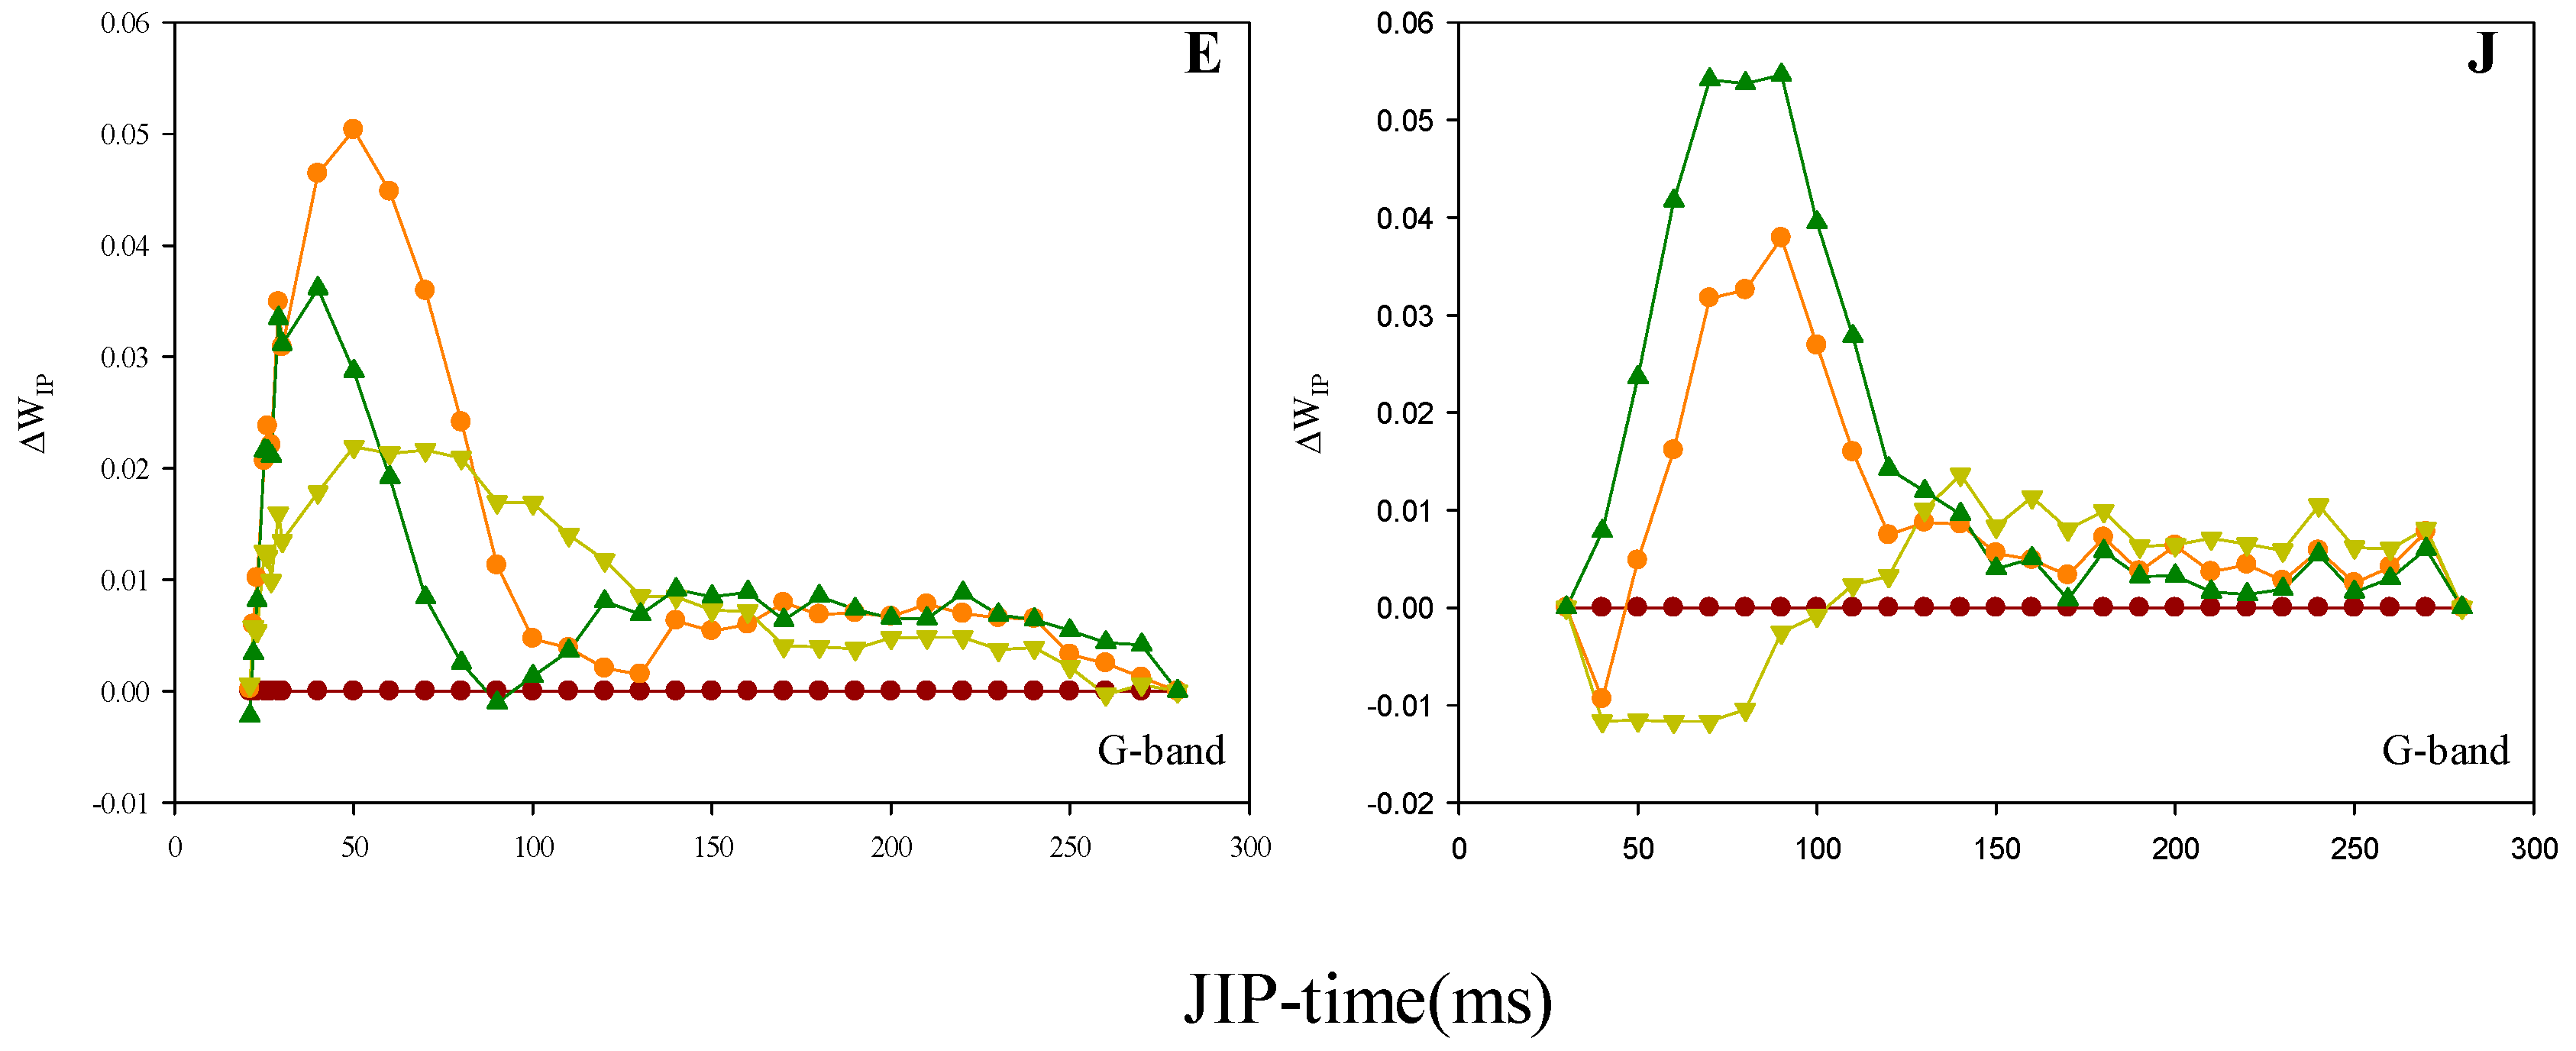
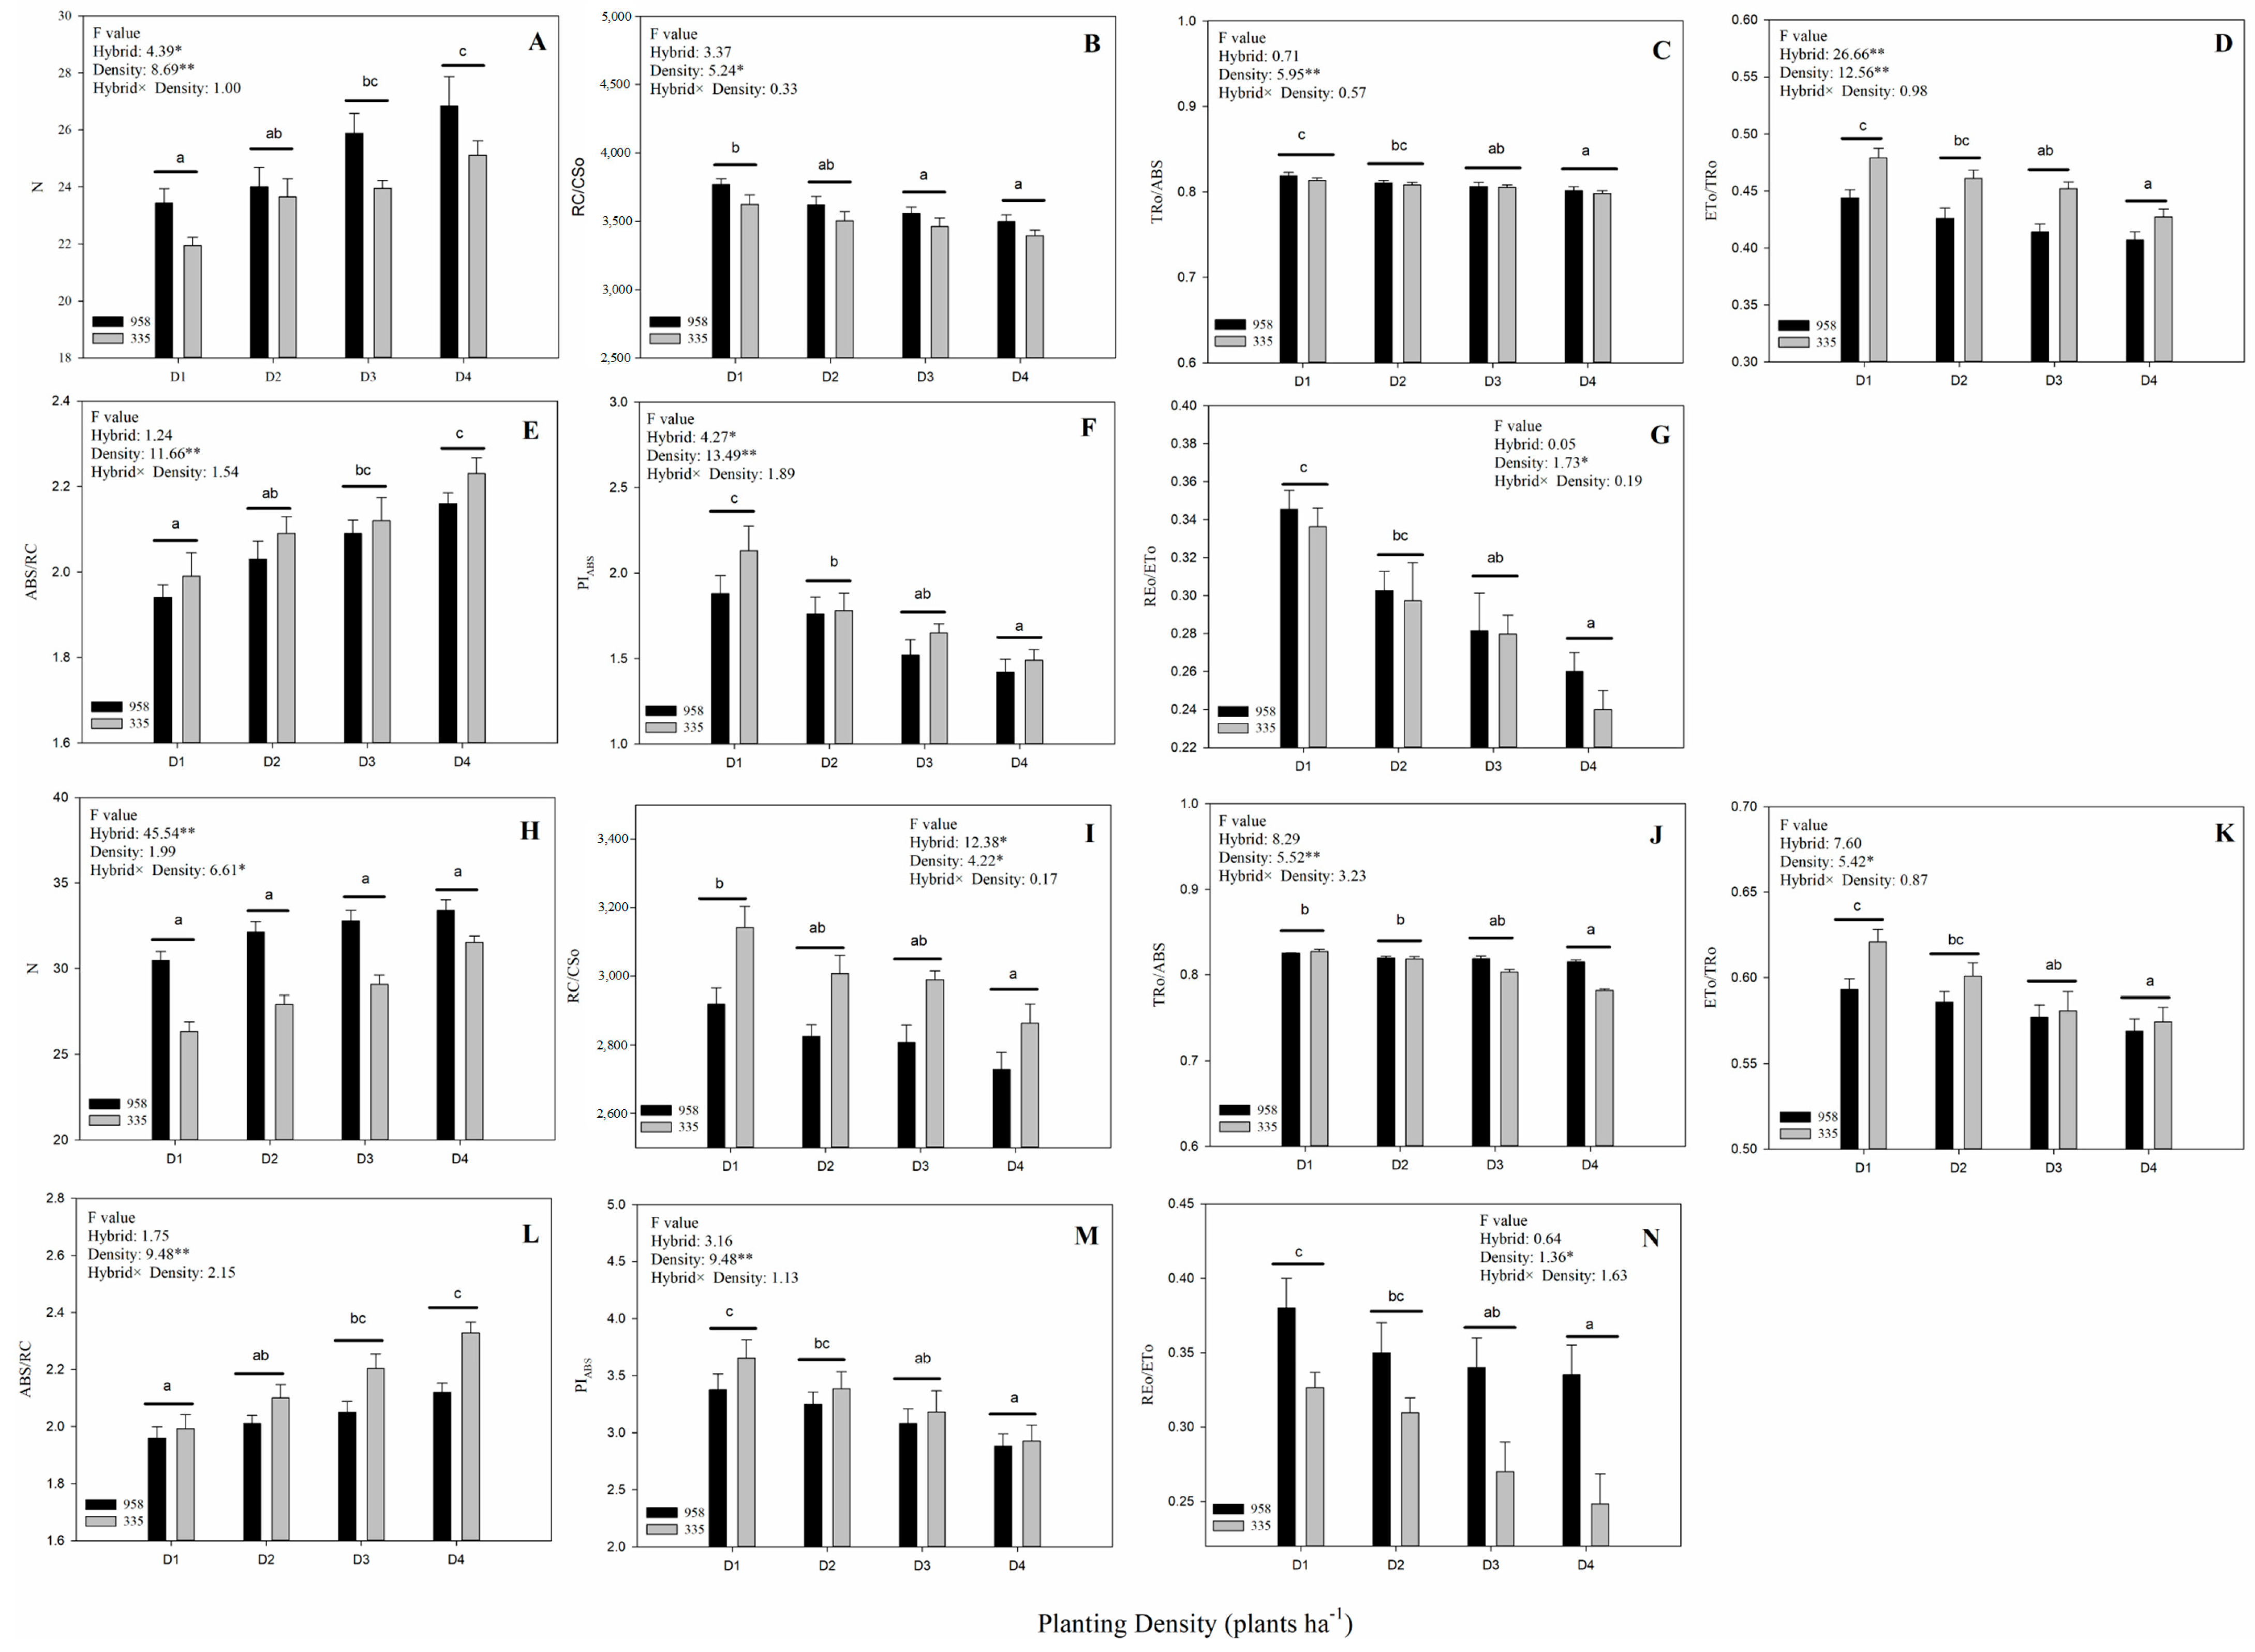
2.3. Prompt Fluorescence OJIP Transient Analysis

Zhengdan958 and Xianyu335 both exhibited points O, J, I and P, presenting a typical OJIP transient (Figure 2A,C,E,G). Furthermore, points FO, FJ, FI and FP of both hybrids gradually decreased with increasing planting density (Figure 2A,C,E,G). The O–P standardization of the OJIP transients revealed the modified shape of several OJIP transient phases following increasing planting density for both hybrids, particularly at the J-step (Figure 2B,D,F,H).
In order to further investigate the effect of increasing planting density on each OJIP transient phase, the OJIP transients were double-normalized between FO and FK, FO and FJ, FO and FI, FJ and FI and FI and FP, respectively. The double-normalized signals of the lowest plant density (D1) were subtracted from the remaining densities to determine the ∆WOK, ∆WOJ, ∆WOI, ∆WJI and ∆WIP curves (Figure 3 and Figure 4). These curves allowed for the visualization of the L-band [8], K-band [9] J-step [10,11], H-band [12] and G-band [11], respectively. There was no sign of positive L-, K- and H-bands for the two maize hybrids under high planting density (Figure 3A,F, Figure 4A,F; Figure 3B,G, Figure 4B,G and Figure 3D,I, Figure 4D,I, respectively). A significant elevation of the J-step was associated with a high planting density in the two maize hybrids (Figure 3C,H and Figure 4C,H), while both hybrids also exhibited positive G-bands (Figure 3E,J and Figure 4E,J).
In order to quantitatively analyze the impact of increasing planting density on the photosynthetic electron transport chain, several parameters were derived from the OJIP transient using the JIP-test (Table S2) [13]. Planting density showed a significant effect on all JIP-test parameters, except the parameter N in 2020 (Figure 5). In contrast, hybrid and the interaction between hybrid and planting density showed no significant effect on most of these parameters. The values of PIABS, RC/CSO, TRO/ABS, ETO/TRO and REO/ETO were observed to decrease with increasing plant density, while ABS/RC and N increased significantly (Figure 5).

2.4. MR/MRO Transient Analysis

The lowest point of the MR/MRO transient increased with planting density for both hybrids. This consequently altered the shapes of the positive and negative slopes of the MR/MRO transient (Figure 6). In order to quantitatively analyze the redox variations of PSI under different planting densities, the maximum decline rate VPSI and maximum rise rate VPSII-PSI were calculated based on the MR/MRO transient (Table 2). VPSI and VPSII-PSI values exhibited a gradual decrease with increasing planting density for both hybrids (Table 2).

2.5. DF Induction and Decay Transient Analysis

The 20-μs delay-time DF signals determined for each dark interval were used to derive the DF induction curve. The DF induction curve of the two maize hybrids exhibited an increase from an initial minimum (DO) to a maximum (I1), followed by a decrease to a plateau (D2) until a second maximum (I2) was reached (Figure 7). The DF induction curve amplitudes were observed to decrease with increasing planting density, with I1 exhibiting the greatest reduction (Figure 7A,C,E,G). The standardization of points DO and I1 revealed the ability of a higher planting density to enhance I2/I1 values (Figure 7B,D,F,H).
The DF signals measured in each dark interval exhibited a polyphasic decreasing trend with time. The DF decay parameters L1 and L2 were calculated using the DF decay curve determined for the dark interval of the JIP-time of DF induction transient I1 step (Figure S1). These decay parameters represent the amounts of the redox states ZP680 + QA- and Z+P680QA-QB, respectively [13,14]. Results indicate that the increase in planting density induced a gradual decrease in both L1 and L2 (Table 3).

2.6. Correlation Analysis between Photosynthetic Parameters

Significant correlations were observed among the photosynthetic, Pn, JIP-test, DF and MR parameters (Table 4). For example, a significant positive correlation was observed for the following parameter pairs: Pn and PIABS, Pn and ETO/TRO, Pn and L2, RC/CSO and VPSI, RC/CSO and VPSII-PSI, TRO/ABS and L2, REO/ETO and L2 (both years); Pn and TRO/ABS, Pn and REO/ETO, PIABS and L2, RC/CSO and L1, RC/CSO and L2, TRO/ABS and VPSI, TRO/ABS and L1, REO/ETO and L1 (2019) and Pn and VPSI, Pn and VPSII-PSI, Pn and L1, PIABS and VPSI, PIABS and VPSII-PSI, ETO/TRO and VPSI, ETO/TRO and VPSII-PSI (2020). A significant negative correlation was observed between Pn and ABS/RC, ABS/RC and L2 (both years); Pn and N, ABS/RC and L1 (2019) and N and VPSI, N and VPSII-PSI (2020). Furthermore, VPSI and VPSII-PSI were both positively correlated with L1 (both years) and L2 (2019).
A significant negative correlation was observed for parameter pairs PIABS and N, N and ETO/TRO, TRO/ABS and ABS/RC, ABS/RC and REO/ETO (both years); PIABS and ABS/RC, N and REO/ETO, RC/CSO and ABS/RC (2019) and N and RC/CSO (2020). A significant positive correlation was observed for PIABS and ETO/TRO, TRO/ABS and REO/ETO (both years); PIABS and TRO/ABS, PIABS and REO/ETO, N and ABS/RC, RC/CSO and TRO/ABS, RC/CSO and REO/ETO (2019) and PIABS and RC/CSO, RC/CSO and ETO/TRO (2020). A positive correlation was observed between VPSI and VPSII-PSI and L1 and L2 for both years.

3. Discussion

The grain yields of Xianyu335 and Zhengdan958 demonstrated similar responses to changes in the planting density. In particular, the yields exhibited an initial increase from D1 to D3 and subsequently declined to minimum levels at D4, with the reduction in yields almost equal in the two hybrids (Table 1). This suggests that Xianyu335 and Zhengdan958 have a similar tolerance to high planting density. Similar results were also observed in previous studies [15]. Furthermore, Xianyu335 and Zhengdan958 also exhibited similar trends in photosynthetic variations for increasing plant density. More specifically, the enhanced mutual shading of the ear leaves resulting from the high planting density led to a continuous reduction of the photosynthetic rate for both hybrids from D1 to D4 (Figure 1). The maximum grain yield of Xianyu335 and Zhengdan958 was achieved at D3 (Table 1), and is thus regarded as a suitable planting density for both hybrids. The rise in grain yield from D1 to D3 can be attributed to the increased planting density, while the subsequent decline in grain yield following D3 is linked to the reduced photosynthesis.
Photosynthesis is a complicated multicomponent process. The damage or weakening of any of the involved component can consequently reduce photosynthesis. In this study, several photosynthetic electron transport chain related parameters were observed to be significantly correlated with photosynthetic rate (Table 4). Furthermore, the variations in the shape of the OJIP transients, DF induction and decay transients and MR kinetics of Xianyu335 and Zhengdan958 were observed following the increasing planting density (Figure 2, Figure 6 and Figure 7). This indicates the ability of a high planting density to alter the activity of the photosynthetic electron transport chain. This may subsequently play a role in the reduced photosynthesis. Therefore, we further investigated the effect of high planting density on the photosynthetic electron transport chain.
The PF OJIP transient and corresponding JIP-test parameters provide information on the electron transfer and related events occurring in the photosynthetic electron transport chain [6,16]. The JIP-test parameters RC/CSO and ABS/RC, which represent the RC density per unit area and the light energy absorbed per RC, were observed to increase (Figure 5B,I) and decrease (Figure 5E,L), respectively. This suggests that the high planting density inactivated PSII RC and reduced the number of active PSII RC [17,18]. This subsequently enhanced the number of RC turnovers for a reduction of PQ pool, which can be observed by the increase in parameter N (Figure 5A,H). The JIP-test parameter TRO/ABS reflects the average maximum primary photochemistry quantum yield of active and inactive RCs [19,20]. The decrease in TRO/ABS observed under a high planting density (Figure 5C,J) may also be linked to the lower number of active RCs [21]. In addition, the overall signal strength of the OJIP transient under a high planting density may have decreased with the number of active PSII RCs (Figure 2). The OJIP transient J-step is associated with the electron flow from QA to QB, whereby the higher the J-step, the greater the electron blockage at this site [10,11]. We observed the J step to increase with planting density (Figure 3C,H and Figure 4C,H), suggesting that a high planting density induced the electron transfer blockage from QA to QB. This is also implied by the decrease in JIP-test parameter ETO/TRO (Figure 5D,K), which denotes the probability of a trapped exciton moving an electron into the electron transport chain beyond QA-. The G-band reflects the reduction of the PSI acceptor side via the electrons expelled from the PQ pool [22]. Electron-traffic jams caused by the instantaneous blockage of the PSI acceptor side can result in a positive G-band [23]. In the current study, Zhengdan958 and Xianyu335 both exhibited positive G-bands with increasing planting density (Figure 3E,J and Figure 4E,J). This indicates that high planting density decreased the functionality of the PSI acceptor side and blocked the electron transfer at this site. This is in agreement with the lower observed JIP-test parameter REO/ETO (Figure 4N and Figure 5G), which refers to the probability that an electron beyond QA reduces an end acceptor at the PSI electron acceptor site. The JIP-test parameter PIABS integrates the information of three independent parameters (ABS/RC, TRO/ABS and ETO/TRO) to reflect PSII activity more accurately compared to each individual parameter [19,24,25]. The lower number of active PSII RCs and the enhanced electron transfer blockage from QA to QB reduced PIABS under a high planting density (Figure 5F,M).
The L-band of the OJIP transient is associated with the connectivity between independent PSII units, with a positive L-band suggesting a decrease in the connectivity between PSII units [26,27]. Xianyu335 and Zhengdan958 did not exhibit a positive L-band (Figure 3A,F and Figure 4A,F), suggesting that the high planting density employed in this study did not result in any impairment to the energetic connectivity of the PSII units. The K-band is linked to the oxygen-evolving-complex (OEC) at the PSII donor side, with a positive K-band suggesting the inactivation of the OEC [28,29,30]. Numerous studies have demonstrated the induction of a positive and pronounced K-band from severe abiotic stresses (e.g., drought stress, salt stress and high temperature) [19,31,32]. Our results failed to reveal a positive K-band for Xianyu335 and Zhengdan958 with increasing planting density (Figure 3B,G and Figure 4B,G). This suggests the lack of OEC damage and electron transfer capacity impairment on the PSII donor side following the increased planting density. The H-band reflects the redox process of the PQ pool, during which the electrons transferred from the PSII begin to reduce the PQ pool [33]. We did not observe a positive H-band for Xianyu335 and Zhengdan958 with increasing planting density (Figure 3D,I and Figure 4D,I), suggesting that the high planting density employed in this study did not affect the equilibrium between the oxidation and PQ pool reduction.
The decreasing and increasing slopes of the MR/MRO curve reflect the oxidation and rereduction of PSI, respectively [34]. In the present study, both the slopes of the MR/MRO curve were changed by high planting density (Figure 6), suggesting the marked effect of high planting density on the PSI oxidation and rereduction activities. The decrease in VPSI and VPSII-PSI (Table 2) indicates that high planting reduced PSI oxidation and PSI rereduction activities, respectively [8]. A PSI rereduction activity can be attributed to a lower PSII capacity to pump electrons to PSI, an increase in the relative activity of PSI compared to PSII, and/or a decrease in functionality of at PSI acceptor side. VPSII-PSI exhibited a stronger correlation with VPSI compared to other parameters (Table 4), suggesting that the variations in PSI relative activity may have a marked influence on the rereduction of PSI.
Delayed chlorophyll a fluorescence is a result of the repopulation of excited PSII antenna chlorophyll by backward electrons arriving at the active PSII RCs [35]. The intensity of the DF induction transient was lowered as the planting density increased (Figure 7A,C,E,G), suggesting that the number of active PSII RCs decreased under a high planting density. The I1 amplitude of the DF induction curve is related to the electron transfer capacity of the PSII donor side, PSII acceptor side and/or the number of active PSII RCs [21,36]. The reduced number of active RCs and weaker electron transfer blockage between QA and QB may explain the decrease in the I1 amplitude of the DF induction curve under a high planting density (Figure 7A,C,E,G). Furthermore, the reduced number of active RCs and limited electron transfer between QA and QB caused by a high planting density may lower the accumulation of the two luminescent components, ZP680 + QA and Z+P680QAQB [37,38], reflected by parameters L1 and L2, respectively. These two parameters were observed to decrease with increasing planting density (Table 3), thus agreement with the previous observation. Point I2 point of the DF induction curve generally coincides with the I–P phase of the OJIP transient and the increasing phase of the MR/MRO curve, suggesting that point I2 is linked to the reduction of the PSI acceptor side [38,39]. Consistent with the aforementioned results of PF and MR, the reduction in the I2 amplitude (Figure 7A,C,E,G) suggests a decreasing trend for PSI reduction activity at a high planting density. The I2/I1 ratio is associated with the relative activity of PSI compared to PSII [23,40]. The increased I2/I1 observed in our results (Figure 7B,D,F,H) suggests the greater influence of high planting density in reducing PSII compared to PSI activity.

4. Materials and Methods

4.1. Plant Material Growth and Treatment

Two maize hybrids, Zhengdan958 and Xianyu335 were planted in the experimental field of the Agricultural College of Yangzhou University, China on 20 April 2019 and 16 May 2020. We employed four planting densities of 45,000, 67,500, 90,000 and 112,500 plants ha1 expressed by D1, D2, D3 and D4, respectively. The experiment was based on a two-factor (hybrids and planting density) randomized block design with two replications. The area of each plot was 9 m2, with a fixed row length of 3 m and spacing of 0.6 m, respectively. Different planting densities were achieved by adjusting plant spacing (Table S1). The two maize hybrids were grown under natural irradiance. The daily average temperature throughout the growing seasons of 2019 and 2020 was 24.93 °C and 26.72 °C, respectively (Figure S2). The daily relative humidity was 69.05% and 76.32%, respectively. The daily sunshine duration was 4.53 h and 3.53 h, respectively. The field management followed that of local standard agronomic practices.

4.2. Determination of Yield

The maize plants were manually harvested on 15 August 2019 and 27 August 2020. The ear was fully dried to a constant mass, and the yield of each plot was weighed after threshing and converted into hectare yield (kg ha−1).

4.3. Determination of Net Photosynthetic Rate

One week after maize pollination, 5 maize plants were randomly selected from the center of each plot to determine the photosynthetic rate. The photosynthetic rate was measured using a CIRAS-3 portable gas exchange system (PP-Systems, USA). During measurements, the CIRAS-3 automatic control device-controlled CO2 concentration (390 µmol mol−1), air humidity (60%), PARi (1800 µmol m−2s−1), gas flow (100 cc/min) and leaf temperature (25 °C). Measurements were performed on the central and upper regions of ear leaf. All measurements were made in a sunny morning (9:00–11:30 AM) on the same day.

4.4. Prompt Chlorophyll a Fluorescence, Delayed Chlorophyll a Fluorescence and Modulated 820 nm Reflection Measurements

The multifunctional plant efficiency analyzer (M-PEA, Hansatech, Norfolk, UK) was employed to simultaneously measure the signals of PF, DF and MR. One week after maize pollination, we randomly selected 5 maize plants in the center of each plot for the measurements of these signals. A leaf disk with 20 cm length and full width was cut from the middle part of the ear leaf of each plant, and maintained in wet gauze for the dark adaptation for more than half to achieve a full dark-adapted state an hour prior to the measurements. Under the full dark-adapted state, all PSII RCs in the leaf are open, and the PF signal at the onset of illumination is FO. The measurement was made two times at two different positions of each leaf sample. During the measurements, an actinic light source with an intensity of 5000 µmol (photons) m−2s−1 uniformly illuminated the leaf sample surface. The PF and DF signals were measured when the actinic light was on (light interval) and off (dark interval), respectively. The first reliable MR measurement was at 0.7 ms after the first switching on of the actinic light, and the signal recorded at this time was taken as MRO. All measurements were made in a laboratory at room temperature (26 °C), with a 60% relative humidity.
Seven PF parameters including N, RC/CSO, TRO/ABS, ETO/TRO, ABS/RC, PIABS and REO/ETO were derived from the PF OJIP transient according to a JIP-test method [8]. Two MR parameters, VPSI and VPSII-PSI, were derived from the MR/MRO transient according to a previously described method [7]. Three DF parameters, I1, I2 and I2/I1, were derived from the DF induction curve, where I1 and I2 denote the first and second maxima of the DF induction curve, respectively. Another five DF parameters including L1, L2, L3, τ1 and τ2 were derived from the DF decay curve according to a previously described method [7], where L denotes the amplitude of the emission component and τ is the lifetime of the DF component. For a detailed description of these parameters, see Table 5.

4.5. Statistical Analysis

All data were analyzed using SPSS 16.0 (IBM, New York, NY, USA), with the PROC MEANS procedure employed to calculate the means of the phenotypic data. The data collected from the 5 plants in the same plot were averaged to represent the value of this plot. The plot data were used in analysis of variance (ANOVA) for effect of planting density and maize hybrid. A two-factor (hybrids and planting density) ANOVA analysis was employed. Duncan’s multiple range test was performed at p < 0.05. Values were presented as the means of two replicates ± standard error (SE).

5. Conclusions

The mutual shading among individual plants resulting from high planting density inevitably reduced maize ear leaf photosynthesis. Improving maize planting density to achieve high yield works only when the yield loss caused by decreased photosynthesis did not exceed the gain of increased planting density. Photosynthetic electron transport was required for efficient photosynthetic activity. However, the effect of high planting density on the photosynthetic electron transport chain in maize currently remained unclear. In the current study, we proposed a simultaneous measurement of PF, DF and MR in order to investigate the effect of increasing planting density on maize photosynthetic electron transport chain. The increase in planting density was observed to inactivate PSII RCs, block the electron transfer between QA and QB, reduce PSI oxidation and rereduction activities and decrease the functionality of the PSI acceptor side. Furthermore, a high planting density induced a greater reduction in PSII activity compared to PSI activity. In agreement with the similar tolerance to high planting density, the two maize hybrids Xianyu335 and Zhengdan958 used in the current study demonstrated similar changes in the photosynthetic electron transport chain under high planting density. Simultaneous measurement of PF, DF and MR is a rapid, accurate and non-invasive method to investigate the changes in photosynthetic electron transport. More importantly, it can provide complementary and mutually corroborated information. Future studies using two maize hybrids with contrasting tolerance to high planting density are needed to test whether this simultaneous measurement could be used to distinguish tolerant from sensitive maize hybrids.

Supplementary Materials

The following are available online at https://www.mdpi.com/2223-7747/10/2/276/s1, Figure S1: Kinetics of delayed fluorescence DF (in arbitrary units) at the characteristic steps I1 (7 ms JIP-time) of the two maize hybrids under different planting densities. (A,B): 2019 data; (C,D): 2020 data. (A,C): Absolute values of Zhengdan958. (C,D): Absolute values of Xianyu335. Figure S2: Daily mean temperature, daily relative humidity and daily sunshine duration during the growing season in (A) 2019 and (B) 2020. Table S1: Planting density of the maize in field, Table S2: Formulae and glossary of terms used by the JIP-test for Chl a fluorescence transient OJIP analysis.

Author Contributions

Conceptualization, W.C. and Z.Y.; methodology, Z.Y. and H.L.; software, Z.Y.; validation, Z.Y.; formal analysis, W.C. and M.C.; investigation, W.C. and Y.L.; resources, Z.Y.; data curation, W.C., J.C. and Y.F.; writing—original draft preparation, W.C. and B.J.; writing—review and editing, W.C.; visualization, Z.Y.; supervision, W.C. and Z.Y.; project administration Z.Y.; funding acquisition, Z.Y. All authors have read and agreed to the published version of the manuscript.

Funding

This study was supported by grants from the National Natural Science Foundation of China (31972965), the Jiangsu Major Variety Breeding Project (PZCZ201710), Jiangsu Agriculture Science and Technology Innovation Fund (CX (20) 1002), Project of Special Funding for Crop Science Discipline Development (yzuxk202006), and the Priority Academic Program Development of Jiangsu Higher Education Institutions.

Institutional Review Board Statement

Not applicable.

Informed Consent Statement

Not applicable.

Data Availability Statement

The data presented in this study is contained within the article.

Conflicts of Interest

The authors have declared no conflict of interest.

Abbreviations

PFinstantaneous chlorophyll fluorescence
MRmodulated 820 nm light reflection
DFchlorophyll a delayed fluorescence
PSIphotosystem I
PSIIphotosystem II
P680PSII reaction center
P700PSI reaction center
Nnumber of QA reduction events
RC/CSOdensity of PSII RC per unit area
TRO/ABSratio of captured light energy to absorbed light energy
ETO/TROefficiency of electron transport at QA-
ABS/RClight energy absorbed by the unit reaction center
PIABSperformance index (potential) for energy conservation from photons absorbed by PSII to the reduction of intersystem electron acceptors
REO/ETOefficiency of an electron beyond QA reduces PSI acceptors
Pnnet photosynthetic rate
QAphotosystem II primary quinone acceptor
QBphotosystem II secondary quinone acceptor
PQplastoquinone
VPSImaximum falling slope of the MR/MRO curve
VPSII -PSImaximum rising slope of the MR/MRO curve
OECOxygen-evolving complex
L1, L2 and L3amplitudes of the DF decay kinetic components

References

  1. Tollenaar, M.; Lee, E.A. Yield potential, yield stability and stress tolerance in maize. Field Crops Res. 2002, 75, 161–169. [Google Scholar] [CrossRef]
  2. Tollenaar, M.; Deen, W.; Echarte, L.; Liu, W. Effect of Crowding Stress on Dry Matter Accumulation and Harvest Index in Maize. Agron. J. 2006, 98, 930–937. [Google Scholar] [CrossRef]
  3. Lu, R.S. Soil Agricultural Chemical Analysis Method; China Agricultural Science and Technology Press: Beijing, China, 2000. [Google Scholar]
  4. Hassink, J. Density fractions of soil macro organic matter and microbial biomass as predictors of C and N mineralization. Soilbiol. Biochem. 1995, 27, 1099–1108. [Google Scholar] [CrossRef]
  5. Logan, B.A. Chlorophyll a Fluorescence: A Signature of Photosynthesis. J. Torrey Bot. Soc. 2005, 132, 650. [Google Scholar] [CrossRef]
  6. Govindjee, P.G. Chlorophyll a Fluorescence: A Bit of Basics and History, Chlorophyll a Fluorescence; Springer: Dordrecht, The Netherlands, 2004; pp. 1–42. [Google Scholar]
  7. Gao, J.; Li, P.M.; Ma, F.W.; Goltsev, V. Photosynthetic performance during leaf expansion in Malus micromalus probed by chlorophyll a fluorescence and modulated 820nm reflection. J. Photochem. Photobiol. B 2014, 137, 144–150. [Google Scholar] [CrossRef]
  8. Strasser, R.J. Analysis of the chlorophyll a fluorescence transient. In Chlorophyll A Fluorescence a Signature of Photosynthesis; Springer: Dordrecht, The Netherlands, 2004; Volume 19, pp. 321–362. [Google Scholar]
  9. Oukarroum, A.; Madidi, S.E.; Schansker, G.; Strasser, R.J. Probing the responses of barley cultivars (Hordeum vulgare L.) by chlorophyll a fluorescence OLKJIP under drought stress and re-watering. Environ. Exp. Bot. 2007, 60, 438–446. [Google Scholar] [CrossRef]
  10. Gao, Y.; Liu, W.; Wang, X.X.; Yang, L.H.; Han, S.; Chen, S.G.; Strasser, R.J.; Valerde, B.E.; Qiang, S. Comparative phytotoxicity of usnic acid, salicylic acid, cinnamic acid and benzoic acid on photosynthetic apparatus of Chlamydomonas reinhardtii. Plant Physiol. Biochem. 2018, 128, 1–12. [Google Scholar] [CrossRef]
  11. Tóth, S.Z.; Schansker, G.; Garab, G.; Strasser, R.J. Photosynthetic electron transport activity in heat-treated barley leaves: The role of internal alternative electron donors to photosystem II. Biochim. Biophys. Acta 2007, 1767, 295–305. [Google Scholar] [CrossRef] [Green Version]
  12. Momchil, P.; Lyubka, K.; Andon, V.; Jaco, V.; Vasilij, G. Effects of Different Metals on Photosynthesis: Cadmium and Zinc Affect Chlorophyll Fluorescence in Durum Wheat. Int. J. Mol. Sci. 2018, 19, 787. [Google Scholar]
  13. Goltsev, V.; Zaharieva, I.; Lambrev, P.; Yordanov, I.; Strasser, R. Simultaneous 20analysis of prompt and delayed chlorophyll a fluorescence in leaves during the induction period of dark to light adaptation. J. Theor. Biol. 2003, 225, 171–183. [Google Scholar] [CrossRef]
  14. Goltsev, V.; Zaharieva, I.; Chernev, P.; Strasser, R.J. Delayed fluorescence in photosynthesis. Photosynth. Res. 2009, 101, 217. [Google Scholar] [CrossRef] [PubMed]
  15. Bai, Z.Y.; Li, C.D.; Zheng, J.F.; Bi, C.R.; Tang, G.L. Effects of Planting Density on Physiological Characteristics and Yield of Maize Xianyu335 and Zhengdan958. North China Agric. J. 2010, 25, 166–169. [Google Scholar]
  16. Dąbrowski, P.; Pawluśkiewicz, B.; Baczewska, A.H.; Oglęcki, P.; Kalaji, H. Chlorophyll a fluorescence of perennial ryegrass (Lolium perenne L.) varieties under long term exposure to shade. Zemdirbyste 2015, 102, 305–312. [Google Scholar]
  17. Mehta, P.; Jajoo, A.; Mathur, S.; Bharti, S. Chlorophyll a fluorescence study revealing effects of high salt stress on Photosystem II in wheat leaves. Plant Physiol. Biochem. 2010, 48, 16–20. [Google Scholar] [CrossRef]
  18. Zhang, R.H.; Zhang, X.H.; Camberato, J.J.; Xue, J.Q. Photosynthetic performance of maize hybrids to drought stress. Russ. J. Plant Physiol. 2015, 62, 788–796. [Google Scholar] [CrossRef]
  19. Kan, X.; Ren, J.J.; Chen, T.T.; Cui, M.; Li, C.L.; Zhou, R.H.; Zhang, Y.; Liu, H.H.; Deng, D.X.; Yin, Z.T. Effects of salinity on photosynthesis in maize probed by prompt fluorescence, delayed fluorescence and P700 signals. Environ. Exp. Bot. 2017, 140, 56–64. [Google Scholar] [CrossRef]
  20. Pavlovi, I.; Mlinari, S.; Tarkowská, D.; Oklestková, J.; Novák, O. Early Brassica Crops Responses to Salinity Stress: A Comparative Analysis between Chinese Cabbage, White Cabbage, and Kale. Front. Plant Sci. 2019, 10, 450. [Google Scholar] [CrossRef] [Green Version]
  21. Strasser, R.J.; Tsimilli-Michael, M.; Qiang, S.; Goltsev, V. Simultaneous in vivo recording of prompt and delayed fluorescence and 820-nm reflection changes during drying and after rehydration of the resurrection plant Haberlea rhodopensis. Biochim. Biophys. Acta (BBA)-Bioenerg. 2010, 1797, 1313–1326. [Google Scholar] [CrossRef] [Green Version]
  22. Schansker, G.; Tóth, S.Z.; Strasser, R.J. Methylviologen and dibromothymoquinone treatments of pea leaves reveal the role of photosystem I in the Chl a fluorescence rise OJIP. Biochim. Biophys. Acta 2005, 1706, 250–261. [Google Scholar] [CrossRef] [Green Version]
  23. Goltsev, V.; Zaharieva, I.; Chernev, P. Drought-induced modifications of photosynthetic electron transport in intact leaves: Analysis and use of neural networks as a tool for a rapid non-invasive estimation. Biochim. Biophys. Acta 2012, 1817, 1490–1498. [Google Scholar] [CrossRef] [Green Version]
  24. Strasser, R.J.; Srivastava, A.; Tsimilli-Michael, M. The fluorescence transient as a tool to characterize and screen photosynthetic samples. Probing Photosynth. Mech. Regul. Adapt. 2000, 25, 445–483. [Google Scholar]
  25. Begovic, L.; Galic, V.; Abicic, I.; Loncaric, Z.; Mlinaric, S. Implications of intra-seasonal climate variations on chlorophyll a fluorescence and biomass in winter barley breeding program. Photosynthetica 2020, 58, 995–1008. [Google Scholar] [CrossRef]
  26. Dąbrowski, P.; Baczewska-Dąbrowska, A.H.; Kalaji, H.M.; Goltsev, V.; Paunov, M.; Rapacz, M.; Wójcik-Jagła, M.; Pawluśkiewicz, B.; Bąba, W.; Brestic, M. Exploration of Chlorophyll a Fluorescence and Plant Gas Exchange Parameters as Indicators of Drought Tolerance in Perennial Ryegrass. Sensors 2019, 19, 2736. [Google Scholar] [CrossRef] [PubMed] [Green Version]
  27. Rastogi, A.; Zivcak, M.; Tripathi, D.K.; Yadav, S.; Kalaji, H.M.; Brestic, M. Phytotoxic effect of silver nanoparticles in Triticum aestivum: Improper regulation of photosystem I activity as the reason for oxidative damage in the chloroplast. Photosynthetica 2019, 57, 209–216. [Google Scholar] [CrossRef]
  28. Guissé, B.; Srivastava, A.; Strasser, R.J. Effects of high temperature and water stress on the polyphasic chlorophyll a fluorescence transient of potato leaves. In Photosynthesis: From Light to Biosphere; Mathis, P., Ed.; Kluwer Academic Publishers: Dordrecht, The Netherlands, 1995; pp. 913–916. [Google Scholar]
  29. Dąbrowski, P.; Baczewska, A.H.; Pawluśkiewicz, B. Prompt chlorophyll a fluorescence as a rapid tool for diagnostic changes in PSII structure inhibited by salt stress in Perennial ryegrass. J. Photochem. Photobiol. B Biol. 2016, 157, 22–31. [Google Scholar] [CrossRef]
  30. Kalaji, H.M.; Račková, L.; Paganová, V.; Swoczyna, T.; Rusinowski, S.; Sitko, K. Can chlorophyll a fluorescence parameters be used as bio-indicators to distinguish between drought and salinity stress in Tilia cordata Mill? Environ. Exp. Bot. 2018, 152, 149–157. [Google Scholar] [CrossRef]
  31. Zhou, R.H.; Kan, X.; Chen, J.J.; Hua, H.L.; Yin, Z.T. Drought-induced changes in photosynthetic electron transport in maize probed by prompt fluorescence, delayed fluorescence, P700 and cyclic electron flow signals. Environ. Exp. Bot. 2018, 158, 51–62. [Google Scholar] [CrossRef]
  32. Chen, S.G.; Yang, J.; Zhang, M.S.; Strasser, R.J.; Qiang, S. Classification and characteristics of heat tolerance in Ageratina adenophora populations using fast chlorophyll a fluorescence rise O-J-I-P. Environ. Exp. Bot. 2016, 122, 126–140. [Google Scholar] [CrossRef]
  33. Zhang, W.T.; Li, P.M. Application of simultaneous measurement technology of instantaneous and delayed chlorophyll fluorescence and 820nm light reflection dynamics in the research of photosynthesis. J. Biophys. 2015, 31, 221–229. [Google Scholar]
  34. Schansker, G.; Srivastava, A.; Govindjee Strasser, R.J. Characterization of the 820-nm transmission signal paralleling the chlorophyll a fluorescence rise (OJIP) in pea leaves. Funct. Plant Biol. 2003, 30, 785–796. [Google Scholar] [CrossRef] [Green Version]
  35. Oukarroum, A.; Goltsev, V.; Strasser, R.J. Temperature Effects on Pea Plants Probed by Simultaneous Measurements of the Kinetics of Prompt Fluorescence, Delayed Fluorescence and Modulated 820 nm Reflection. PLoS ONE 2013, 8, e59433. [Google Scholar] [CrossRef] [PubMed]
  36. Salvatori, E.; Fusaro, L.; Gottardini, E.; Pollastrini, M.; Strasser, R.J.; Goltsev, V.; Bussotti, F. Plant stress analysis: Application of prompt, delayed chlorophyll fluorescence and 820 nm modulated reflectance: Insights from independent experiments. Plant Physiol. Biochem. 2014, 85, 105–113. [Google Scholar] [CrossRef] [PubMed]
  37. Goltsev, V.; Chernev, P.; Zaharieva, I.; Lambrev, P.; Strasser, R.J. Kinetics of delayed chlorophyll a fluorescence registered in milliseconds time range. Photosynth. Res. 2005, 84, 209–215. [Google Scholar] [CrossRef] [PubMed]
  38. Oukarroum, A.; El Gharous, M.; Goltsev, V.; Strasser, R.J. Desiccation-induced changes of photosynthetic transport in Parmelina tiliacea (Hoffm.) Ach. analysed by simultaneous measurements of the kinetics of prompt fluorescence, delayed fluorescence and modulated 820 nm reflection. J. Lumin. 2018, 198, 302–308. [Google Scholar] [CrossRef]
  39. Kalaji, H.M.; Goltsev, V.; Bosa, K.; Allakhverdiev, S.L.; Strasser, R.J.; Goltsev, V. Experimental in vivo measurements of light emission in plants: A perspective dedicated to David Walker. Photosynth. Res. 2012, 114, 69–96. [Google Scholar] [CrossRef] [PubMed]
  40. Dąbrowski, P.; Kalaji, M.H.; Baczewska, A.H.; Pawluśkiewicz, B.; Mastalerczuk, G. Delayed chlorophyll a fluorescence, MR 820, and gas exchange changes in perennial ryegrass under salt stress. J. Lumin. 2017, 183, 322–333. [Google Scholar] [CrossRef]
Figure 1. The net photosynthetic rate (Pn) of the two maize hybrids under different planting densities in (A) 2019 and (B) 2020. 958 denotes Zhengdan958 and 335 denotes Xianyu335. D1: 45,000 plants ha−1; D2: 67,500 plants ha−1; D3: 90,000 plants ha−1; D4: 112,500 plants ha−1. Values were presented as the means of two replicates ± standard error (SE). Different letters above the bars indicate significant differences between different densities at the 0.05 level. ** indicate significant differences at the 0.05 and 0.01 levels, respectively.
Plants 10 00276 g001
Figure 2. Prompt chlorophyll a fluorescence (PF) transients of the two maize hybrids under different planting densities. (AD): 2019 data; (EH): 2020 data. (A,E): Absolute values of Zhengdan958. (B,F): Normalized transients of Zhengdan958, expressed as Vt = [(Ft − FO)/(FP − FO)]. (C,G): Absolute values of Xianyu335. (D,H): Normalized transients of Xianyu335, expressed as Vt = [(Ft − FO)/(FP − FO)]. Signals are plotted on a logarithmic time scale.
Plants 10 00276 g002
Figure 3. Effect of different planting densities on the shape of the OK, OJ, OI, JI and IP bands in 2019. (A): Zhengdan958’s O-K difference kinetics (L-band), expressed as ΔWOK = WOK-WOKD1. (B): Zhengdan958’s O-J difference kinetics (K-band), expressed as ΔWOJ = WOJ − WOJD1. (C): Zhengdan958’s O-I difference kinetics (J-step), expressed as ΔWOI = WOI − WOID1. (D): Zhengdan958’s J–I difference kinetics (H-band), expressed as ΔWJI = WJI-WJID1. (E): Zhengdan958’s I–P difference kinetics (G-band), expressed as ΔWIP = WIP − WIPD1. (F): Xianyu335’s O–K difference kinetics (L-band), expressed as ΔWOK = WOK − WOKD1. (G): Xianyu335’s O–J difference kinetics (K-band), expressed as ΔWOJ = WOJ-WOJD1. H: Xianyu335’s O-I difference kinetics (J-step), expressed as ΔWOI = WOI − WOID1. (I): Xianyu335’s J–I difference kinetics (H-band), expressed as ΔWJI = WJI − WJID1. (J): Xianyu335’s I–P difference kinetics (G-band), expressed as ΔWIP = WIP − WIPD1.
Plants 10 00276 g003
Figure 4. Effect of different planting densities on the shape of the OK, OJ, OI, JI and IP bands in 2020. (A): Zhengdan958’s O–K difference kinetics (L-band), expressed as ΔWOK = WOK − WOKD1. (B): Zhengdan958’s O–J difference kinetics (K-band), expressed as ΔWOJ = WOJ − WOJD1. (C): Zhengdan958’s O–I difference kinetics (J-step), expressed as ΔWOI = WOI − WOID1. (D): Zhengdan958’s J–I difference kinetics (H-band), expressed as ΔWJI = WJI − WJID1. (E): Zhengdan958’s I–P difference kinetics (G-band), expressed as ΔWIP = WIP − WIPD1. (F): Xianyu335’s O–K difference kinetics (L-band), expressed as ΔWOK = WOK − WOKD1. (G): Xianyu335’s O–J difference kinetics (K-band), expressed as ΔWOJ = WOJ − WOJD1. (H): Xianyu335’s O–I difference kinetics (J-step), expressed as ΔWOI = WOI − WOID1. (I): Xianyu335’s J–I difference kinetics (H-band), expressed as ΔWJI = WJI − WJID1. (J): Xianyu335’s I–P difference kinetics (G-band), expressed as ΔWIP = WIP − WIPD1.
Plants 10 00276 g004aPlants 10 00276 g004b
Figure 5. Parameters derived from PF transients under different planting densities. (AG): 2019 data and (HN): 2020 data. (A,H): N, the number of QA reduction events. (B,I): RC/CSO, the density of photosystem II (PSII) RC per unit area. (C,J): TRO/ABS, the ratio of captured light energy to absorbed light energy. (D,K): ETO/TRO, the efficiency of electron transport at QA-. (E,L): ABS/RC, the light energy absorbed by the unit reaction center. (F,M): PIABS, performance index (potential) for energy conservation from photons absorbed by PSII to the reduction of intersystem electron acceptors. (G,N): REO/ETO, the efficiency of an electron beyond QA- reduced photosystem I (PSI) acceptors. Different letters (a, b, c) above the bars indicate significant differences between different planting densities at the 0.05 level. *, ** indicate significant differences at the 0.05 and 0.01 levels, respectively.
Plants 10 00276 g005
Figure 6. Modulated 820 nm reflection kinetics of the two maize hybrids under different planting densities. (AB): 2019 data and (CD): 2020 data. (A,C): Normalized values of Zhengdan958 expressed as modulated 820 nm reflection (MR)/MRO. (B,D): Normalized values of Xianyu335 expressed as MR/MRO. Signals are plotted on a logarithmic time scale. MRO is the first reliable MR measurement (taken at 0.7 ms).
Plants 10 00276 g006
Figure 7. Delayed chlorophyll a fluorescence (DF) induction kinetics of the two maize hybrids under different planting densities. (AD): 2019 data and (EH): 2020 data. (A,E): Absolute values of Zhengdan958. (B,F): Normalized values of Zhengdan958, expressed as (DFt − DO)/(DFI1 − DO). (C,G): Absolute values of Xianyu335. (D,H): Normalized values of Xianyu335, expressed as (DFt-DO)/(DFI1-DO). Signals are plotted on a logarithmic time scale. I1, I2, DO and D2 denote the 3 ms and 100 ms peaks, the initial minimum and final plateau, respectively.
Plants 10 00276 g007
Table 1. Analysis of variance for the effect of planting density and maize hybrid on yield.
HybridPlanting Density
(Plants ha−1)
Yield
(kg ha−1)
HybridPlanting Density
(Plants ha−1)
Yield
(kg ha−1)
2019Zhengdan958D18205a2020Zhengdan958D18645a
D210,294a D212,009b
D313,601b D315,348c
D413,147b D413,487bc
Xianyu335D18456a Xianyu335D18519a
D211,565b D211,934b
D312,923b D313,477b
D412,300b D412,645b
F valueHybrid3 × 10−6 F valueHybrid19.26 **
Density27.29 ** Density52.21 **
Hybrid × Density1.59 Hybrid × Density4.12 **
Note: Different letters (a, b, c) indicate significant differences between different densities within the hybrid at the 0.05 level, ** indicate significant differences at the 0.01 levels.
Table 2. Parameters derived from the modulated 820 nm reflection (MR/MRO) of the two maize hybrids under different planting densities. VPSI: maximum slope decrease of MR/MRO; VPSII-PSI: maximum slope increase of MR/MRO; VPSII = VPSI + VPSII-PSI.
VPSIVPSII-PSIVPSII
2019Zhengdan958
D11.0045 ± 0.00018a1.0055 ± 0.00022a2.0100 ± 0.00038a
D21.0039 ± 0.00018ab1.0047 ± 0.00025ab2.0086 ± 0.00042ab
D31.0037 ± 0.00016b1.0046 ± 0.00022b2.0083 ± 0.00037b
D41.0033 ± 0.00013b1.0042 ± 0.00021b2.0076 ± 0.00033b
Xianyu335
D11.0032 ± 0.00014a1.0037 ± 0.00015a2.0069 ± 0.00029a
D21.0029 ± 0.00009ab1.0035 ± 0.00021a2.0064 ± 0.00041ab
D31.0028 ± 0.00014ab1.0033 ± 0.00014a2.0061 ± 0.00027ab
D41.0023 ± 0.00018b1.0026 ± 0.00020b2.0049 ± 0.00037b
2020Zhengdan958
D11.0069 ± 0.00022a1.0075 ± 0.00025a2.0144 ± 0.00047a
D21.0061 ± 0.00026ab1.0065 ± 0.00028ab2.0126 ± 0.00053ab
D31.0058 ± 0.00045ab1.0059 ± 0.00041b2.0118 ± 0.00086b
D41.0053 ± 0.00025b1.0055 ± 0.00031b2.0109 ± 0.00055b
Xianyu335
D11.0074 ± 0.00042a1.0080 ± 0.00049a2.0154 ± 0.00091a
D21.0070 ± 0.00018ab1.0078 ± 0.00020a2.0148 ± 0.00037ab
D31.0061 ± 0.00027bc1.0069 ± 0.00022a2.0130 ± 0.00049bc
D41.0060 ± 0.00021c1.0060 ± 0.00027b2.0127 ± 0.00048c
Note: Different letters (a, b, c) indicate significant differences between different densities within the hybrid at the 0.05 level.
Table 3. DF decay parameters determined by fitting the experimental data to the time function DF (t) = L1 × exp (−t/τ1) + L2 × exp (−t/τ2) + L3, where L1, L2 and L3 are the amplitudes (in relative units) of the kinetic components, and τ1 and τ2 are their lifetimes (in ms).
L1L2L3τ1τ2
2019Zhengdan958
D1331.93 ± 9.88a63.67 ± 3.01a22.17 ± 2.03a0.02 ± 0.00a0.28 ± 0.02a
D2308.33 ± 7.99ab54.16 ± 3.06ab19.00 ± 1.96a0.02 ± 0.00a0.31 ± 0.03a
D3282.87 ± 9.95bc52.06 ± 3.10ab18.74 ± 1.90a0.02 ± 0.00a0.29 ± 0.03a
D4243.60 ± 10.01c46.17 ± 2.81b17.27 ± 1.88a0.02 ± 0.00a0.27 ± 0.04a
Xianyu335
D1272.96 ± 9.83a56.25 ± 3.08a20.09 ± 2.03a0.02 ± 0.00a0.30 ± 0.00a
D2263.53 ± 9.90a50.58 ± 2.85ab18.38 ± 1.97a0.02 ± 0.00a0.29 ± 0.01a
D3242.83 ± 8.74ab49.36 ± 3.01ab17.67 ± 1.91a0.02 ± 0.00a0.30 ± 0.01a
D4222.63 ± 9.90b44.36 ± 3.05b16.84 ± 2.91a0.02 ± 0.00a0.29 ± 0.02a
2020Zhengdan958
D1296.34 ± 10.79a56.26 ± 2.90a23.81 ± 2.81a0.02 ± 0.00a0.30 ± 0.03a
D2224.09 ± 13.84b48.82 ± 2.88ab20.12 ± 2.73a0.02 ± 0.00a0.32 ± 0.01a
D3209.20 ± 9.90bc46.35 ± 3.05ab19.66 ± 3.71a0.02 ± 0.00a0.32 ± 0.01a
D4184.86 ± 9.77c43.75 ± 2.86b18.46 ± 2.89a0.02 ± 0.00a0.34 ± 0.02a
Xianyu335
D1247.05 ± 9.66a49.93 ± 2.96a23.81 ± 1.97a0.02 ± 0.00a0.28 ± 0.03a
D2224.38 ± 7.95ab47.55 ± 2.83a20.70 ± 1.88a0.02 ± 0.00a0.30 ± 0.02a
D3216.77 ± 9.98ab43.36 ± 3.97a19.60 ± 1.91a0.02 ± 0.00a0.30 ± 0.02a
D4206.02 ± 9.84b41.54 ± 3.02b18.46 ± 2.98a0.02 ± 0.00a0.32 ± 0.03a
Note: Different letters (a, b, c) indicate significant differences between different densities within the hybrid at the 0.05 level.
Table 4. Correlation analysis between photosynthetic parameters.
NRC/
CSO
TRO/
ABS
ETO/
TRO
ABS/RCPI
ABS
REO/
ETO
VPSIVPSII-
PSI
L1L2Pn
N −0.46−0.70−0.92 **0.74*-0.94 **−0.76 *−0.10−0.01−0.37−0.61−0.87 **
RC/
CSO
−0.99 ** 0.94 **0.22−0.86 **0.650.90 **0.91 **0.87 **0.94 **0.97 **0.70
TRO/
ABS
−0.240.22 0.52−0.93 **0.82*0.99 **0.76*0.700.88 **0.98 **0.88 **
ETO/
TRO
-0.88 **0.88 **0.55 -0.580.84 **0.610.160.240.090.390.78*
ABS/
RC
0.16−0.17−0.96 **−0.53 −0.90 **−0.96**-0.65−0.58−0.77 *−0.88 **-0.78*
PIABS−0.84 **0.85 **0.640.97 **-0.64 0.89 **0.310.220.520.74*0.86 **
REO/
ETO
0.180.170.87 **0.22−0.92 **0.34 0.680.610.81*0.95 **0.89 **
VPSI−0.88 **0.88 **0.430.95 **−0.440.94 **0.17 0.99 **0.94 **0.82*0.41
VPSII-
PSI
−0.91 **0.90 **0.470.91 **−0.440.94 **0.160.97 ** 0.90 **0.76*0.32
L1−0.440.480.490.59−0.610.700.520.74 *0.71 * 0.91 **0.63
L2−0.270.300.76*0.57−0.86 **0.690.81*0.640.620.91 ** 0.84 **
Pn−0.660.690.640.85 **−0.71*0.93 **0.500.88 **0.87 **0.89 **0.86 **
Note: Correlation coefficients listed in lower triangle and upper triangle were determined from 2020 and 2019 data, respectively. *, ** indicate significant at the 0.05 and 0.01 levels, respectively.
Table 5. The PF, DF and MR parameters used in this study.
Parameters of PF
N = (SM/SS) = SMMO(1/VJ)the number of QA reduction events
RC/CSO = φPo (VJ/MO) (ABS/CSO)the density of PSII RC per unit area
φPo = TRO/ABS = [1 − (FO/FM)]the ratio of captured light energy to absorbed light energy
ψEo = ETO/TRO = (1 − VJ)the efficiency of electron transport at QA-
PIABS = (RC/ABS)·[φPo/(1 − φPo)]·[ψo/(1 − ψo)]performance index (potential) for energy conservation from photons absorbed by PSII to the reduction of intersystem electron acceptors
δRo = REO/ETO = (1 − VI)/(1 − VJ)the efficiency of an electron beyond QA- reduced PSI acceptors
Parameters of DF
L1, L2 and L3the amplitude of the emission component
τ1 and τ2the lifetime of the DF component
I1the first maxima of the DF induction curve
I2the second maxima of the DF induction curve
I2/I1the second maxima divided by the first maxima of the DF induction curve
Parameters of MR
VPSIThe maximum PSI oxidation rate
VPSII-PSImaximum PSI reduction rate
Publisher’s Note: MDPI stays neutral with regard to jurisdictional claims in published maps and institutional affiliations.

