Article

Differential Salt Tolerance Strategies in Three Halophytes from the Same Ecological Habitat: Augmentation of Antioxidant Enzymes and Compounds

by
AbdEl-Mageed F. M. Ghanem
1,
Elsayed Mohamed
1,*,
Ahmed M. M. A. Kasem
1 and
Abbas A. El-Ghamery
2
1
Botany and Microbiology Department, Faculty of Science, Al-Azhar University, Assuit 71524, Egypt
2
Botany & Microbiology Department, Faculty of Science (Cairo), Al-Azhar University, Madinat Nasr, Cairo 11751, Egypt
*
Author to whom correspondence should be addressed.
Plants 2021, 10(6), 1100; https://doi.org/10.3390/plants10061100
Submission received: 18 April 2021 / Revised: 27 May 2021 / Accepted: 28 May 2021 / Published: 30 May 2021

Abstract

:
Understanding the salt tolerance mechanism in obligate halophytes provides valuable information for conservation and re-habitation of saline areas. Here, we investigated the responses of three obligate halophytes namely Arthrocnemum macrostachyum, Sarcocornia fruticosa and Salicornia europaea to salt stress (0, 100, 200, 400 and 600 mM NaCl) during their vegetative growth with regard to biomass, ions contents (Na+, K+ and Ca2+), chlorophyll contents, carotenoids, phenolic compounds, flavonoids, and superoxide dismutase, peroxidase and esterase activities. S. europaea showed the lowest biomass, root K+ content, Chl a/b ratio, and carotenoids under salinity. This reduction of biomass is concomitant with the increase in proline contents and peroxidase activity. On the other hand, the promotion of growth under low salinity and maintenance under high salinity (200 and 400 Mm NaCl) in A. Macrostachyum and S. fruticosa are accompanied by an increase in Chl a/b ratio, carotenoids, phenolics contents, and esterase activity. Proline content was decreased under high salinity (400 and 600 mM NaCl) in both species compared to S. europaea, while peroxidase showed the lowest activity in both plants under all salt levels except under 600 mM NaCl in Arthrocnemum macrostachyum compared to S. europaea. These results suggest two differential strategies; (1) the salt tolerance is due to activation of antioxidant enzymes and biosynthesis of proline in S. europaea, (2) the salt tolerance in A. macrostachyum, S. fruticosa are due to rearrangement of chlorophyll ratio and biosynthesis of antioxidant compounds (carotenoids, phenolics and flavonoids) which their cost seem to need less energy than activation of antioxidant enzymes. The differential behavior in halophytes of the same habitat confirms that the tolerance mechanism in halophytes is species-specific which provides new insight about the restoration strategy of saline areas.

1. Introduction

Soil salinization is a critical problem which influences agricultural activities and inhibits crop productivity. The food and agriculture organization (FAO) [1] reported approximately 831 million hectares (6% of total world land) were affected by salinity. Also, A high percentage of cultivated land around the world (more than 20%) is affected by salinity, and this percentage is daily increasing [2,3]. On the same side, population density, unfavorable environmental conditions and climate changes lead to reduce in cultivated lands [4]. Crop production decreasing with increasing population density could lead to famine around the world. Molecular biology and genetic engineering are powerful tools in the breeding of salt-tolerant crops. However, both approaches are slow, costly and they sometime fail to achieve the goal. Therefore, the cultivation of natural salt-tolerant plants as saline crops represents an easy and cheap solution for salt-affected areas [5,6].
Halophytes are plants that can maintain their biological activities and grow in salinity-affected soils [7]. One of the most popular effects of salinity is oxidative damage through the over generation of reactive oxygen species such as hydroxyl, superoxide and hydrogen peroxide [8]. Several morphological, physiological, biochemical and molecular changes have been observed to help halophytic plants to adapt to salinity [9,10,11,12]. These strategies depend on; maintaining the photosynthetic system through chlorophyll synthesis [13,14,15]; carotenoids enhancement or inhibition [16,17]; reactive oxygen species (ROS) production [8,18,19,20,21]; enzymatic antioxidant activation, such as superoxide dismutase (SOD) [20,22,23,24]; peroxidase [25] and Catalases [26,27]; non-enzymatic antioxidant synthesis, such as phenolic compound [28,29,30,31,32] and Flavonoids and [33]; osmoregulatory and compatible solutes synthesis [34], such as proline [35].
Amaranthaceae is a family of angiosperms which comprises about 165 genera and 2040 species [36] with a high number of xerohalophytes and halophytes around the world [37,38,39], 34 halophytic taxa are belonging to the family Chenopodiaceae/Amaranthaceae with a percentage of 22.08% of all halophytic angiosperms [40]. Among these taxa, Arthrocnemum macrostachyum, Sarcocornia fruticosa and Salicornia europaea are three halophytic plants distribute in the Mediterranean region [41]. Arthrocnemum macrostachyum is a perennial small shrub, erect to ascending stem, woody old stem and fleshy young stem, 30–40 cm in tall, like spike inflorescence, and papillose seeds. Sarcocornia fruticosa is a perennial sub shrub, erect to ascending stem, 20–80 cm in tall, and grey seeds covered with conical protuberances. Salicornia europaea is an erect annual herb with a cup-shaped branched stem, seed with conical protuberances [42]. These plants are considered cash crops due to their nutritional value and ecological importance in the phytoremediation of metals [43,44,45].
Fully understanding of salt tolerance mechanisms represents principle means in the management of the saline area and breeding of salt-tolerant cash crops [46,47]. Salt tolerance level is species-specific and the plant habitat contributes to the degree of salt tolerance and strategy among populations of the same species [24,48]. Mohamed et al. [22,23] reported that the Egyptian population of Suaeda maritima (Chenopodiaceae) has more salt tolerance than the Japanese population. Therefore, Egyptian Chenopodiaceae represents a unique genetic resource for saline agriculture application. To obtain more in-depth knowledge about the salt tolerance strategies of Chenopodiaceae, we hypothesized that Egyptian populations have unique salt tolerance levels and habitat of Mediterranean Sea influences on salt tolerance strategies of different species in this family. Our work aims to explore the salt tolerance strategies of three Egyptian Chenopods (Currently belong to Amaranthaceae) namely: Arthrocnemum macrostachyum, Sarcocornia fruticosa and Salicornia europaea from Damietta coast, through studying the effect of salt stress (0–600 Mm NaCl) on the growth parameters, chlorophyll contents, phenolic compounds, flavonoids, proline, malondialdehyde (MDA), esterase and antioxidant enzymes (superoxide dismutase, catalase and peroxidase activities).

2. Results

2.1. Effect of Salinity on Na+, K+ and Ca2+ Contents

While, K+ content in the shoot system was slightly decreased at all saline concentrations except at 100 mM NaCl and the root system K+ content was increased at all salt concentrations. The Na+ and Ca2+ shoot and root contents were gradually increased by increasing salt concentrations in A. macrostachyum. In the case of S. europaea; shoot Na+ and Ca2+ were increased at all concentrations, while K+ content increased at 100 and 200 mM NaCl only. In the root system, Na+ content increased in all concentrations, Ca2+ increased at 600 mM NaCl, but K+ decreased at all concentrations. In S. fruticosa Na+, Ca2+ and K+ content decreased at all concentrations in the shoot system except at 600 mM NaCl, both Na+ and Ca2+ were increased with respect to control. On the other hand, root Na+ and Ca2+ contents increased with salinity and K+ increased only at 200 and 400 mM NaCl (Table 1).

2.2. Effect of Salinity on Growth Parameters

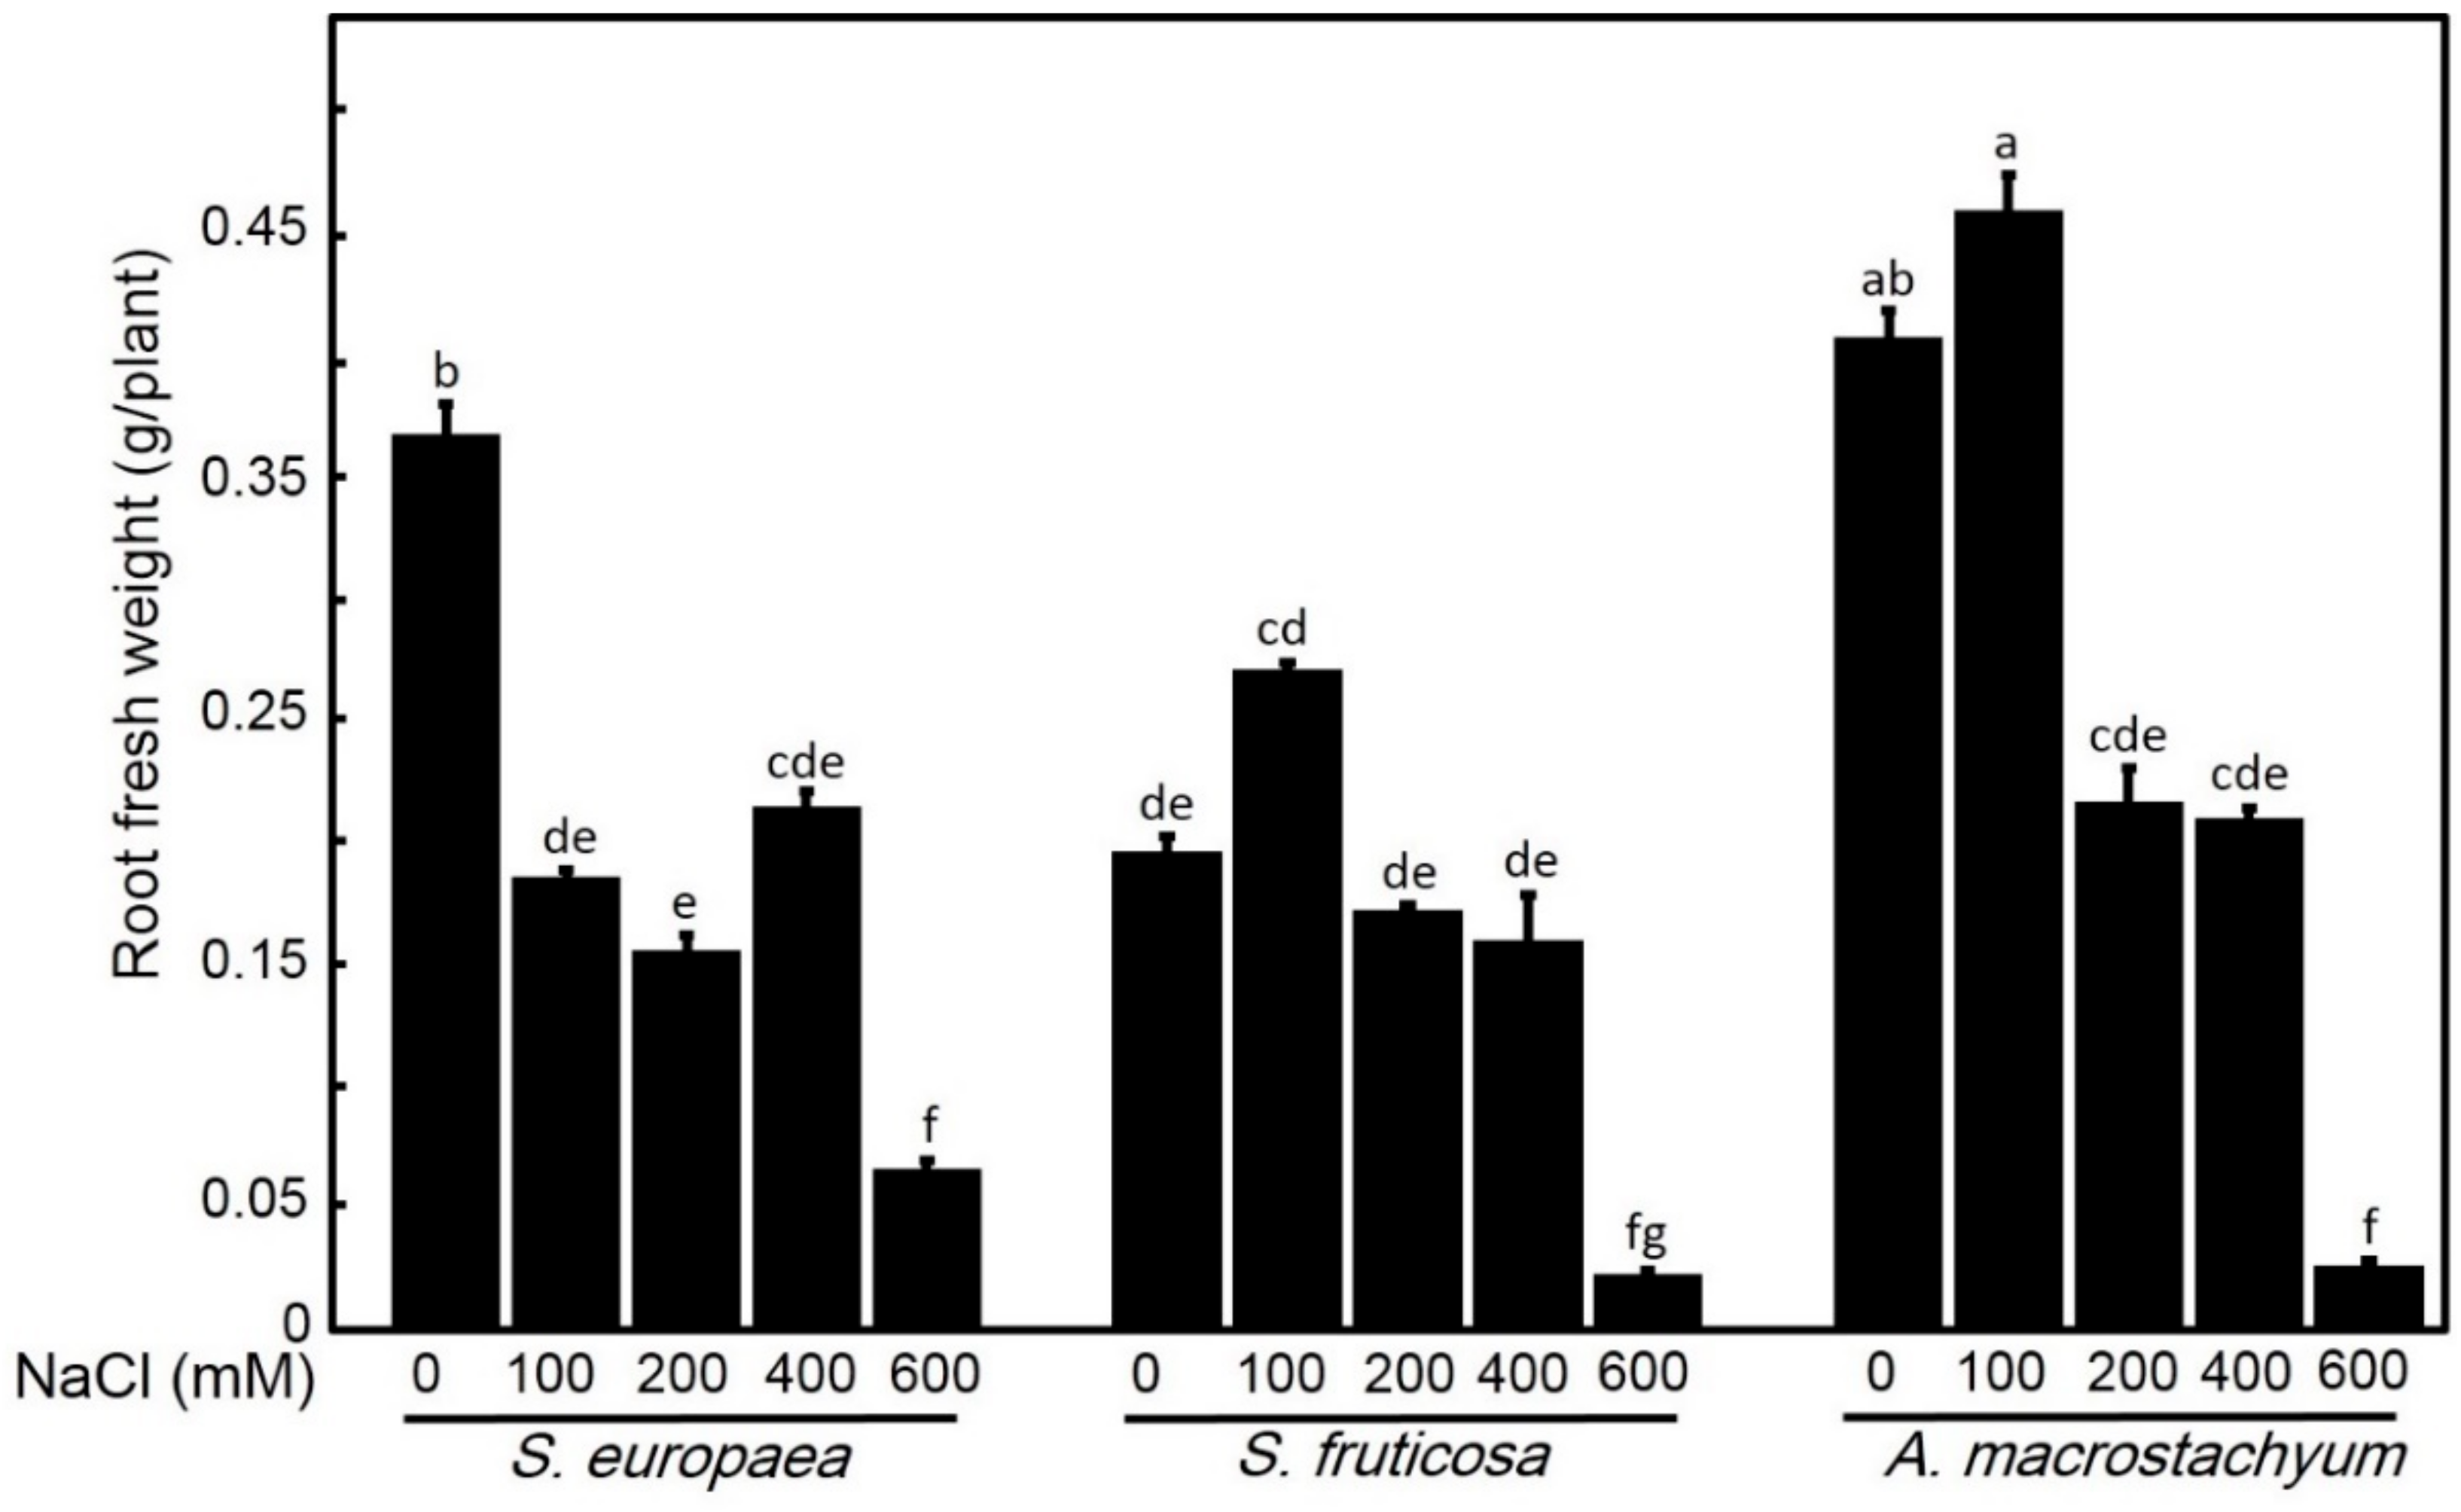
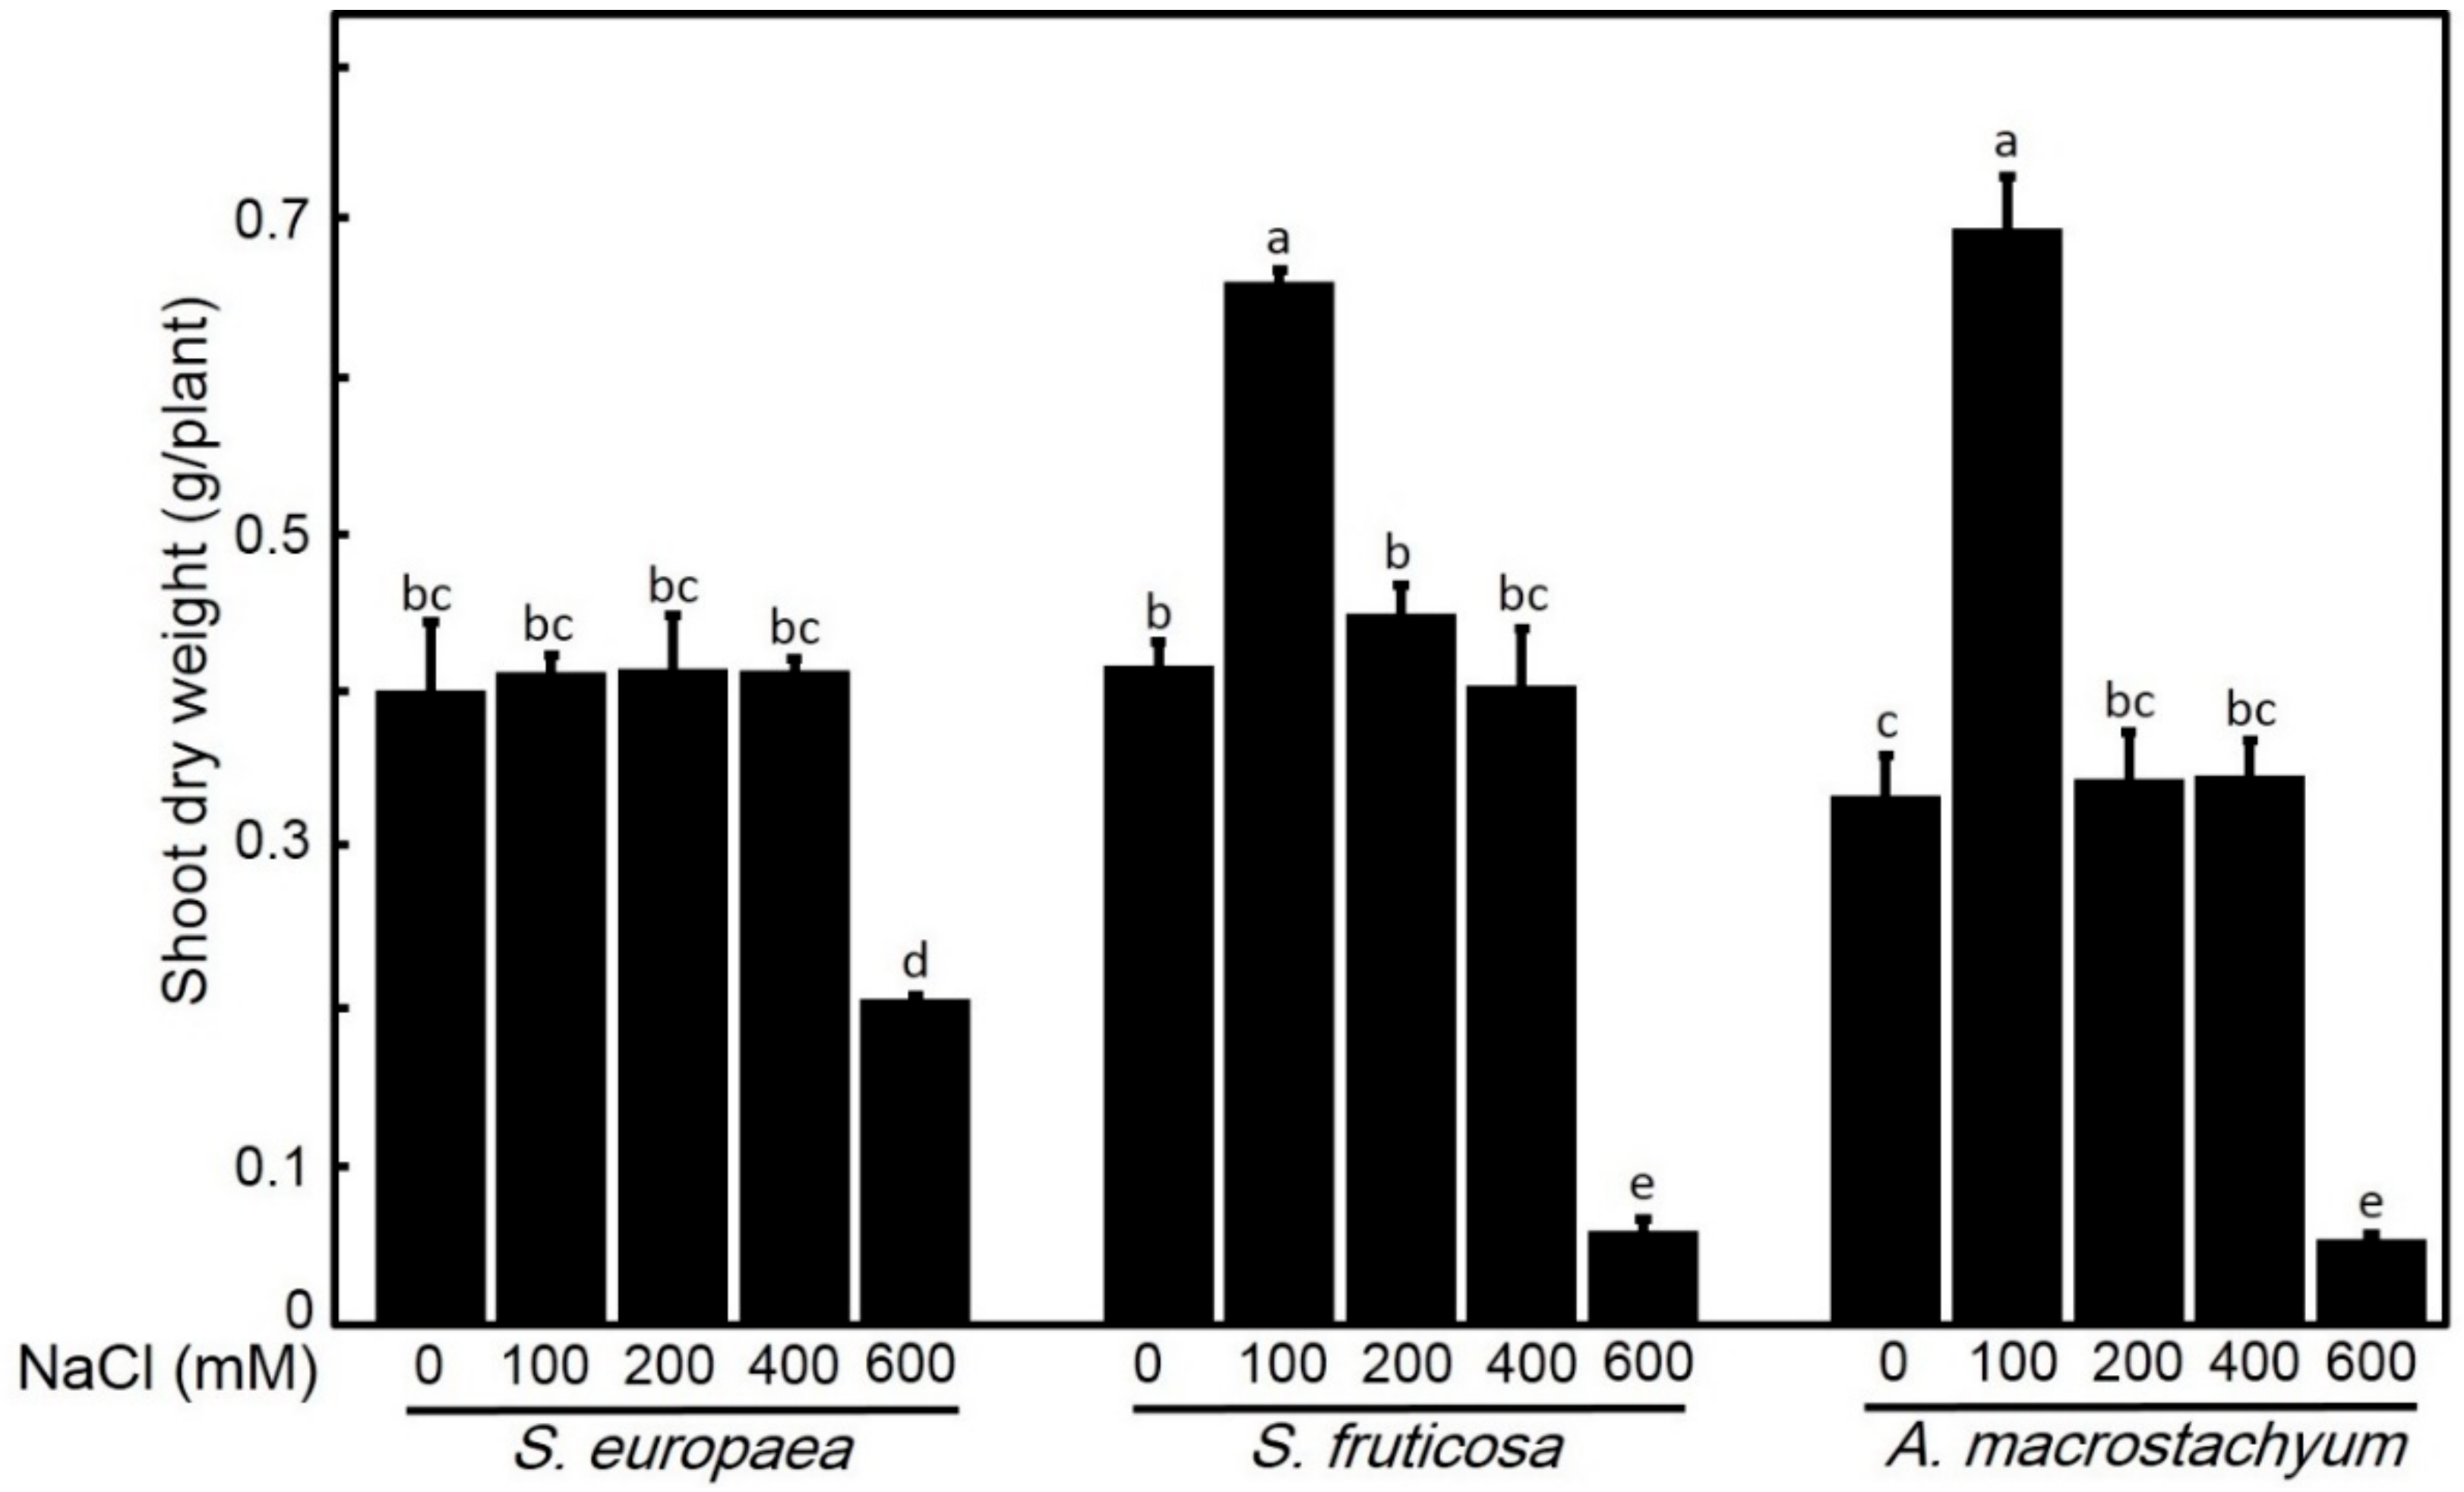
2.2.1. Effect of Salinity on Biomass Production

Two-way ANOVA analysis for studied plants showed significant effects for the plant and species, and their interactions (p < 0.001) for all parameters (Table 2). These interactions support the different responses of the species to salinity.
One-way ANOVA showed that each species has its response for different parameters at applied saline concentrations. A. macrostachyum and S. fruticosa showed highest shoot and root fresh and dry weights with significant increasing at 100 mM NaCl and slightly increasing at 200 and 400 mM NaCl. At 600 mM NaCl, both species showed significant decreases in these parameters. In contrast, S. europaea showed non-significant difference in shoot fresh and dry weights and root dry weight at low and moderate salt treatments, but root fresh weight showed a significant decrease at all treatments, and all parameters were highly decreased at 600 mM NaCl (Figure 1, Figure 2, Figure 3 and Figure 4).

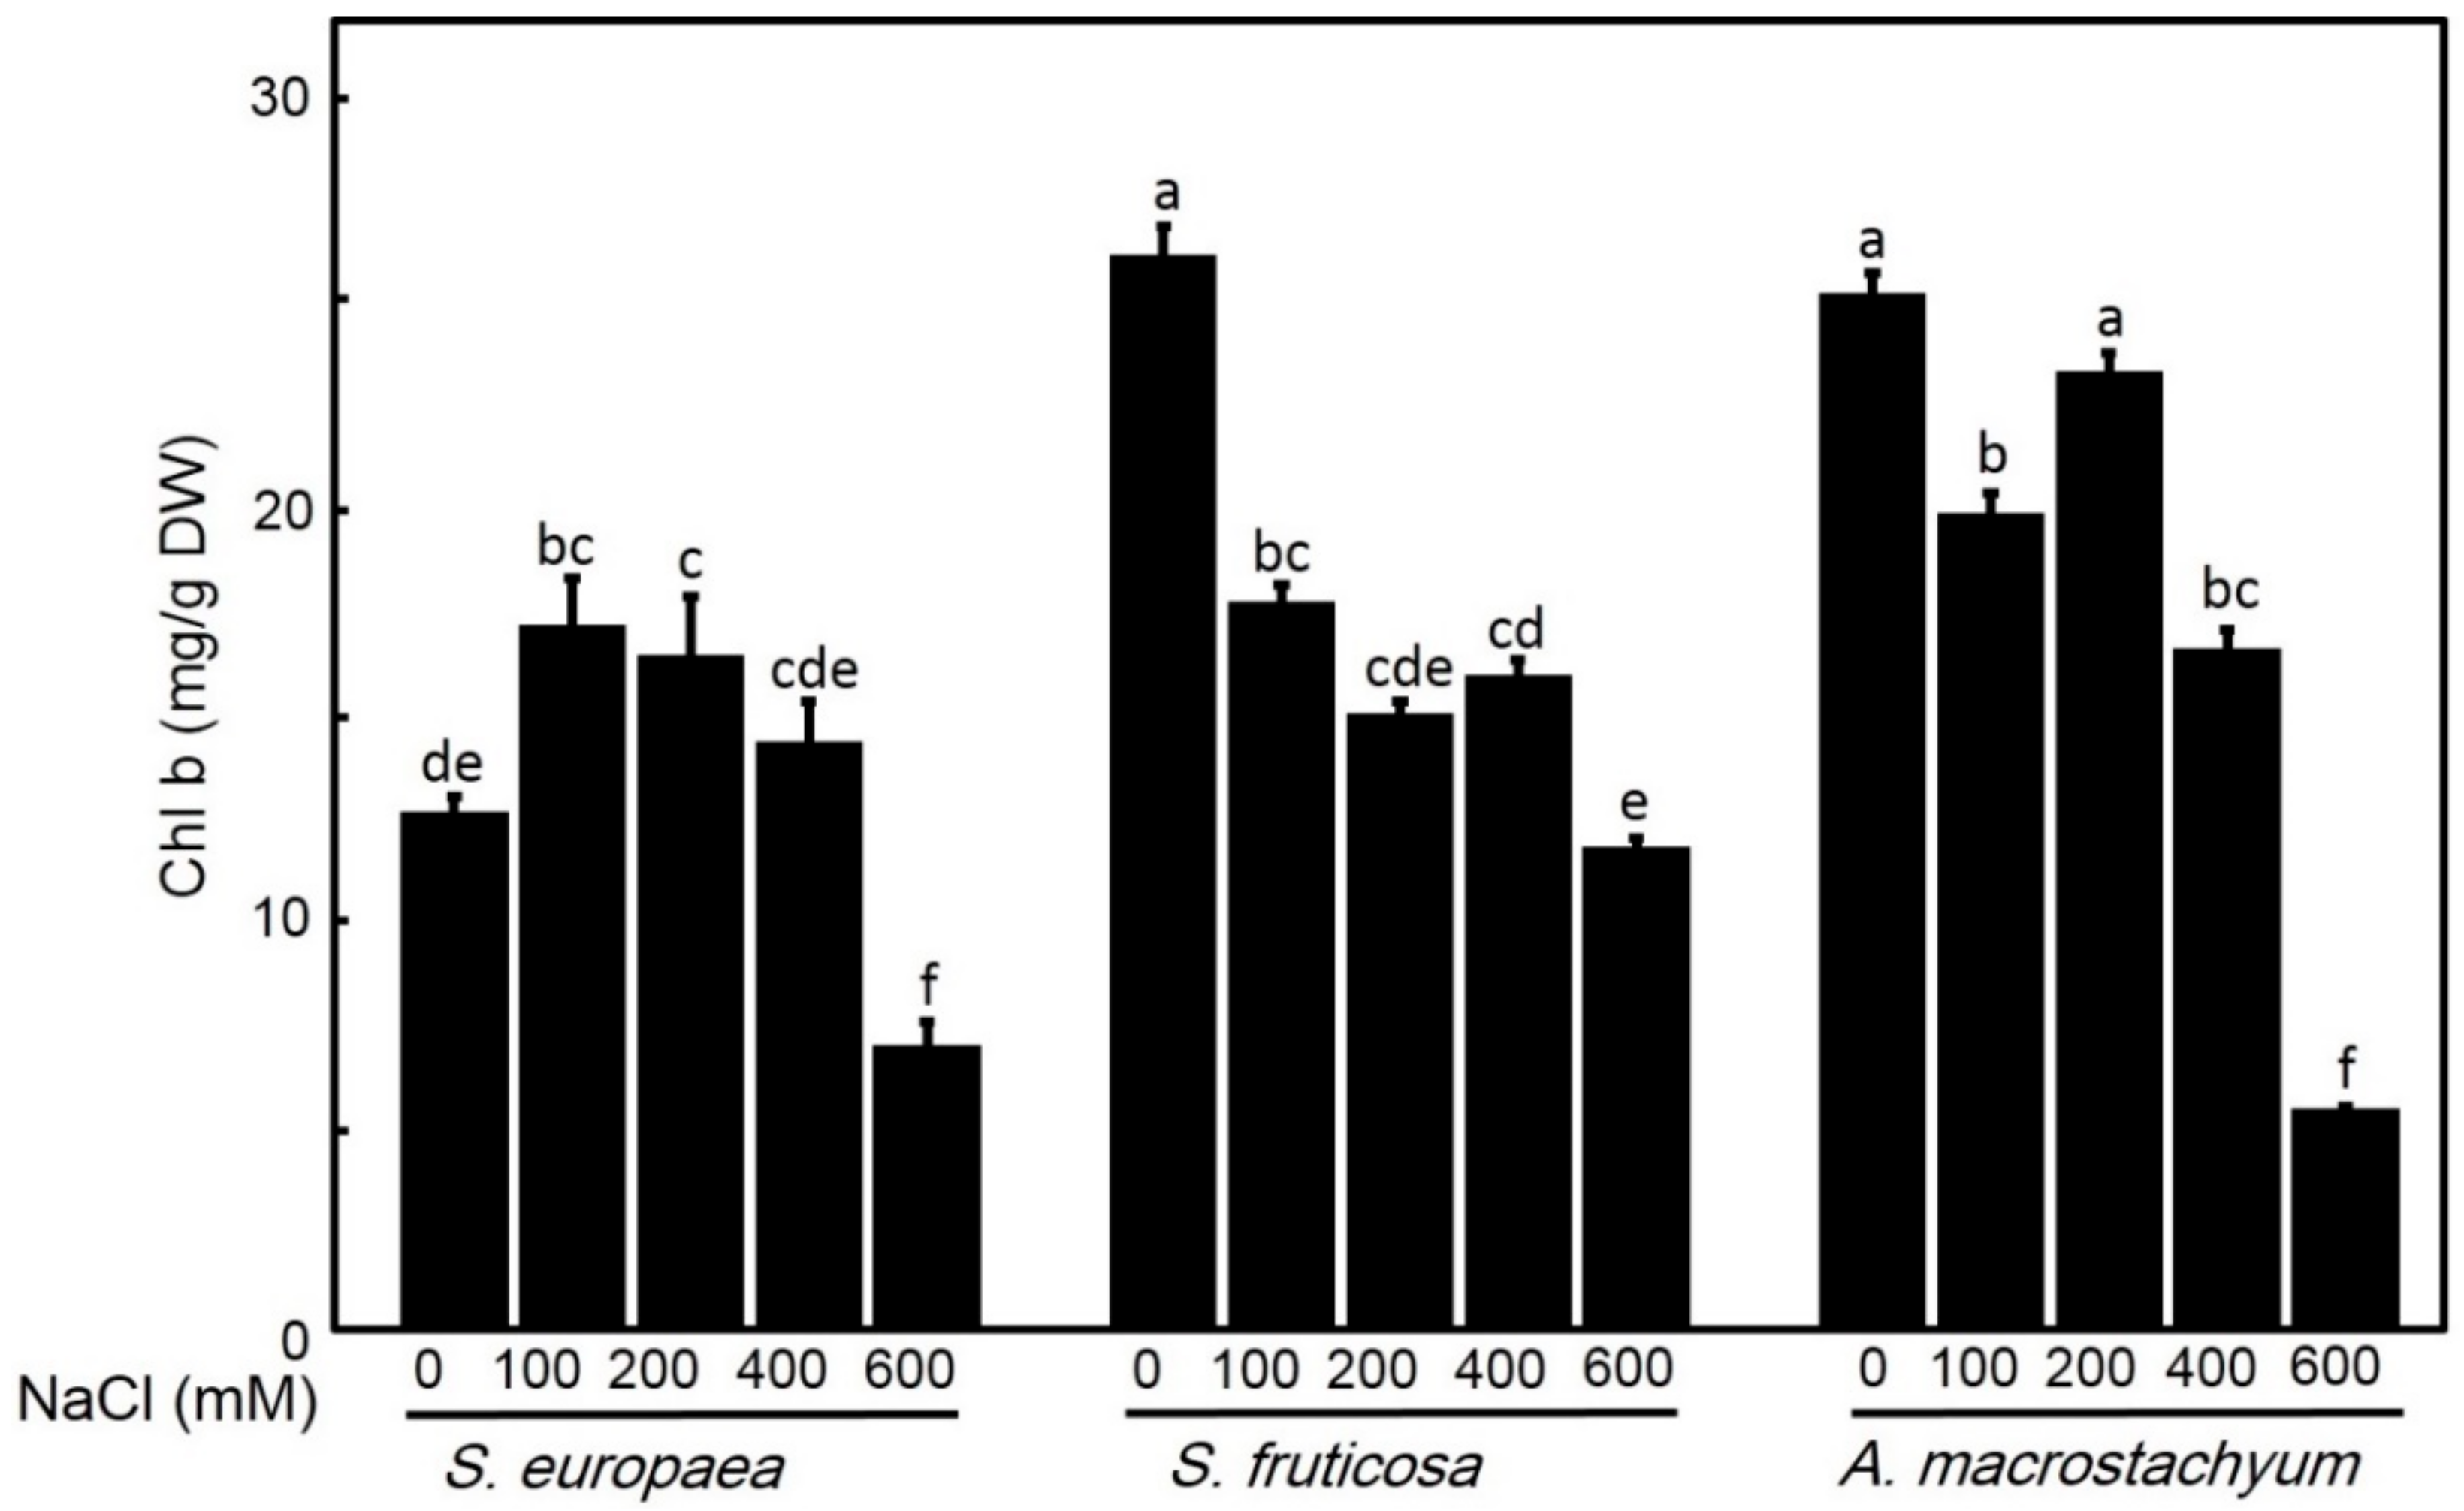
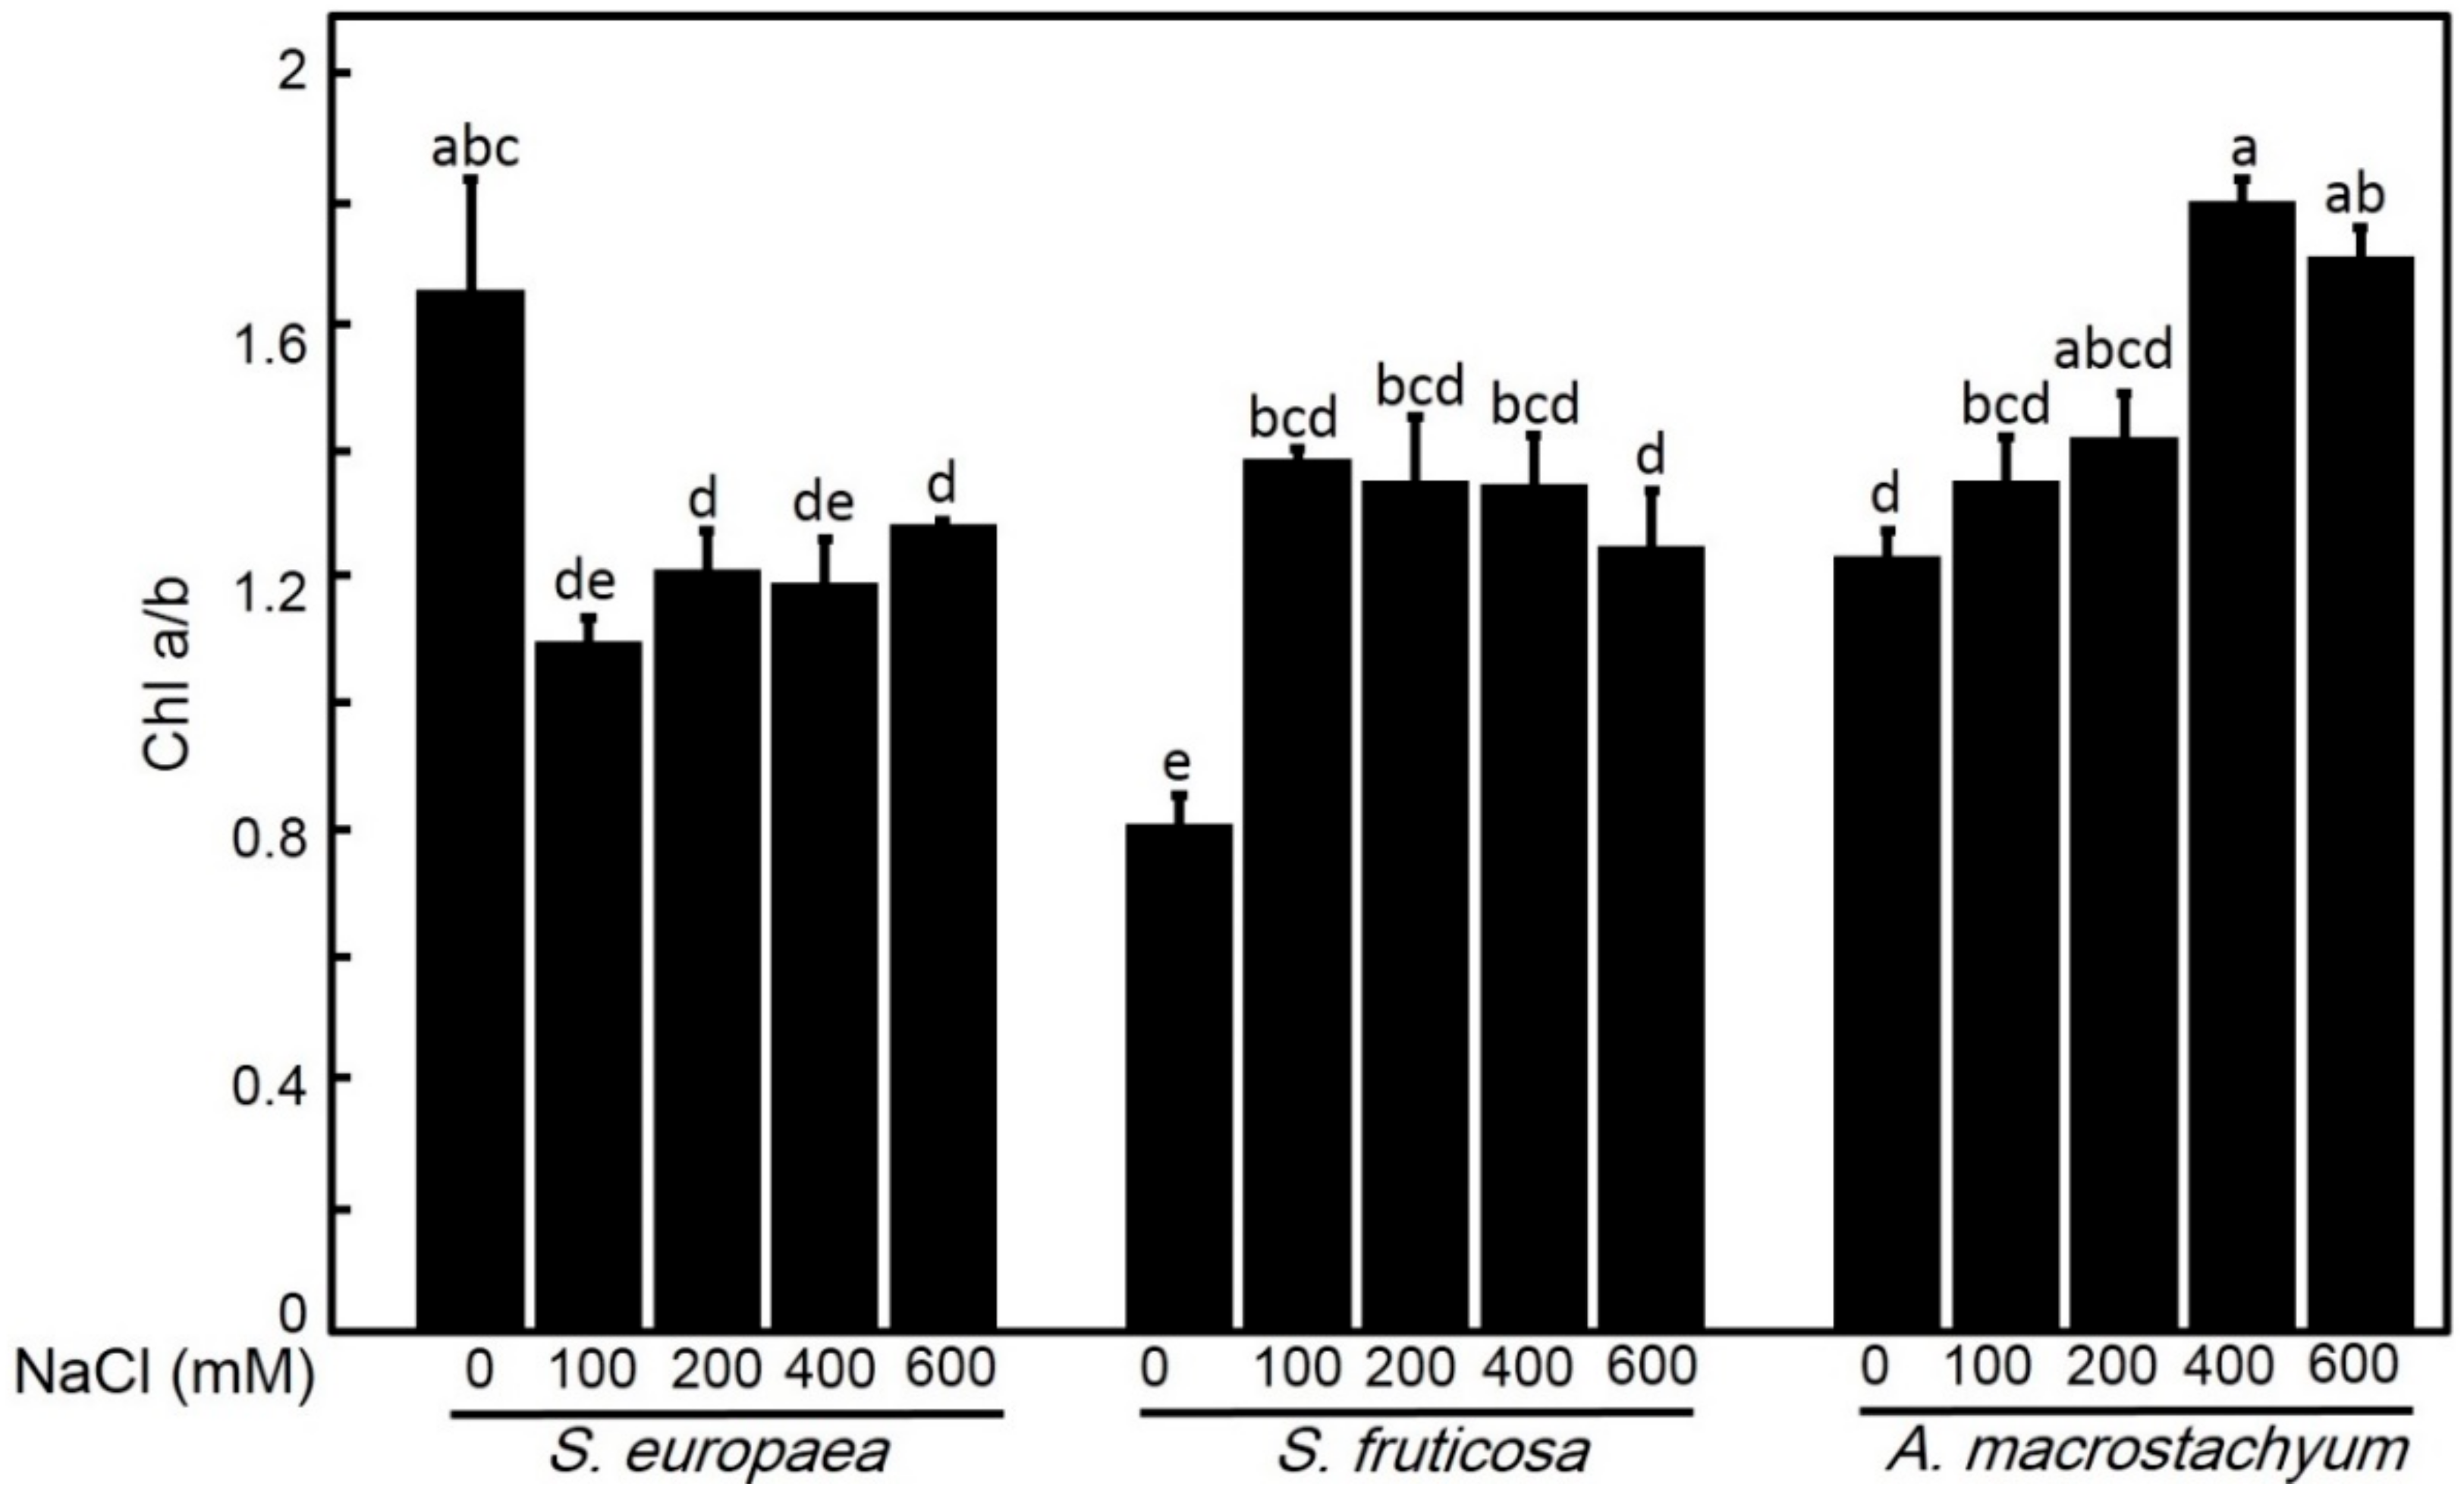
2.2.2. Effect of Salinity on Chlorophyll Contents

Chlorophyll contents showed different responses to salt treatments in all studied species (Figure 5 and Figure 6). Chlorophyll a contents showed non-significant differences in A. macrostachyum and S. fruticosa with slightly increasing at 200 mM NaCl in A. macrostachyum and at 100 mM in S. fruticosa, and it was significantly decreased at 600 mM NaCl in both species. In contrast, S. europaea showed slightly non-significant decreases at low and moderate treatments and significantly decreasing at higher concentrations. For chlorophyll b, while A. macrostachyum showed non-significant differences at low and moderate NaCl concentrations and significant decreases at 400 and 600 mM NaCl, S. fruticosa showed significant decreases at all salt treatments. In the case of S. europaea, chlorophyll b contents were significantly increased at low and moderate concentrations NaCl and significantly decreased at high NaCl concentrations. For chlorophyll a/b ratio, it was significantly increased at high salt concentrations in A. macrostachyum; and at all salt levels in S. fruticosa, and significantly decreased at all salt concentrations in S. europaea (Figure 7).

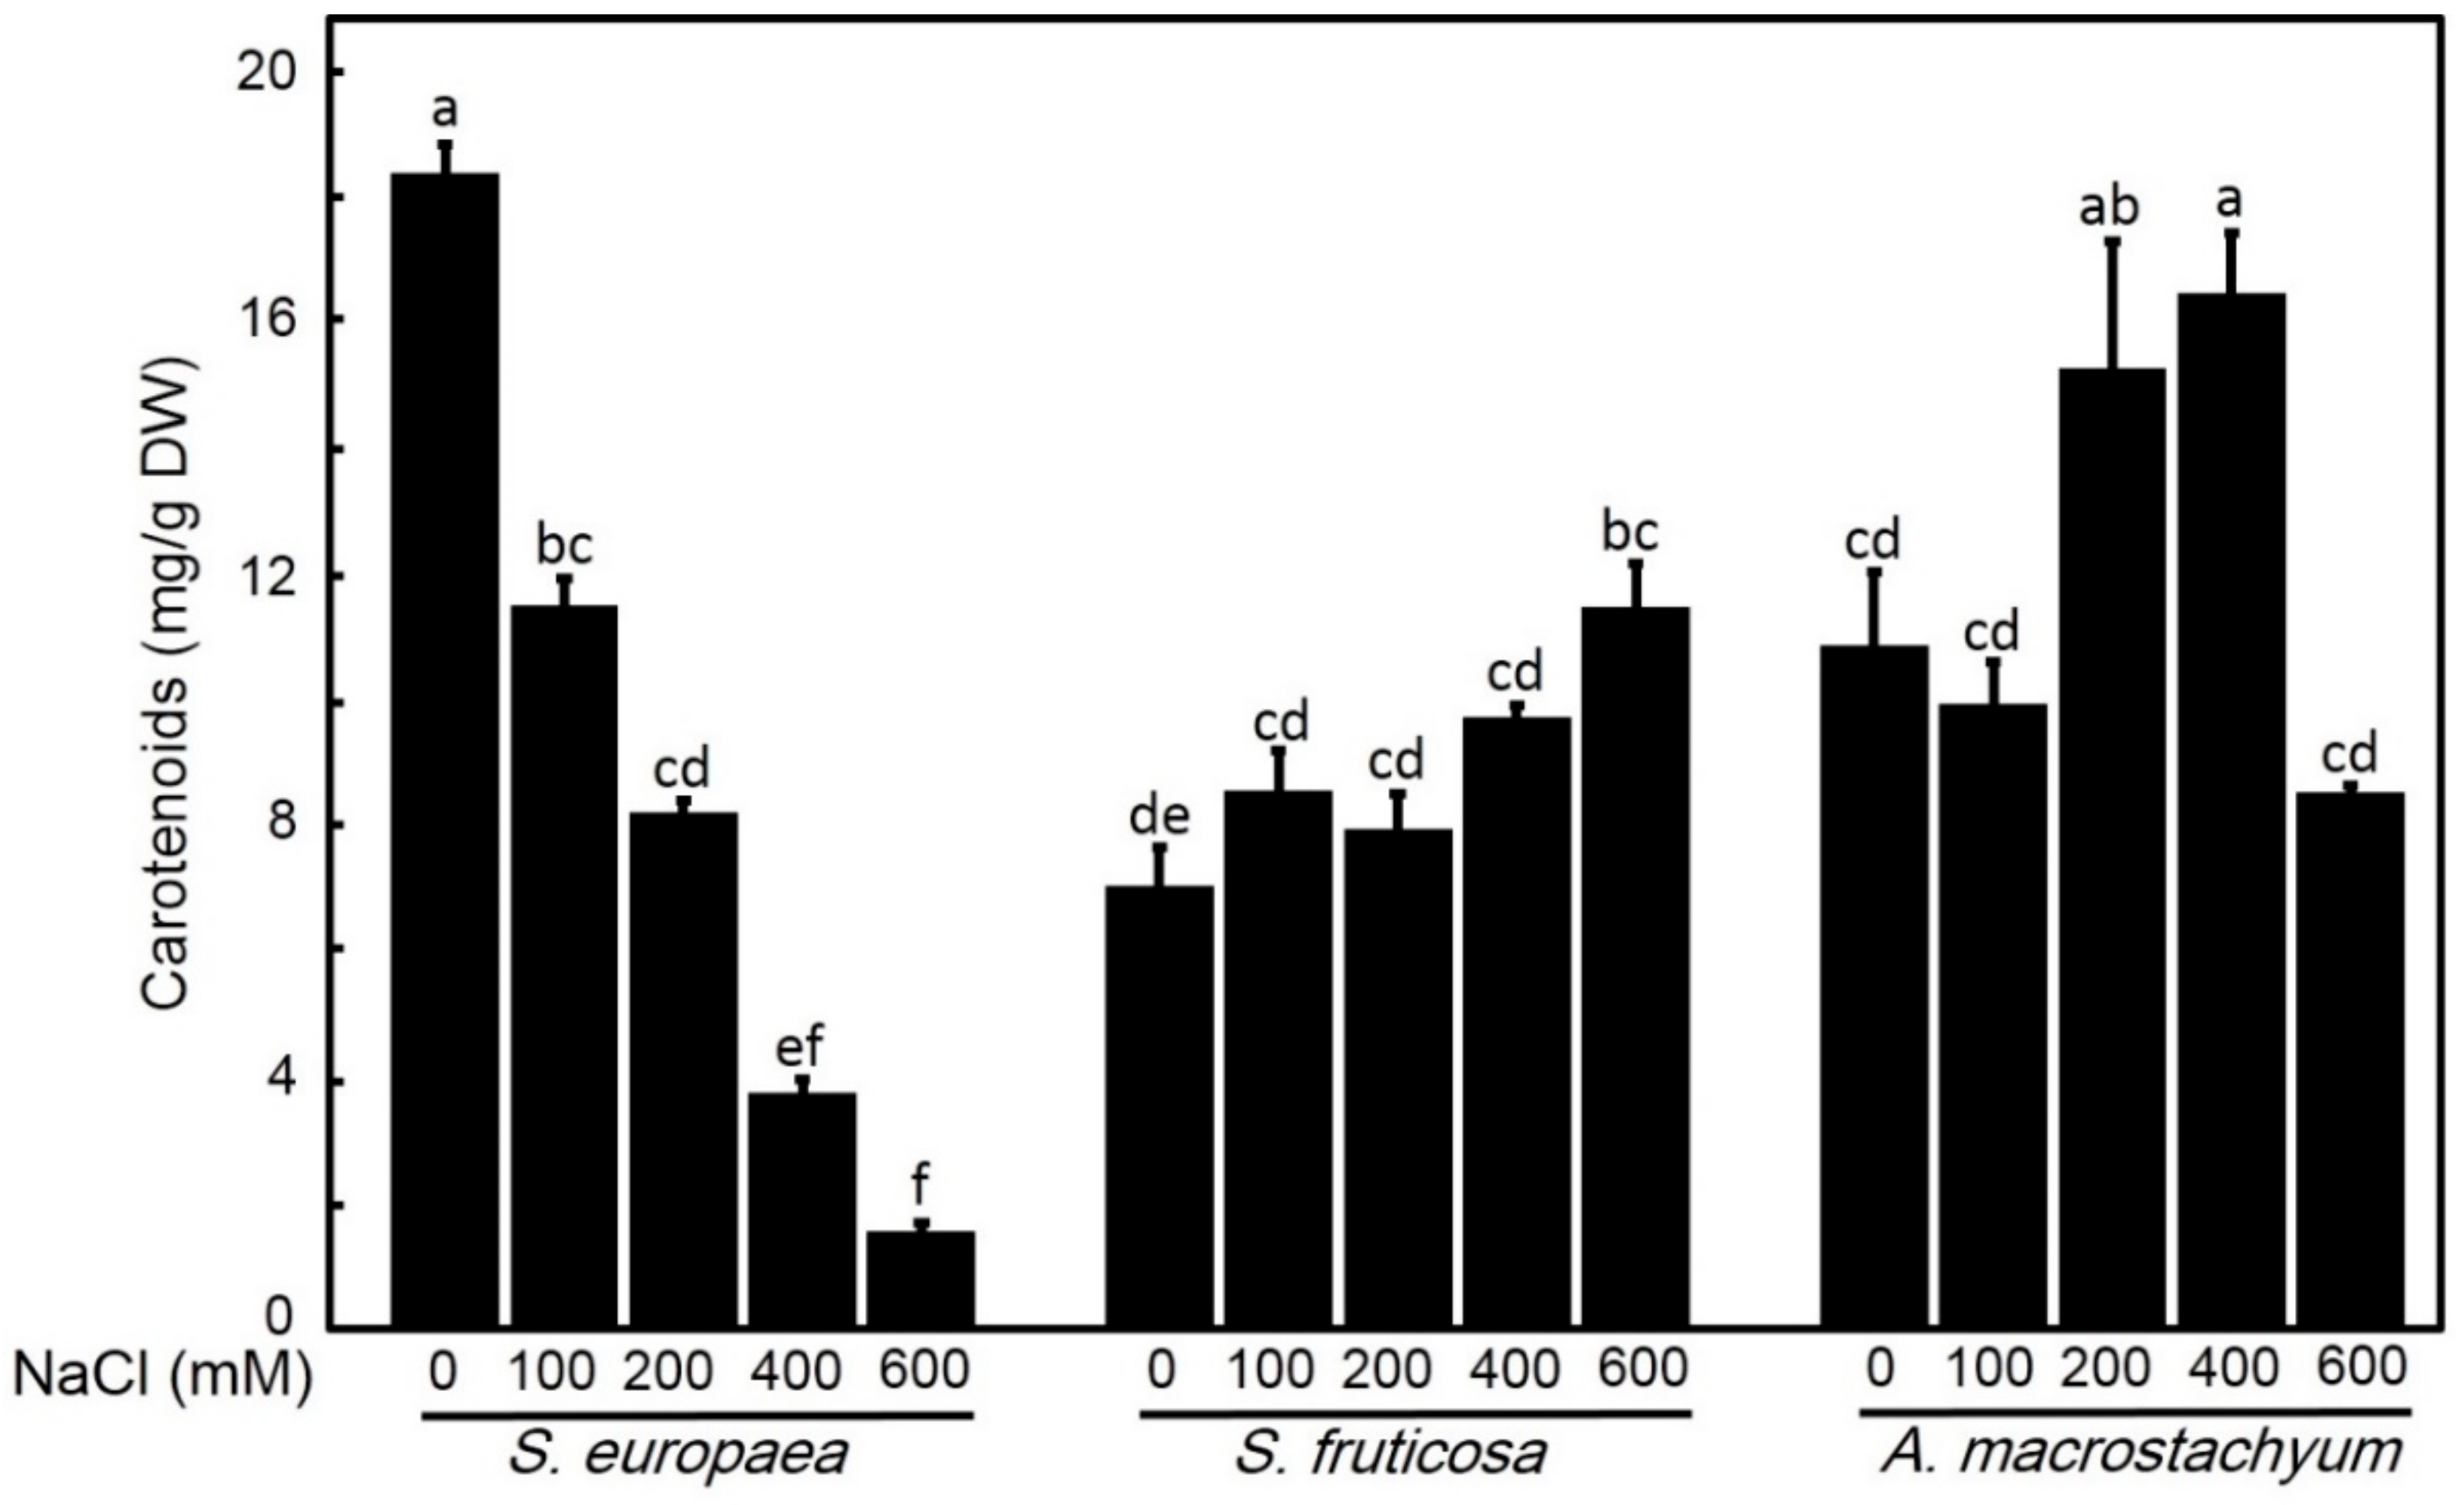
2.2.3. Effect of Salinity on Carotenoids

Carotenoids concentration showed significant increases with saline concentrations except at 100 and 600 mM NaCl which show non-significant differences in respect to control in A. macrostachyum while S. fruticosa showed non-significant increases under low and moderate salt concentrations, and a significant increase under high salt level. In contrast, S. europaea, showed significant decreases with increasing NaCl concentration (Figure 8).

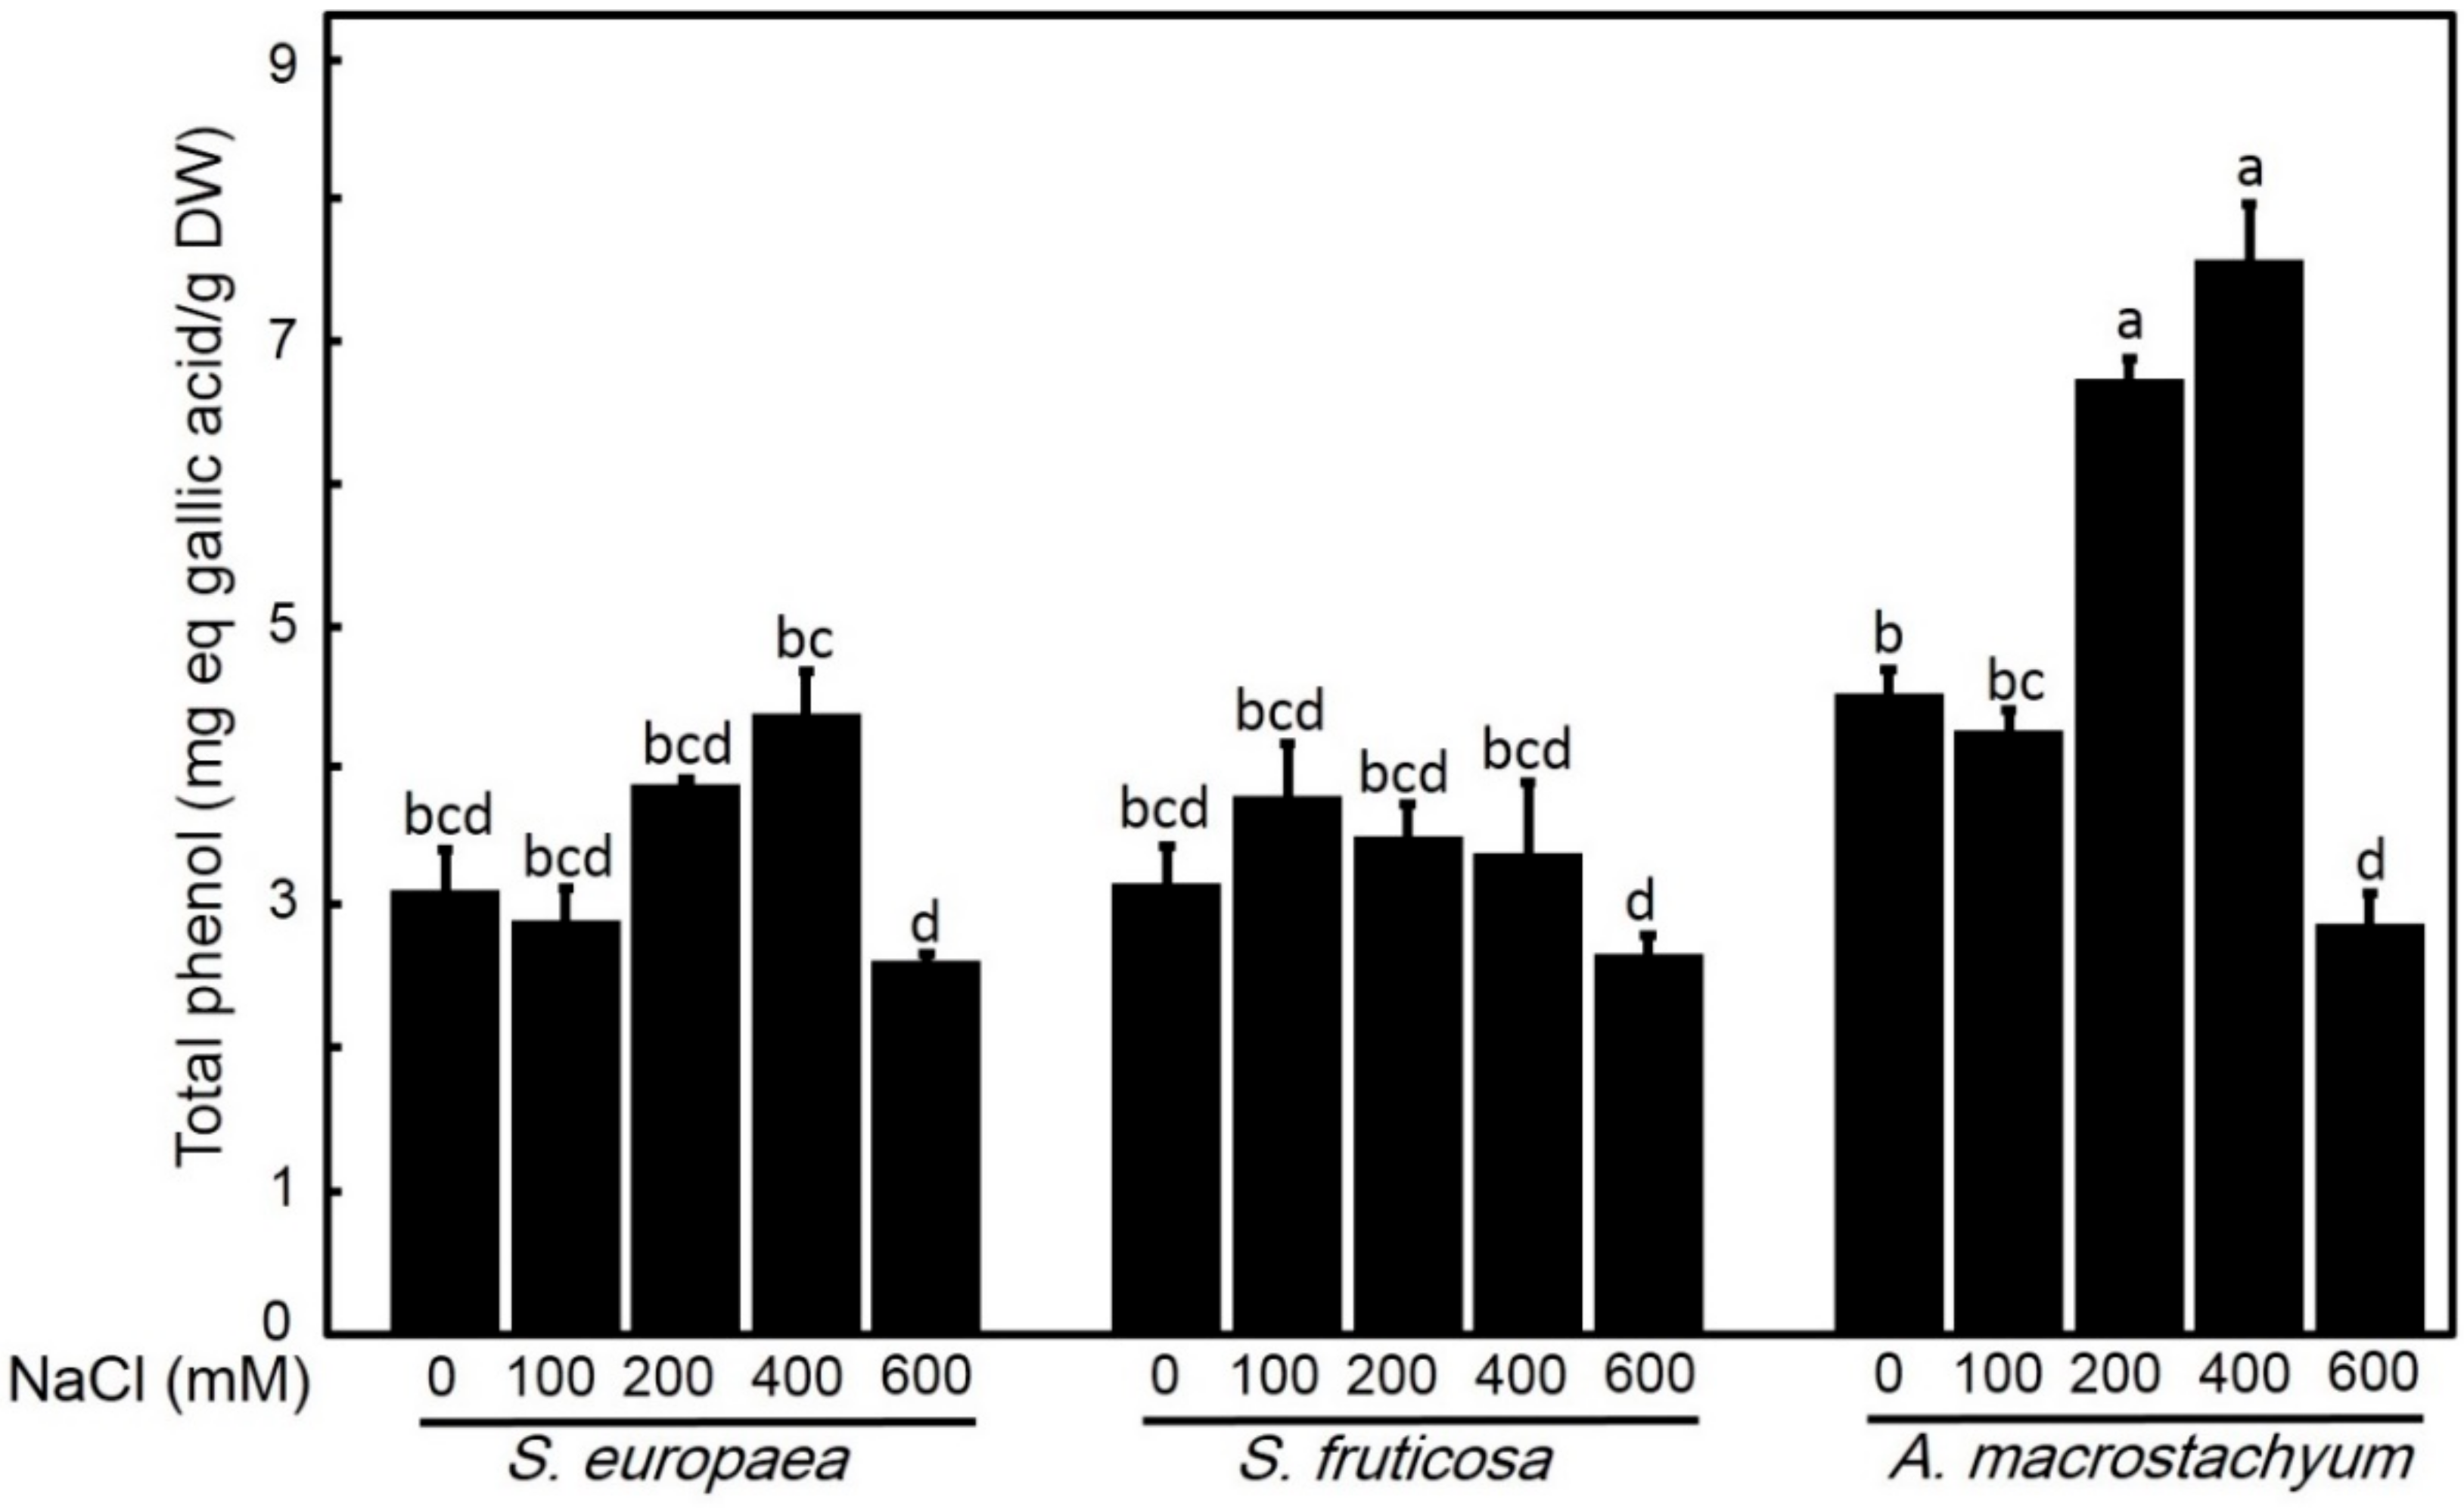
2.2.4. Effect of Salinity on Total Phenolic Contents

Phenolic compound contents in A. macrostachyum significantly increased at moderate and high salinity levels (200 and 400 mM NaCl) with a slightly non-significant difference at 100 mM NaCl. In S. fruticosa and S. europaea slightly non-significant increases in phenolic contents were recorded at all saline concentrations. Interestingly, the three species showed significant decreases at 600 mM NaCl (Figure 9).

2.2.5. Effect of Salinity on Flavonoid Contents

A. macrostachyum showed significant increases in flavonoid contents at all treatments but significantly decreased at 100 and 600 mM NaCl. In contrast, S. fruticosa and S. europaea showed significant decreases in flavonoid contents with a slightly non-significant difference at 600 mM NaCl in S. fruticosa (Figure 10).

2.2.6. Effect of Salinity on Total Malondialdehyde (MDA) Content

A. macrostachyum and S. fruticosa showed significant increases in MDA concentrations in all treatments except at 600 mM NaCl, which observed a non-significant difference compared to control. S. europaea showed significant decreases at all salt concentrations except at 100 mM NaCl, which showed a non-significant difference in respect to control (Figure 11).

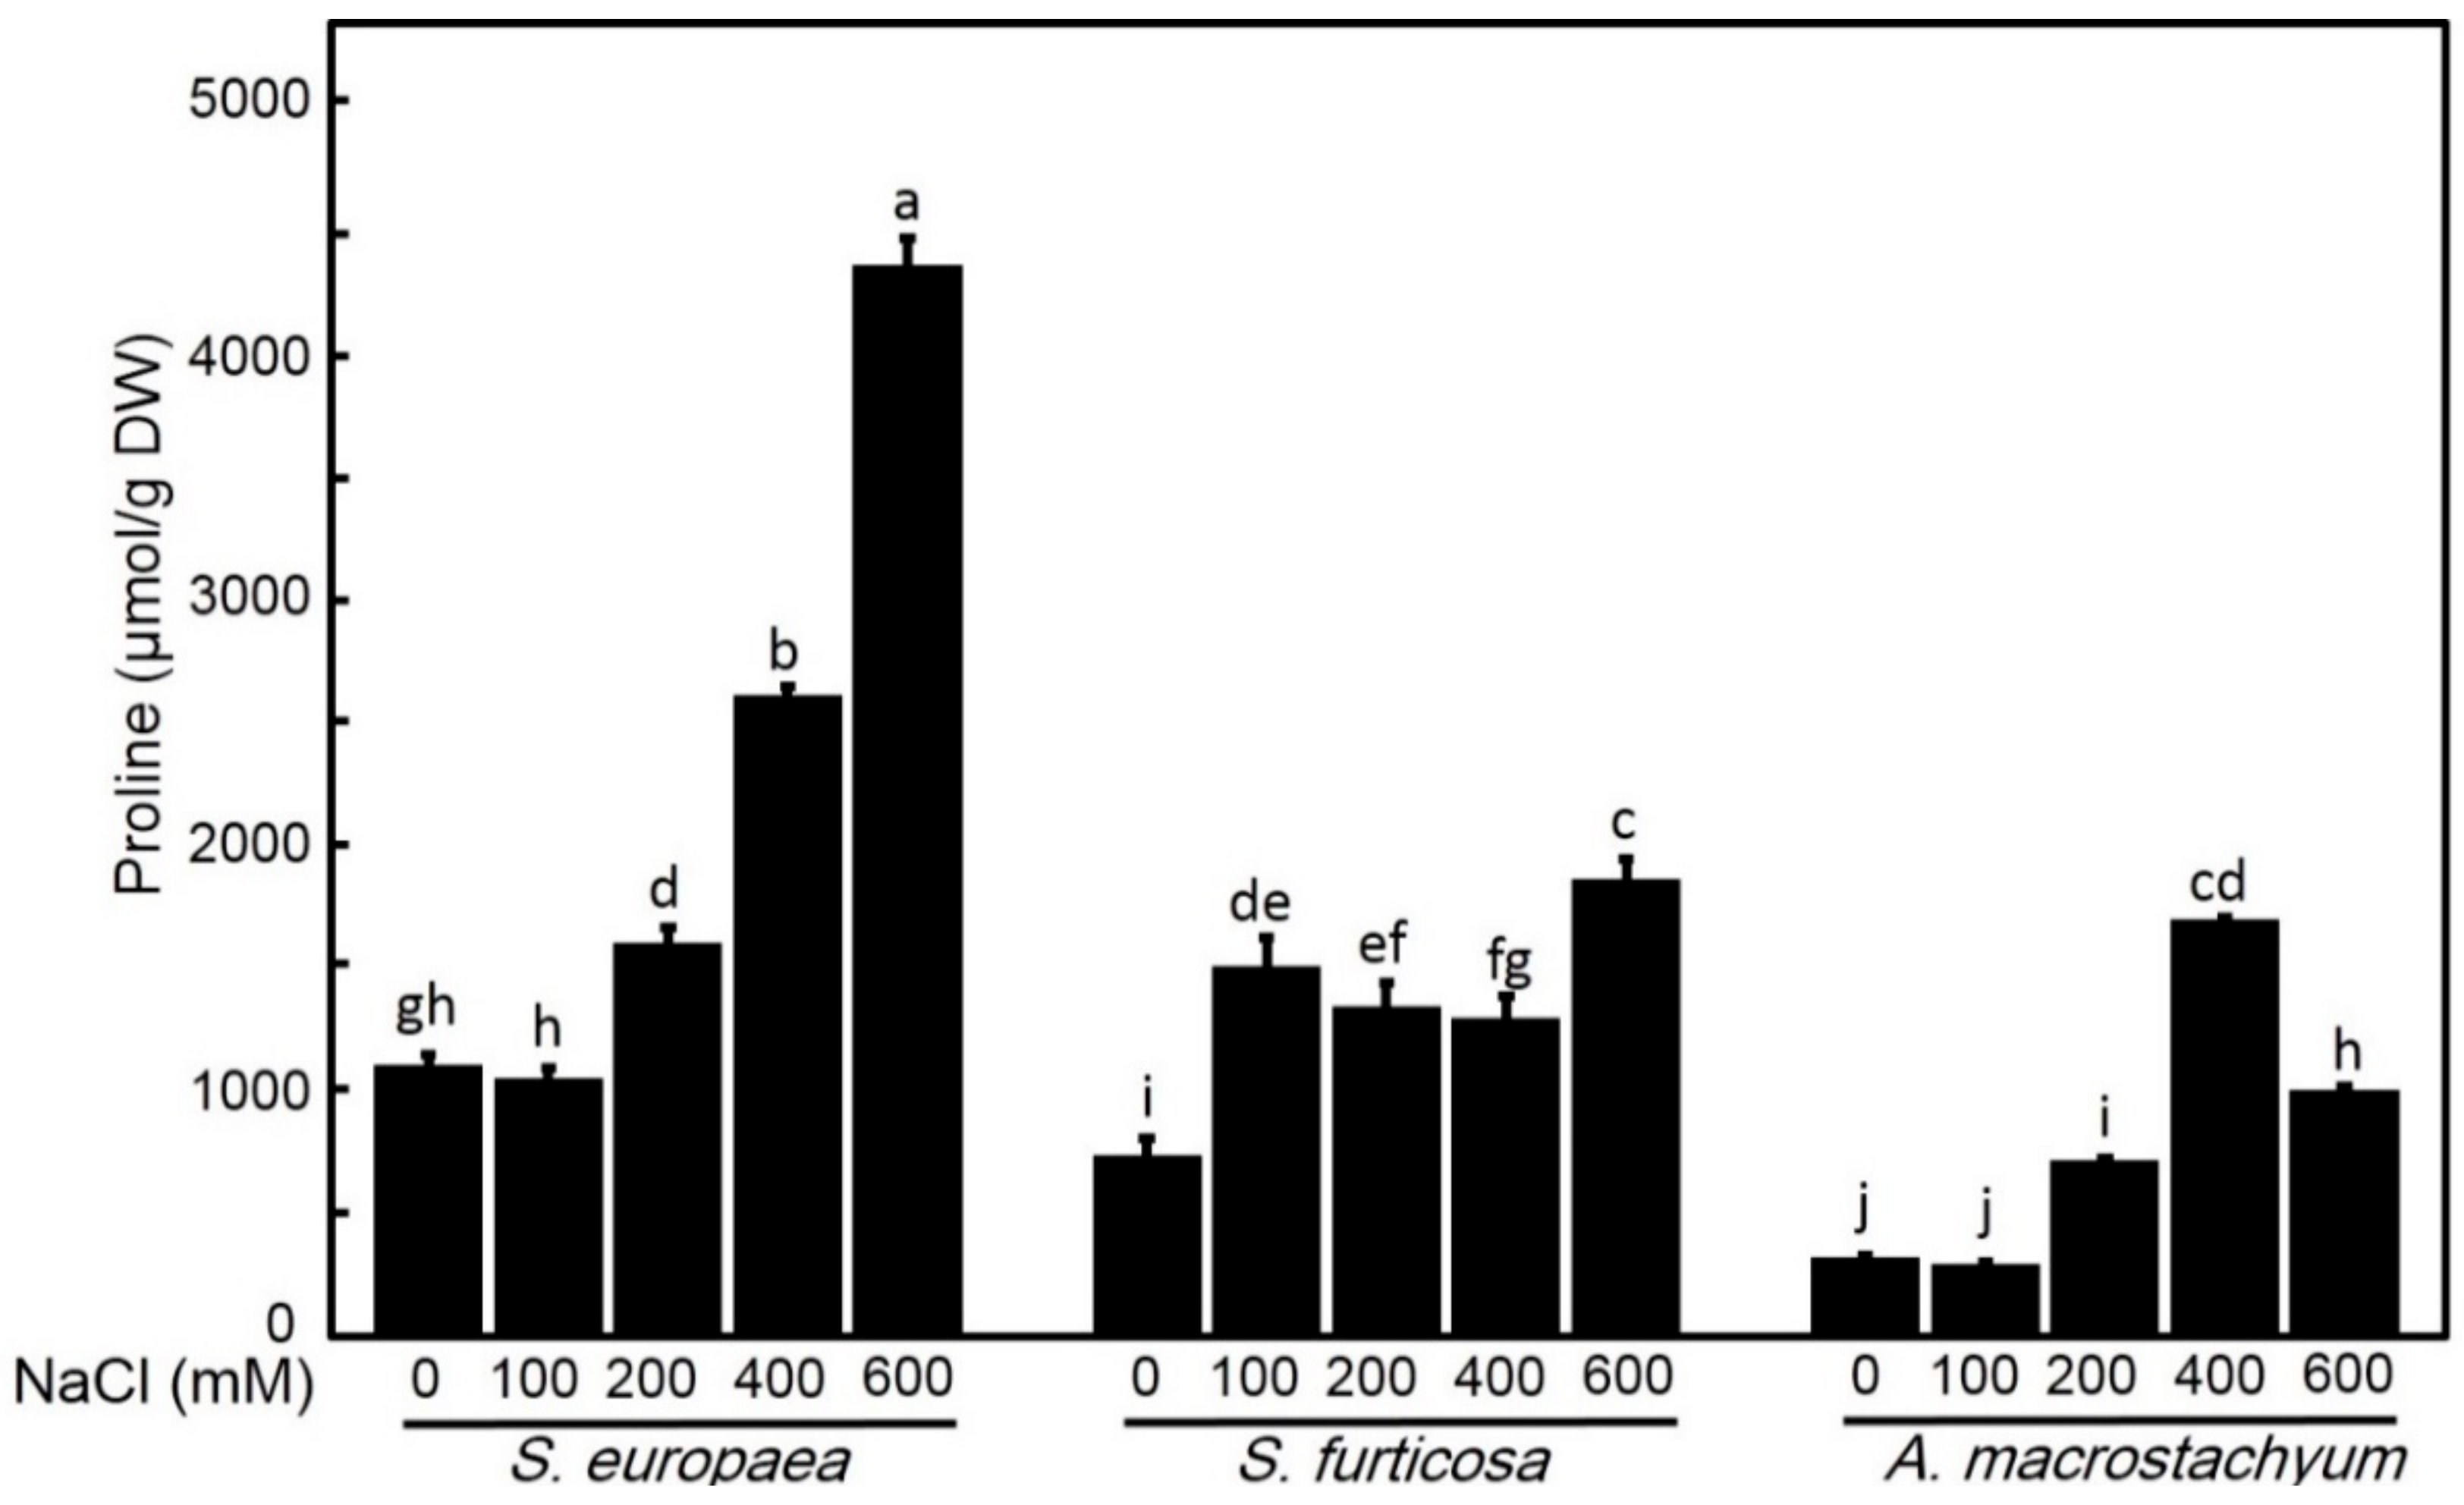
2.2.7. Effect of Salinity on Proline Content

While S. fruticosa showed significant increases in proline content with increasing salt concentrations, Proline content in A. macrostachyum and S. europaea were significantly increased at 200, 400 and 600 mM NaCl only, and higher values of proline in S. europaea were recorded at 600 mM NaCl in respect to the other two species (Figure 12).

2.3. Isozymes Analysis
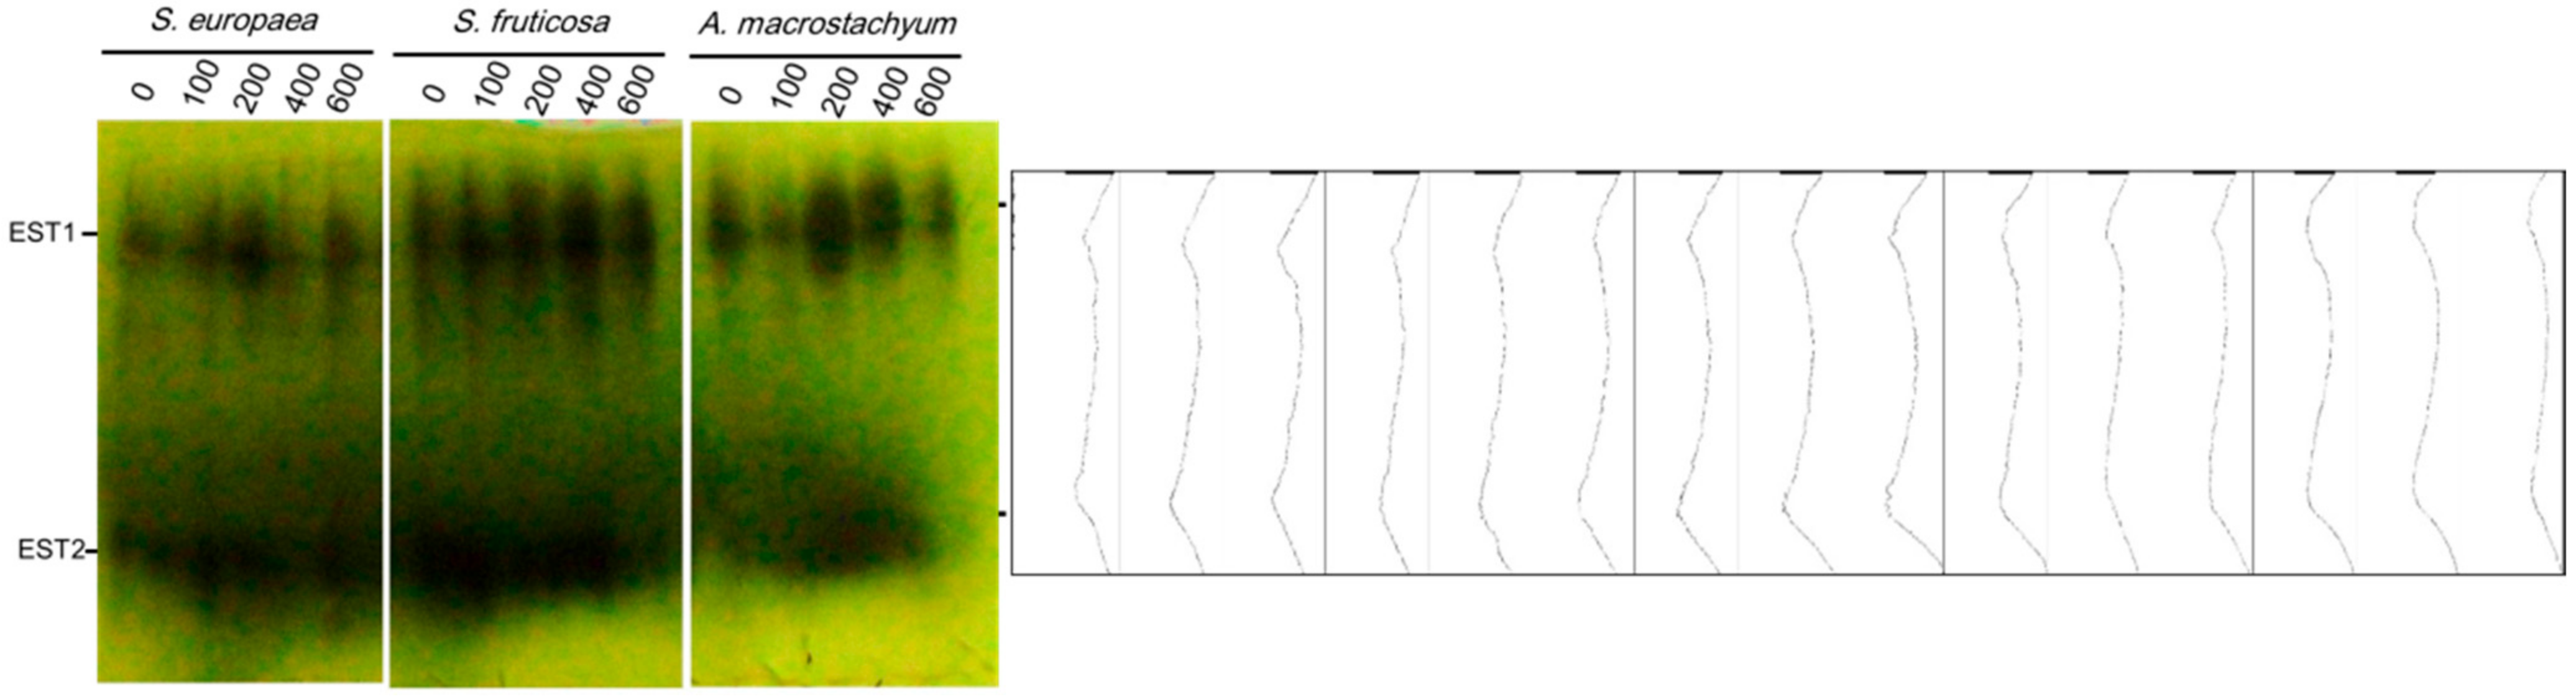
2.3.1. Esterases

The electrophoretic analysis using native PAGE showed two esterase loci in all studied species and under all treatments with different amounts and intensities. The highest intensities were observed in A. macrostachyum and S. fruticosa at 200 and 400 mM NaCl and 100 and 200 mM NaCl in S. europaea (Figure 13).

2.3.2. SOD Isozymes

SOD activity was increased at high salt levels in A. macrostachyum and S. europaea, and under low and moderate salinity in S. fruticosa (Supplementary S1).

2.3.3. POD Isozymes

POD enzyme showed a unique locus in all studied plants and at all treatments. The highest intensities were recorded at 100 and 600 mM NaCl in A. macrostachyum, and at 200 mM NaCl in S. europaea which showed the highest POD activity in respect to the other two species. On the other hand, weak activity was observed at all treatments in S. fruticosa (Figure 14).
Pearson correlation and principal component analysis.
For Salicornia europaea, growth parameters have positive correlations under salinity with Chl a, Chl b, and carotenoids, and negatively correlated with proline content (Table S1). In the same context, under 100 mM saline treatment, principal component analysis showed PC1 and PC2 described 50.9%, and 25.9% of the variance, respectively (Figure 15). Three groups were observed from this analysis; Growth parameters (shoot fresh weight, shoot dry weight. root fresh weight and root dry weight), Chl a, Chl b and carotenoids constructed the first group, Flavonoids, Chl a/b, MDA formed the second group, and both proline and phenolic compound represented the third group. For Sarcocornia fruticosa, growth parameters were positively correlated with Chl a, Chl b and Chl a/b but negatively correlated with carotenoids, MDA, phenolic compounds and flavonoids (Table S1). In contrast, PC1 and PC2 explained 64%, and 17.5% of the variance, respectively. Three groups were also visualized from this analysis; Growth parameters, Chl a, Chl a/b, MDA and proline formed the first group, Chl b and flavonoids represented the second group, and phenolics represented the third group. For Arthrocnemum macrostachyum, Our results showed significant negative correlations between most growth parameters with carotenoids, proline, flavonoids and phenolic compounds, Chl a/b and MDA, but positively correlated with Chl b (Table S1). On the other hand, Principal component analysis showed PC1 and PC2 described 58%, and 19.1% of the variance, respectively. Three groups were also noticed from PCA analysis; Growth parameters, carotenoids, phenolic compounds, Chl a/b and MDA formed the first group, Chl a, Chl b and flavonoids constructed the second group, and proline formed the third group.

3. Discussion

Exploration of salt tolerance mechanisms of many halophytes species is of considerable value for the selection of suitable crops for saline agriculture. In this study, three halophytic species Arthrocnemum macrostachyum, Sarcocornia fruticosa and Salicornia europaea (Amaranthaceae/Chenopodiaceae) were collected from the same saline habitat and tested for their tolerances to salinity.
For growth criteria, A. macrostachyum and S. fruticosa improved their fresh and dry weight when grown under low and moderate salt concentrations, but their fresh weights were reduced at high salinity. A. macrostachyum had the optimum growth at 400 mM NaCl and its growth decreased at 600–1000 mM NaCl [49]. The same induction trend of growth under moderate salinity (170–510 mM NaCl) was observed in A. macrostachyum and S. fruticosa from Spain, with a decline trend under high salt conditions [14,50]. Also, García-Caparrós et al. [51] reported that total dry weight and relative growth rate of S. fruticosa decreased significantly under low and moderate salinity (100 and 200 mM NaCl) for 60 days. Therefore, our results suggest that Egyptian A. Macrostachyum and S. fruticosa need low salt levels for optimal growth, and they could maintain their growth under moderate and high salinity (200 and 400 Mm NaCl). The variation in salt tolerances of both plants in the previous studies might be because of the maternal habitats of these populations. Mohamed et al. [24] reported that maternal salinity plays important role in salt tolerance during the growth of Zygophyllum ccocenium.
On the other hand, S. europaea showed significant decreases in shoot fresh and dry weights at high salinity levels but slightly non-significant variation under moderate salinity. Ungar et al. [52] reported that S. europaea growth was increased under moderate salinity (170–510 mM NaCl). In contrast, S. rubra had the optimal growth in the absence of salt to 200 mM NaCl while its growth was inhibited with further increase of salt level. The decline of root biomass under moderate salinity suggests the severe effect of salinity on the root system than shoot and the adaptive strategy to avoid more uptakes of toxic ions [53].
Inorganic ions play role in maintain osmotic and turgor pressure in halophytes more than glycophytes, which predominantly depend on the increased synthesis of de novo compatible solutes [54]. Flowers et al. [55] reported that the Na+ is one of the most important ions which play important role in adjusting cellular osmotic potential. Our results showed that A. macrostachyum and S. europaea Na+ contents increased with increasing external NaCl concentrations while Na+ content in S. fruticosa was only increased under high salinity. This increase in Na+ has a role in maintain shoot osmotic and turgor. Redondo-Gomez et al. [14] and Khan et al. [56] reported increasing Na+ content with increasing external NaCl concentrations in A. macrostachyum because halophytes have a unique ability for osmotic adjustment due to accumulation of Na+ in vacuoles, and K+ and organic solutes in the cytosol [57,58]. The stimulation of K+ in halophytes root under saline conditions is well documented in many plants, such as Suaeda monoica and Triglochin maritima [59]. In the present study, while K+ ions in roots were increased with increasing salinity in A. macrostachyum and S. fruticosa and declined in S. europaea, Shoot K+ ions increased at low concentration and decreased at high and moderate concentrations. These results suggest that K+ content can be used as a marker for discrimination between salt tolerance strategies in halophytes [58]. In the same context, Ca2+ increased with salinity, This increase is due to its vital role in salt adaptation through binding of Ca2+ with SOS3 and subsequently activate SOS2, this complex stimulates Na+/ H+ antiporter which plays a crucial role in the regulation of Na+ ions in the cytosol [60].
In saline habits, soil salinity and arid climate greatly affect the synthesis of pigments in plants [61] and salinity reduces the net photosynthetic rate [62]. Redondo-Gómez et al. [14] reported that A. macrostachyum can improve or adjust the rate of photosynthesis under saline conditions. Aghaleh et al. [17] and Akcin and Yalcin [63] reported that photosynthetic pigments of S. europaea from Iran and Turkey were affected by increasing soil salinity. Our data showed non-significant variations in chl a under all salinity levels except in S. europaea under very high salinity (600 Mm NaCl), and significant decreases of chl b were only observed in S. fruticosa under all saline concentration and in A. macrostachyum and S. europaea under high saline concentration (600 Mm NaCl). This result suggests that S. fruticosa has a differential response to salt stress compared to A. macrostachyum and S. europaea. The increase in Chl a/b ratio in A. macrostachyum and S. fruticosa suggests that both species had more adaptation to saline conditions than S. europaea [24,64].
Carotenoids play a vital role as non-enzymatic antioxidants in protecting photosynthetic system. Our results showed significant increases in carotenoids with the elevation of NaCl concentration in A. macrostachyum and S. fruticosa, except at low salinity level for both species and under 600 in A. macrostachyum. This increase in carotenoid concentration may be one strategy to maintain chlorophyll amount and not decreasing it with different salinity concentrations. A similar study confirmed the increase in carotenoids in Nitraria retusa was associated with increasing salt tolerance [65]. In contrast, Carotenoids in S. europaea decreased significantly at all treatments. Such decreases in carotenoid contents under salinity stress were reported in different plant species [17,61,63,66]. These results suggest that carotenoids play an important role in the salt tolerance of A. macrostachyum and S. fruticosa than in S. europaea.
Phenolic compounds are secondary metabolites that play an important role in protecting plants against oxidative stress [67]. Increasing phenolic compounds synthesis is considered one of the most important methods in water deficiency resistance [68]. The synchronous significant increase of phenolic compounds and flavonoids in A. macrostachyum at moderate and high salinity levels indicates the importance of these compounds in stress tolerance in a synergistic relationship with carotenoids that also showed significant increases with salinity. Król et al. [69] and Caliskan et al. [70] reported that the metabolism of phenylpropanoid and phenolic compounds accumulation were enhanced in different plant species in response to different environmental stress conditions. Along the same line, the non-significant decrease in chlorophyll content in A. macrostachyum at high salinity level is due to increase in phenolic compounds contents at the same salinity level. This was supported by the finding of Bhattacharya et al. [71] who reported that phenolic compounds play a vital role in the biosynthesis of lignin and pigments in plants. Also, S. fruticosa showed a slight increase in phenolic contents at moderate NaCl concentrations and non-significant differences at other concentrations. This indicates that moderate salinity stimulates the production of phenolic compounds in S. fruticosa. On other hand, a constant or slight increase in total phenolic contents in S. europaea at different salinity levels was associated with the decrease in carotenoids. These results may indicate the importance of phenolic compounds in the alleviation of deleterious effects of salt stress in A. macrostachyum and S. fruticosa [72,73,74,75].
A. macrostachyum showed significant increases in flavonoid contents at all treatments except at low salinity which had a significant decrease. In contrast, S. fruticosa and S. europaea showed significant decreases in flavonoid contents but not at high salinity level in S. fruticosa which showed a slightly non-significant decrease. Brown et al. [76] reported that flavonoids act as auxin transport inhibitors, therefore, high promotion of shoot growth under low salinity (100 Mm NaCl) in A. macrostachyum and S. fruticosa may be due to low flavonoids content. The positive performance of shoot growth, despite its low root biomass, may be due to the same previous reason.
Malondialdehyde (MDA) concentration expresses the extent of destruction in the membrane because it acts as a common end product of lipid peroxidation [19]. Jithesh et al. [77] and Mohamed et al. [23] reported the presence of a positive correlation between salinity stress and MDA content in halophytic plants. A. macrostachyum and S. fruticosa showed significant increases in MDA concentration in all treatments except at 600 mM NaCl in A. macrostachyum. This result is in agreement with Abd El-Maboud [75] who reported increasing in MDA concentration in A. macrostachyum in the summer season. On other hand, S. europaea showed a significant decrease in MDA content with no effect at low salinity concentrations. This result contradicts the reported increase in MDA in S. europaea collected from Iran with the increase in salinity level [17]. This decrease in MDA concentration in S. europaea may be due to an increase in peroxidase activity, which was often stored at the cytosol, peroxisome and vacuole [78,79]. The increasing of peroxidase activity plays an active role in free radical oxidative stress inhibition, which leads to protect the membrane and decrease lipid peroxidation. Also, decreasing MDA may be due to the increasing accumulation of proline content in S. europaea than the other two species, which act as non-enzymatic antioxidant enzymes and this suggestion is in agreement with proline having a role in ROS scavenger [80].
Proline accumulates in the cell as an osmoregulatory solution which plays an important role in the adaptation of halophytes to high salinity levels [81]. Increasing in the accumulation of proline in response to salinity stress was reported in different plant species by different researchers [82,83]. Increasing proline synthesis helps in decreasing water loss and ions’ toxicity [84]. Our results showed a significant increase in proline contents at a high salinity level in all studied species. This increase may indicate upregulation of proline synthesis [85]. Increasing proline content in S. europaea at high salinity than the other two species may be important to compensate for the decrease in the carotenoids and flavonoids contents and to help as free radical scavengers.
Pectin is one of the basic components of a plant cell wall. It can be both methyl-esterified and acetyl-esterified. De-esterification occurs by specific esterases [86]. Esterase plays a vital role in avoiding the salt-induced imbalance in cell wall formation. Our results showed two esterase loci in all studied species and under all treatments with the higher intensities in A. macrostachyum and S. fruticosa at moderate salinity level, and at low and moderate salinity levels in S. europaea. These results are in agreement with Dasgupta et al. [87] who reported that esterase isoforms intensities were increased with elevating salt concentration. Mohamed et al. [25] found esterase has two isoforms in Pancratium maritimum and their intensities were increased under moderate saline concentration.
For S. europaea under salt stress (100 mM NaCl), Principal component analysis observed the arrangement of growth parameters, chlorophyll parameters, MDA and flavonoids on the positive X-axis, while proline and phenolic compounds grouped on the negative X-axis. This result suggests the salt tolerance of this species due to the accumulation of proline and phenolic compounds. In contrast, all parameters grouped on the positive X-axis, except Chl b and flavonoids were observed on the negative X-axis for S. fruticosa, and Ch b, flavonoids, Chl a and proline grouped on the negative axis for A. macrostachyum. These results confirm the growth promotion of both species due to increasing of Chl a/b ratio and the decline of flavonoids contents.
The promotion of growth parameters in S. europaea under 600 Mm NaCl compared to A. macrostachyum and S. fruticosa may be due to the decline of flavonoids accumulation in Salicornia under this salt level compared to the other two species. The decline in most parameters under 600 mM NaCl in A. macrostachyum suggests the deleterious effects of this concentration on this species.
Superoxide dismutase is considered the most important enzyme during the growth of plants under biotic and abiotic stress through catalyzing the dismutation of superoxide radicals into H2O and Oxygen [88,89,90]. Nisar et al. [91] reported constitutive and decline of SOD activity in germinating black and brown A. macrostachyum seeds respectively under salinity. On the other hand, salinity induced promotion in SOD activity in S. europaea seedlings [92]. The induction of SOD under salinity was a prominent feature in halophytes such as Suaeda maritima, Pancratium maritimum and Zygophyllum coccenium [22,23,24,25]. In this study, SOD activity increased under high salinity in A. macrostachyum and S. europaea, and under moderate salinity in S. fruticosa. These results suggest a differential mechanism for SOD under salinity in these species.
POD enzyme has a major protective role for the cell against hydrogen peroxide which is produced under stress conditions [93,94]. Our study showed that POX enzyme has a stable faint locus at all salinity levels in S. fruticosa, and at high and moderate salinity in A. macrostachyum and S. europaea. The highest POD activity was recorded in S. europaea in respect to other species. This increase in both peroxidase and SOD activities under higher salinity may decrease free radical concentrations and protects membranes from lipid peroxidation, and hence the low MDA concentration in S. europaea than the other two species. Also, this indicates that POD is one of the most important strategies in salt tolerance in S. europaea more than the other two species.
From the foregoing discussion, the three halophytic species that are belonging to the same family and collected from the same saline ecological habitat showed differential mechanism to salt tolerance. The salt tolerance of S. europaea is derived from the promotion of proline level and peroxidase activity. The stable shoot and decline in root biomass suggest investment of energy in the promotion of antioxidant enzymes and compounds than use it in the growth process. This was supported statistically by the presence of a significant negative correlation between growth parameters and proline contents. In contrast, salt tolerance of A. macrostachyum and S. fruticosa is concomitant with rearrangement of chlorophyll contents, high level of carotenoids and phenolic compounds, and activation of esterase enzyme. This conclusion seems to be confirmed by the negative correlation between most of these compounds and the growth parameters of both species. The positive performance of both species’ biomass, compared to S. europaea, suggests little energy was used in the salt tolerance mechanism in these plants. Also, a trade-off strategy between the growth process and defense system was noticed in the case of S. europaea. These results confirm differential salt tolerance strategies of different halophytes in the same habitat which provide valuable information in the selection of the best strategy in re-habitation of saline coastal areas.

4. Materials and Methods

4.1. Plant Seeds Collection

Inflorescences containing mature dry seeds of three species belong to Amaranthaceae family were collected from a halophytic region Damietta–Alexandria road during June 2018 and transported to the laboratory. Seeds were manually separated from the inflorescence and stored in paper bags until use. Studied species soil analysis was conducted according to Jackson [95]. The soil electrical conductivity was 15.325 ds/m and pH values were 9.36, Ca, Mg, Cl and HCO3 concentrations were 0.035%, 0.01%, 0.4686% and 0.03355% respectively.

4.2. Growth Conditions

Seeds of studied plant species were surfaced sterilized using 70% ethyl alcohol for 30 s followed by 3.5% (v/v) Sodium hypochlorite for 5 min, then washed thoroughly with distilled water [22]. Sterilized seeds of each species were sown in 25 replicates plastic pots with 20 cm height and 10 cm in diameter containing sandy soil and irrigated with 150 mL of 20% MS medium. The germination was carried out under natural greenhouse conditions (temperature range 14–28 °C, humidity about 40%, and photoperiod 14: 10 light: dark) for 30 days. After this period, 15 plastic pots of each species with uniform seedlings size were chosen and divided to five groups; each group contains three replicates, and each replicate containing five plants. Five treatments were used in this experiment (0, 100, 200, 400, and 600 mM NaCl) and plants were irrigated with 1 L of 20% MS medium prepared in distilled water, 100, 200, 400 and 600 mM NaCl (150 mL weekly) for two months.

4.3. Determination of Na+, K+ and Ca2+

Air-dried shoot and root were grounded to fine powders and 0.2 g of each sample were treated with 7:3 sulfuric: perchloric acid mixture. Cations’ concentrations were determined according to Jackson [95].

4.4. Growth Parameters

4.4.1. Shoot and Root Fresh and Dry Weight Determination

For each treatment, five plants were used for the shoot and root fresh and dry weights determination. Plants were removed from the pots and washed under tap water to remove any dust then plants were dried using paper tissues. Aerial parts and root system were separated and weighed using sensitive balance, after that plants were dried using a hot air oven at 70 °C for 72 h until the weights become constant and reweighed to record dry weight.

4.4.2. Determination of Photosynthetic Pigments

For the determination of chlorophyll a, b and carotenoids, 0.1 g of plant tissue was homogenized in 10 mL of 80% acetone then centrifuged at 5000 rpm for 10 min. Supernatant absorbance was read at 663, 645, and 470 nm and photosynthetic pigment contents were calculated from the equations as described by Lichtenthaler and Wellburn [96].

4.4.3. Determination of Malondialdehyde (MDA) Content

Malondialdehyde (MDA) was determined according to Carmak and Horst [97] methods, 0.2 g of fresh plant aerial system were homogenized in 2 mL of 0.1% (w/v) trichloroacetic acid (TCA) at 4 °C. The homogenate was centrifuged for 10 min at 1000 rpm and to 0.5 mL of the supernatant, 3 mL of 0.5% (v/v) Thiobarbaturic acid (prepared in 20% TCA) was added. The mixture was incubated in 95 °C water bath with continuous shaking for 50 min, and then samples were placed in an ice bath until the temperature decreased to 25°C. The samples were re-centrifuged for 10 min at 10,000 rpm and the absorbance of the mixture was read at 532 nm. The non-specific absorption read at 600 nm was subtracted from all the readings and the MDA contents were calculated using the absorption coefficient as follows:
MDA level (nmol) = Δ (A 532 nm−A 600 nm)/1.56 × 105

4.4.4. Determination of Proline Content

Proline was determined using Bates et al. [98] method as follows; 0.5 g of fresh plant shoot were homogenized in 4 mL of 3.0% Sulphosalicylic acid. Then the homogenate was centrifuged for 10 min at 1000 rpm. To 1 mL of the supernatant 2 mL of acid Ninhydrin reagent and 2.0 mL of glacial acetic acid were added in a test tube, Then the mixture was incubated in a water bath at 100 °C for 60 min. then the mixture was cooled suddenly in an ice bath. After cooling, 4 mL of toluene were added to the solution mixture and vortex. The chromophore containing toluene (upper layer) was transferred to a new test tube. Finally, the absorbance was read at 520 nm using a spectrophotometer and Toluene as a blank. The concentration of proline was determined using the standard curve and expressed as mg g−1.

4.4.5. Determination of Total Phenolic Compounds and Flavonoids

For the determination of phenolic compounds, 0.1 g of the shoot was homogenized in 10 mL of 70% acetone, then centrifuge at 5000 rpm for 10 min. To 1 mL of supernatant, 2 mL of sodium carbonate (15%) and 1 mL Folin–Ciocâlteu reagent (FCR) was added and the absorbance was recorded at 650 nm. Gallic acid was used as a standard for the determination of phenolic contents [99]. For total flavonoid, the aluminum trichloride method was used, to 1 mL of extract 2.5 mL of AlCl3 reagent in ethanol 90% (20.0 mg/mL), then incubated at room temperature for 40 min. and the absorbance was recorded at 415 nm. Quercetine was used as a standard for flavonoids determination [100]. All absorbances were determined using Jenway 7315 spectrophotometer, Jenway Scientific Instrumental Company, UK.

4.5. Isozymes Analysis

4.5.1. Enzymes Extraction and Detection

For protein extraction; 0.2 g of plant aerial part tissue were macerated in 1 mL of 50 mM Tris HCl buffer (pH 6.8) containing 1 mM EDTA, 1 mM DDT, and 20 mg polyvinyl polypyrrolidone (PVPP) using chilled ceramic mortar and pestles. The homogenate was centrifuged at 10,000 rpm for 10 min at 4 °C. The supernatant was stored in 4 °C until used. The protein concentration was determined by spectrophotometry according to Lowry’s method [101] using bovine serum albumin as a standard.
Native discontinuous system was prepared according to Laemmli [102] without adding Sodium dodecyl sulfate (SDS) and 50 μg from each sample were loaded directly without denaturation. The running voltage was started at 80 V for 30 min then increased to 120 V until the loading dye migration reached the bottom of the resolving gel.
For visualization of esterases, the gel was incubated in 100 mL of 100 mM Sodium phosphate buffer (pH 7) containing 40 mg α-Naphthyl acetate and 0.2 g fast blue RR for 30 min. in dark at 37 °C, and then the gel was fixed in 7% acetic acid solution [103].
For visualization Peroxidase activity, Seevers et al. [104] method was used, after electrophoresis gel was incubating for 30 min at 25 °C in 200 mM Sodium acetate buffer (pH 5) containing 3% H2O2 and 1.3 mM Benzidine, and the gel was fixed in 30% fixing solution.
For visualization Superoxide Dismutase (SOD), the gel was incubated in 200 mM K-phosphate buffer (pH 7.8) containing 0.1 mM riboflavin and 0.24 mM Nitroblue tetrazolium for 30 min, and then the gel was stained by exposure to fluorescence light.
All gels were photographed using Cannon kiss4 digital camera then transferred to a computer and converted into density profile using Image J program [105].

4.5.2. Statistical Analysis

All data were expressed as means with standard error, and Levene’s test was used to investigate the homogeneity of variances of all data, then the data were subjected to one-way ANOVA and Tukey test. Two-way ANOVA was applied to determine the effect of salinity, species, and their interaction with all parameters. Principal component analysis was used to explore the correlation between growth parameters and studied organic compounds under salinity (100 mM NaCl). Also, Pearson’s correlation coefficient was applied to investigate the correlation between all studied parameters under salinity treatments. All statistical analyses were carried out using SPSS 16.0 software. The means comparison was set at p < 0.05 and values denoted by the same letter are not significantly different.

Supplementary Materials

The following are available online at https://www.mdpi.com/article/10.3390/plants10061100/s1, Figure S1: Superoxide dismutase isozymes of S. europaea, S. fruticosa and A. macrostachyum under different NaCl concentrations, Table S1: The correlation coefficient of growth parameters (shoot fresh weight: SFW, root fresh weight: RFW, shoot dry weight: SDW, root dry weight: RDW), Chl a, Chl b, Chl a/b, carotenoids: Car, Proline: pro, malondialdehyde: MDA, phenolics: Phe, Flavonoids: Flav. in Arthrocnemum macrostachyum, Sarcocornia fruticosa and Salicornia europaea under salinity treatments.

Author Contributions

Conceptualization, A.F.M.G., E.M., A.M.M.A.K. and A.A.E.-G.; methodology, A.F.M.G., E.M., and A.M.M.A.K.; software, E.M..; validation, A.F.M.G., E.M., A.M.M.A.K. and A.A.E.-G.; formal analysis, A.F.M.G., E.M. and A.M.M.A.K.; investigation, A.A.E.-G., E.M. and A.M.M.A.K.; resources, A.F.M.G., E.M. and A.M.M.A.K.; data curation, A.F.M.G., E.M. and A.M.M.A.K.; writing—original draft preparation, A.F.M.G. and E.M.; writing—review and editing, E.M. and A.M.M.A.K.; visualization, E.M., A.M.M.A.K. and A.A.E.-G.; supervision, E.M., A.M.M.A.K. and A.A.E.-G.; project administration, A.M.M.A.K. and A.A.E.-G.; funding acquisition, A.F.M.G., E.M. and A.M.M.A.K. All authors have read and agreed to the published version of the manuscript.

Funding

This research received no external funding.

Institutional Review Board Statement

Not applicable.

Informed Consent Statement

Not applicable.

Data Availability Statement

Not applicable.

Conflicts of Interest

The authors declare no conflict of interest.

References

  1. FAO. Global Network on Integrated Soil Management for Sustainable Use of Salt-Affected Soils; FAO Land and Plant Nutrition Management Service: Rome, Italy, 2005; Available online: http://www.fao.org/ag/agl/agll/spush (accessed on 29 May 2020).
  2. Gupta, B.; Huang, B. Mechanism of salinity tolerance in plants: Physiological, biochemical, and molecular characterization. Int. J. Genom. 2014, 701596. [Google Scholar] [CrossRef]
  3. Shrivastava, P.; Kumar, R. Soil salinity: A serious environmental issue and plant growth promoting bacteria as one of the tools for its alleviation. Saudi J. Biol. Sci. 2015, 22, 123–131. [Google Scholar] [CrossRef] [PubMed] [Green Version]
  4. Hasanuzzaman, M.; Nahar, K.; Fujita, M. Plant response to salt stress and role of exogenous protectants to mitigate salt-induced damages. In Ecophysiology and Responses of Plants under Salt Stress; Ahmad, P., Azooz, M.M., Prasad, M.N.V., Eds.; Springer: New York, NY, USA, 2013; pp. 25–87. [Google Scholar]
  5. Yamaguchi, T.; Blumwald, E. Developing salt-tolerant crop plants: Challenges and opportunities. Trends Plant Sci. 2005, 10, 615–620. [Google Scholar] [CrossRef] [PubMed]
  6. Herppich, W.B.; Huyskens-keil, S.; Kadau, R. Effects of short-term low-temperature storage on mechanical and chemical properties of white Asparagus cell walls. J. Appl. Bot. Food Qual. 2005, 79, 63–71. [Google Scholar]
  7. Khan, Z.I.; Hussain, A.; Ashraf, M.; McDowell, L.R. Mineral status of soils and forages in southwestern Punjab-Pakistan: Micro-minerals. Asian Aust. J. Anim. Sci. 2006, 19, 1139–1147. [Google Scholar]
  8. Zhang, X.; Yin, H.; Chen, S.; He, J.; Guo, S. Changes in antioxidant enzyme activity and transcript levels of related genes in Limonium sinense Kuntze seedlings under NaCl stress. J. Chem. 2014, 749047. [Google Scholar] [CrossRef] [Green Version]
  9. Poljakoff-Mayber, A. Morphological and anatomical changes in plants as a response to salinity stress. In Plants in Saline Environment; Poljakoff-Mayber, A., Gale, J., Eds.; Springer: New York, NY, USA, 1975; pp. 97–117. [Google Scholar]
  10. Mansour, M.M.F. Nitrogen containing compounds and adaptation of plants to salinity stress. Biol. Plant. 2000, 43, 491–500. [Google Scholar] [CrossRef]
  11. Munns, R.; James, R.A. Screening methods for salinity tolerance: A case study with tetraploid wheat. Plant Soil 2003, 253, 201–218. [Google Scholar] [CrossRef]
  12. Hameed, M.; Ashraf, M.; Naz, N. Anatomical adaptations to salinity in cogon grass [Imperata cylindrica (L.) Raeuschel] from the Salt Range, Pakistan. Plant Soil 2009, 322, 229–238. [Google Scholar] [CrossRef]
  13. Rivelli, A.R.; James, R.A.; Munns, R.; Condon, A.T. Effect of salinity on water relations and growth of wheat genotypes with contrasting sodium uptake. Sciences 2002, 22, 123–131. [Google Scholar] [CrossRef]
  14. Redondo-Gómez, S.; Mateos-Naranjo, E.; Figueroa, M.E.; Davy, A.J. Salt stimulation of growth and photosynthesis in an extreme halophyte, Arthrocnemum macrostachyum. Plant Biol. 2010, 12, 79–87. [Google Scholar] [CrossRef]
  15. Koyro, H.W.; Hussain, T.; Huchzermeyer, B.; Khan, M.A. Photosynthetic and growth responses of a perennial halophytic grass Panicum turgidum to increasing NaCl concentrations. Environ. Exp. Bot. 2013, 91, 22–29. [Google Scholar] [CrossRef]
  16. Koyro, H.W. Effect of salinity on growth, photosynthesis, water relations and solute composition of the potential cash crop halophyte Plantago coronopus (L.). Environ. Exp. Bot. 2006, 56, 136–146. [Google Scholar] [CrossRef]
  17. Aghaleh, M.; Niknam, V.; Ebrahimzadeh, H.; Razavi, K. Salt stress effects on growth, pigments, proteins and lipid peroxidation in Salicornia persica and S. europaea. Biol. Plant. 2009, 53, 243–248. [Google Scholar] [CrossRef]
  18. Foreman, J.; Demidchik, V.; Bothwell, J.H.; Mylona, P.; Miedema, H.; Torres, M.A.; Linstead, P.; Costa, S.; Brownlee, C.; Jones, J.D.; et al. Reactive oxygen species produced by NADPH oxidase regulate plant cell growth. Nature 2003, 27, 442–446. [Google Scholar]
  19. Esfandiari, E.; Shekari, F.; Shekari, F.; Esfandiari, M. The effect of salt stress on antioxidant enzymes activity and lipid peroxidation on the wheat seedling. Not. Bot. Horti Agrobot. Cluj-Napoca 2007, 35, 48–56. [Google Scholar]
  20. Ozgur, R.; Uzilday, B.; Sekmen, A.H.; Turkan, I. Reactive oxygen species regulation and antioxidant defence in halophytes. Funct. Plant Biol. 2013, 40, 832–847. [Google Scholar] [CrossRef]
  21. Zhang, Z.; Guo, J.; Zhao, Y. Identification and characterization of maize ACD6-like gene reveal ZmACD6 as the maize orthologue conferring resistance to Ustilago maydis. Plant Signal Behav. 2019, 14, e1651604. [Google Scholar] [CrossRef] [PubMed]
  22. Mohamed, E.; Matsuda, R.; El-khatib, A.A.; Takechi, K.; Takano, H.; Takio, S. Characterization of the superoxide dismutase genes of the halophyte Suaeda maritima in Japan and Egypt. Plant Cell Rep. 2015, 34, 2099–2110. [Google Scholar] [CrossRef]
  23. Mohamed, E.; Matsuda, R.; El-khatib, A.A.; Takechi, K.; Takano, H.; Takio, S. Differential tolerance to high salt with regard to cell growth and superoxide dismutase (SOD) activity in calluses of the halophyte Suaeda maritima from Japan and Egypt. Plant Omics 2016, 9, 81–89. [Google Scholar]
  24. Mohamed, E.; Kasem, A.M.M.A.; Gobouri, A.A.; Elkelish, A.; Azab, E. Influence of Maternal Habitat on Salinity Tolerance of Zygophyllum coccineum with Regard to Seed Germination and Growth Parameters. Plants 2020, 9, 1504. [Google Scholar] [CrossRef] [PubMed]
  25. Mohamed, E.; Kasem, A.M.M.A.; Farghali, K.A. Seed germination of Egyptian Pancratium maritimum under salinity with regard to cytology, antioxidant and reserve mobilization enzymes, and seed anatomy. Flora 2018, 242, 120–127. [Google Scholar] [CrossRef]
  26. Kim, Y.H.; Kim, C.Y.; Song, W.K.; Park, D.S.; Kwon, S.Y.; Lee, H.S.; Bang, J.W.; Kwak, S.S. Overexpression of sweet potato swpa4 peroxidase results in increased hydrogen peroxide production and enhances stress tolerance in tobacco. Planta 2008, 227, 867–881. [Google Scholar] [CrossRef]
  27. Ahmad, P.; Jaleel, C.A.; Salem, M.A.; Nabi, G.; Sharma, S. Roles of enzymatic and non-enzymatic antioxidants in plants during abiotic stress. Crit. Rev. Biotechnol. 2010, 30, 161–175. [Google Scholar] [CrossRef]
  28. Caillet, S.; Salmiéri, S.; Lacroix, M. Evaluation of free radical-scavenging properties of commercial grape phenol extracts by a fast-colorimetric method. Food Chem. 2006, 95, 1–8. [Google Scholar] [CrossRef]
  29. Amarowicz, R.; Weidner, S. Biological activity of grapevine phenolic compounds. In Grapevine Molecular Physiology and Biotechnology, 2nd ed.; Roubelakis-Angelakis, K.A., Ed.; Springer: New York, NY, USA, 2009; pp. 389–405. [Google Scholar]
  30. Amarowicz, R.; Weidner, S.; Wojtowicz, I.; Karmac, M.; Kosinska, A.; Rybarczyk, A. Influence of low-temperature stress on changes in the composition of grapevine leaf phenolic compounds and their antioxidant properties. Funct. Plant Sci. Biotechnol. 2010, 4, 90–96. [Google Scholar]
  31. Lattanzio, V. Phenolic compounds: Introduction. In Natural Products; Ramawat, K.G., Merillon, J.M., Eds.; Springer: Berlin/Heidelberg, Germany, 2013. [Google Scholar]
  32. Pereira, A. Plant abiotic stress challenges from the changing environment. Front. Plant Sci. 2016, 7, 1123. [Google Scholar] [CrossRef] [Green Version]
  33. Di Ferdinando, M.; Brunetti, C.; Fini, A.; Tattini, M. Flavonoids as Antioxidants in plants under Abiotic Stresses. In Abiotic Stress Responses in Plants: Metabolism, Productivity and Sustainability; Ahmad, P., Prasad, M.N.V., Eds.; Springer: New York, NY, USA, 2012; pp. 159–179. [Google Scholar]
  34. Slama, I.; Abdelly, C.; Bouchereau, A.; Flowers, T.; Savouré, A. Diversity, distribution and roles of osmoprotective compounds accumulated in halophytes under abiotic stress. Ann. Bot. 2015, 115, 433–447. [Google Scholar] [CrossRef] [Green Version]
  35. Kaur, G.; Asthir, B. Proline: A key player in plant abiotic stress tolerance. Biol. Plant. 2015, 59, 609–619. [Google Scholar] [CrossRef]
  36. Christenhusz, M.J.M.; Byng, J.W. The number of known plant species in the world and its annual increase. Phylotaxa 2016, 261, 201–217. [Google Scholar] [CrossRef] [Green Version]
  37. Breckle, S.W. Studies on halophytes from Iran and Afganistan. II Ecology of halophytes along salt gradients. Proceeding R. Soc. Edinb. 1986, 89, 203–215. [Google Scholar]
  38. Aronson, J. Halophytes. In A Database of Salt Tolerant Plant of the World; Office of Arid Lands Studies, University Arizona Tucson: Tucson, AZ, USA, 1989. [Google Scholar]
  39. Akhani, P.; Ghorbanli, M. A contribution to the halophytic vegetation and flora of Iran. In Towards the Rational Use of High Salinity Tolerant Plants; Lieth, H., Al-Masoom, A., Eds.; Kluwer Academic Publishers: Dodrecht, The Netherlands, 1993; Volume 1, pp. 35–44. [Google Scholar]
  40. Öztürk, M.; Altay, V.; Altundağ, E.; Gücel, S. Halophytic plant diversity of unique habitats in Turkey: Salt mine caves of Çankırı and Iğdır. In Halophytes for Food Security in Dry Lands; Khan, M.A., Ozturk, M., Gul, B., Ahmed, M.Z., Eds.; Elsevier Academic Publisher: Oxford, GB, USA, 2016; pp. 291–315. [Google Scholar]
  41. Winter, K.; Troughton, J.H.; Evenari, M.; Läuchli, A.; Lüttge, U. Mineral ion composition and occurrence of CAM-like diurnal malate fluctuations in plants of coastal and desert habitats of Israel and the Sinai. Oecologia 1976, 25, 125–143. [Google Scholar] [CrossRef]
  42. Boulos, L. Flora of Egypt; Al Hadara Publication: Cairo, Egypt, 1999; Volume 1, p. 417. [Google Scholar]
  43. Singh, D.; Buhmann, A.K.; Flowers, T.J.; Seal, C.E.; Papenbrock, J. Salicornia as a crop plant in temperate regions: Selection of genetically characterized ecotypes and optimization of their cultivation conditions. AoB Plants 2014, 6. [Google Scholar] [CrossRef] [Green Version]
  44. Said, O.B.; DaSilva, M.M.; Hannier, F.; Beyrem, H.; Chícharo, L. Using Sarcocornia fruticosa and Saccharomyces cerevisiae to remediate metal contaminated sediments of the Ria Formosa lagoon (SE Portugal). Ecohydrol. Hydrobiol. 2019, 19, 588–597. [Google Scholar] [CrossRef]
  45. El Naker, N.A.; Yousef, A.F.; Yousef, L.F. A review of Arthrocnemum (Arthrocaulon) macrostachyum chemical content and bioactivity. Phytochem. Rev. 2020, 19, 1427–1448. [Google Scholar] [CrossRef]
  46. Xiong, L.; Zhu, J.K. Salt tolerance. Arab. Book 2002, 1, e0048. [Google Scholar] [CrossRef] [PubMed]
  47. Cuevas, J.; Daliakopoulos, I.N.; del Moral, F.; Hueso, J.J.; Tsanis, I.K. A Review of Soil-Improving Cropping Systems for Soil Salinization. Agronomy 2019, 9, 295. [Google Scholar] [CrossRef] [Green Version]
  48. Hanin, M.; Ebel, C.; Ngom, M.; Laplaze, L.; Masmoudi, K. New Insights on Plant Salt Tolerance Mechanisms and Their Potential Use for Breeding. Front. Plant Sci. 2016, 7, 1787. [Google Scholar] [CrossRef] [Green Version]
  49. Khan, M.A.; Gul, B. Arthrocnemum macrostachyum: A potential case for agriculture using above seawater salinity. In Prospects for Saline Agriculture; Springer: Dordrecht, The Netherlands, 2002; pp. 353–364. [Google Scholar]
  50. Redondo-Gómez, S.; Wharmby, C.; Castillo, J.M.; Mateos-Naranjo, E.; Luque, C.J.; DeCires, A.; Luque, T.; Davy, A.J.; Figueroa, E.M. Growth and photosynthetic responses to salinity in an extreme halophyte, Sarcocornia fruticosa. Physiol. Plant. 2006, 128, 116–124. [Google Scholar] [CrossRef]
  51. García-Caparrós, P.; Llanderal, A.; Pestana, M.; Correia, P.J.; Lao, M.T. Nutritional and physiological responses of the dicotyledonous halophyte Sarcocornia fruticosa to salinity. Aust. J. Bot. 2017, 65, 573–581. [Google Scholar] [CrossRef]
  52. Ungar, I.A.; Benner, D.K.; McGraw, D.C. Distribution and growth of Salicornia europaea on an inland salt pan. Ecology 1979, 60, 329–336. [Google Scholar] [CrossRef]
  53. Cai, Z.Q.; Gao, Q. Comparative physiological and biochemical mechanisms of salt tolerance in five contrasting highland quinoa cultivars. BMC Plant Biol. 2020, 20, 1–15. [Google Scholar] [CrossRef] [PubMed] [Green Version]
  54. Shabala, S. Learning from halophytes: Physiological basis and strategies to improve stress tolerance in crops. Ann. Bot. 2013, 112, 1209–1221. [Google Scholar] [CrossRef]
  55. Flowers, T.J.; Munns, R.; Colmer, T.D. Sodium chloride toxicity and the cellular basis of salt tolerance in halophytes. Ann. Bot. 2015, 115, 419–431. [Google Scholar] [CrossRef] [Green Version]
  56. Khan, M.A.; Ungar, I.A.; Showalter, A.M. Salt stimulation and tolerance in an intertidal stem succulent halophyte. J. Plant Nutr. 2005, 28, 1365–1374. [Google Scholar] [CrossRef]
  57. Glenn, E.P.; Brown, J.J.; Blumwald, E. Salt tolerance and crop potential. Crit. Rev. Plant Sci. 1999, 18, 227–255. [Google Scholar] [CrossRef]
  58. Shabala, S.; Mackay, A. Ion transport in halophytes. Adv. Bot. Res. 2011, 57, 151–199. [Google Scholar]
  59. Marcum, K.B.; Murdoch, C.L. Salt tolerance of the coastal salt marsh grass, Sporobolus virginicus (L.) Kunth. New Phytol. 1992, 120, 281–288. [Google Scholar] [CrossRef]
  60. Hadi, M.R.; Karimi, N. The role of calcium in plants’ salt tolerance. J. Plant Nutr. 2012, 35, 2037–2054. [Google Scholar] [CrossRef]
  61. Nunes-Nesi, A.; Sulpice, R.; Gibon, Y.; Fernie, A.R. The enigmatic contribution of mitochondrial function in photosynthesis. J. Exp. Bot. 2008, 59, 1675–1684. [Google Scholar] [CrossRef] [PubMed] [Green Version]
  62. Burman, U.; Garg, B.; Kathju, S. Interactive Effects of Thiourea and Phosphorus on Cluster bean Under Water Stress. Biol. Plant. 2004, 48, 61–65. [Google Scholar] [CrossRef]
  63. Akcin, A.; Yalcin, E. Effect of salinity stress on chlorophyll, carotenoid content, and proline in Salicornia prostrata Pall. and Suaeda prostrata Pall. subsp. prostrata (Amaranthaceae). Braz. J. Bot. 2016, 39, 101–106. [Google Scholar] [CrossRef]
  64. Rabhi, M.; Castagna, A.; Remorini, D.; Scattino, C.; Smaoui, A.; Ranieri, A.; Abdelly, C. Photosynthetic responses to salinity in two obligate halophytes: Sesuvium portulacastrum and Tecticornia indica. S. Afr. J. Bot. 2012, 79, 39–47. [Google Scholar] [CrossRef]
  65. Boughalleb, F.; Denden, M. Physiological and biochemical changes of two halophytes, Nitraria retusa (Forssk.) and Atriplex halimus (L.) under increasing salinity. Agric. J. 2011, 6, 327–339. [Google Scholar] [CrossRef]
  66. Morsy, A.A.; Youssef, A.M.; Mosallam, H.A.; Hashem, A.M. Assessment of selected species along Alamein-Wadi El-Natrun Desert Road. Egypt J. Appl. Sci. Res. 2008, 4, 1276–1284. [Google Scholar]
  67. Shao, H.B.; Chu, L.Y.; Jaleel, C.A.; Zhao, C.X. Water-deficit stress-induced anatomical changes in higher plants. Comptes Rendus Biol. 2008, 331, 215–225. [Google Scholar] [CrossRef] [PubMed]
  68. Parida, A.K.; Das, A.B.; Sanada, Y.; Mohanty, P. Effects of salinity on biochemical components of the mangrove, Aegiceras corniculatum. Aquat. Bot. 2004, 80, 77–87. [Google Scholar] [CrossRef]
  69. Król, A.; Amarowicz, R.; Weidner, S. Changes in the composition of phenolic compounds and antioxidant properties of grapevine roots and leaves (Vitis vinifera L.) under continuous of long-term drought stress. Acta Physiol. Plant. 2014, 6, 1491–1499. [Google Scholar]
  70. Caliskan, O.; Bayazıt, S.; Oktem, M.; Ergul, A. Evaluation of the genetic diversity of pomegranate accessions from Turkey using new microsatellite markers. Turk. J. Agric. For. 2017, 41, 142–153. [Google Scholar] [CrossRef]
  71. Bhattacharya, A.; Sood, P.; Citovsky, V. The roles of plant phenolics in defence and communication during agrobacterium and rhizobium infection. Mol. Plant Pathol. 2010, 11, 705–719. [Google Scholar] [CrossRef]
  72. Weidner, S.; Karolak, M.; Karamać, M.; Kosińska, A.; Amarowicz, R. Phenolic compounds and properties of antioxidants in grapevine roots (Vitis vinifera L.) under drought stress followed by recovery. Acta Soc. Bot. Pol. 2009, 78, 97–103. [Google Scholar] [CrossRef] [Green Version]
  73. Bettaieb, I.; Hamrouni-Sellami, I.; Bourgou, S.; Limam, F.; Marzouk, B. Drought effects on polyphenol composition and antioxidant activities in aerial parts of Salvia officinalis L. Acta Physiol. Plant. 2011, 33, 1103–1111. [Google Scholar] [CrossRef]
  74. Naikoo, M.I.; Dar, M.I.; Raghib, F.; Jaleel, H.; Ahmad, B.; Raina, A.; Khan, F.A.; Naushin, F. Role and regulation of plants phenolics in abiotic stress tolerance: An overview. In Plant Signaling Molecules: Role and Regulation Under Stressful Environments; Iqbal, M., Ferrante, A., Redd, P.S., Khan, N.A., Eds.; Elsevier Publications: Amsterdam, The Netherlands, 2019; pp. 157–168. [Google Scholar]
  75. Abd El-Maboud, M.M. Seasonal variations effect on antioxidant compounds and their role in the adaptation of some halophytes at Wadi Gharandal, Southwest Sinai. Ann. Agric. Sci. 2019, 64, 161–166. [Google Scholar] [CrossRef]
  76. Brown, D.E.; Rashotte, A.M.; Murphy, A.S.; Normanly, J.; Tague, B.W.; Peer, W.A.; Taiz, L.; Muday, G.K. Flavonoids act as negative regulators of auxin transport in vivo in Arabidopsis. Plant Physiol. 2001, 126, 524–535. [Google Scholar] [CrossRef] [Green Version]
  77. Jithesh, M.N.; Prashanth, S.R.; Sivaprakash, K.R.; Parida, A.K. Antioxidative response mechanisms in halophytes: Their role in stress defense. J. Genet. 2006, 85, 237–254. [Google Scholar] [CrossRef]
  78. Prasad, T.K.; Anderson, M.D.; Stewart, C.R. Localization and characterization of peroxidases in the mitochondria of chilling acclimated maize seedlings. Plant Physiol. 1995, 108, 1597–1605. [Google Scholar] [CrossRef] [PubMed] [Green Version]
  79. Mhamdi, A.; Hager, J.; Chaouch, S.; Queval, G.; Han, Y.; Taconnat, L.; Saindrenan, P.; Goua, H.; Issakidis Bourguet, E.; Renou, J.P.; et al. Arabidopsis Glutathione Reductase 1 plays a crucial role in leaf responses to intracellular hydrogen peroxide and in ensuring appropriate gene expression through both salicylic acid and jasmonic acid signaling pathways. Plant Physiol. 2010, 153, 1144–1160. [Google Scholar] [CrossRef] [Green Version]
  80. Szabados, L.; Savoure, A. Proline: A multifunctional amino acid. Trends Plant Sci. 2010, 15, 89–97. [Google Scholar] [CrossRef]
  81. Bohnert, H.J.; Nelson, D.E.; Jensen, R.G. Adaptations to environmental stresses. Plant Cell 1995, 7, 1099–1111. [Google Scholar] [CrossRef]
  82. Ahmad, P.; John, R.; Sarwat, M.; Umar, S. Responses of proline, lipid peroxidation and antioxidative enzymes in two varieties of Pisum sativum L. under salt stress. Int. J. Plant Prod. 2012, 2, 353–366. [Google Scholar]
  83. Mohamed, E.; Ansari, N.; Yadav, D.S.; Agrawal, M.; Agrawal, S.B. Salinity alleviates the toxicity level of ozone in a halophyte Mesembryanthemum crystallinum L. Ecotoxicology 2021. [Google Scholar] [CrossRef] [PubMed]
  84. Ashraf, M.; Foolad, M.R. Roles of glycine betaine and proline in improving plant abiotic stress resistance. Environ. Exp. Bot. 2007, 59, 206–216. [Google Scholar] [CrossRef]
  85. Mann, A.; Kumar, A.; Saha, M.; Lata, C.; Kumar, A. Stress induced changes in osmoprotectants, ionic relations, antioxidants activities and protein profiling characterize Sporobolus marginatus Hochst. ex A. Rich. salt tolerance mechanism. Indian J. Exp. Biol. 2019, 57, 672–679. [Google Scholar]
  86. Ce’cile, T.; Francoise, L.; Pierre, V.C. Polymorphism and modulation of cell wall esterase enzyme activities in the chicory root during the growing season. J. Exp. Bot. 2006, 57, 81–89. [Google Scholar]
  87. Dasgupta, N.; Nandy, P.; Tiwari, C.; Das, S. Salinity-imposed changes of some isozymes and total leaf protein expression in five mangroves from two different habitats. J. Plant Interact. 2010, 5, 211–221. [Google Scholar] [CrossRef] [Green Version]
  88. Bowler, C.; Van Montagu, M.; Inze, D. Superoxide dismutase and stress tolerance. Annu. Rev. Plant Physiol. Plant Mol. Biol. 1992, 43, 83–116. [Google Scholar] [CrossRef]
  89. Mohamed, E.; Kasem, A.M.M.A.; El-khatib, A. Allelopathic potential of Egyptian halophytes Arthrocnemum macrostachyum and Halocnemum strobilaceum from two coastal areas. Allelopath. J. 2020, 50, 225–241. [Google Scholar] [CrossRef]
  90. Sekmen, A.H.; Turkan, I.; Tanyolac, Z.O.; Ozfidan, C.; Dinc, A. Different antioxidant defense responses to salt stress during germination and vegetative stages of endemic halophyte Gypsophila oblanceolata Bark. Environ. Exp. Bot. 2012, 77, 63–76. [Google Scholar] [CrossRef]
  91. Nisar, F.; Gul, B.; Khan, M.A.; Hameed, A. Heteromorphic seeds of coastal halophytes Arthrocnemum macrostachyum and A. indicum display differential patterns of hydrogen peroxide accumulation, lipid peroxidation and antioxidant activities under increasing salinity. Plant Physiol. Biochem. 2019, 144, 58–63. [Google Scholar] [CrossRef]
  92. Aghaleh, M.; Niknam, V.; Ebrahimzadeh, H.; Razavi, K. Effect of salt stress on physiological and antioxidative responses in two species of Salicornia (S. persica and S. europaea). Acta Physiol. Plant. 2011, 33, 1261–1270. [Google Scholar] [CrossRef]
  93. Cevahir, G.; Yentur, S.; Yazgan, M.; Unal, M.; Yilmazer, N. Peroxidase activity in relation to anthocyanin and chlorophyll content in juvenile and adult leaves of “mini-star” Gazanla splendens. Pak. J. Bot. 2004, 36, 603–609. [Google Scholar]
  94. Graskova, I.A.; Zhivetyev, M.A.; Putalina, T.E.; Krasnobaev, V.A.; Voinikov, V.N. Activity and izoenzyme spectrum of peroxidase of some herbaceous plants from the bank of lake Baikal, growing under abiotic stress. Electron. Sci. J. Investig. Russ. (Issledovano v Rosii) 2010, 2010, 293–303. [Google Scholar]
  95. Jackson, M.L. Soil Chemical Analysis; New Delhi Prentice Hall of India: New Delhi, India, 1973. [Google Scholar]
  96. Lichtenthaler, H.K.; Wellburn, W.R. Determination of total carotenoids and chlorophylls a and b of leaf extracts in different solvents. Biochem. Soc. Trans. 1983, 11, 591–592. [Google Scholar] [CrossRef] [Green Version]
  97. Carmak, I.; Horst, J.H. Effects of aluminum on lipid peroxidation, superoxide dismutase, catalase, and peroxidase activities in root tips of soybean (Glycine max). Physiolgia Plant. 1991, 83, 463–468. [Google Scholar] [CrossRef]
  98. Bates, L.S.; Waldren, R.P.; Teare, I.D. Rapid determination of free proline for wate-stress studies. Plant Soil 1973, 39, 205–207. [Google Scholar] [CrossRef]
  99. Bray, H.G.; Thorpe, W.V. Analysis of phenolic compounds of interest in metabolism. Methods Biochem. Anal. 1954, 1, 27–52. [Google Scholar]
  100. Miliauskas, G.; Venskutonis, P.R.; Van Beek, T.A. Screening of radical scavenging activity of some medicinal and aromatic plant extracts. Food Chem. 2004, 85, 231–237. [Google Scholar] [CrossRef]
  101. Lowry, O.H.; Rosenbrough, N.J.; Farr, A.L.; Randall, R.L. Protein Measurements with the Folin Phenol Reagent. J. Biol. Chem. 1951, 193, 265–275. [Google Scholar] [CrossRef]
  102. Laemmli, U.K. Cleavage of structural proteins during the assembly of the head of bacteriophage T4. Nature 1970, 227, 680–685. [Google Scholar] [CrossRef] [PubMed]
  103. Smith, H.H.; Hamill, D.E.; Weaver, E.A.; Thompson, K.H. Multiple molecular forms of peroxidases and esterases among Nicotiana species and amphidiploids. J. Hered. 1970, 61, 203–212. [Google Scholar] [CrossRef]
  104. Seevers, P.M.; Daly, J.M.; Catedral, F.F. The role of peroxidase isozymes in resistance to wheat stem rust disease. Plant Physiol. 1971, 48, 353–360. [Google Scholar] [CrossRef] [PubMed] [Green Version]
  105. Schneider, C.A.; Rasband, W.S.; Eliceiri, K.W. NIH image to imageJ: 25 years of image analysis. Nature Methods 2012, 9, 671–675. [Google Scholar] [CrossRef] [PubMed]
Figure 1. Shoot fresh weights of S. europaea, S. fruticosa and A. macrostachyum under different NaCl concentrations. Mean ± SE of three replicates. Different letters indicate significant differences (p < 0.05).
Plants 10 01100 g001
Figure 2. Root fresh weights of S. europaea, S. fruticosa and A. macrostachyum under different NaCl concentrations. Mean ± SE of three replicates. Different letters indicate significant differences (p < 0.05).
Plants 10 01100 g002
Figure 3. Shoot dry weights of S. europaea, S. fruticosa and A. macrostachyum under different NaCl concentrations. Mean ± SE of three replicates. Different letters indicate significant differences (p < 0.05).
Plants 10 01100 g003
Figure 4. Root dry weights of S. europaea, S. fruticosa and A. macrostachyum under different NaCl concentrations. Mean ± SE of three replicates. Different letters indicate significant differences (p < 0.05).
Plants 10 01100 g004
Figure 5. Chlorophyll a contents of S. europaea, S. fruticosa and A. macrostachyum under different NaCl concentrations. Mean ± SE of three replicates. Different letters indicate significant differences (p < 0.05).
Plants 10 01100 g005
Figure 6. Chlorophyll b contents of S. europaea, S. fruticosa and A. macrostachyum under different NaCl concentrations. Mean ± SE of three replicates. Different letters indicate significant differences (p < 0.05).
Plants 10 01100 g006
Figure 7. Chlorophyll a/b ratios of S. europaea, S. fruticosa and A. macrostachyum under different NaCl concentrations. Mean ± SE of three replicates. Different letters indicate significant differences (p < 0.05).
Plants 10 01100 g007
Figure 8. Carotenoids contents of S. europaea, S. fruticosa and A. macrostachyum under different NaCl concentrations. Mean ± SE of three replicates. Different letters indicate significant differences (p < 0.05).
Plants 10 01100 g008
Figure 9. Total phenol contents of S. europaea, S. fruticosa and A. macrostachyum under different NaCl concentrations. Mean ± SE of three replicates. Different letters indicate significant differences (p < 0.05).
Plants 10 01100 g009
Figure 10. Total flavonoids contents of S. europaea, S. fruticosa and A. macrostachyum under different NaCl concentrations. Mean ± SE of three replicates. Different letters indicate significant differences (p < 0.05).
Plants 10 01100 g010
Figure 11. Malondialdehyde contents of S. europaea, S. fruticosa and A. macrostachyum under different NaCl concentrations. Mean ± SE of three replicates. Different letters indicate significant differences (p < 0.05).
Plants 10 01100 g011
Figure 12. Proline contents of S. europaea, S. fruticosa and A. macrostachyum under different NaCl concentrations. Mean ± SE of three replicates. Different letters indicate significant differences (p < 0.05).
Plants 10 01100 g012
Figure 13. Esterase isozymes of S. europaea, S. fruticosa and A. macrostachyum under different NaCl concentrations.
Plants 10 01100 g013
Figure 14. Peroxidase isozymes of S. europaea, S. fruticosa and A. macrostachyum under different NaCl concentrations.
Plants 10 01100 g014
Figure 15. Principal components analysis bi-plot. Values of the studied parameters were analyzed under salinity (100 mM NaCl) with respect to control. Growth parameters (shoot fresh weight: SFW, root fresh weight: RFW, shoot dry weight: SDW, root dry weight: RDW), chlorophyll a: Chl a, chlorophyll b: Chl b, Chl a/b, carotenoids: Car, Proline: pro, malondialdehyde: MDA, phenolics: Phe, Flavonoids: Flav. In (A) Salicornia europaea, (B) Sarcocornia fruticosa, and (C) Arthrocnemum macrostachyum.
Plants 10 01100 g015
Table 1. Analysis of Na+, K+ and Ca2+ content (µmol/g DW) in root and shoot of namely Salicornia europaea, Sarcocornia fruticosa and Arthrocnemum macrostachyum under different salt concentrations. Different letters indicate significant differences.
speciesNaCl (mM)ShootRoot
Na+
(µmol g−1 DW)
K+
(µmol g−1 DW)
Ca2+
(µmol g−1 DW)
Na+
(µmol g−1 DW)
K+
(µmol g−1 DW)
Ca2+
(µmol g−1 DW)
S. europaea02217 ± 5 m387 ± 4 ef293 ± 8 j406 ± 19 k493 ± 10 c58.75 ± 6 bc
1008239 ± 12 cd607 ± 11 a2166 ± 22 b985± 9 h301 ± 13 g39 ± 3 ef
2008637 ± 10 c543 ± 11 b2300± 14 a1239 ± 12 g338 ± 11 f51.5 ± 4 cd
4008680 ± 8 c362± 12 fg2150 ± 16 b1474 ± 25 f370 ± 7 e58 ± 5 bc
6007969 ± 10 d372 ± 8 f1925± 28 d1670± 20 d375 ± 8 e66.5 ± 4 b
S. fruticosa06420 ± 10 f438± 11 d1578 ± 4 e330± 16 l337 ± 11 f13.5 ± 0.75 i
1005760 ± 11 g428± 11 d1291 ± 35 f811 ± 38 i294 ± 11 g31 ± 3 fg
2005028 ± 15 j264 ± 9 h1127 ± 28 h1006 ± 19 h468 ± 9 cd40 ± 5 ef
4004217 ± 15 k211 ± 8 i866± 35 i1560 ± 22 e397 ± 7 e55 ± 3 bcd
6008913 ± 12 b262 ± 9 h2075 ± 28 c1782 ± 22 c296 ± 8 g90 ± 2.5 a
A. macrostachyum03130 ±22 l414 ± 13 de85 ± 7 k537± 22 j454 ± 11 d16.5 ± 1 hi
1005057 ± 8 i494 ± 9 c1162 ± 7 g1202 ± 15 g671 ± 11 a25.75 ± 0.75 gh
2005736 ± 17 h336 ± 8 g1239 ± 7 g1570± 7 e496 ± 7 c46.5 ± 2.75 de
4007760 ± 12 de367 ± 8 f1664± 10 d2338 ± 17 b607 ± 11 b56 ± 1.25 bcd
60010652 ± 25 a276 ± 11 h2187 ± 7 b2693 ± 13 a620 ± 9 b64 ± 3 b
Table 2. Two-way ANOVA of salinity, species, and their interaction on all tested parameters.
ParametersSpeciesSpecies × SalinitySalinity
shoot Fresh weight*********
shoot dry weight*********
Root fresh weight*********
Root Dry weight*********
Chl a*********
Chl b*********
Carotenoids*********
Chl a/b********
MDA*********
Proline*********
phenol*********
Flavonoids*********
**: p ˂ 0.01 and ***: p ˂ 0.001.
Publisher’s Note: MDPI stays neutral with regard to jurisdictional claims in published maps and institutional affiliations.

