Article

Combined Abiotic Stresses Repress Defense and Cell Wall Metabolic Genes and Render Plants More Susceptible to Pathogen Infection

by
Nasser Sewelam
1,2,†,
Mohamed El-Shetehy
2,3,†,
Felix Mauch
3 and
Veronica G. Maurino
1,4,*
1
Institute of Developmental and Molecular Biology of Plants, Cluster of Excellence on Plant Sciences (CEPLAS), Heinrich Heine University Düsseldorf, Universitätsstraße 1, 40225 Düsseldorf, Germany
2
Department of Botany and Microbiology, Faculty of Science, Tanta University, Tanta 31773, Egypt
3
Department of Biology, University of Fribourg, 1700 Fribourg, Switzerland
4
Department of Molecular Plant Physiology, University of Bonn, Kirschalle 1, 53115 Bonn, Germany
*
Author to whom correspondence should be addressed.
These authors contributed equally to this work.
Plants 2021, 10(9), 1946; https://doi.org/10.3390/plants10091946
Submission received: 24 August 2021 / Revised: 9 September 2021 / Accepted: 16 September 2021 / Published: 18 September 2021
(This article belongs to the Section Plant Protection and Biotic Interactions)

Abstract

:
Plants are frequently exposed to simultaneous abiotic and biotic stresses, a condition that induces complex responses, negatively affects crop productivity and is becoming more exacerbated with current climate change. In this study, we investigated the effects of individual and combined heat and osmotic stresses on Arabidopsis susceptibility to the biotrophic pathogen Pseudomonas syringae pv. tomato (Pst) and the necrotrophic pathogen Botrytis cinerea (Bc). Our data showed that combined abiotic and biotic stresses caused an enhanced negative impact on plant disease resistance in comparison with individual Pst and Bc infections. Pretreating plants with individual heat or combined osmotic-heat stress strongly reduced the expression of many defense genes including pathogenesis-related proteins (PR-1 and PR-5) and the TN-13 gene encoding the TIR-NBS protein, which are involved in disease resistance towards Pst. We also found that combined osmotic-heat stress caused high plant susceptibility to Bc infection and reduced expression of a number of defense genes, including PLANT DEFENSIN 1.3 (PDF1.3), BOTRYTIS SUSCEPTIBLE 1 (BOS1) and THIONIN 2.2 (THI2.2) genes, which are important for disease resistance towards Bc. The impaired disease resistance against both Pst and Bc under combined abiotic stress is associated with reduced expression of cell wall-related genes. Taken together, our data emphasize that the combination of global warming-associated abiotic stresses such as heat and osmotic stresses makes plants more susceptible to pathogen infection, thus threatening future global food security.

Graphical Abstract

1. Introduction

The industrial revolution has increased the global atmospheric carbon dioxide concentration and the average global temperatures [1], both affecting plant physiological functions. These climatic changes also modify the interactions among plants, pathogens and their ecosystems [2]. Climate change is threatening crop yields worldwide [3,4]. For example, there is a decline in yields of important food crops at temperatures higher than 30 °C [5]. Major crops grow well at 20 °C to 25 °C. High temperatures trigger plants to develop faster, which can interfere with the proper ripening of fruits [6]. Climate change can also cause secondary adverse effects such as flooding of low-lying cropland areas because of the rising of sea level and the melting of glaciers [7]. In addition, climate change might increase the host range of pathogens by enhancing their virulence [8]. It is foreseen that the combination of abiotic and biotic stresses will occur at higher rates in the future [9].
Plants have evolved complex defense mechanisms to cope with environmental stress. However, our knowledge on how plants coordinate defense to concurrent abiotic and biotic stresses is still limited [10,11]. The simultaneous occurrence of abiotic and biotic stresses can cause a negative, neutral or positive effect on plants depending on the abiotic stress, the plant species and the pathogen [12]. The nature, strength and timing of the abiotic stresses may change the outcome of plant-pathogen interactions [13]. Exposure to combined stresses has more prominent effects than individual stresses and the stress-induced responses are not a simple sum of the effect of individual treatments [14,15,16]. Combined abiotic and biotic stresses can employ shared signals and responsive genes [17,18]. In many cases, abiotic stresses facilitate plant colonization by pathogenic microbes by significantly affecting the plant immune system through changing gene expression patterns [9,19,20]. Abiotic stresses can thus make minor pests to become potential threats in the future [21].
The environmental conditions not only affect plant responses but also pathogen behavior. Change in temperature or water availability can enhance disease development. For instance, each pathogen has an optimum temperature for growth and virulence [22]. Small temperature fluctuations can increase the susceptibility of potato against Phytophthora infestans [23]. High temperature was reported to increase the severity of soft rot disease caused by Pectobacterium atrosepticum, through increasing the production of plant cell wall degrading enzymes [24]. Similarly, high temperature suppressed the resistance of tobacco (Nicotiana tabacum) against Tobacco Mosaic Virus and pepper (Capsicum annuum) against Tomato Spotted Wilt Virus [25,26]. Furthermore, high temperature abolished both basal and resistance (R)-gene-mediated defense responses against Pseudomonas syringae (Pst) in Arabidopsis and tobacco [27]. Although elevated temperature adversely affects type III secretion of Pst in vitro [28], it increases type III translocation of effectors into Arabidopsis during infection [29]. On the other hand, limited availability of water such as water deficit or osmotic stress, or excess water due to flooding can negatively impact both plants and microbes simultaneously [20]. To overcome drought, plants upregulate the level of the phytohormone abscisic acid (ABA), which facilitates the closure of stomata to reduce transpiration, resulting in reduction of bacterial entry via stomata [30]. Conversely, the accumulation of ABA antagonizes salicylic acid (SA) defense signaling pathways leading to abolishing SA-mediated resistance in leaves [31,32].
Extensive efforts have been made to understand plant-microbe interactions at all levels. In contrast, the impact of unfavorable environmental conditions on host-pathogen interactions is not fully decoded. Understanding these interactions is important for predicting disease outbreaks especially with current and future climate change threats [20]. Here, we analyzed how occurrence of individual and simultaneous global warming-associated abiotic challenges such as heat and osmotic stresses alter plant-pathogen interactions. For this purpose, Arabidopsis plants subjected to individual and combined osmotic and heat stresses were infected either with the biotrophic bacteria Pseudomonas syringae pv. Tomato (Pst) or the necrotrophic fungus Botrytis cinerea (Bc). Both pathogens were selected as they have different life styles; biotrophic pathogens feed on the nutrients of the living host tissues, while necrotrophic pathogens kill the host tissue and survive on its contents [33]. Our results indicated that combined global warming-associated abiotic stresses have synergistic negative effects on disease resistance compared with the individual stresses.

2. Results

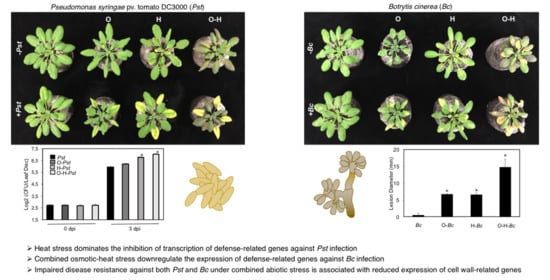
2.1. Heat and Combined Osmotic-Heat Stresses Weaken Arabidopsis Resistance to Pseudomonas syringae (Pst)

We investigated the effects of individual and combined osmotic and heat stresses on Arabidopsis susceptibility to the biotrophic pathogen Pst after three days of inoculation. Under heat or combined osmotic-heat stress, the Pst-inoculated leaves developed severe disease symptoms in the form of chlorosis (Figure 1A). In contrast, osmotic-treated plants developed mild disease symptoms (Figure 1A). The quantification of pathogen infection after three days of inoculation indicated that the osmotic stressed plants showed no significant increase in the number of bacteria compared to the Pst-treated plants. Heat stress resulted in 8.2-log2 fold increase in bacterial growth in comparison to the Pst-treated plants (Figure 1B), while plants subjected to combined osmotic-heat stress showed higher susceptibility compared to all other treatments (Figure 1B).

2.2. Combined Osmotic-Heat Stress Highly Enhances Disease Susceptibility of Arabidopsis against Botrytis Cinerea (Bc)

To analyze whether the response of abiotic-stressed plants to a biotrophic pathogen would be different from their response to a necrotrophic pathogen, we further investigated the effects of individual and combined osmotic and heat stresses on Arabidopsis susceptibility to the necrotrophic pathogen Bc. After three days of inoculation, plants that were pretreated with individual osmotic or heat stresses showed similar enhanced susceptibility levels to infection compared to the control (Figure 2A). Combined osmotic-heat stress caused much higher susceptibility, represented by larger lesions than those observed in plants under the individual stresses (Figure 2A). Quantitative analysis of the infection levels indicated that the lesion sizes in plants treated with combined Bc and osmotic or Bc- and heat stresses were significantly larger than those in plants only infected with Bc; with 11.0- and 11.2-fold increase in lesion size compared to control, respectively (Figure 2B). Plants pretreated with combined osmotic-heat stress showed a much higher increase in the lesion size (25.9-fold) when inoculated with BC compared to the control plants (Figure 2B).

2.3. Osmotic and Heat Stresses Decrease the Expression of Many Defense and Cell Wall Related Genes

The enhanced susceptibility of Arabidopsis plants against Pst and Bc infections observed after individual and combined osmotic and heat stresses prompted us to investigate the effects of these abiotic stresses on the expression levels of Arabidopsis defense related genes using our recently performed genome-wide RNA-seq analysis [16]. Among 730 genes annotated as involved in biotic stress responses in the Arabidopsis genome, we found that 77 genes showed at least 1.5-fold repression and 37 genes showed at least 1.5-fold induction under the combined osmotic-heat treatment compared to the control (Supplementary Table S1). Table 1 shows 20 highly repressed defense-related genes taking into account the individual or the combined osmotic and heat treatments. This list includes key genes involved in defense against biotrophic pathogens such as pathogenesis-related proteins-1 and -5 (PR-1 and PR-5) and TIR-NBS13 (TN13) and against necrotrophic pathogens such as plant defensin 1.2 and 1.3 (PDF1.2 and PDF1.3), botrytis susceptible 1 (BOS1) and thionin2.2 (THI2.2) (Table 1).
As the plant cell walls serve as the first line of defense against pathogens [34] and to find a link between the observed plant susceptibility and cell wall metabolism under the applied abiotic stresses, we analyzed the effects of individual and combined osmotic and heat stresses on the expression levels of genes annotated as cell wall-related [16]. Out of 532 cell wall-related genes, 90 genes showed at least 1.5-fold repression and 25 genes showed at least 1.5-fold induction under the combined osmotic-heat treatment compared to control (Supplementary Table S2). These genes encode mostly for enzymes associated with cell wall metabolism. Table 2 shows 20 highly repressed cell wall-related genes taking into account the individual or the combined osmotic and heat treatments. Among the cell wall repressed genes, the xyloglucan endotransglucosylase/hydrolases 20 and 25 (XTH20 and XTH25) and fasciclin-like arabinogalactan 2 (FLA2), showed pronounced levels of repression under the applied abiotic stresses. XTH20 and XTH25 belong to the XTH gene family and FLA2 belongs to the FLA gene family, both including many members playing crucial roles in the synthesis and integrity of plant cell walls.

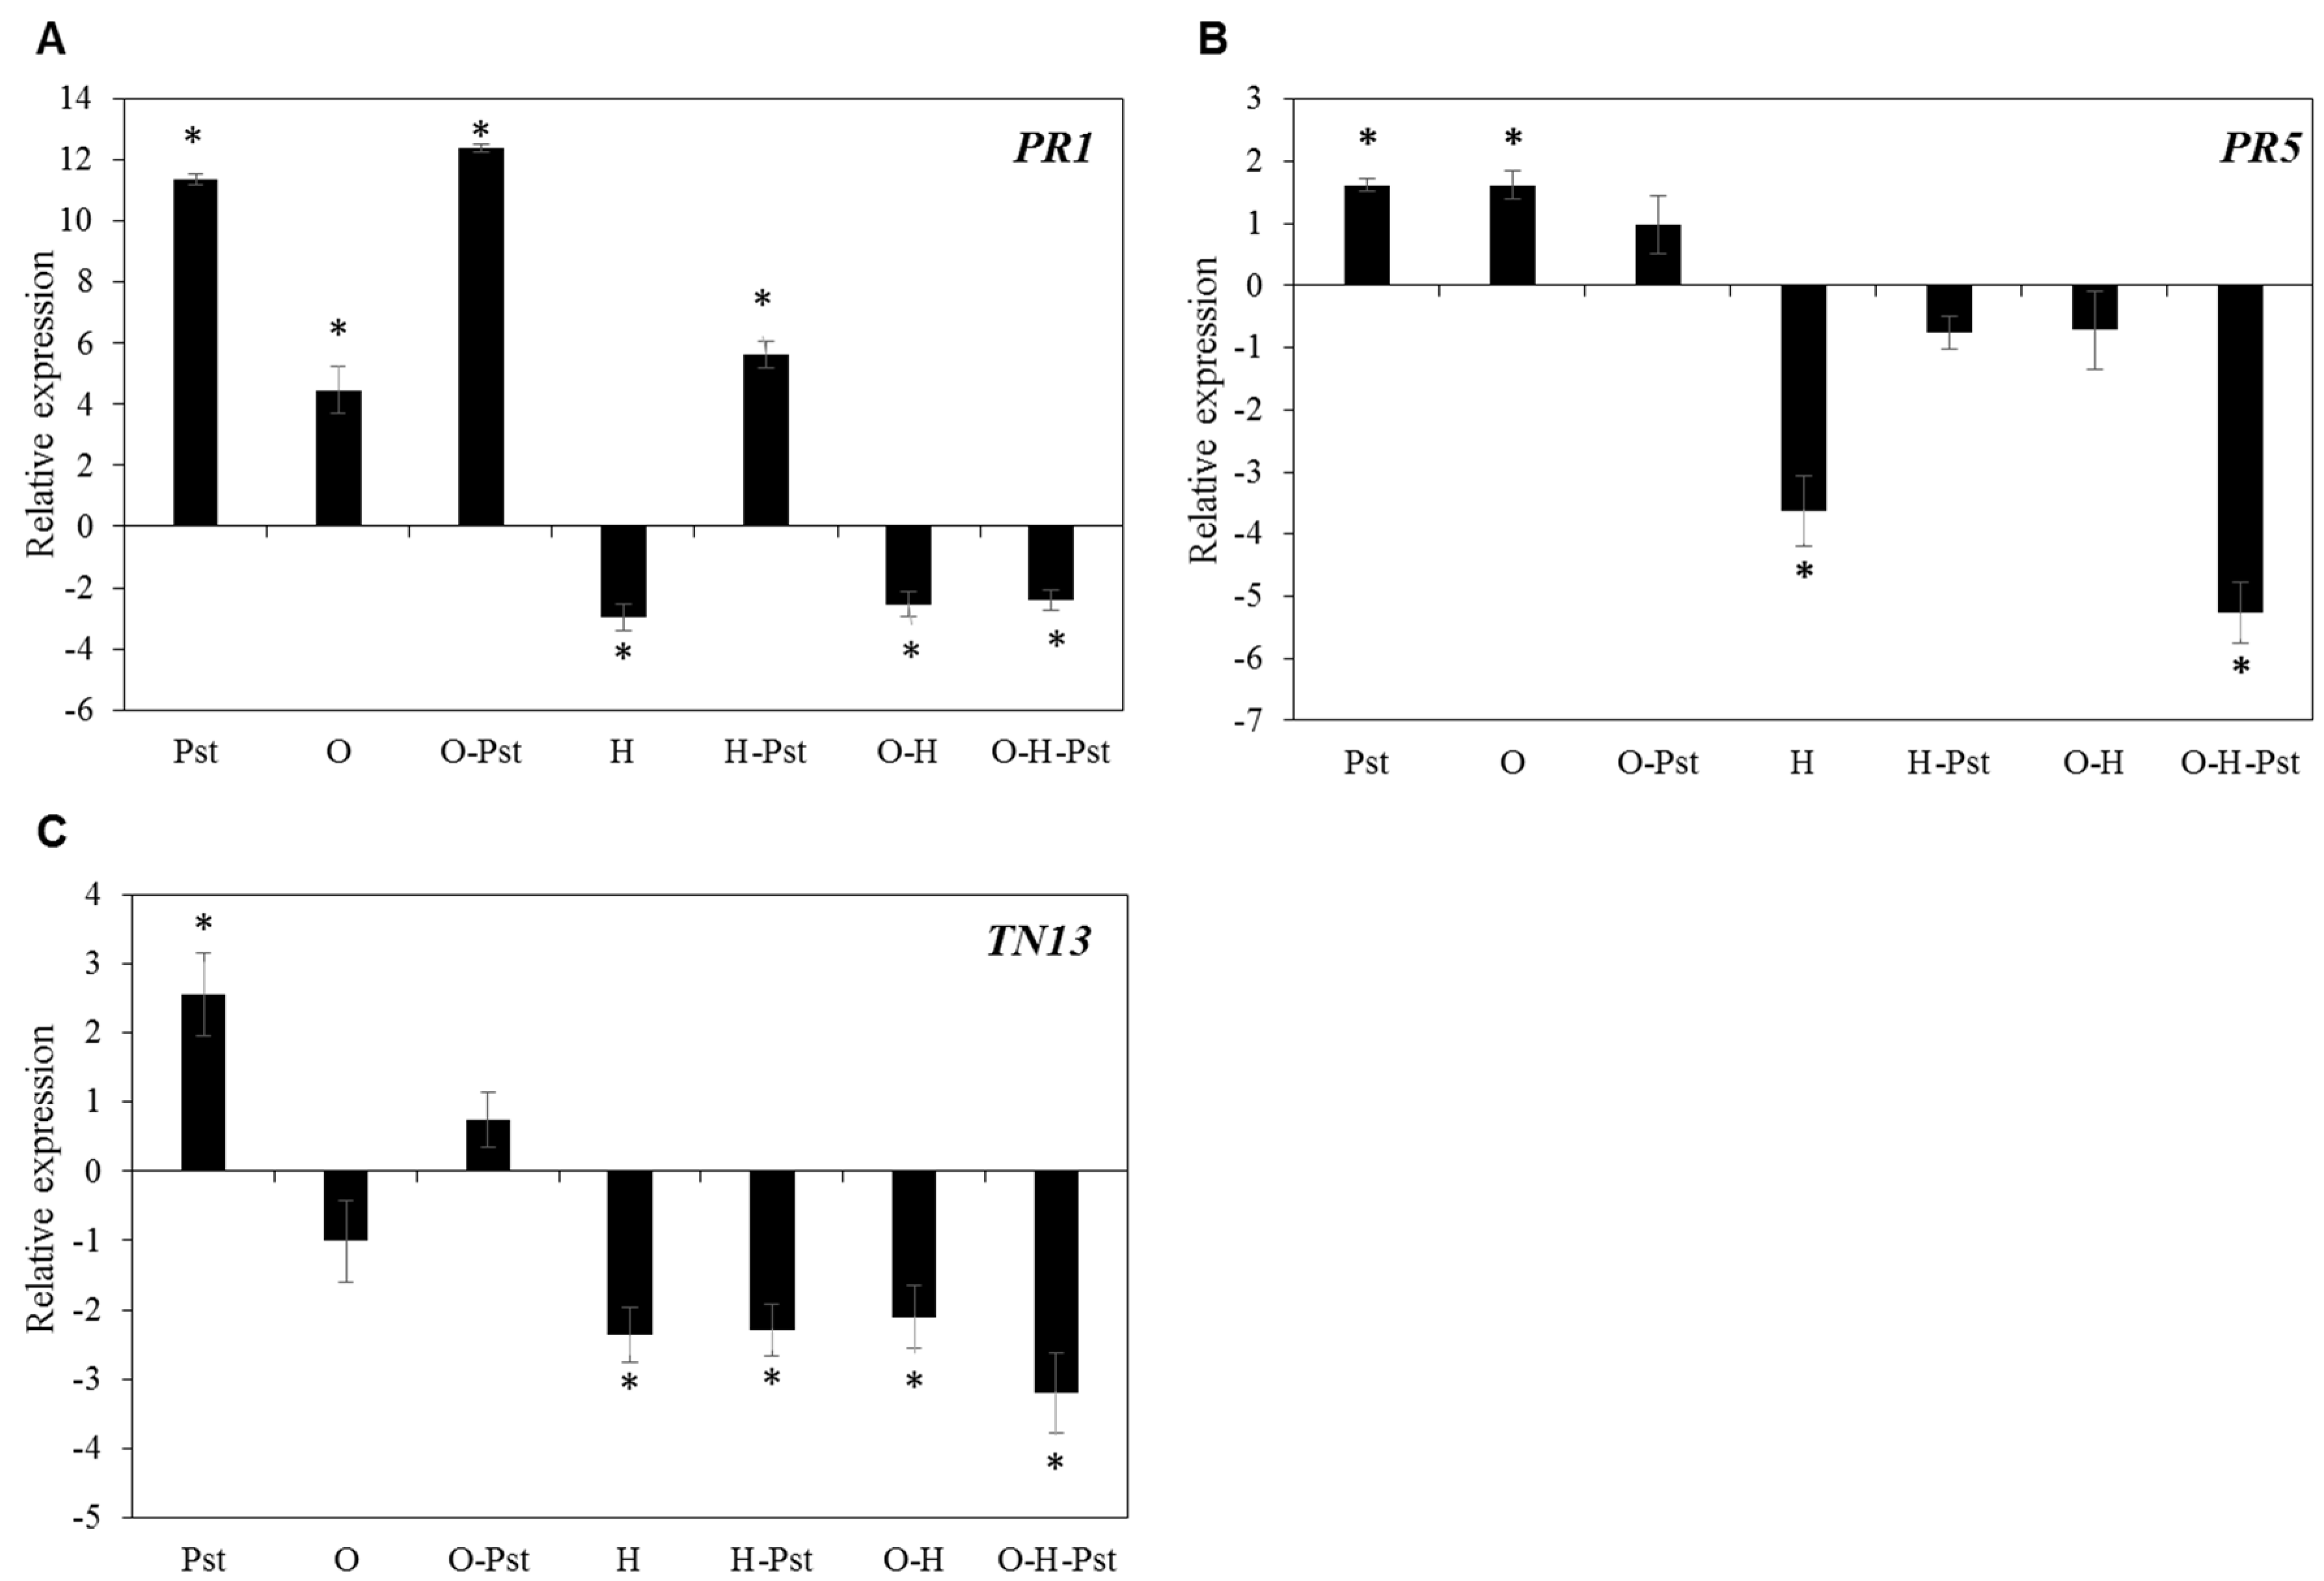
2.4. Heat Stress Dominates the Inhibition of Transcriptional Response of Defense Genes against Pst Infection

To further analyze the link between the impairment of disease resistance and genes involved in the defense response to the biotrophic bacteria Pst, we quantified the changes in expression levels of selected genes known to be involved in plant responses to biotrophic pathogens. Based on the data presented in Table 1, we selected the salicylic acid-responsive marker genes, PR-1 and PR-5 and TN13 encoding TIR-NBS protein for further analysis. Our results showed that the expression levels of PR-1, PR-5 and TN13 were highly induced after Pst infection with 11.5-, 1.6- and 2.5- log2 fold enhancement, respectively, compared to mock-treated plants (Figure 3A–C). Application of osmotic stress before infection with Pst had no considerable effect on the induction of PR-1 and PR-5 (Figure 3A,B). In contrast, osmotic stress caused 1.0-log2 fold reduction of TN-13 expression in comparison with mock-treated plants and an induction of 0.75-log2 fold after Pst inoculation, which represents 1.8-log2 fold less induction of expression than in plants treated with Pst alone (Figure 3C).
On the other hand, the expression levels of PR-1 and PR-5 were reduced under all conditions that include a pre-treatment with heat stress compared to the individual Pst treatment (Figure 3A–C). Although treatment with Pst resulted in 5.6-log2 fold increase in transcript levels of PR-1 in heat stressed plants, the induction was 5.7-log2 fold less than Pst-stressed plants (Figure 3A). Treatment with Pst could not recover the repressed gene expressions in heat-stressed plants where plants showed 0.75- and 2.3-log2 fold decrease in transcript abundance of PR-5 and TN-13, respectively, in comparison with mock-treated plants (Figure 3B,C). In addition, combined osmotic-heat stress led to 2.5, 0.72- and 2.1-log2 fold reduction in transcript abundance of PR-1, PR-5 and TN-13, respectively, relative to mock-treated plants (Figure 2A–C). Importantly, pretreating plants with combined osmotic and heat stresses led to a higher repression of the three investigated genes after infection with Pst (Figure 3A–C).

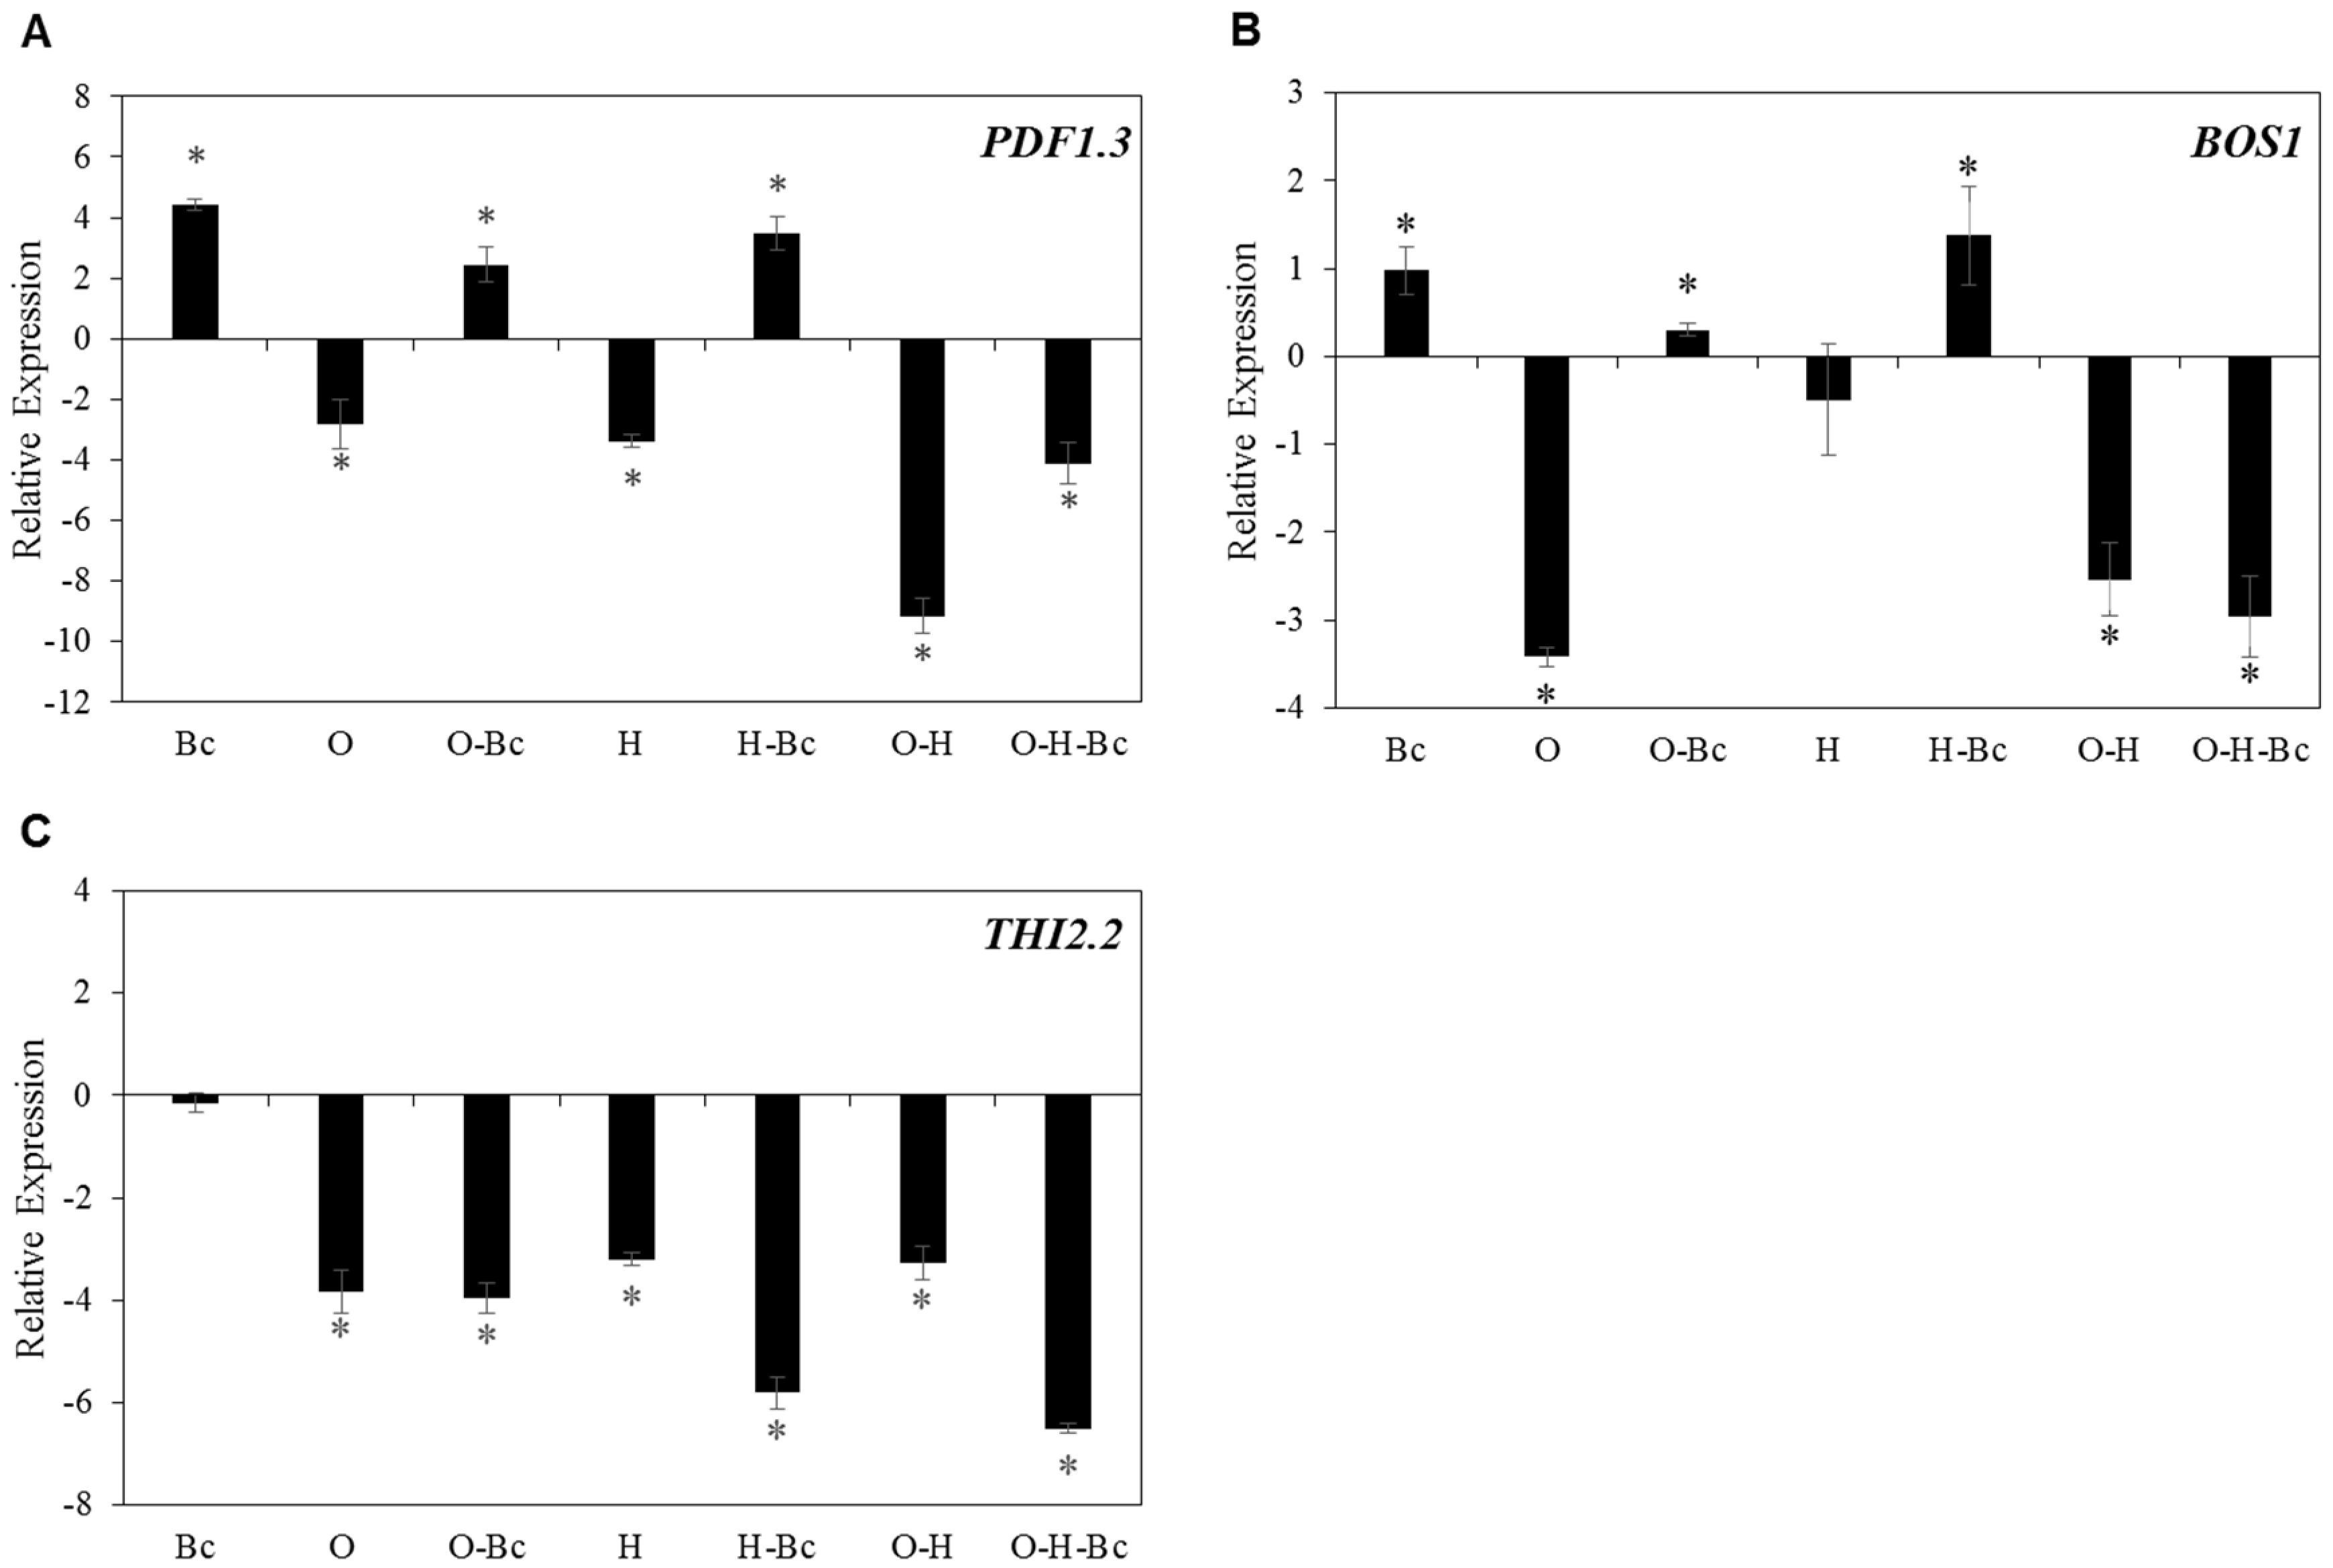
2.5. Combined Osmotic-Heat Stress Downregulate the Expression of Defense Related Genes against Bc Infection

We analyzed the effect of combined abiotic and biotic stresses on the transcript levels of selected defense genes involved in resistance against the necrotrophic fungus Bc. Based on the data presented in Table 1, we selected PDF1.3, BOS1 and THI2.2 for further analysis. Our data show that osmotic stress caused a significant decrease in the expression levels of PDF-1.3, BOS1 and THI2.2 compared to control plants (Figure 4A–C). The effect of osmotic stress on PDF-1.3 and BOS1 expression was partially compensated after Bc infection (Figure 4A,B). Combined osmotic-Bc stress caused 2.5- and 0.3-log2 fold induction of PDF-1.3 and BOS1 expression in comparison with mock-treated plants, which represent 2.0- and 0.68-log2 fold less than plants infected only with Bc (Figure 4A,B). Interestingly, combined osmotic-Bc treatment was not able to rescue the negative effect of osmotic stress alone on the expression levels of THI2.2 where it showed 4.0-log2 fold reduction of expression compared to mock-treated plants (Figure 4C).
Heat treatment caused 3.4-, 0.49- and 3.2-log2 fold reduction of expression of PDF-1.3, BOS1 and THI2.2, respectively, compared to mock-treated plants (Figure 4A–C). The reduction of expression of PDF-1.3 and BOS1 was compensated when heat-stressed plants were challenged with Bc; these plants showed 3.5- and 1.4-log2 fold increase in expression of PDF-1.3 and BOS1, respectively, in comparison with mock-treated plants (Figure 4A–C). Conversely, the expression of THI2.2 was significantly reduced in combined heat-Bc-stressed plants, which showed 5.8-log2 fold reduction of expression compared to mock-treated plants (Figure 4C). Combined osmotic-heat stress treatment led to a remarkable decrease of expression of all tested genes compared to control plants or individual Bc-stressed plants (Figure 4A–C). Infecting the osmotic-heat-stressed plants with Bc did not reverse the reduction of expression of any of the analyzed genes (Figure 4A–C).

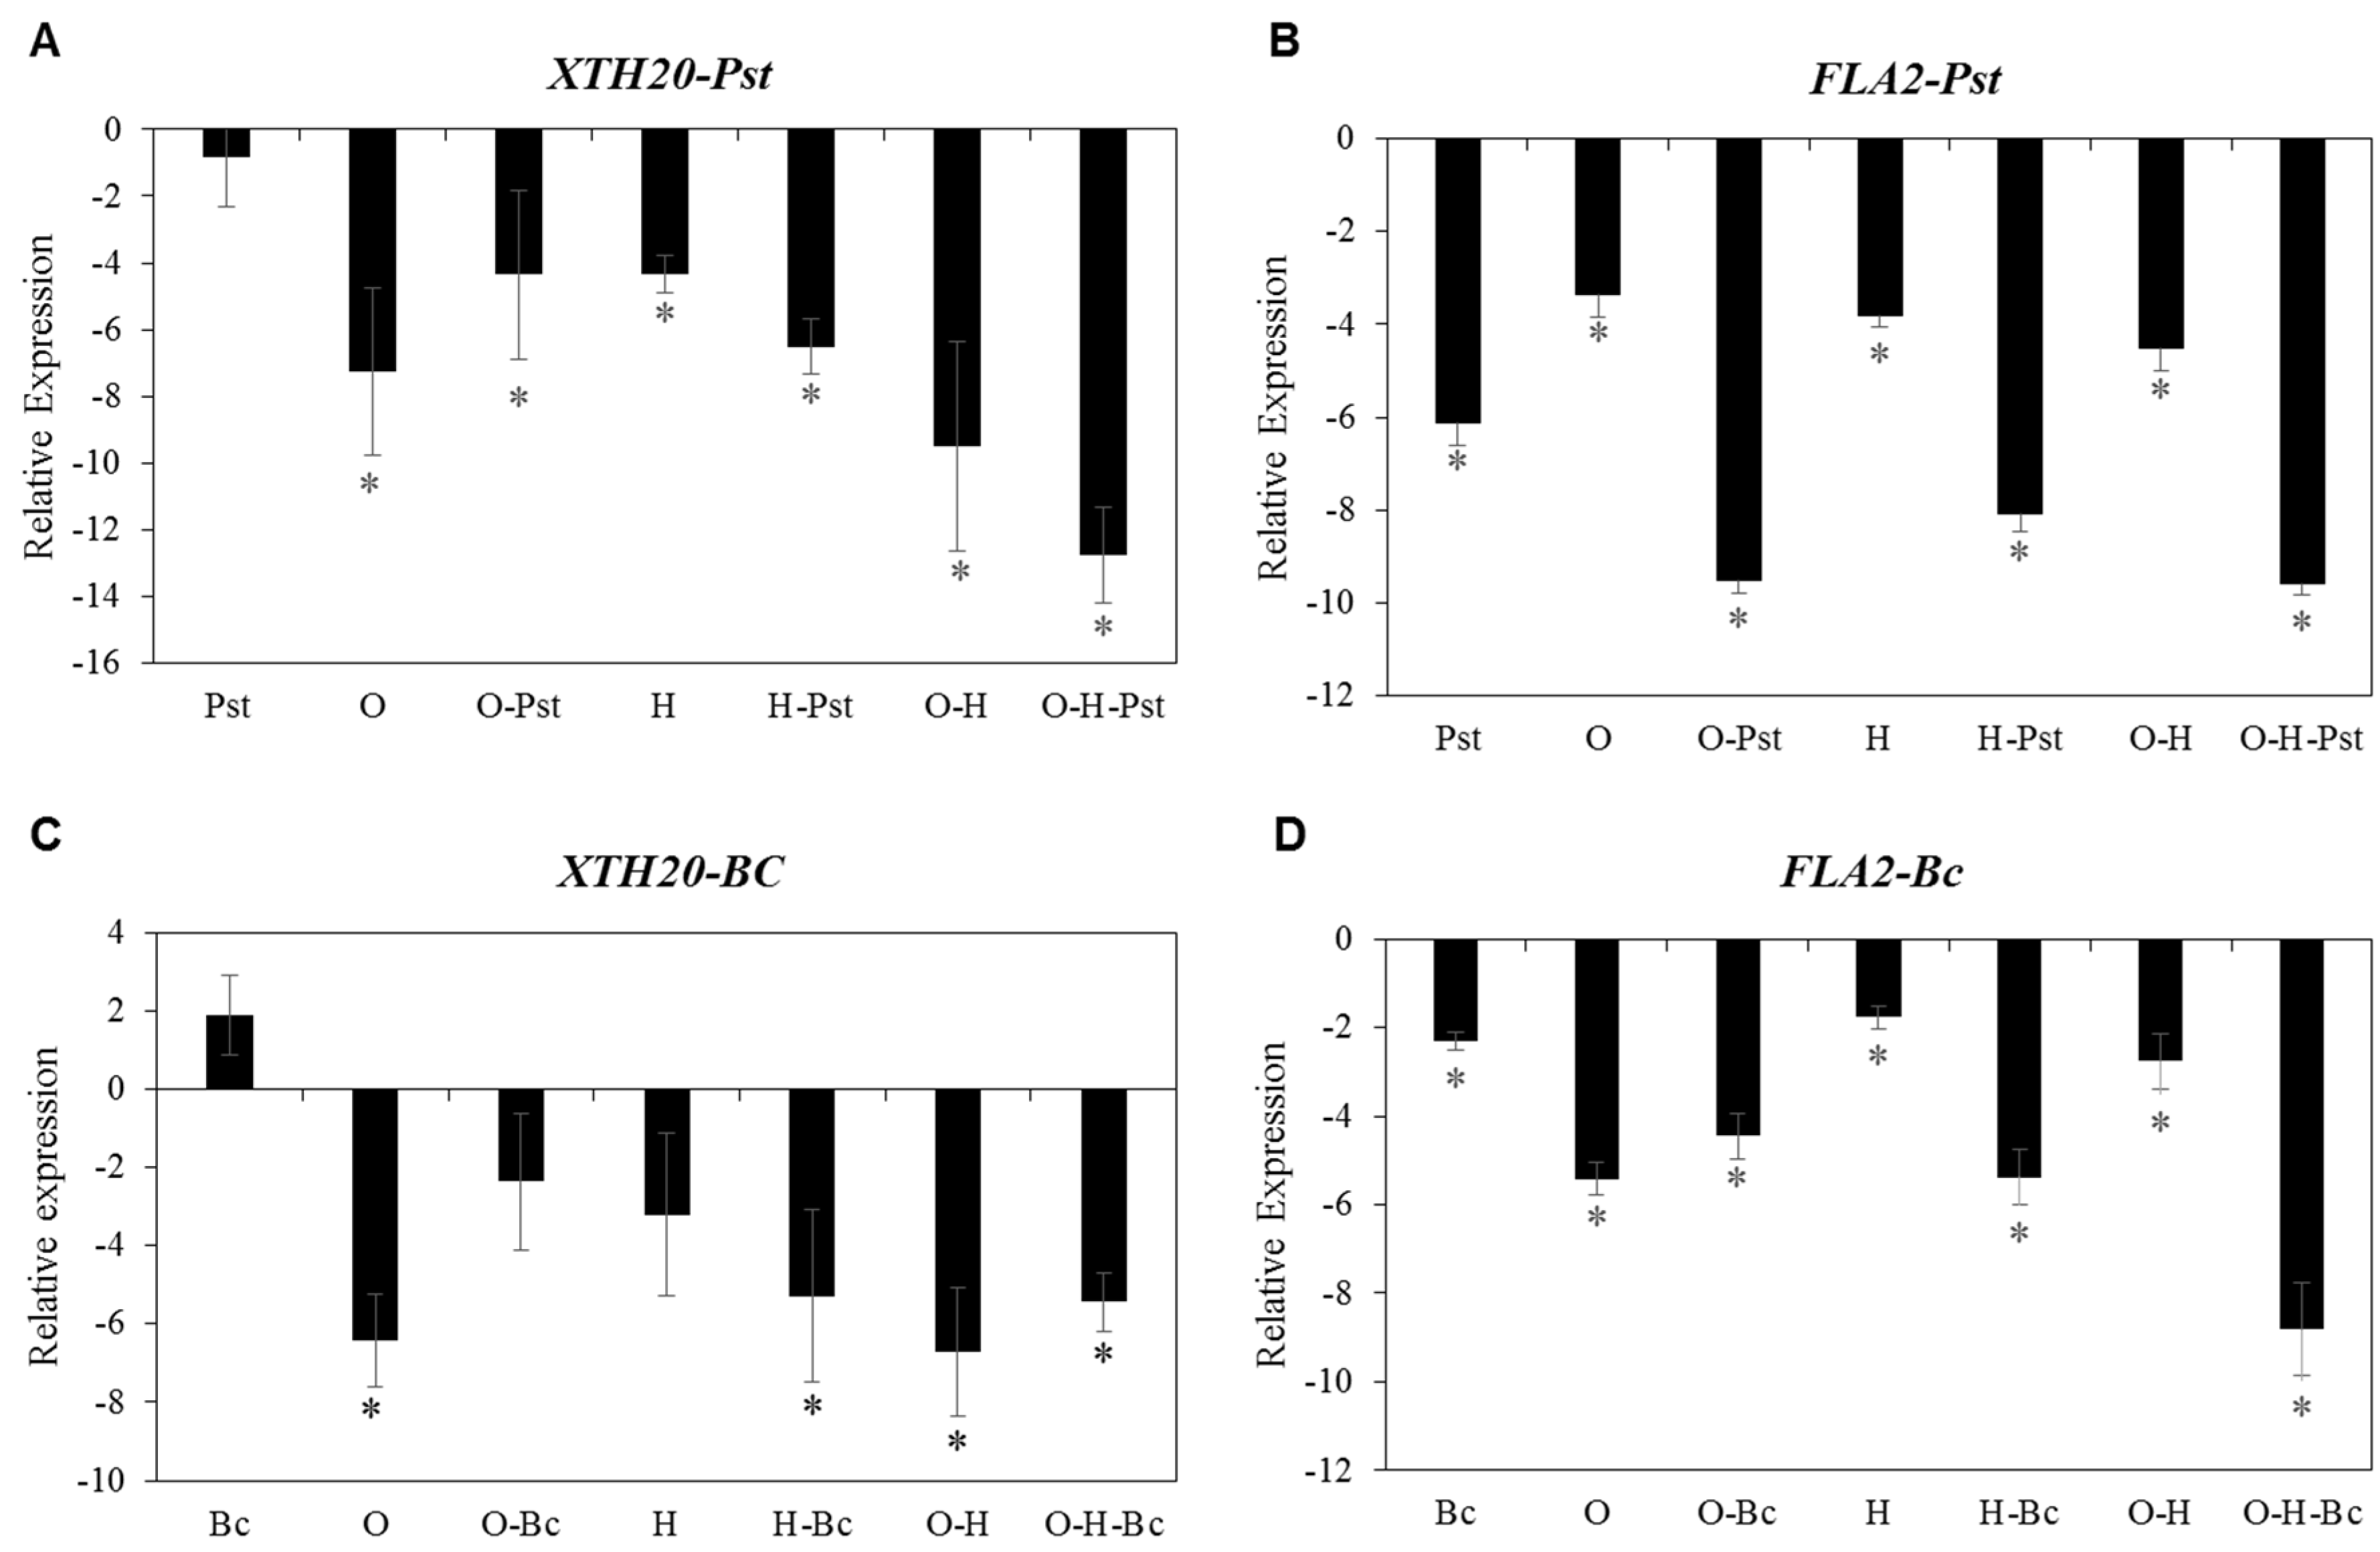
2.6. Impaired Disease Resistance against Both PST and BC under Combined Abiotic Stress Is Associated with Reduced Expression of Cell Wall-Related Genes

Among cell wall-related genes in Arabidopsis, the XTH gene family (includes 33 members) and the FLA gene family (includes 20 members) are involved in the synthesis and integrity of plant cell walls [16]. Based on data presented in Table 2, we selected two members out of these big gene families: XTH20 and FLA2 for further analysis of their expression under individual and combined abiotic and biotic stress treatments. Our results showed that all individual abiotic and combined abiotic-biotic treatments led to a significant negative effect on the expression of XTH20 in comparison with the mock-treated plants and plants infected with Pst alone. The highest downregulation of XTH20 expression was observed in plants under combined osmotic-heat-Pst stress, with a strong reduction of 12.8- and 11.9-log2 fold compared to the control and individual Pst-inoculated plants, respectively (Figure 5A). Treating Arabidopsis plants with osmotic, heat and combined osmotic-heat stresses caused a significant reduction in expression levels of FLA2 after infection with Pst and reached a reduction of 9.5-, 8.1- and 9.6-log2 fold compared to the mock-treated plants, respectively (Figure 5B).
On the other hand, individual abiotic stresses and their combination strongly repressed the transcript levels of XTH20 when plants were inoculated with Bc compared to the mock-treated control and Bc-inoculated plants (Figure 5C). The expression levels of FLA2 after osmotic, heat and osmotic-heat treatments showed 5.4-, 1.8- and 2.8-log2 fold reduction in comparison to the mock-treated plants, respectively (Figure 5D). In addition, osmotic-Bc, heat-Bc and osmotic-heat-Bc stress combinations led to a decrease in the transcript levels of FLA2 compared to the mock-treated and the Bc-inoculated plants (Figure 5D).

3. Discussion

In the current study, we investigated the responses of Arabidopsis plants treated with individual and combined abiotic stresses to infection with the biotrophic bacterial pathogen Pst and the necrotrophic fungal pathogen Bc. The data presented here showed that individual and combined osmotic and heat stresses caused a higher susceptibility to infection by both types of pathogens, which parallels a general downregulation of the expression of many defense and cell wall-related genes.
Our results indicated that heat and more importantly the combination of heat with osmotic stresses enhanced the susceptibility of Arabidopsis plants to Pst infection, which was accompanied by the downregulation of expression of many defense-related genes (Figure 1 and Figure 3 and Table S1 and Table 1). Individual heat stress was reported to abolish both basal and resistance (R)-gene-mediated defense responses and pathogen-triggered immunity signaling and resistance to Pst DC3000 in Arabidopsis plants [27,35]. Heat stress can cause enhanced basal disease susceptibility of Arabidopsis to Pst by increasing type III translocation of effectors into host plants [29,36].
We further investigated the effect of the combined global warming-associated abiotic stresses on the plant transcriptional response of selected defense-related genes to Pst. We found that the transcript levels of two salicylic acid-responsive marker genes, PR-1 and PR-5, encoding the pathogenesis-related protein 1 (PR-1) and pathogenesis-related protein 5 (PR-5), were substantially repressed in response to heat stress or the combined osmotic-heat stress (Figure 3A,B). Reduction of the activity of PR-1 under high temperature was attributed to a loss of isochorismate synthase 1 (ICS1)-mediated SA biosynthesis [29]. We also observed that the enhanced expression level of TN-13 by Pst infection was greatly reversed when the treatment with the pathogen was preceded by any of the abiotic stress treatments individually or in combination (Figure 3C). TN-13 is involved in resistance against Pst where it acts as a component of plant innate immunity that binds to MOS6/IMPORTIN in response to pathogen stimulus [37]. Thus, our results suggest an impaired defense response against Pst due to a general decrease in expression of defense-related genes after the abiotic treatments.
We found that plants treated with individual osmotic or heat stresses showed similar enhanced disease susceptibility to the necrotrophic fungus Bc compared to non-stressed plants. Notably, combined osmotic-heat stress significantly enhanced disease susceptibility to Bc compared to the individual stresses (Figure 2). This enhanced susceptibility of Arabidopsis to Bc infection after osmotic treatment, which can be used as a proxi of drought, contrasts with the proposed role of drought in enhancing resistance of tomato against Bc by increasing ABA levels [38]. The observed opposing effects on disease resistance could be species related or due to differences in stress application (osmotic vs watering withholding) and infection assays. Our data showed that the expression levels of PDF1.3 and BOS1 were reduced in comparison with mock-treated plants under the individual and combined abiotic stresses.
Interestingly, combined osmotic-heat stress followed by an inoculation of Bc did not recover the induction of the transcript levels of both genes compared to Bc treated plants (Figure 4A,B). The accumulation of plant defensins plays key roles in mediating jasmonic acid/ethylene defense response against necrotrophic pathogens such as Bc [39]. BOS1 encodes a R2R3MYB transcription factor, which is known to mediate plant responses to both biotic and abiotic stresses. In this regard, Bos1 mutant plants showed increased susceptibility to Bc [40]. Additionally, many reports demonstrated that biotic- and abiotic stress-inducible antimicrobial thionins are involved in plant defense [41,42]. This is compatible with our results showing that the individual and combined abiotic stresses caused a high significant reduction in the expression level of the THI2.2 gene compared to the controls (Figure 4C). Together, these results suggest that the enhanced disease susceptibility in Arabidopsis plants against Bc under combined abiotic stresses (Figure 2) is associated with their inability to induce defense-related genes against necrotrophic pathogen attack, the negative effect of the double abiotic stress overriding the defensive response to biotic stress.
As plant cell walls represent the first defense line against pathogen infections, we studied the effects of individual and combined stress treatments on the expression of genes annotated as cell wall-related in Arabidopsis. Individual and combined abiotic stresses highly decreased the expression of cell wall-related genes, among them XTH20 and FLA2 (Supplementary Table S2, Table 2 and Figure 5A–D). Xyloglucan endotransglucosylase/hydrolase (XTH), including XTH20, have diverse functions in cell enlargement and modification and reconstruction of the cell wall network [43]. On the other hand, Fasciclin-like arabinogalactan proteins (FLAs) are likely involved in cell wall integrity [44] and the regulation of cell wall biosynthesis [45]. Our data showed that the expression levels of XTH20 and FLA2 were highly reduced under all individual and combined abiotic stresses after pathogen infection, while we observed induction of the expression of XTH20 in plants that were only infected with Bc (Figure 5B,D). XTH20 expression is regulated by different NAC transcription factors (ANAC07, ANAC019 and ANAC055) [43,46]. Downstream target genes of ANAC07 have been reported to play a role in abiotic dehydration stress responses, secondary wall biosynthesis and defense responses [43,46]. Thus, the transcriptional changes we observed probably result from the described JA-induced expression of defense genes against Bc infection through ANAC019 and ANAC055 [43,46]. Together, these data suggest that the repressed expression of cell wall-related genes under individual and combined abiotic stresses most probably play an additive role in impairing disease resistance against both Pst and Bc.
In conclusion, our work indicates that the combination of global warming-associated abiotic stresses such as heat and drought strongly impair disease resistance against Pst and Bc shedding further light on the negative impact climate change have on plant disease resistance. Future work should focus on the analysis of mutants and overexpressing lines from the selected genes, such as those analyzed in this work, to shed light on the role of these genes under abiotic stress and to further deepen our understanding on the nature of the interactions between combined abiotic and biotic stresses. In addition, this study highlights the need for future studies to predict the severity of different climate change scenarios on plant responses to combined abiotic and biotic stresses and on crop plant productivity.

4. Materials and Methods

4.1. Growth Conditions and Abiotic Stress Treatments

Seeds of A. thaliana wild type Col-0 were sown on soil and stratified at 4 °C for 2 days. Seedlings at the four-leaf-stage were transplanted to new soil. The plants were kept in the normal growth chamber with a 16 h light/8 h dark photoperiod and 22 °C/18 °C day/night temperature. Four-week-old plants were separated into four groups and treated as follows. As a proxy for drought stress, osmotic stress treatment was applied to a group of plants by watering with a mannitol solution (200 mM) and left for 16 h according to the protocol of Sewelam et al. [14,16] before inoculation of half of these plants with Pseudomonas syringae pv. tomato (Pst) DC3000 or Botrytis cinerea (Bc). For heat stress treatment, a second group of plants was transferred to a growth chamber with a 16 h light/8 h dark photoperiod and 31 °C/27 °C day/night temperature and left for 4 h before pathogen inoculation of half of these plants. For combined osmotic-heat stress, a third group of plants were watered with mannitol solution (200 mM) and after 12 h were transferred to a growth chamber of 31 °C/27 °C day/night temperature and left for further 4 h before pathogen inoculation of half of these plants [14,16]. A fourth group of plants was kept in the normal growth chamber and used as control of abiotic stress. The experiments of infection with Pst and Bc were conducted separately and in three biological replicates.

4.2. Inoculum Preparation and Biotic Stress Treatments

Pst DC 3000 (provided by Prof. Markus Geisler, University of Fribourg, Switzerland) was prepared by inoculating a single bacterial colony in 10 mL of King’s B medium (1.5 g K2HPO4, 1.5 g MgSO4.7H2O, 20 g tryptone, 10 mL glycerol per 1 L of water) containing rifampicin (25 μg/mL). After overnight incubation on a shaker at 28 °C in the dark, the cells were centrifuged at 3000 rpm for 10 min and the pellet was suspended in 10 mM MgCl2. The optical density was measured at A600. Four leaves were infiltrated with MgCl2 or Pst. The inoculated plants were transferred to the growth chambers.
Bc strain BMM (provided by Prof. Brigitte Mauch-Mani, University of Neuchâtel, Switzerland) was grown on potato dextrose agar (PDA) plates. Spores were harvested in water and filtered via glass wool to get rid of hyphae. Spores were diluted in 1:4 strength potato dextrose broth (PDB) for inoculation. The plants were inoculated by the drop method (106 spores per mL, 20 μL droplet/leaf). To assure high humidity conditions, the inoculated plants were kept in covered trays. Control plants were mock inoculated with 1:4 strength PDB solution.

4.3. Quantification of Pathogen Infection

For quantification of Pst, leaf discs (4 mm) were harvested from the inoculated leaves at 0- and 3-day post inoculation (dpi). The leaf discs were homogenized in 10 mM MgCl2 and the undiluted (0 dpi) or the 103-fold diluted (3 dpi) homogenates were plated on King’s B agar plates. The plates were incubated at 28 °C in the dark for 48 h. Then, the bacterial colonies were counted and quantified as colony forming unit (CFU) per leaf disc [47]. For quantifying Bc, disease symptoms of inoculated plants were quantified by measuring the lesion size at 3 dpi. The lesion size on the drop-inoculated leaves was measured using a digital Mahr caliper [48].

4.4. Real Time RT-PCR Analysis

Arabidopsis leaf samples were collected 48 h after mock treatments or pathogen infections, frozen in liquid nitrogen and stored at −80° C. After grinding samples to a fine powder, total RNA was extracted from 100 mg of powder with the Spectrum Plant Total RNA Kit (Sigma Life Science, St. Louis, MI, USA). One microgram of total RNA was used for cDNA synthesis using the Omniscript Reverse Transcription Kit (Qiagen, Germany; Catalog No.205113). The reaction mixture for RT-qPCR contained 7.5 μL of 2x SensiMixTM SYBR Hi-ROX Mastermix (Bioline, Meridian Bioscience, UK; Catalog No. QT605-05), 5 μL of cDNA (corresponding to 25 ng RNA) and primers at a concentration of 10 μM in a final volume of 15 μL. Runs were performed on a MIC qPCR machine using micPCR v2.8.13 analysis program. The final qRT-PCR products were analyzed by melting point analysis. Transcript levels of PR-1, PR-5, TN-13, PDF1.3, BOS1, THI2.2, FLA2 and XTH20 in Arabidopsis plants were calculated with the plant biomass reference gene expG [49] and the comparative cycle threshold method (DDCt). The used gene-specific primers are listed in Supplementary Table S3.

4.5. Statistical Analysis

Statistical analysis was performed for a minimum of three biological replicates. Data are represented as mean ± SD. Statistical analysis was performed using IBM SPSS Statistics (version 22) using one-way ANOVA with post hoc tests.

Supplementary Materials

The following are available online at https://www.mdpi.com/article/10.3390/plants10091946/s1, Table S1. Expression levels (log2-FC) of all biotic stress related genes under abiotic stress treatments (obtained from RNA-seq analysis); Table S2. Expression levels (log2-FC) of all cell wall related genes under abiotic stress treatments (obtained from RNA-seq analysis); Table S3. Sequences of primers used for qRT-PCR.

Author Contributions

N.S., M.E.-S., F.M. and V.G.M. conceived and designed the study. M.E.-S. and N.S. performed the experiments, the statistical evaluation and prepared the figures. All co-authors contributed to writing the manuscript and approved the final version. All authors have read and agreed to the published version of the manuscript.

Funding

The research was supported by the Deutsche Forschungsgemeinschaft (DFG, German Research Foundation) through grant MA2379/11-2 and the Germany’s Excellence Strategy—EXC-2048/1—project ID 390686111 to V.G.M, and the Swiss National Science Foundation (31003A 129696 and P2FRP3_188054) and the University of Fribourg, Switzerland to F.M. M.E.-S. was supported by the Swiss State Secretariat for Education, Research and Innovation by a Swiss Government Excellence Scholarship for Foreign Scholars. Work of N.S. was in part funded by the Ministry of Higher Education of the Arab Republic of Egypt (MoHE) and a StayConnected-Grant of the Heinrich Heine University Düsseldorf.

Institutional Review Board Statement

Not applicable.

Informed Consent Statement

Not applicable.

Data Availability Statement

The data presented in this study are available in [16] and Supplementary Material here.

Conflicts of Interest

The authors declare no competing interest.

References

  1. IPCC. Climate Change 2013: The Physical Science Basis; Intergovernmental Panel on Climate Change: Cambridge, UK, 2013. [Google Scholar]
  2. Becklin, K.M.; Anderson, J.T.; Gerhart, L.M.; Wadgymar, S.M.; Wessinger, C.A.; Ward, J.K. Examining plant physiological responses to climate change through an evolutionary lens. Plant Physiol. 2016, 172, 635–649. [Google Scholar] [CrossRef]
  3. Fedoroff, N.V.; Battisti, D.S.; Beachy, R.N.; Cooper, P.J.; Fischhoff, D.A.; Hodges, C.N.; Knauf, V.C.; Lobell, D.; Mazur, B.J.; Molden, D.; et al. Radically rethinking agriculture for the 21st century. Science 2010, 327, 833–834. [Google Scholar] [CrossRef] [Green Version]
  4. Swetha, B.; Singiri, J.R.; Novoplansky, N.; Grandhi, R.; Srinivasan, J.; Khadka, J.; Galis, I.; Grafi, G. Single and combined salinity and heat stresses impact yield and dead pericarp priming activity. Plants 2021, 10, 1627. [Google Scholar] [CrossRef]
  5. Schlenker, W.; Roberts, M.J. Nonlinear temperature effects indicate severe damages to US crop yields under climate change. Proc. Nat. Acad. Sci. USA 2009, 106, 15594–15598. [Google Scholar] [CrossRef] [PubMed] [Green Version]
  6. Qaderi, M.M.; Reid, D.M. Crop responses to elevated carbon dioxide and temperature. In Climate Change and Crops; Springer: Berlin/Heidelberg, Germany, 2009; pp. 1–18. [Google Scholar]
  7. Parry, M.; Parry, M.L.; Canziani, O.; Palutikof, J.; Van der Linden, P.; Hanson, C. (Eds.) Climate Change 2007-Impacts, Adaptation and Vulnerability: Working Group II Contribution to the Fourth Assessment Report of the IPCC; Cambridge University Press: Cambridge, UK, 2007; Volume 4. [Google Scholar]
  8. Garrett, K.A.; Dendy, S.P.; Frank, E.E.; Rouse, M.N.; Travers, S.E. Climate change effects on plant disease: Genomes to ecosystems. Annu. Rev. Phytopathol. 2006, 44, 489–509. [Google Scholar] [CrossRef] [Green Version]
  9. Ramegowda, V.; Senthil-Kumar, M. The interactive effects of simultaneous biotic and abiotic stresses on plants: Mechanistic understanding from drought and pathogen combination. J. Plant Physiol. 2015, 176, 47–54. [Google Scholar] [CrossRef] [PubMed] [Green Version]
  10. Sewelam, N.; Kazan, K.; Schenk, P.M. Global plant stress signaling: Reactive oxygen species at the cross-road. Front. Plant Sci. 2016, 7, 187. [Google Scholar] [CrossRef] [PubMed] [Green Version]
  11. Hacquard, S.; Spaepen, S.; Garrido-Oter, R.; Schulze-Lefert, P. Interplay between innate immunity and the plant microbiota. Annu. Rev. Phytopathol. 2017, 55, 565–589. [Google Scholar] [CrossRef]
  12. Tippmann, H.F.; Schlüter, U.; Collinge, D.B. Common themes in biotic and abiotic stress signalling in plants. In Floriculture, Ornamental and Plant Biotechnology; Global Science Books: London, UK, 2006; pp. 52–67. [Google Scholar]
  13. Bostock, R.M.; Pye, M.F.; Roubtsova, T.V. Predisposition in plant disease: Exploiting the nexus in abiotic and biotic stress perception and response. Annu. Rev. Phytopathol. 2014, 52, 517–549. [Google Scholar] [CrossRef] [Green Version]
  14. Sewelam, N.; Oshima, Y.; Mitsuda, N.; Ohme-Takagi, M. A step towards understanding plant responses to multiple environmental stresses: A genome-wide study. Plant Cell Environ. 2014, 37, 2024–2035. [Google Scholar] [CrossRef]
  15. Bai, Y.; Kissoudis, C.; Yan, Z.; Visser, R.G.; van der Linden, G. Plant behaviour under combined stress: Tomato responses to combined salinity and pathogen stress. Plant J. 2018, 93, 781–793. [Google Scholar] [CrossRef] [Green Version]
  16. Sewelam, N.; Brilhaus, D.; Bräutigam, A.; Alseekh, S.; Fernie, A.R.; Maurino, V.G. Molecular plant responses to combined abiotic stresses put a spotlight on unknown and abundant genes. J. Exp. Bot. 2020, 71, 5098–5112. [Google Scholar] [CrossRef]
  17. Chan, Z. Expression profiling of ABA pathway transcripts indicates crosstalk between abiotic and biotic stress responses in Arabidopsis. Genomics 2012, 100, 110–115. [Google Scholar] [CrossRef] [PubMed] [Green Version]
  18. Ma, S.; Bohnert, H.J. Integration of Arabidopsis thaliana stress-related transcript profiles, promoter structures, and cell-specific expression. Genome Biol. 2007, 8, R49. [Google Scholar] [CrossRef] [Green Version]
  19. Gentleman, R.C.; Carey, V.J.; Bates, D.M.; Bolstad, B.; Dettling, M.; Dudoit, S.; Ellis, B.; Gautier, L.; Ge, Y.; Gentry, J.; et al. Bioconductor: Open software development for computational biology and bioinformatics. Genome Biol. 2004, 5, R80. [Google Scholar] [CrossRef] [PubMed] [Green Version]
  20. Cheng, Y.T.; Zhang, L.; He, S.Y. Plant-microbe interactions facing environmental challenge. Cell Host Microbe 2019, 26, 183–192. [Google Scholar] [CrossRef] [PubMed]
  21. Duveiller, E.; Singh, R.; Nicol, J. The challenges of maintaining wheat productivity: Pests, diseases, and potential epidemics. Euphytica 2007, 157, 417–430. [Google Scholar] [CrossRef]
  22. Velásquez, A.C.; Castroverde, C.D.M.; He, S.Y. Plant–pathogen warfare under changing climate conditions. Curr. Biol. 2018, 28, R619–R634. [Google Scholar] [CrossRef] [Green Version]
  23. Shakya, S.K.; Goss, E.M.; Dufault, N.S.; van Bruggen, A.H.C. Potential effects of diurnal temperature oscillations on potato late blight with special reference to climate change. Phytopathology 2015, 105, 230–238. [Google Scholar] [CrossRef] [Green Version]
  24. Hasegawa, H.; Chatterjee, A.; Cui, Y.; Chatterjee, A.K. Elevated temperature enhances virulence of Erwinia carotovora subsp. carotovora strain EC153 to plants and stimulates production of the quorum sensing signal, N-acyl homoserine lactone, and extracellular proteins. Appl. Environ. Microbiol. 2005, 71, 4655–4663. [Google Scholar] [CrossRef] [Green Version]
  25. Moury, B.; Selassie, K.G.; Marchoux, G.; Daubèze, A.M.; Palloix, A. High temperature effects on hypersensitive resistance to tomato spotted wilt tospovirus (TSWV) in pepper (Capsicum chinense Jacq.). Eur. J. Plant Pathol. 1998, 104, 489–498. [Google Scholar] [CrossRef]
  26. Király, L.; Hafez, Y.M.; Fodor, J.; Király, Z. Suppression of tobacco mosaic virus-induced hypersensitive-type necrotization in tobacco at high temperature is associated with downregulation of NADPH oxidase and superoxide and stimulation of dehydroascorbate reductase. J. Gen. Virol. 2008, 89, 799–808. [Google Scholar] [CrossRef] [PubMed]
  27. Wang, Y.; Bao, Z.; Zhu, Y.; Hua, J. Analysis of temperature modulation of plant defense against biotrophic microbes. Mol. Plant.-Microbe Interact. 2009, 22, 498–506. [Google Scholar] [CrossRef] [PubMed] [Green Version]
  28. Smirnova, A.; Li, H.; Weingart, H.; Aufhammer, S.; Burse, A.; Finis, K.; Schenk, A.; Ullrich, M.S. Thermoregulated expression of virulence factors in plant-associated bacteria. Arch. Microbiol. 2001, 176, 393–399. [Google Scholar] [CrossRef] [PubMed]
  29. Huot, B.; Castroverde, C.D.M.; Velásquez, A.C.; Hubbard, E.; Pulman, J.A.; Yao, J.; Childs, K.L.; Tsuda, K.; Montgomery, B.L.; He, S.Y. Dual impact of elevated temperature on plant defence and bacterial virulence in Arabidopsis. Nat. Commun. 2017, 8, 1808. [Google Scholar] [CrossRef] [PubMed]
  30. Zhu, J.K. Abiotic stress signaling and responses in plants. Cell 2016, 16, 313–324. [Google Scholar] [CrossRef] [Green Version]
  31. Mauch-Mani, B.; Mauch, F. The role of abscisic acid in plant–pathogen interactions. Curr. Opin. Plant Biol. 2005, 8, 409–414. [Google Scholar] [CrossRef]
  32. Jiang, C.J.; Shimono, M.; Sugano, S.; Kojima, M.; Yazawa, K.; Yoshida, R.; Inoue, H.; Hayashi, N.; Sakakibara, H.; Takatsuji, H. Abscisic acid interacts antagonistically with salicylic acid signaling pathway in rice–Magnaporthe grisea interaction. Mol. Plant. Microbe Interact. 2010, 23, 791–798. [Google Scholar] [CrossRef] [Green Version]
  33. Stone, J.K. Necrotroph. Encycl. Plant Pathol. 2001, 2, 676–677. [Google Scholar]
  34. Houston, K.; Tucker, M.R.; Chowdhury, J.; Shirley, N.; Little, A. The plant cell wall: A complex and dynamic structure as revealed by the responses of genes under stress conditions. Front. Plant Sci. 2016, 7, 984. [Google Scholar] [CrossRef] [Green Version]
  35. Janda, M.; Lamparová, L.; Zubíková, A.; Burketová, L.; Martinec, J.; Krčková, Z. Temporary heat stress suppresses PAMP-triggered immunity and resistance to bacteria in Arabidopsis thaliana. Mol. Plant Pathol. 2019, 20, 1005–1012. [Google Scholar] [CrossRef] [PubMed] [Green Version]
  36. Gangappa, S.N.; Berriri, S.; Kumar, S.V. PIF4 coordinates thermosensory growth and immunity in Arabidopsis. Curr. Biol. 2017, 27, 243–249. [Google Scholar] [CrossRef] [PubMed] [Green Version]
  37. Roth, C.; Lüdke, D.; Klenke, M.; Quathamer, A.; Valerius, O.; Braus, G.H.; Wiermer, M. The truncated NLR protein TIR-NBS13 is a MOS6/IMPORTIN-α3 interaction partner required for plant immunity. Plant J. 2017, 92, 808–821. [Google Scholar] [CrossRef] [PubMed]
  38. Achuo, E.A.; Prinsen, E.; Höfte, M. Influence of drought, salt stress and abscisic acid on the resistance of tomato to Botrytis cinerea and Oidium neolycopersici. Plant Pathol. 2006, 55, 178–186. [Google Scholar] [CrossRef]
  39. Moffat, C.S.; Ingle, R.A.; Wathugala, D.L.; Saunders, N.J.; Knight, H.; Knight, M.R. ERF5 and ERF6 play redundant roles as positive regulators of JA/Et-mediated defense against Botrytis cinerea in Arabidopsis. PLoS ONE 2012, 7, e35995. [Google Scholar] [CrossRef] [PubMed] [Green Version]
  40. Mengiste, T.; Chen, X.; Salmeron, J.; Dietrich, R. The BOTRYTIS SUSCEPTIBLE1 gene encodes an R2R3MYB transcription factor protein that is required for biotic and abiotic stress responses in Arabidopsis. Plant Cell 2003, 15, 2551–2565. [Google Scholar] [CrossRef] [Green Version]
  41. Epple, P.; Apel, K.; Bohlmann, H. Overexpression of an endogenous thionin enhances resistance of Arabidopsis against Fusarium oxysporum. Plant Cell 1997, 9, 509–520. [Google Scholar]
  42. Donoghue, M.T.; Keshavaiah, C.; Swamidatta, S.H.; Spillane, C. Evolutionary origins of Brassicaceae specific genes in Arabidopsis thaliana. BMC Evol. Biol. 2011, 11, 47. [Google Scholar] [CrossRef] [Green Version]
  43. Pitaksaringkarn, W.; Matsuoka, K.; Asahina, M.; Miura, K.; Sage-Ono, K.; Ono, M.; Yokoyama, R.; Nishitani, K.; Ishii, T.; Iwai, H.; et al. XTH 20 and XTH 19 regulated by ANAC 071 under auxin flow are involved in cell proliferation in incised Arabidopsis inflorescence stems. Plant J. 2014, 80, 604–614. [Google Scholar] [CrossRef] [Green Version]
  44. Griffiths, J.S.; Tsai, A.Y.L.; Xue, H.; Voiniciuc, C.; Šola, K.; Seifert, G.J.; Mansfield, S.D.; Haughn, G.W. SALT-OVERLY SENSITIVE5 mediates Arabidopsis seed coat mucilage adherence and organization through pectins. Plant Physiol. 2014, 165, 991–1004. [Google Scholar] [CrossRef] [Green Version]
  45. Seifert, G.J.; Xue, H.; Acet, T. The Arabidopsis thaliana FASCICLIN LIKE ARABINOGALACTAN PROTEIN 4 gene acts synergistically with abscisic acid signalling to control root growth. Ann. Bot. 2014, 114, 1125–1133. [Google Scholar] [CrossRef] [Green Version]
  46. Bu, Q.; Jiang, H.; Li, C.B.; Zhai, Q.; Zhang, J.; Wu, X.; Sun, J.; Xie, Q.; Li, C. Role of the Arabidopsis thaliana NAC transcription factors ANAC019 and ANAC055 in regulating jasmonic acid-signaled defense responses. Cell Res. 2008, 18, 756–767. [Google Scholar] [CrossRef] [Green Version]
  47. Wang, C.; El-Shetehy, M.; Shine, M.B.; Yu, K.; Navarre, D.; Wendehenne, D.; Kachroo, A.; Kachroo, P. Free radicals mediate systemic acquired resistance. Cell Rep. 2014, 7, 348–355. [Google Scholar] [CrossRef]
  48. L’haridon, F.; Besson-Bard, A.; Binda, M.; Serrano, M.; Abou-Mansour, E.; Balet, F.; Schoonbeek, H.J.; Hess, S.; Mir, R.; Léon, J.; et al. A permeable cuticle is associated with the release of reactive oxygen species and induction of innate immunity. PLoS Pathog. 2011, 7, e1002148. [Google Scholar] [CrossRef]
  49. Czechowski, T.; Stitt, M.; Altmann, T.; Udvardi, M.K.; Scheible, W.R. Genome-wide identification and testing of superior reference genes for transcript normalization in Arabidopsis. Plant Physiol. 2005, 139, 5–17. [Google Scholar] [CrossRef] [Green Version]
Figure 1. Effect of individual and combined osmotic and heat stresses on plant susceptibility to Pseudomonas syringae pv. tomato DC3000 (Pst). (A) Phenotype of stressed Arabidopsis (Col-0) plants. Plants were infected with Pst 16 h after the abiotic stress treatments. Photos were taken 3 d after Pst-inoculation. (B) Bacterial growth on leaves, quantified at 0 and 3 dpi (days post-infection) and expressed as Log2 values of colony forming units (CFU). O: osmotic stress, H: heat. Bars represent the mean and standard deviation of three biological replicates. Asterisks indicate significant differences, 1-way ANOVA; post-hoc LSD, * p < 0.05.
Plants 10 01946 g001
Figure 2. Effect of individual and combined osmotic and heat stresses on plant susceptibility to Botrytis cinerea (Bc). (A) Phenotype of stressed Arabidopsis (Col-0) plants. Plants were infected with Bc 16 h after the abiotic stress treatments. Photos were taken 3 d after Bc-inoculation. (B) Infection degree as lesion size on leaves, measured 3 dpi (days post-infection). O: osmotic stress, H: heat. Bars represent the mean and standard deviation of three biological replicates. Asterisks indicate significant differences, 1-way ANOVA; post-hoc LSD, * p < 0.05.
Plants 10 01946 g002
Figure 3. Effect of individual and combined osmotic, heat and Pseudomonas syringae pv. tomato DC3000 (Pst) treatments on the expression of AtPR-1 (A), AtPR-5 (B) and AtTN-13 (C) genes in Arabidopsis (Col-0) plants. Pst was applied 16 h after the abiotic stress treatments. Leaves were sampled 48 h after MgCl2 (mock) or Pst treatments. O: osmotic stress, H: heat. Data are represented as log2 fold change, normalized with reference gene (plant biomass expressed protein, expG) and relative to the mock-treated control. The zero-line represents MgCl2-infiltrated (mock) plants. Bars represent the mean and standard deviation of three biological replicates. Asterisks indicate significant differences, 1-way ANOVA; post-hoc LSD, * p < 0.05.
Plants 10 01946 g003
Figure 4. Effect of individual and combined osmotic, heat and Botrytis cinerea (Bc) treatments on the expression of AtPDF1-3 (A), AtBOS1 (B) and AtTHI2.2 (C) genes in Arabidopsis plants (Col-0). Bc was applied 16 h after the abiotic stress treatments. Leaves were sampled 48 h after ¼ strength PDB solution (mock) or Bc treatments. O: osmotic stress, H: heat. Data are represented as log2 fold change, normalized with reference gene (plant biomass expressed protein, expG) and relative to the control. The zero-line represents plants mock-treated with ¼ strength PDB solution. Bars represent the mean and standard deviation of three biological replicates. Asterisks indicate significant differences, 1-way ANOVA; post-hoc LSD, * p < 0.05.
Plants 10 01946 g004
Figure 5. Effect of individual and combined osmotic, heat, Pseudomonas syringae pv. tomato DC3000 (Pst) (A,B) or Botrytis cinerea (Bc) (A,D) treatments on the expression of AtXTH20 (A,C) and AtFLA2 (B,D) genes in Arabidopsis plants (Col-0). Pst and Bc were applied 16 h after the abiotic stress treatments. Leaves were sampled 48 h after mock or pathogen treatments. O: osmotic stress, H: heat. Data are represented as log2 fold change, normalized with reference gene (plant biomass expressed protein, expG) and relative to the control. The zero-line represents mock treated plants. Bars represent the mean and standard deviation of three biological replicates. Asterisks indicate significant differences, 1-way ANOVA; post-hoc LSD, * p < 0.05.
Plants 10 01946 g005
Table 1. List of 20 highly repressed defense-related genes taking into account the individual or the combined osmotic and heat treatment.
Gene LocusGene NameAbiotic Stress Treatment
OHO-H
AT3G22231PCC1 (pathogen and circadian controlled 1)−5.16−14.93−27.67
AT1G33960AIG1 (AVRRPT2-INDUCED GENE 1)−3.99−5.91−8.38
AT1G65390PP2-A5 (phloem protein 2 A5)−2.04−5.24−8.12
AT1G33950AIG1 (avirulence induced gene family protein)−6.02−5.06−6.19
AT1G13609Defensin-like (DEFL) family protein−11.13−2.69−6.07
AT1G59780NB-ARC domain-containing disease resistance protein−2.12−5.25−5.42
AT3G48080Alpha/beta-Hydrolases superfamily protein−1.67−2.87−4.29
AT2G14580PRB1 (basic pathogenesis-related protein 1)−1.79−1.93−4.29
AT2G14610PR1 (pathogenesis-related gene 1)−3.32−3.08−4.10
AT5G25910RLP52 (receptor like protein 52)1.98−3.12−3.83
AT5G44430PDF1.2c (plant defensin 1.2C)−5.81−4.11−3.81
AT5G44420PDF1.2 (plant defensin 1.2)−6.00−4.52−3.69
AT3G04210TN13 (Disease resistance protein, TIR-NBS class)−1.43−2.83−3.42
AT5G24200PR-protein, Alpha/beta-Hydrolases superfamily protein−2.66−5.08−3.36
AT2G26010PDF1.3 (plant defensin 1.3)−8.33−3.34−3.24
AT3G48720DCF (HXXXD-type acyl-transferase family protein)−1.42−2.94−3.19
AT2G26020PDF1.2b (plant defensin 1.2b)−2.24−3.77−2.27
AT5G36910THI2.2 (thionin 2.2)−2.051.06−1.96
AT1G75040PR5 (pathogenesis-related gene 5)3.11−2.621.94
AT3G06490MYB108 or BOS1 (Botrytis-susceptible1)−1.82−1.20−1.53
O: osmotic stress; H: heat; O-H: osmotic and heat stress. Numbers indicate fold changes. The negative signs indicate repression, i.e., −27.67 means that gene expression is 27.67-fold lower under treatment. Genes are ordered from the most to the less repressed expression after combined osmotic-heat treatment.
Table 2. List of 20 highly repressed cell wall-related genes by the individual or combined osmotic and heat treatments.
Gene LocusGene Name/FunctionAbiotic Stress Treatment
OHO-H
AT5G57550XTH25 (xyloglucan endotransglucosylase/hydrolase 25)−4.94−1.94−10.34
AT4G13410ATCSLA15 (encodes a gene similar to cellulose synthase)−2.03−6.30−8.47
AT5G48070XTH20 (xyloglucan endotransglucosylase/hydrolase 20)−1.44−8.72−7.18
AT4G15320CSLB06 (cellulose synthase-like B6)−1.69−6.94−5.40
AT1G19940GH9B5 (glycosyl hydrolase 9B5)−1.16−4.64−4.73
AT2G20870Cell wall protein precursor−1.31−2.51−4.40
AT2G45220Plant invertase/pectin methylesterase inhibitor−2.43−2.19−3.66
AT4G12730FLA2 (FASCICLIN-like arabinogalactan 2)−1.51−2.28−3.00
AT1G14080FUT6 (fucosyltransferase 6)−1.43−3.88−2.97
AT5G06870PGIP2 (polygalacturonase inhibiting protein 2)−2.03−1.98−2.85
AT4G13210Pectin lyase-like superfamily protein−1.07−2.62−2.82
AT3G27400Pectin lyase-like superfamily protein−1.06−3.16−2.80
AT5G26670Pectinacetylesterase family protein−1.20−2.41−2.73
AT2G26440Plant invertase/pectin methylesterase inhibitor−0.81−2.46−2.72
AT4G01630EXPA17 (expansin A17)−0.98−4.18−2.71
AT5G45280Pectinacetylesterase family protein−1.14−2.00−2.69
AT2G04780FLA7 (FASCICLIN-like arabinoogalactan 7)−1.11−2.27−2.35
AT4G24780Pectin lyase-like superfamily protein−1.06−2.20−1.96
AT1G24070CSLA10 (cellulose synthase-like A10)−1.37−2.18−1.68
AT1G35230AGP5 (arabinogalactan protein 5)2.88−2.78−1.31
O: osmotic stress; H: heat; O-H: osmotic and heat stress. Numbers indicate fold changes. The negative signs indicate repression, i.e., −10.34 means that gene expression is 10.34-fold lower under treatment. Genes are ordered from the most to the less repressed expression after combined osmotic-heat treatment.
Publisher’s Note: MDPI stays neutral with regard to jurisdictional claims in published maps and institutional affiliations.

