
Effect of LED Lighting on Physical Environment and Microenvironment on In Vitro Plant Growth and Morphogenesis: The Need to Standardize Lighting Conditions and Their Description


Abstract
:1. Introduction
1.1. Fluorescent Lamps
- Magnetic starter and ballast. These allow temperature increases of the lamp gas for its ignition, increasing the grid voltage with a reactance up to more than 1000 VAC. They can be accompanied by a capacitor to compensate the permanent inductive effect generated by the ballast coil. Dead cycles of the sinusoidal power signal generate a stroboscopic effect: in a 50 Hz network, the light oscillates 100 times per second, passing through its neutral position twice every 20 ms.
- Electronic ballast. This technology replaces the ballast coil of the magnetic equipment to generate the starting voltage peak with electronic circuits that transform the network signal to high frequency voltage and currents (20–50 kHz). This allows generating light with an emission flicker at this same rate, being less perceptible to the human eye. This increase in working frequency improves the energy efficiency of the tubes by reducing their consumption and lowering the degradation of their light flux. Thus, a fluorescent tube that consumes 18 W working with a magnetic ballast will only need approximately 16 W with a high-frequency electronic device.
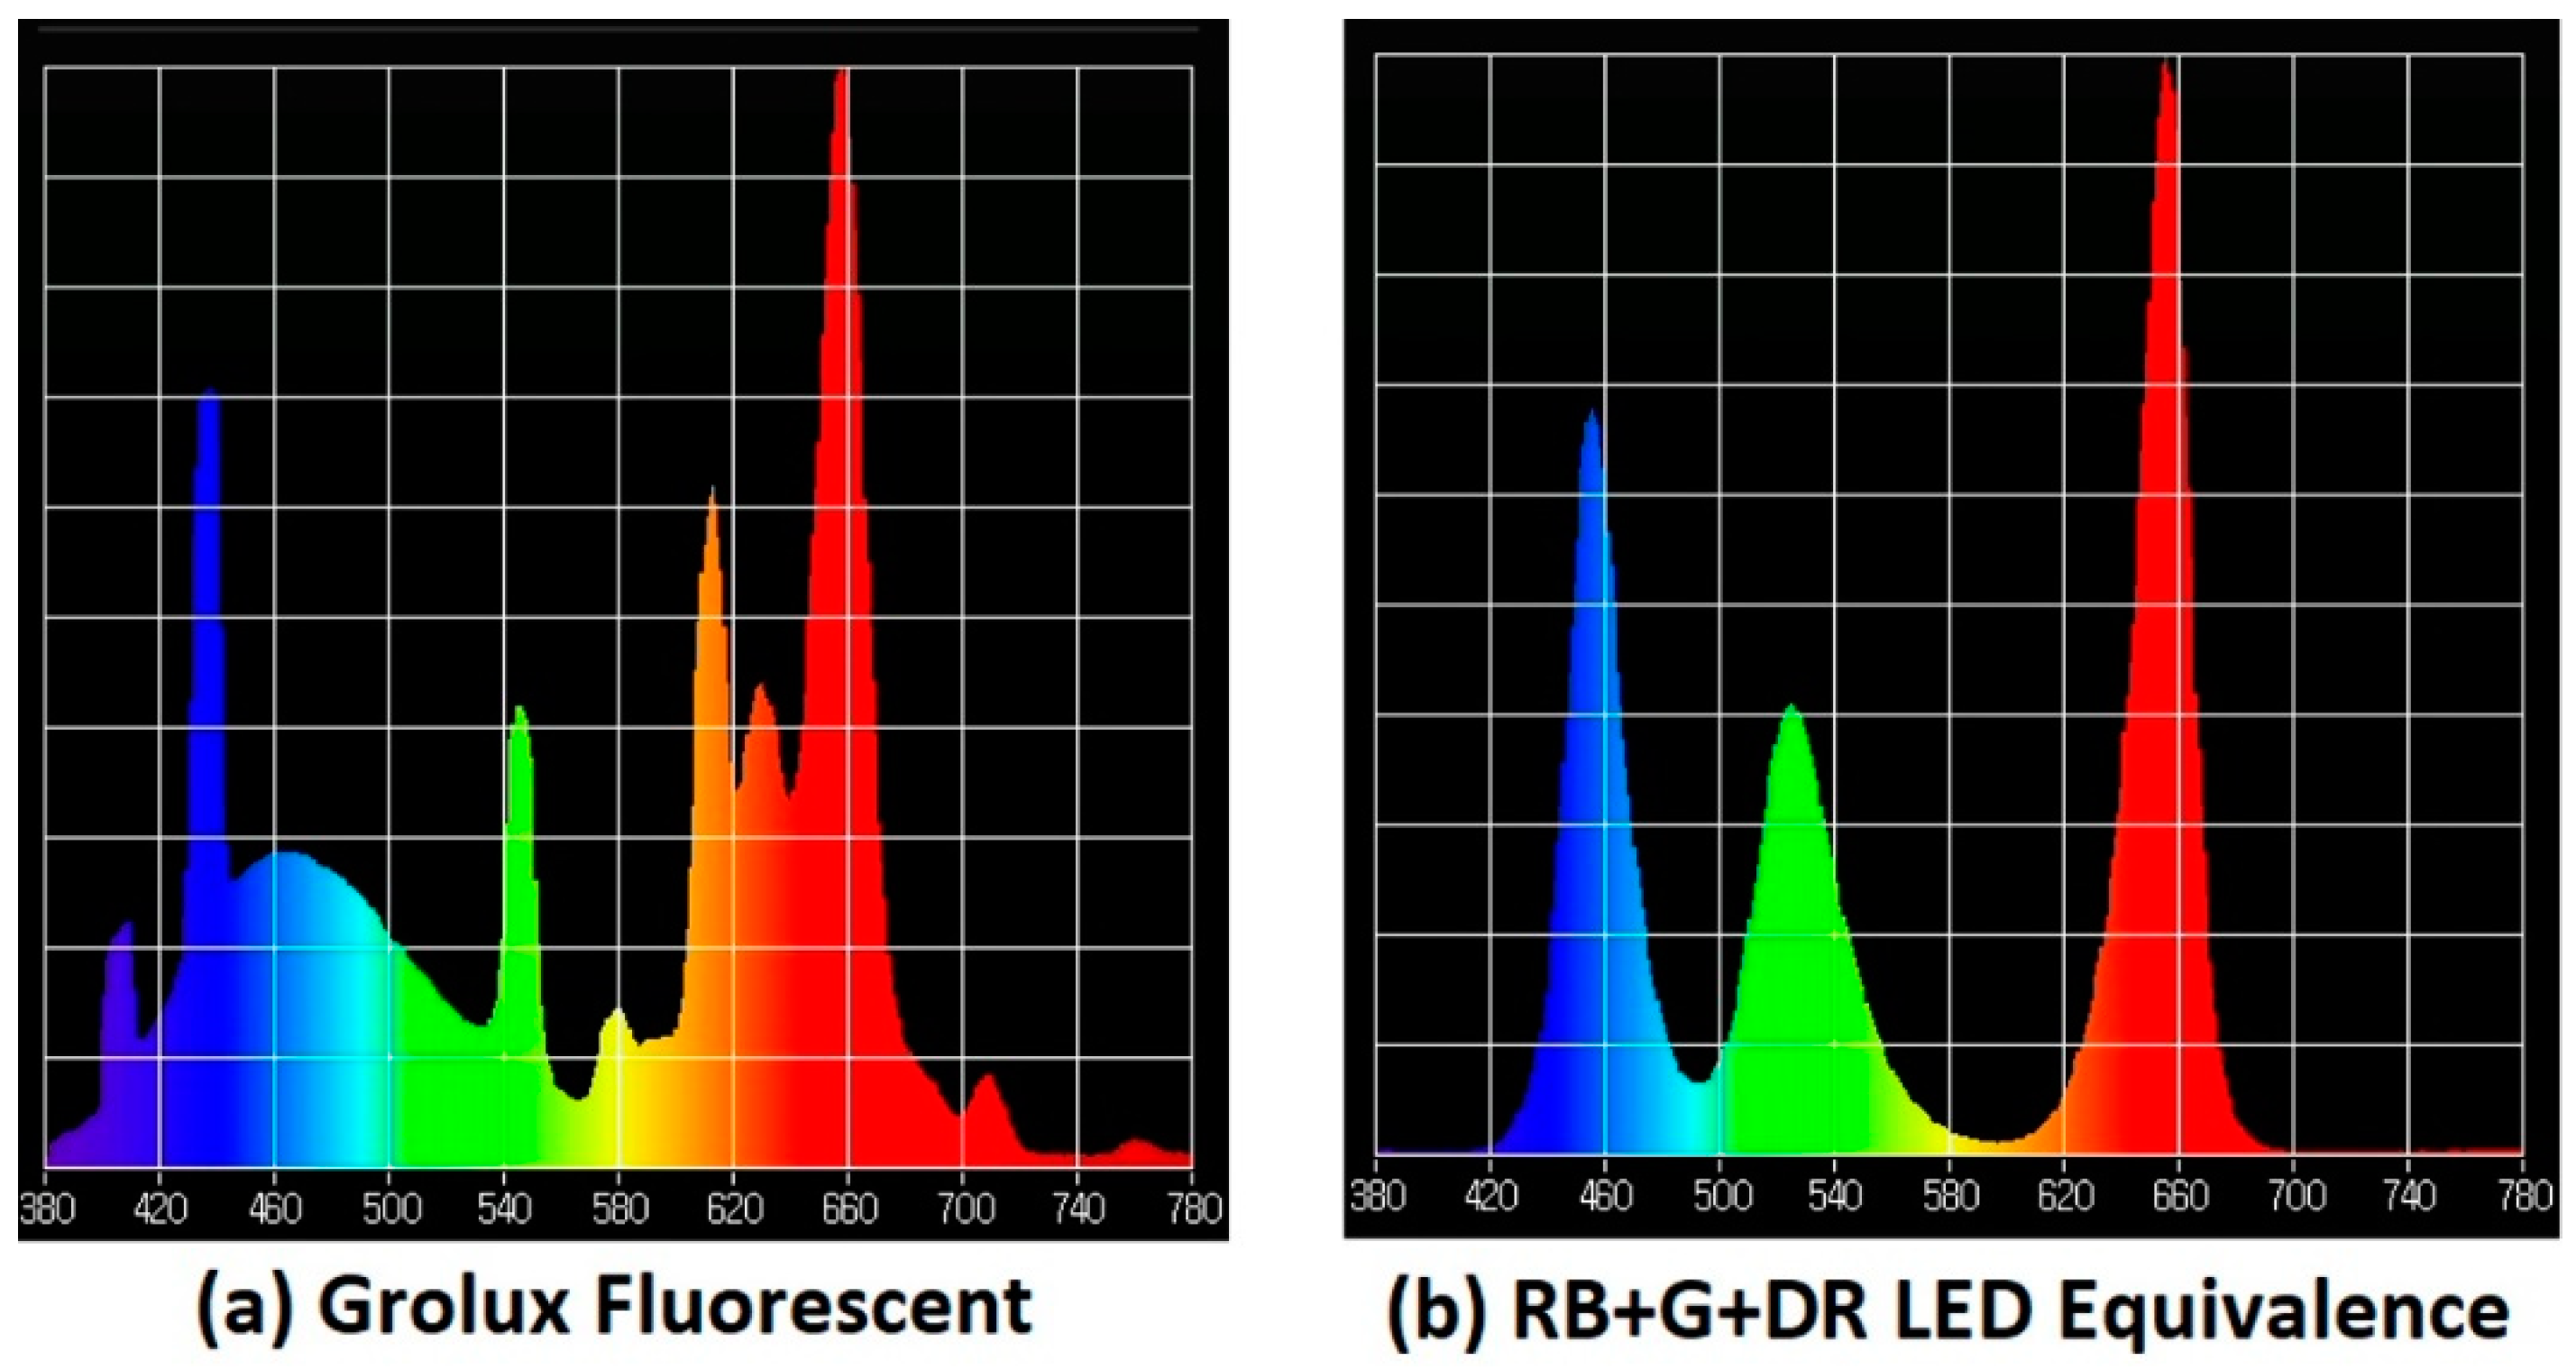
1.2. Grolux Fluorescence Technology
1.3. LED Lamps
2. Review Objectives
3. Characterization of LED Luminaires for Use in Plant Tissue Culture
3.1. Characterization of the Emission Spectrum
- In monochromatic emissions, the wavelength value of the emitters used must be indicated without simplifications of those group values, i.e., defining a radiation spectrum not by its peak wavelength but by the generic name of its color as red (that globally identifies all the range between 600–700 nm). Based on the widths of the radiation peaks offered by commercial LED packages and the variability found by the precision of the manufacturing mechanisms of these solid-state emitters, we consider that a sufficient value precision is to contemplate differential steps of 10 nm (e.g., 650, 660, 670 nm).
- In emissions that combine several monochromatic light sources, each color should be described as in the previous case. Moreover, the ratio of each type of radiation should not be assessed solely on the basis of the relative number of LEDs of each of the colors. Since the efficiency, power, thermal behavior and degradation curve of each type of LED is not homogeneous, this cannot be considered a comparable reference. Thus, the relationship between the light sources should be characterized by the energy radiated in each frequency. This information is offered by the graphical representations of spectra of the light that can be obtained with a spectrometer or can be obtained measuring with the PAR meter the radiance of each color independently.
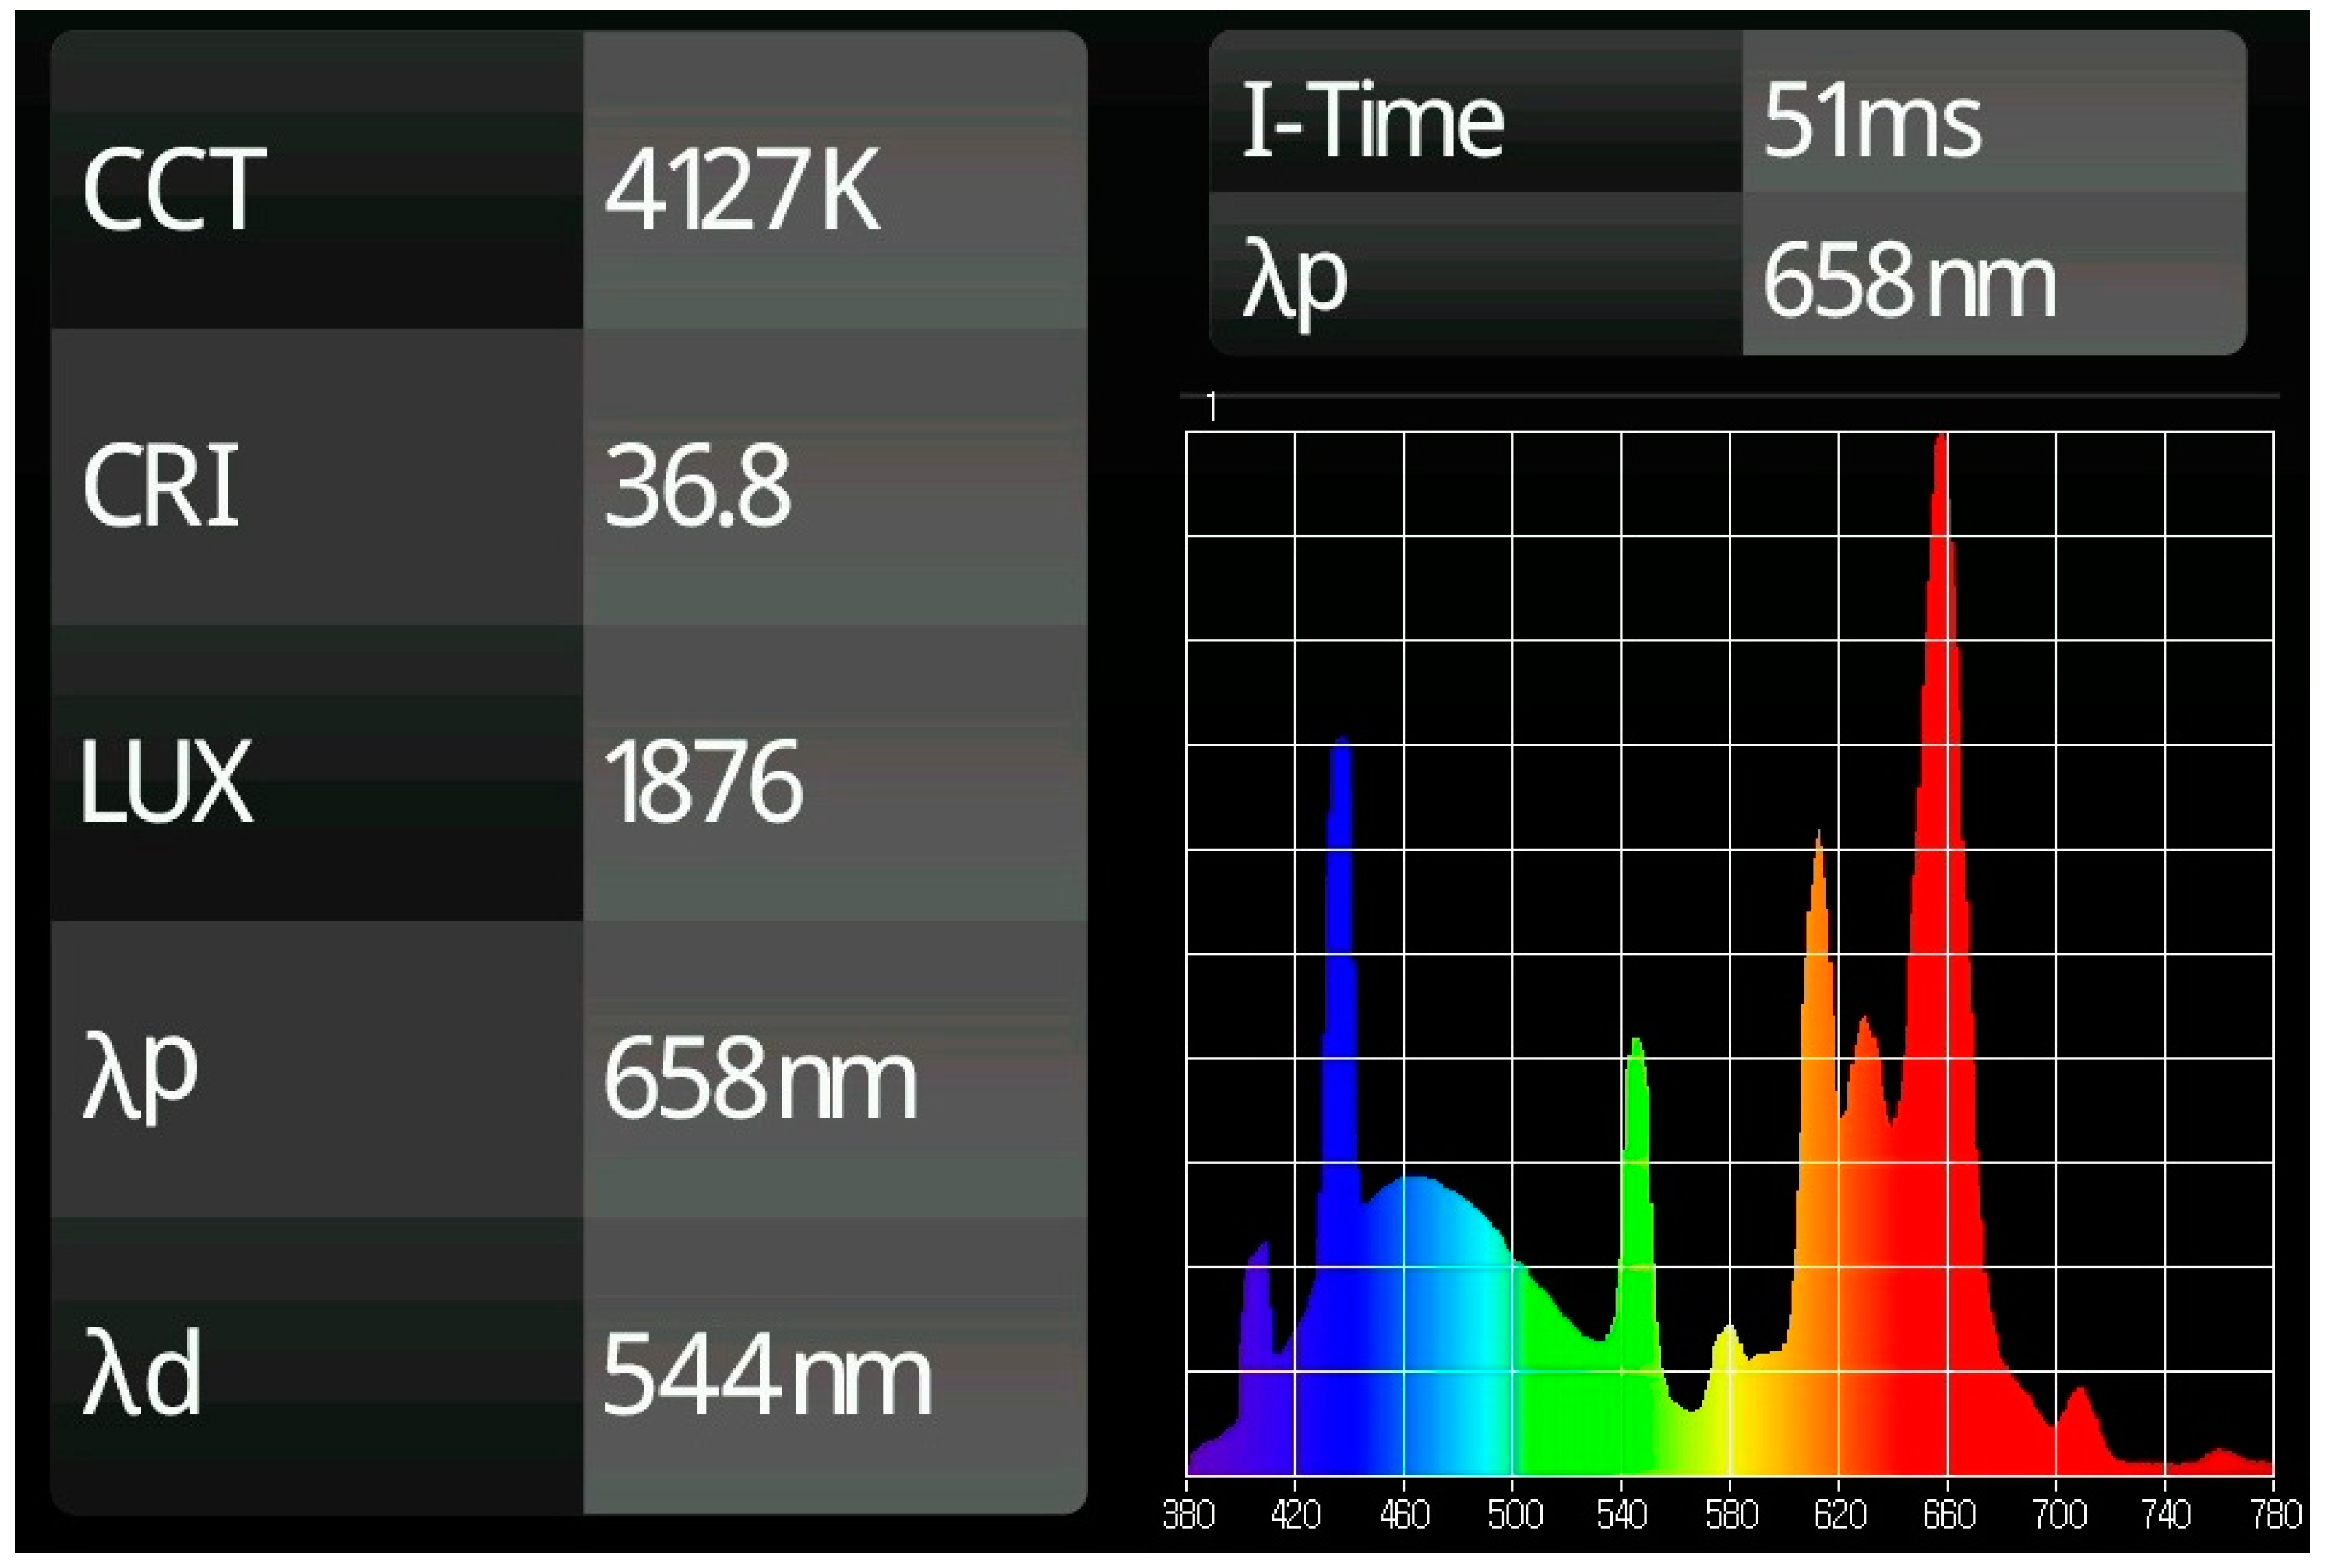
- In the case of lamps with continuous frequency range emissions within the radiant spectrum, i.e., white light, it would be necessary either to establish their commercial identification, if it exists, or to show, preferably, the radiation emission diagram of the light source used obtained with a spectrometer, which gives the exact information proportions of each emitted radiation. However, since it is very difficult to accurately compare two continuous data curves from printed images, the specific values of the Correlated Color Temperature (CCT) and the Color Rendering Index (CRI) are also significant characterization elements of this type of emissions.
Review Results. Identification of the Spectral Values of the Light Sources Used
- Fluorescent light: A major conclusion that can be obtained is that the characterization of LED lamps is carried out in greater depth than that of fluorescent lamps that are used as a control element in many of the experiments studied. From 62 papers that use fluorescent lamps as the control lighting system, 30 of them (48.4%) do not give any specific description or details about the type of lamp used; another 15 (24.2%) only give a generic description of the group of the color that is emitted (cold, neutral or warm) but without any quantitative characterization value; and only the last 17 descriptions of works (27.4%) either present the graph of the radiation spectrum of the lamps (three papers) or quantitatively determine the nature of the light source used (CTT for white light or the description of the specific model of lamp with its identification of the spectrum through the manufacturer dataset and, thus, of the radiant spectrum that is emitted on the plants) (14 papers).
- In this assessment we highlight an increasing trend in the presentation of details of the characterization of lighting equipment in the works that have been published more recently compared to older ones, due to the use of spectrometers in in vitro plant tissue culture laboratories, among other reasons.
- White LED light: The main deficiency detected in the characterization of these type of LED lamps refers again to the sources of white light, since the weight of each of the wavelengths in this continuous spectrum emission is not defined in a clear way. Describing only extreme wavelength values does not allow us to establish whether the main emission weight is in blue light (440–450 nm) or in the yellow-green zone. In this case, a minimum description would require an indication of the color range of the white light (cold, neutral or warm). On the other hand, the most precise description is to provide the full spectral graph of the emitted light obtained with a spectrophotometer. An intermediate solution, which offers sufficient values for comparison purposes due to the standardization that is being found in these products, is to offer the CCT and CRI values of the light source. From 57 studies analyzed that claim to use LED white light, four offer the graph of their radiation diagram; nine indicate the CCT value (with values from 2700 K to 7000 K, the most common numbers being 3000 K, 4200 K and 6500 K); eight identify only the range of CCT with one of this three options: cold, neutral and warm (the first and the last values being the most identified) and, finally, 36 indicate simply that white LED light has been used without any extended specification.
- Monochromatic LED light: In these cases, each light source can be clearly identified by the wavelength of its emission. It is relevant at this point to note how the generalized denomination of a color does not correspond to a single spectrum but to a set of frequencies that offers slight visual differences. In total, 52 studies out of 92 clearly identify the peak wavelength values, while the remaining 40 were limited to identifying only a generic group definition (red, blue, green, etc.). As described above, it is noteworthy how each plant species reaches a point of maximum sensitivity at different frequencies, so a precise study would require using not only an emission value in each basic group of colors, but also in making a sweep in several discrete frequencies. In the cases in which this more specific discrimination is done, there are 19 studies that deal with differences in the red color, including the study of the effect of far red or infrared lights (>700 nm) and seven studies include, at least, two different frequencies inside the range of the blue color (425–475 nm). Five papers introduce emissions with UV values (<400 nm) and another three use the violet/purple region of frequencies (400–425 nm).
3.2. Amount of Radiated Energy Incident on Plants
Review Results. Characterization of the Amount of Light Irradiated
3.3. Uniformity of the Lighting Conditions Achieved on the Shelves in the Culture Room
3.3.1. Review Results. Characterization of the Uniformity of Light Radiated over the Plants
3.3.2. Experimental Verification
3.4. Temperature
3.4.1. Review Results. Effect of Light Source, Discharge vs. LED, on the Temperature in Plant Tissue Culture
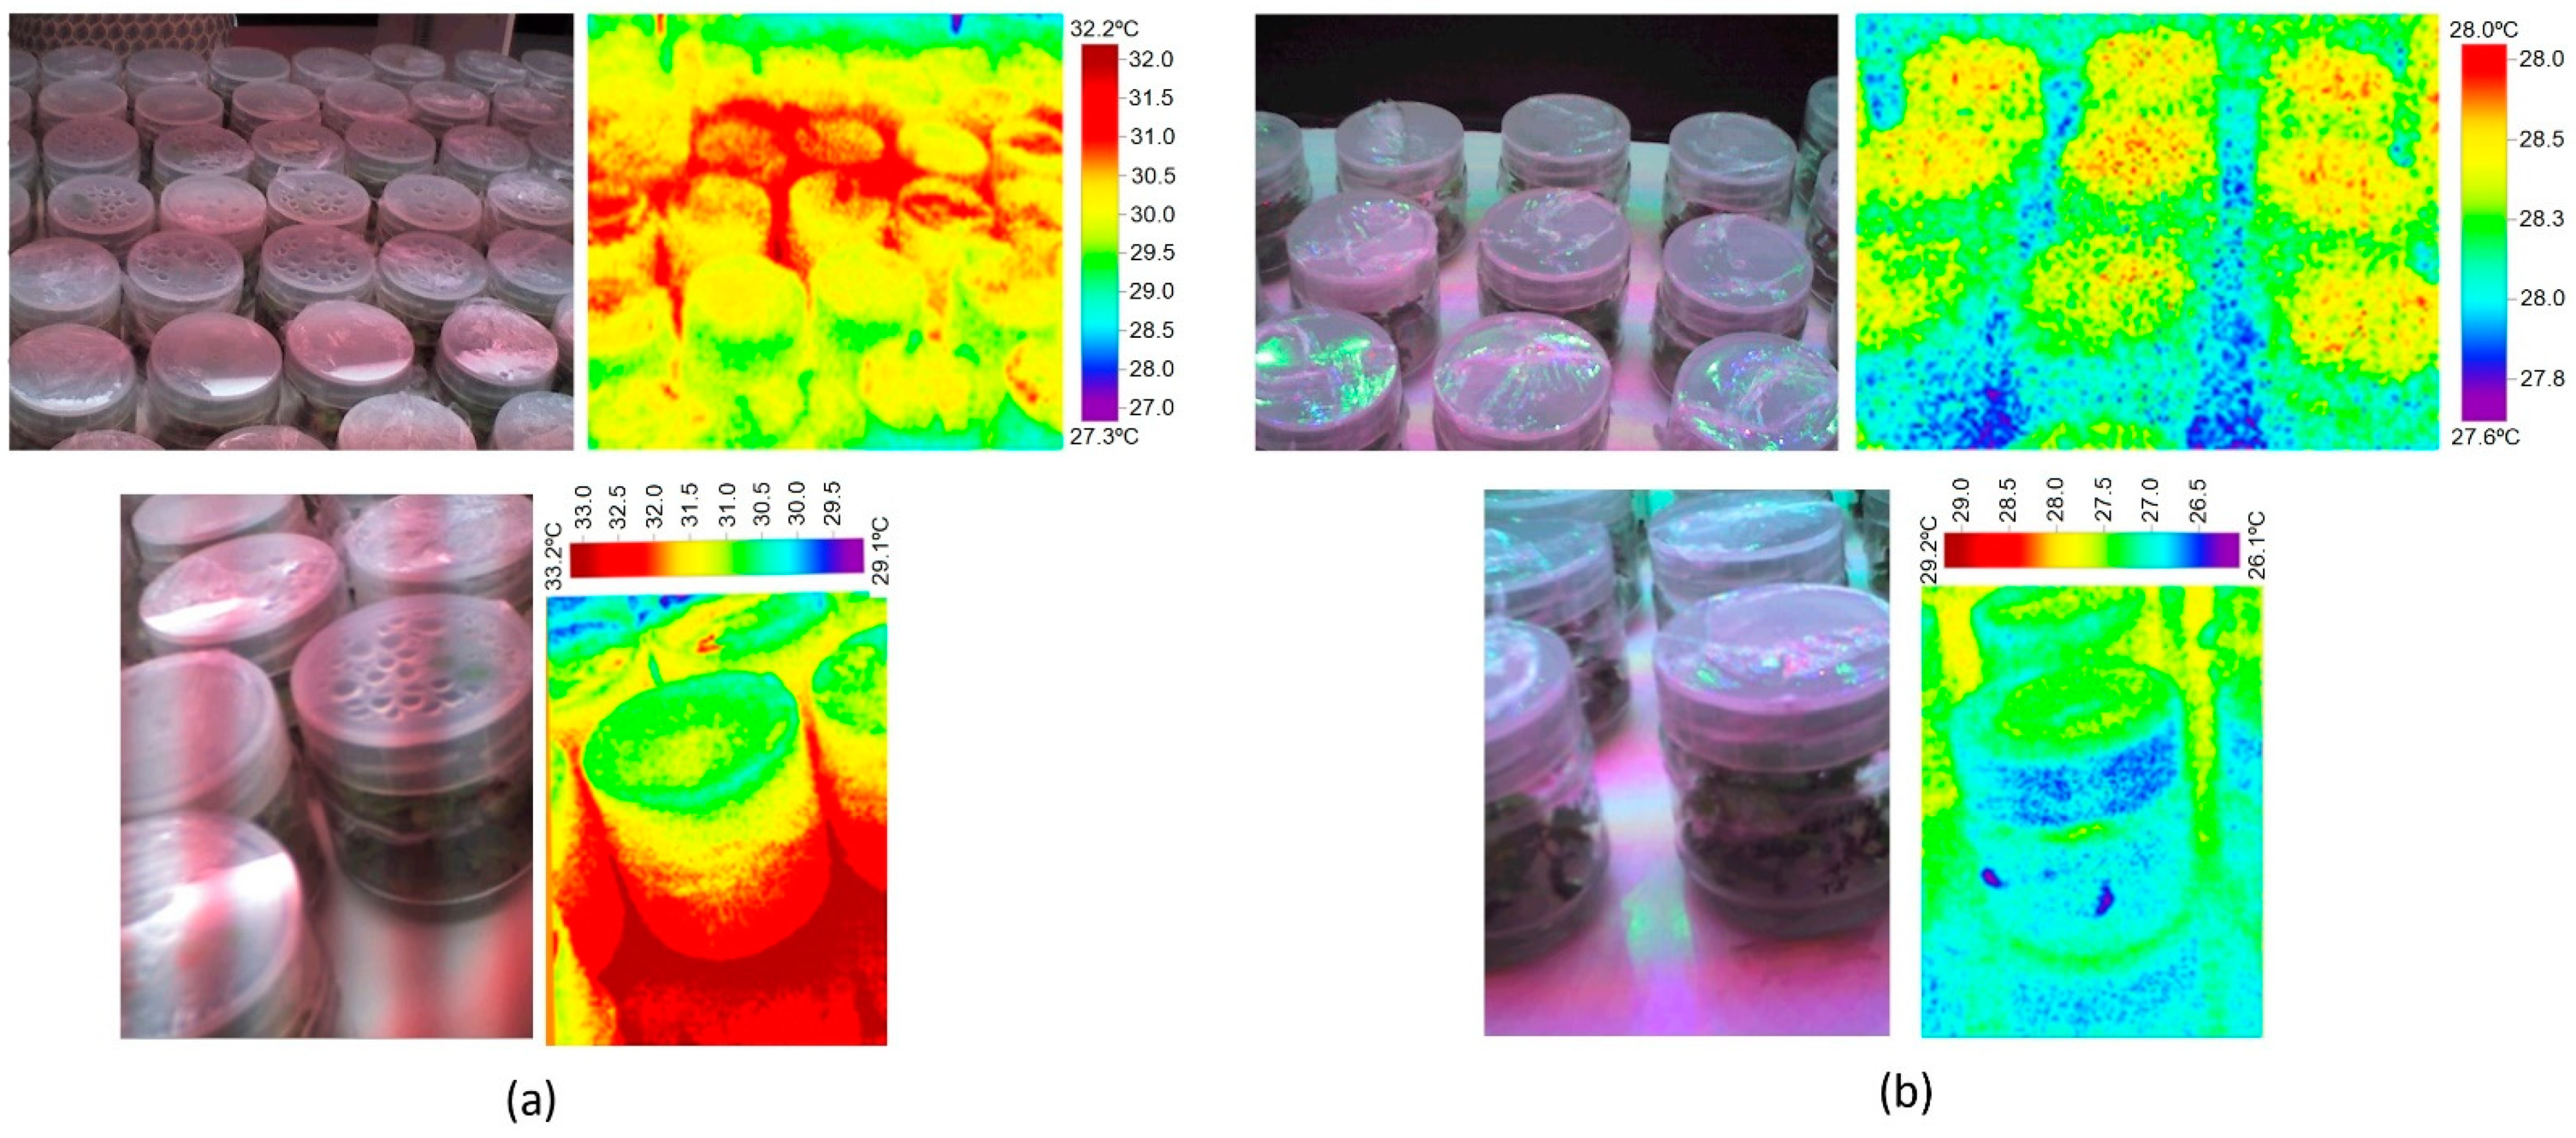
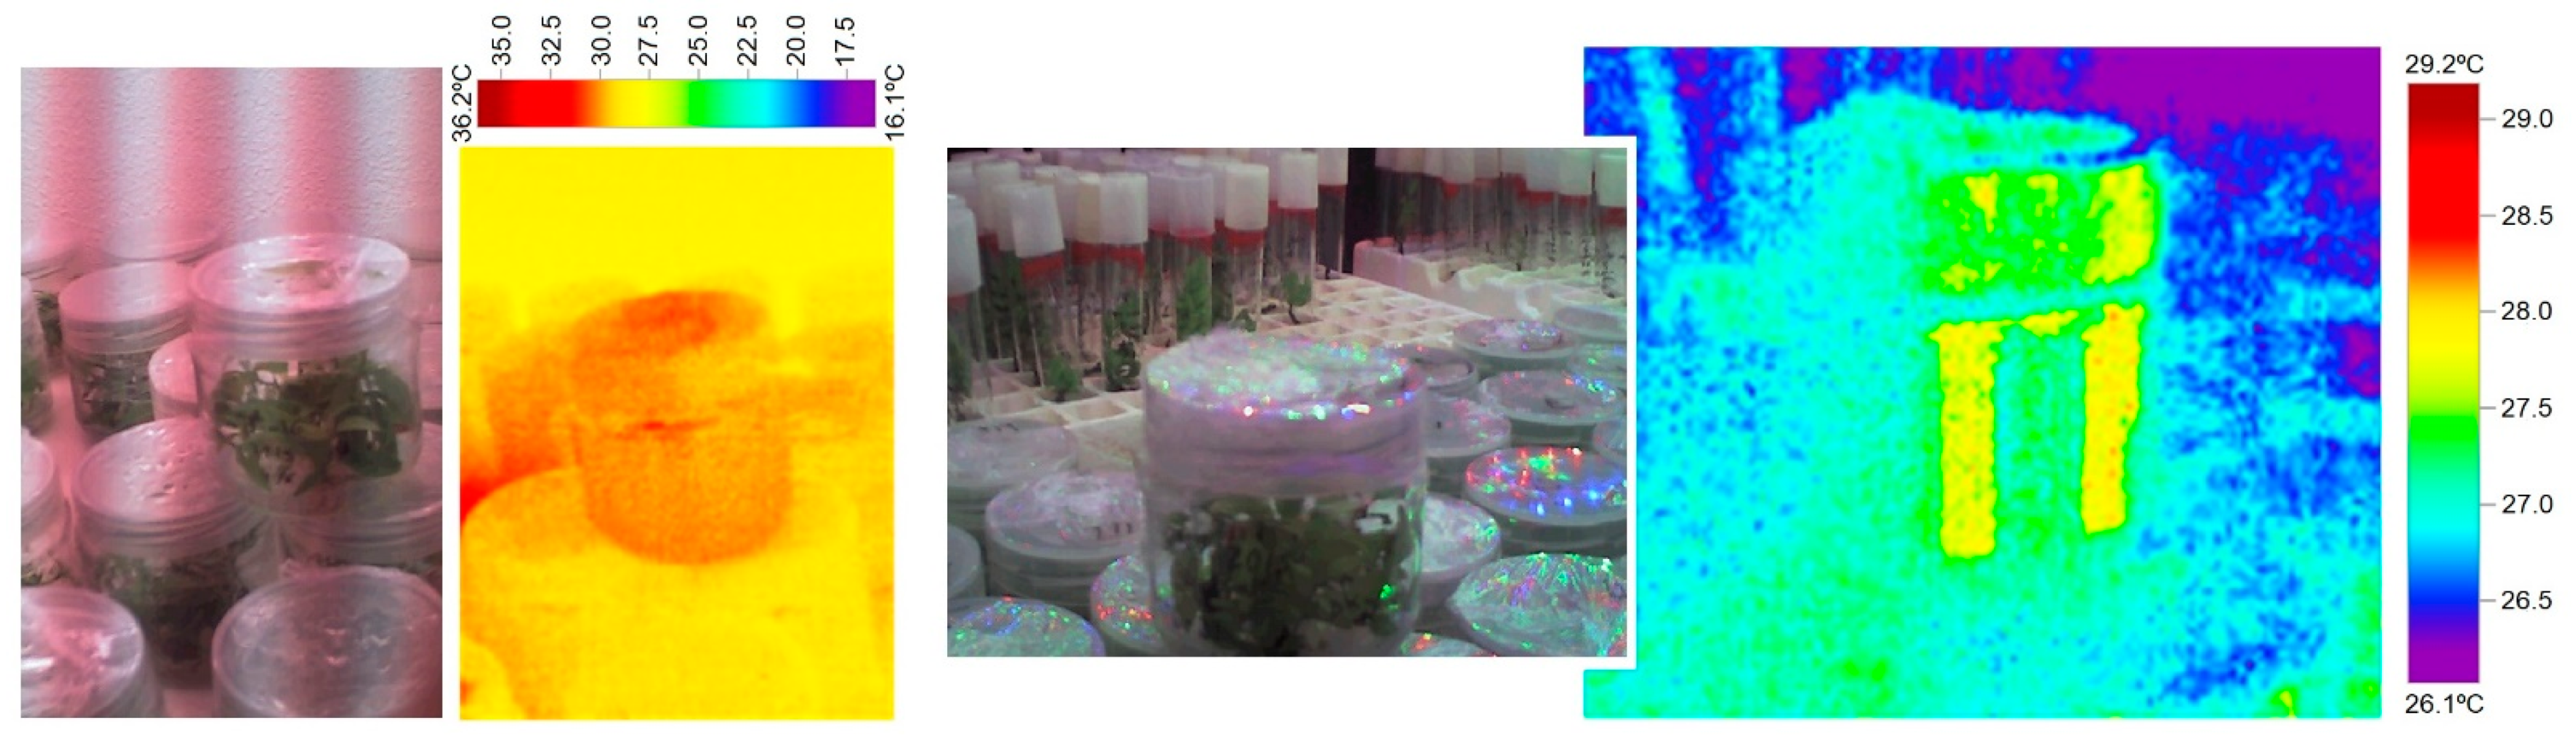
3.4.2. Experimental Verification
4. Future Trends: Pulsed Light
5. Concluding Remarks
Author Contributions
Funding
Institutional Review Board Statement
Informed Consent Statement
Data Availability Statement
Acknowledgments
Conflicts of Interest
Glossary
| ASA: ascorbic acid | DHA: dehydroascorbic acid |
| B: blue | DR: deep reed |
| BA: 6-benzyladenine | DW: dry weight |
| BCF: bioconcentration factor | FLs: fluorescent lamps |
| C: control | fR: far red |
| CCC: chlorocholine chloride | FW: fresh weight |
| CHO: carbohydrate | G: Green |
| CHL: chlorophyll | HP-LED: high-power LED |
| CNOC: carotenoid | HPLC: high-performance liquid chromatography |
| CsLHY: gene | IAA: indole-3-acetic acid, an auxin |
| Cv: cultivar | IR: infrared |
| CW: cool White | LEDs: light emitting diodes |
| DEGs: differentially expressed genes | MDA: malondialdehyde |
| mTR: meta-topolin riboside | SE: somatic embryos |
| MW: mint white | SOD: superoxide dismutase |
| NW: neutral white | Spd: spermidine |
| P: purple | TSIIA: tanshinone IIA |
| PA: polyamine | V: violet |
| PAR: photosynthetically active radiation | VOCs: volatile organic compounds |
| Pas: free polyamines | W: white |
| PGRs: plant growth regulators | WW: warm white |
| PLBs: protocorm-like bodies | Y: yellow |
| POD: peroxidases | 2iP: N6 -(2-isopentenyl) adenine |
| PPFD: photosynthetic photon fux density | R: red |
| Put: Putrescine |
References
- Lecler, M.T.; Zimmermann, F.; Silvente, E.; Masson, A.; Morèle, Y.; Remy, A.; Chollot, A. Improving the work environment in the fluorescent lamp recycling sector by optimizing mercury elimination. Waste Manag. 2018, 76, 250–260. [Google Scholar] [CrossRef]
- Thomson, G. The Museum Environment, 2nd ed.; Elsevier Science: Burlington, VT, USA, 2013; ISBN 13-978-0750620413. [Google Scholar] [CrossRef]
- Ahmed, S.; Amir, F.; Riaz-ul-Hasnain, S.; Shahwar, D.; Jamil, S. Electronic ballast circuit configurations for fluorescent lamps. In Proceedings of the 2015 Power Generation System and Renewable Energy Technologies (PGSRET), Islamabad, Pakistan, 10–11 June 2015; pp. 1–8. [Google Scholar] [CrossRef]
- Hammer, E.E. Effects of ambient temperature on the performance of bent tube fluorescent lamps. IEEE Trans. Ind. Appl. 1989, 25, 216–223. [Google Scholar] [CrossRef]
- Helson, V.A. Comparison of Gro-Lux and cool-white fluorescent lamps with and without incandescent as light sources used in plant growth rooms for growth and development of tomato plants. Can. J. Plant Sci. 1965, 45, 461–466. [Google Scholar] [CrossRef]
- Teunissen, C.; Van der Heijden, F.H.F.W.; Poort, S.H.M.; De Beer, E. Characterising user preference for white LED light sources with CIE colour rendering index combined with a relative gamut area index. Light Res. Technol. 2017, 49, 461–480. [Google Scholar] [CrossRef] [Green Version]
- Lammerts, W.E. Comparative effect of Grolux and incandescent light on growth of camellias. In American Camellia Yearbook; Pyron, J.H., Ed.; American Camellia Society: Ft. Valley, GA, USA, 1964; pp. 158–162. [Google Scholar]
- Batista, D.; Felipe, S.H.S.; Silva, T.D.; de Castro, K.M.; Mamedes-Rodrigues, T.C.; Miranda, N.A.; Ríos-Ríos, A.M.; Faria, D.V.; Fortini, E.A.; Chagas, K.; et al. Light quality in plant tissue culture: Does it matter. In Vitro Cell Dev. Plant 2018, 54, 195–215. [Google Scholar] [CrossRef]
- Nair, G.B.; Dhoble, S.J. A perspective perception on the applications of light-emitting diodes. Luminescence 2015, 30, 1167–1175. [Google Scholar] [CrossRef] [PubMed]
- Golovatskaya, I.F.; Karnachuk, R.A. Role of green light in physiological activity of plants. Russ. J. Plant Physiol. 2015, 62, 727–740. [Google Scholar] [CrossRef]
- Luo, X.; Hu, R.; Liu, S.; Wang, K. Heat and fluid flow in high-power LED packaging and applications. Prog. Energy Combust. Sci. 2016, 56, 1–32. [Google Scholar] [CrossRef] [Green Version]
- Arik, M.; Becker, C.A.; Weaver, S.E.; Petroski, J. Thermal management of LEDs: Package to system. In Proceedings of the Third International Conference on Solid State Lighting, San Diego, CA, USA, 5–7 August 2003; International Society for Optics and Photonics: Bellingham, WA, USA, 2004; Volume 5187, pp. 64–75. [Google Scholar]
- Fan, H.B.; Li, X.P.; Shen, J.X.; Chen, M. An effective prediction method for LED lumen maintenance. In Proceedings of the 2012 13th International Conference on Electronic Packaging Technology & High Density Packaging, Guilin, China, 13–16 August 2012; pp. 1560–1563. [Google Scholar] [CrossRef]
- Hegedüs, J.; Hantos, G.; Poppe, A. Reliability issues of mid-power LEDs. In Proceedings of the 2019 25th International Workshop on Thermal Investigations of ICs and Systems (THERMINIC), Lecco, Italy, 25–27 September 2019; pp. 1–6. [Google Scholar] [CrossRef]
- Yadlapalli, R.T.; Narasipuram, R.P.; Kotapati, A. An overview of energy efficient solid state LED driver topologies. Int. J. Energy Res. 2020, 44, 612–630. [Google Scholar] [CrossRef]
- Padmasali, A.N.; Kini, S.G. A generalized methodology for predicting the lifetime performance of LED luminaire. IEEE Trans. Electron. Devices 2020, 67, 2831–2836. [Google Scholar] [CrossRef]
- Miyashita, Y.; Kimura, Y.; Kubota, C.; Kozai, T. Effects of red light on the growth and morphology of potato plantlets in vitro: Using emitting diodes (LEDs) as a light source for micropropagation. Acta Hortic. 1997, 418, 169–173. [Google Scholar] [CrossRef]
- Gupta, S.D.; Jatothu, B. Fundamentals and applications of light-emitting diodes (LEDs) in in vitro plant growth and morphogenesis. Plant. Biotechnol. Rep. 2013, 7, 211–220. [Google Scholar] [CrossRef]
- Agarwal, A.; Gupta, S.D. Impact of light-emitting diodes (LEDs) and its potential on plant growth and development in controlled-environment plant production system. Curr. Biotechnol. 2016, 5, 28–43. [Google Scholar] [CrossRef]
- Jung, W.S.; Chung, I.M.; Hwang, M.H.; Kim, S.H.; Yu, C.Y.; Ghimire, B.K. Application of light-emitting diodes for improving the nutritional quality and bioactive compound levels of some crops and medicinal plants. Molecules 2021, 26, 1477. [Google Scholar] [CrossRef] [PubMed]
- Hashim, M.; Ahmad, B.; Drouet, S.; Hano, C.; Abbasi, B.H.; Anjum, S. Comparative effects of different light sources on the production of key secondary metabolites in plants in vitro cultures. Plants 2021, 10, 1521. [Google Scholar] [CrossRef]
- Araújo, D.X.; Rocha, T.T.; de Carvalho, A.A.; Bertolucci, S.K.V.; Medeiros, A.P.R.; Ribeiro, F.N.S.; Barbosa, S.M.; Pinto, J.E.B.P. Photon flux density and wavelength influence on growth, photosynthetic pigments and volatile organic compound accumulation in Aeollanthus suaveolens (Catinga-de-mulata) under in vitro conditions. Ind. Crops Prod. 2021, 168, 113597. [Google Scholar] [CrossRef]
- Attaya, A.S. LED Light Technology as a Source of Illumination and a Promising Method for Stevia rebaudiana Elite Propagation. Egypt J. Agron. 2021, 43, 123–132. [Google Scholar] [CrossRef]
- Boonsnongcheep, P.; Pichetpongtorn, P.; Juntosuth, P.; Yowsong, T.; Vansanit, P.; Preeprame, S.; Kanchanapoom, T.; Putalun, W. LED and methyl jasmonate enhance a strong antioxidant compound, verbascoside, production in Clerodendrum indicum and Acanthus ebracteatus. J. Plant Biochem. Biot. 2021, 1–9. [Google Scholar] [CrossRef]
- Coelho, A.D.; de Souza, C.K.; Bertolucci, S.K.V.; de Carvalho, A.A.; Santos, G.C.; de Oliveira, T.; Marques, E.A.; Salimena, J.P.; Pinto, J.E.B.P. Wavelength and light intensity enhance growth, phytochemical contents and antioxidant activity in micropropagated plantlets of Urtica dioica L. Plant Cell Tissue Organ. Cult. 2021, 145, 59–74. [Google Scholar] [CrossRef]
- Costa, É.L.G.; Farnese, F.D.S.; de Oliveira, T.C.; Rosa, M.; Rodrigues, A.A.; Resende, E.C.; Januario, A.H.; Silva, F.G. Combinations of blue and red LEDs increase the morphophysiological performance and furanocoumarin production of Brosimum gaudichaudii Trécul in vitro. Front. Plant Sci. 2021, 1440. [Google Scholar] [CrossRef] [PubMed]
- Gnasekaran, P.; Rahman, Z.A.; Chew, B.L.; Appalasamy, S.; Mariappan, V.; Subramaniam, S. Development of micropropagation system of Zingiber officinale var. rubrum Theilade using different spectrum light-emitting diode (LED) irradiation. Ind. Crops Prod. 2021, 170, 113748. [Google Scholar] [CrossRef]
- Gris, T.; Pinheiro, M.V.M.; Thiesen, L.A.; Webler, A.R.; Junges, D.L.; Holz, E.; Naibo, I.; Batista, D.S.; Otoni, W.C.; Schmidt, D. Light quality and sealing type affect in vitro growth and development of Capsicum frutescens cultivars. An. Acad. Bras. Ciências 2021, 93. [Google Scholar] [CrossRef]
- Matos, A.V.C.D.S.D.; Oliveira, B.S.D.; Oliveira, M.E.B.S.D.; Cardoso, J.C. AgNO3 improved micropropagation and stimulate in vitro flowering of rose (Rosa x hybrida) cv. Sena. Ornam. Hortic. 2021, 27, 33–40. [Google Scholar] [CrossRef]
- Manivannan, A.; Soundararajan, P.; Park, Y.G.; Jeong, B.R. Physiological and proteomic insights into red and blue light-mediated enhancement of in vitro growth in Scrophularia kakudensis—A potential medicinal plant. Front. Plant Sci. 2021, 11, 2205. [Google Scholar] [CrossRef]
- Siatkowska, K.; Chraniuk, M.; Bollin, P.; Banasiuk, R. Light emitting diodes optimisation for secondary metabolites production by Droseraceae plants. J. Photochem. Photobiol. B Biol. 2021, 224, 112308. [Google Scholar] [CrossRef]
- Sonthisut, M.; Wongpanya, R.; Phonphoem, A.; Phonphoem, W.P. Enhancement of 1-deoxynojirimycin production in mulberry (Morus spp.) using LED irradiation. Plant Cell Tissue Organ. Cult. 2021, 1–10. [Google Scholar] [CrossRef]
- Sorgato, J.C.; Mudolon, E.D.; Guimarães, F.F.; Soares, J.S.; Ribeiro, L.M. Light sources on the germination and initial in vitro establishment of Schomburgkia crispa Lindl., a species of the Brazilian Cerrado. Ciência Rural. 2021, 51. [Google Scholar] [CrossRef]
- Weremczuk-Jeżyna, I.; Hnatuszko-Konka, K.; Lebelt, L.; Grzegorczyk-Karolak, I. The protective function and modification of secondary metabolite accumulation in response to light stress in Dracocephalum forrestii shoots. Int. J. Mol. Sci. 2021, 22, 7965. [Google Scholar] [CrossRef]
- Winson, K.W.S.; Chew, B.L.; Sathasivam, K.; Subramaniam, S. Effect of amino acid supplementation, elicitation and LEDs on Hylocereus costaricensis callus culture for the enhancement of betalain pigments. Sci. Hortic. 2021, 289, 110459. [Google Scholar] [CrossRef]
- Yu, R.; Li, F.; Wang, G.; Ruan, J.; Wu, L.; Wu, M.; Yang, C.; Shan, Q. In vitro regeneration of the colorful fern Pteris aspericaulis var. tricolor via green globular bodies system. In Vitro Cell Dev. Biol. Plant 2021, 57, 225–234. [Google Scholar] [CrossRef]
- Aasim, M.; Aydın, S.; Karataş, M.; Aydın, M.E.; Soğukpınar, C.; Sevinc, C. Bioaccumulation potential of in vitro regenerated plants of Ceratophyllum demersum against Chromium—A lab study. Asian J. Agric. Biol. 2020, 8, 233–239. [Google Scholar] [CrossRef]
- Cappai, F.; Garcia, A.; Cullen, R.; Davis, M.; Munoz, P.R. Advancements in low-chill blueberry Vaccinium corymbosum L. tissue culture practices. Plants 2020, 9, 1624. [Google Scholar] [CrossRef]
- Centofante, A.R. Light quality on the morphoanatomy and physiology of Campomanesia pubescens (DC.) O. Berg. Seedlings. Sci. Hortic. 2020, 108765. [Google Scholar] [CrossRef]
- Chaves, M.C.; Freitas, J.C.E.; Nery, F.C.; Paiva, R.; de Oliveira Prudente, D.; Costa, B.G.P.; Daubermann, A.G.; Bernardes, M.M.; Grazul, R.M. Influence of colorful light-emitting diodes on growth, biochemistry, and production of volatile organic compounds in vitro of Lippia filifolia (Verbenaceae). J. Photochem. Photobiol. B 2020, 212, 112040. [Google Scholar] [CrossRef]
- Chen, Y.C.; Chang, C.; Lin, H.L. Topolins and red light improve the micropropagation efficiency of passion fruit (Passiflora edulis Sims) ‘Tainung No. 1’. Hortscience 2020, 55, 1337–1344. [Google Scholar] [CrossRef]
- Chen, L.L.; Zhang, K.; Gong, X.C.; Wang, H.Y.; Gao, Y.H.; Wang, X.Q.; Zeng, Z.H.; Hu, Y.G. Effects of different LEDs light spectrum on the growth, leaf anatomy and chloroplast ultrastructure of potato plantlets in vitro and minituber production after transplanting in the greenhouse. J. Integr. Agric. 2020, 19, 108–119. [Google Scholar] [CrossRef]
- Chen, C.C.; Lee, M.R.; Wu, C.R.; Ke, H.J.; Xie, H.M.; Tsay, H.S.; Agrawal, D.C.; Chang, H.C. LED lights affecting morphogenesis and isosteroidal alkaloid contents in Fritillaria cirrhosa D. Don-An Important Chinese Medicinal Herb. Plants 2020, 9, 1351. [Google Scholar] [CrossRef]
- Da Costa Silveira, A.A.; Lopes, F.J.F.; Sibov, S.T. Micropropagation of Bambusa oldhamii Munro in heterotrophic, mixotrophic and photomixotrophic systems. Plant Cell Tissue Organ. Cult. 2020, 141, 315–326. [Google Scholar] [CrossRef]
- De Carvalho, A.A.; Bertolucci, S.K.V.; da Cunha Honorato, A.; Rocha, T.T.; Silva, S.T.; Pinto, J.E.B.P. Influence of light spectra and elicitors on growth and ascaridole content using in vitro cultures of Dysphania ambrosioides L. Plant Cell Tissue Org. 2020, 143, 277–290. [Google Scholar] [CrossRef]
- Dogan, M. The effectiveness of light emitting diodes on shoot regeneration in vitro from shoot tip tissues of Limnophila aromatica (Lamk.) Merr. and Rotala rotundifolia (Buch-Ham. ex Roxb) Koehne. Biotech. Histochem. 2020, 95, 225–232. [Google Scholar] [CrossRef]
- Gam, D.T.; Khoi, P.H.; Ngoc, P.B.; Linh, L.K.; Hung, N.K.; Anh, P.T.L.; Thu, N.T.; Hien, N.T.T.; Khanh, T.D.; Ha, C.H.H. LED lights promote growth and flavonoid accumulation of Anoectochilus roxburghii and are linked to the enhanced expression of several related genes. Plants 2020, 9, 1344. [Google Scholar] [CrossRef]
- He, C.; Zeng, Y.; Fu, Y.; Wu, J.; Liang, Q. Light quality affects the proliferation of in vitro cultured plantlets of Camellia oleifera Huajin. Peer J. 2020, 8, e10016. [Google Scholar] [CrossRef]
- Johnson, R.E.; Kong, Y.; Zheng, Y. Elongation growth mediated by blue light varies with light intensities and plant species: A comparison with red light in arugula and mustard seedlings. Environ. Exp. Bot. 2020, 169, 103898. [Google Scholar] [CrossRef]
- Li, R.N.; You, J.; Miao, C.; Kong, L.; Long, J.H.; Yan, Y.Z.; Xu, Z.G.; Liu, X.Y. Monochromatic lights regulate the formation, growth, and dormancy of in vitro grown Solanum tuberosum L. microtubers. Sci. Hortic. 2020, 261, 108947. [Google Scholar] [CrossRef]
- Manoh, H.P.; Toruan-Mathius, Y.N. Growth and development of oil palm shoots under different light qualities. Biotropia J. 2020, 28, 21–28. [Google Scholar] [CrossRef]
- Mølmann, J.A.; Johansen, T.J. Sprout growth inhibition and photomorphogenic development of potato seed tubers (Solanum tuberosum L.) under different LED light colours. Potato Res. 2020, 63, 199–215. [Google Scholar] [CrossRef]
- Neto, A.R.; Chagas, E.A.; Costa, B.N.S.; Chagas, P.C.; Vendrame, W.A. Photomixotrophic growth response of sugarcane in vitro plantlets using different light intensities and culture vessel types. In Vitro Cell Dev. Biol.-Plant 2020, 56, 504–514. [Google Scholar] [CrossRef]
- Oliveira, T.d.R.; Aragão, V.P.M.; Moharana, K.C.; Fedosejevs, E.; do Amaral, F.P.; Sousa, K.R.; Santa-Catarina, C. Light spectra affect the in vitro shoot development of Cedrela fissilis Vell. (Meliaceae) by changing the protein profile and polyamine contents. Biochim. Biophys. Acta Proteins Proteom. 2020, 1868, 140529. [Google Scholar] [CrossRef]
- Piątczak, E.; Kuźma, Ł.; Kozłowska, W.; Lisiecki, P.; Szemraj, M.; Płachno, B.J.; Zielińska, S. Phenylethanoid and iridoid glycosides production in Rehmannia elata NE Brown ex Prein. in vitro shoot cultures and their biological activity. Ind. Crops Prod. 2020, 158, 113050. [Google Scholar] [CrossRef]
- Pundir, R.K.; Pathak, A.; Joshi, N.; Bagri, D.S.; Upadhyaya, C.P. Irradiation studies of LED light spectra on the growth and development of potato (Solanum tuberosum L.). Plant Sci. Today 2020, 7, 406–416. [Google Scholar] [CrossRef]
- Santos, G.C.; Cardoso, F.P.; Martins, A.D.; Pascual, M.; Ossani, P.C.; Queiroz, J.M.; Rezende, R.A.L.S.; Dória, J. Effect of light and sucrose on photoautotrophic and photomixotrophic micropropagation of Physalis angulata. Biosci. J. 2020, 36, 1353–1367. [Google Scholar] [CrossRef]
- Siedlarz, P.; Bany, S.; Rybka, K. Quantitative changes in DNA methylation induced by monochromatic light in barley regenerants obtained by androgénesis. Biuletyn. IHAR 2020, 288, 47–51. [Google Scholar] [CrossRef]
- Silva, T.D.; Batista, D.S.; Fortini, E.A.; de Castro, K.M.; Sousa Felipe, S.H.; Fernandes, A.M.; de Jesus Sousa, R.M.; Chagas, K.; Siqueira da Silva, J.V.; de Freitas Correia, L.; et al. Blue and red light affects morphogenesis and 20-hydroxyecdisone N content of in vitro Pfaffia glomerata accessions. J. Photochem. Photobiol. B 2020, 203, 111761. [Google Scholar] [CrossRef]
- da Silva, D.; Imakawa, A.M.; Guedes, K.R.V.; Bruno, F.M.S.; Sampaio, P.D.T.B. In vitro regeneration and callogenesis of Libidibia férrea. J. Exp. Agric. Int. 2020, 42, 14–24. [Google Scholar] [CrossRef]
- Souza, D.M.S.C.; Xavier, A.; Miranda, N.A.; Gallo, R.; Otoni, W.C. Light quality, 6- benzyladenine and number of subcultives for in vitro multiplication of hybrid clones of Corymbia. Sci. For. 2020, 48, e3282. [Google Scholar] [CrossRef]
- Stepanova, A.Y.; Solov’yova, A.I.; Salamaikina, S.A. Influence of spectral light composition on flavones formation in callus culture of Scutellaria baicalensis Georgi. Pharmacogn. Mag. 2020, 16, 156–160. [Google Scholar] [CrossRef]
- Usman, H.; Ullah, M.A.; Jan, H.; Siddiquah, A.; Drouet, S.; Anjum, S.; Giglioli-Guviarc’h, N.; Hano, C.; Abbasi, B.H. Interactive effects of wide-spectrum monochromatic lights on phytochemical production, antioxidant and biological activities of Solanum xanthocarpum callus cultures. Molecules 2020, 25, 2201. [Google Scholar] [CrossRef] [PubMed]
- Yeow, L.C.; Chew, B.L.; Sreeramanan, S. Elevation of secondary metabolites production through light-emitting diodes (LEDs) illumination in protocorm-like bodies (PLBs) of Dendrobium hybrid orchid rich in phytochemicals with therapeutic effects. Biotechnol. Rep. 2020, 27, e00497. [Google Scholar] [CrossRef]
- Yu, L.L.; Song, C.M.; Sun, L.J.; Li, L.L.; Xu, Z.G.; Tang, C.M. Effects of light-emitting diodes on tissue culture plantlets and seedlings of rice (Oryza sativa L.). J. Integr. Agric. 2020, 19, 1743–1754. [Google Scholar] [CrossRef]
- Xu, Y.; Yang, M.; Cheng, F.; Liu, S.; Liang, Y. Effects of LED photoperiods and light qualities on in vitro growth and chlorophyll fluorescence of Cunninghamia lanceolata. Plant Biol. 2020, 20, 269. [Google Scholar] [CrossRef]
- Zárate-Salazar, J.R.; de Souza, L.M.; de Morais, M.B.; Neto, L.P.; Willadino, L.; Gouveia-Neto, A.; Ulisses, C. Light-emitting diodes and gas exchange facilitation minimize hyperhydricity in Lippia grata: Physiological, biochemical and morpho anatomical aspects. S. Afr. J. Bot. 2020, 135, 164–171. [Google Scholar] [CrossRef]
- Zhao, J.; Thi, L.T.; Park, Y.G.; Jeong, B.R. Light quality affects growth and physiology of Carpesium triste Maxim. cultured in vitro. Agriculture 2020, 10, 258. [Google Scholar] [CrossRef]
- Zielińska, S.; Piątczak, E.; Kozłowska, W.; Bohater, A.; Jezierska-Domaradzka, A.; Kolniak-Ostek, J.; Matkowski, A. LED illumination and plant growth regulators’ effects on growth and phenolic acids accumulation in Moluccella laevis L. in vitro cultures. Acta Physiol. Plant 2020, 42, 72. [Google Scholar] [CrossRef] [Green Version]
- Zushi, K.; Suehara, C.; Shirai, M. Effect of light intensity and wavelengths on ascorbic acid content and the antioxidant system in tomato fruit grown in vitro. Sci. Hortic. 2020, 274, 109673. [Google Scholar] [CrossRef]
- Bhaya, M.H.M.; Al-RazzaqSalim, S. Impacts of plant growth regulators and light quality on banana (Musa spp.) micropropagation. Plant Arch. 2019, 19, 1379–1385. [Google Scholar]
- Boonsnongcheep, P.; Sae-foo, W.; Banpakoat, K.; Channarong, S.; Chitsaithan, S.; Uafua, P.; Puthaa, W.; Kerdsiria, K.; Putalun, W. Artificial color light sources and precursor feeding enhance plumbagin production of the carnivorous plants Drosera burmannii and Drosera indica. J. Photochem. Photobiol. B 2019, 199, 111628. [Google Scholar] [CrossRef]
- Cióc, M.; Kalisz, A.; Zupnik, M.; Pawłowska, B. Different LED light intensities and 6-benzyladenine concentrations in relation to shoot development, leaf architecture, and photosynthetic pigments of Gerbera jamesonii Bolus in vitro. Agronomy 2019, 9, 358. [Google Scholar] [CrossRef] [Green Version]
- Chen, L.; Yang, Y.; Jiang, Y.; Zhao, J.; Zang, H.; Wang, X.; Hu, Y.; Xue, X. RNA-Seq analysis reveals differential responses of potato (Solanum tuberosum L.) plantlets cultured in vitro to red, blue, green, and white light-emitting diodes (LEDs). J. Plant. Growth Regul. 2019, 38, 1412–1427. [Google Scholar] [CrossRef]
- Das Bhowmik, S.S.; Cheng, A.Y.; Long, H.; Tan, G.Z.H.; Hoang, T.M.L.; Karbaschi, M.R.; Williams, B.; Higgins, T.J.V.; Mundree, S.G. Robust genetic transformation system to obtain non-chimeric transgenic chickpea. Front. Plant Sci. 2019, 10, 524. [Google Scholar] [CrossRef] [Green Version]
- De Hsie, B.S.; Bueno, A.I.S.; Bertolucci, S.K.V.; de Carvalho, A.A.; da Cunha, S.H.B.; Martins, E.R.; Pinto, J.E.B.P. Study of the influence of wavelengths and intensities of LEDs on the growth, photosynthetic pigment, and volatile compounds production of Lippia rotundifolia Cham in vitro. J. Photochem. Photobiol. B 2019, 198, 111577. [Google Scholar] [CrossRef] [PubMed]
- De Oliveira Prudente, D.; de Souza, L.B.; Paiva, R.; Domiciano, D.; de Carvalho, P.A.; Nery, F.C. Goji berry (Lycium barbarum L.) in vitro multiplication improved by light-emitting diodes (LEDs) and 6-benzylaminopurine. In Vitro Cell Dev. Biol. Plant 2019, 55, 258–264. [Google Scholar] [CrossRef]
- Dogan, M. The effects of different agar concentrations and light emitting diodes on in vitro shoot regeneration of Hygrophila polysperma (Roxb.) T. Anderson. Fresenius Environ. Bull. 2019, 28, 5382–5389. Available online: https://hdl.handle.net/11492/2524 (accessed on 17 November 2021).
- Faria, D.V.; de Freitas Correia, L.N.; de Souza, M.V.C.; Ríos Ríos, A.M.; Vital, C.E.; Batista, D.S.; Cardoso Costa, M.G.; Otoni, W.C. Irradiance and light quality affect two annatto (Bixa orellana L.) cultivars with contrasting bixin production. J. Photochem. Photobiol. B 2019, 197, 111549. [Google Scholar] [CrossRef] [PubMed]
- Gupta, S.D.; Kumar, A.; Agarwal, A. Impact of light-emitting diodes (LEDs) on the growth and morphogenesis of encapsulated shoot buds of Curculigo orchioides Gaertn., an endangered medicinal herb. Acta Physiol. Plant 2019, 41, 50. [Google Scholar] [CrossRef]
- Hu, J.; Leng, Y.; Jiang, Y.; Ni, S.; Zhang, L. Efect of light quality on regeneration and naphthoquinones accumulation of Arnebia euchroma. Plant Biotechnol. Rep. 2019, 13, 353–360. [Google Scholar] [CrossRef]
- Jiang, L.; Wang, Z.; Jin, G.; Lu, D.; Li, X. Responses of Favorita potato plantlets cultured in vitro under fluorescent and light-emitting diode (LED) light sources. Am. J. Potato Res. 2019, 96, 396–402. [Google Scholar] [CrossRef]
- Kepenek, K. Photosynthetic effects of light-emitting diode (LED) on in vitro-derived strawberry (Fragaria x Ananassa cv. Festival) plants under in vitro conditions. Erwerbs-Obstbau 2019, 61, 179–187. [Google Scholar] [CrossRef]
- Khan, T.; Ullah, M.A.; Garros, L.; Hano, C.; Abbasi, B.H. Synergistic effects of melatonin and distinct spectral lights for enhanced production of anti-cancerous compounds in callus cultures of Fagonia indica. J. Photochem. Photobiol. B 2019, 190, 163–171. [Google Scholar] [CrossRef]
- Lerin, J.; Aragão, V.P.M.; Reis, R.S.; Silveira, V.; Santa-Catarina, C. Proteomic profile and polyamine contents are modulated by light source to promote in vitro shoot development in Cariniana legalis (Martius) O. Kuntze (Lecythidaceae). Plant Cell Tissue Org. 2019, 137, 329–342. [Google Scholar] [CrossRef]
- Li, S.; Zhou, L.; Wu, S.; Liu, L.; Huang, M.; Lin, S.; Ding, G. Effects of LED light on Acacia melanoxylon bud proliferation in vitro and root growth ex vitro. Open Life Sci. 2019, 14, 349–357. [Google Scholar] [CrossRef] [PubMed]
- Lotfi, M.; Mars, M.; Werbrouck, S. Optimizing pear micropropagation and rooting with light emitting diodes and trans-cinnamic acid. Plant Growth Regul. 2019, 88, 173–180. [Google Scholar] [CrossRef]
- Maślanka, M.; Prokopiuk, B. Bulb organogenesis of Tulipa tarda in vitro cultures in relation to light environment. Acta Agric. Scand. B Soil Plant Sci. 2019, 69, 398–404. [Google Scholar] [CrossRef]
- Mehraj, H.; Alam, M.; Habiba, S.U.; Mehbub, H. LEDs combined with CHO sources and CCC priming PLB regeneration of Phalaenopsis. Horticulturae 2019, 5, 34. [Google Scholar] [CrossRef] [Green Version]
- Meng, X.; Wang, Z.; He, S.; Shi, L.; Song, Y.; Lou, X.; He, D. LED-supplied red and blue light alters the growth, antioxidant status, and photochemical potential of in vitro-grown Gerbera jamesonii plantlets. Hort. Sci. Technol. 2019, 37, 473–489. [Google Scholar] [CrossRef]
- Miler, N.; Kulus, D.; Woźny, A.; Rymarz, D.; Hajzer, M.; Wierzbowski, K.; Szeffs, L. Application of wide-spectrum light-emitting diodes in micropropagation of popular ornamental plant species: A study on plant quality and cost reduction. In Vitro Cell Dev. Biol. Plant 2019, 55, 99–108. [Google Scholar] [CrossRef] [Green Version]
- Nadeem, M.; Abbasi, B.H.; Younas, M.; Ahmad, W.; Zahir, A.; Hano, C. LED-enhanced biosynthesis of biologically active ingredients in callus cultures of Ocimum basilicum. J. Photochem. Photobiol. B 2019, 190, 172–178. [Google Scholar] [CrossRef]
- Nakonechnaya, O.V.; Gafitskaya, I.V.; Burkovskaya, E.V.; Khrolenko, Y.A.; Grishchenko, O.V.; Zhuravlev, Y.N.; Subbotin, E.P.O.; Kulchin, Y.N. Effect of light intensity on the morphogenesis of Stevia rebaudiana under in vitro conditions. Russ. J. Plant Physiol. 2019, 66, 656–663. [Google Scholar] [CrossRef]
- Pinheiro, M.V.M.; Schmidt, D.; Diel, M.I.; dos Santos, J.; Thiesen, L.A.; Vitalli de Azevedo, G.C.; Holz, E. In vitro propagation of alpinia cultivars in different light sources. Ornam. Hortic. 2019, 25, 49–54. [Google Scholar] [CrossRef]
- Ren, X.; Liu, Y.; Jeong, B.R. A two-stage culture method for zygotic embryos effectively overcomes constraints imposed by hypocotyl and epicotyl seed dormancy in Paeonia ostii ‘Fengdan’. Plants 2019, 8, 356. [Google Scholar] [CrossRef] [Green Version]
- Watcharatanona, K.; Ingkaninanc, K.; Putalun, W. Improved triterpenoid saponin glycosides accumulation in in vitro culture of Bacopa monnieri (L.) Wettst with precursor feeding and LED light exposure. Ind. Crops Prod. 2019, 134, 303–308. [Google Scholar] [CrossRef]
- Xu, Y.; Liang, Y.; Yang, M. Efects of composite LED light on root growth and antioxidant capacity of Cunninghamia lanceolata tissue culture seedlings. Sci. Rep. 2019, 9, 9766. [Google Scholar] [CrossRef] [PubMed]
- Zielińskaa, S.; Dryśb, A.; Piątczakc, E.; Kolniak-Ostekd, J.; Podgórskae, M.; Oszmiańskid, J.; Matkowski, A. Effect of LED illumination and amino acid supplementation on phenolic compounds profile in Agastache rugosa in vitro cultures. Phytochem. Lett. 2019, 31, 12–19. [Google Scholar] [CrossRef]
- Bantis, F.; Karamanoli, K.; Ainalidou, A.; Radoglou, K.; Constantinidou, H.I.A. Light emitting diodes (LEDs) affect morphological, physiological and phytochemical characteristics of pomegranate seedlings. Sci. Hortic. 2018, 234, 267–274. [Google Scholar] [CrossRef]
- Cioć, M.; Szewczyk, A.; Żupnik, M.; Kalisz, A.; Pawłowska, B. LED lighting affects plant growth, morphogenesis and phytochemical contents of Myrtus communis L. in vitro. Plant Cell Tissue Organ. Cult. 2018, 132, 433–447. [Google Scholar] [CrossRef] [Green Version]
- Chen, G.J.; Lee, M.S.; Lin, M.K.; Ko, C.Y.; Chang, W.T. Blue light decreases tanshinone IIA content in Salvia miltiorrhiza hairy roots via genes regulation. J. Photochem. Photobiol. B 2018, 183, 164–171. [Google Scholar] [CrossRef]
- Chen, L.; Xue, X.; Yang, Y.; Chen, F.; Zhao, J.; Wang, X.; Khan, A.T.; Hu, Y. Effects of red and blue LEDs on in vitro growth and microtuberization of potato single-node cuttings. Front. Agric. Sci. Eng. 2018, 5, 197–205. [Google Scholar] [CrossRef] [Green Version]
- Jeong, B.R.; Sivanesan, I. Impact of light quality and sucrose on adventitious shoot regeneration and bioactive compound accumulation in Ajuga multiflora Bunge. Sci. Hortic. 2018, 236, 222–228. [Google Scholar] [CrossRef]
- Larraburu, E.E.; Correa, G.S.; Llorente, B.E. In vitro development of yellow lapacho (Bignoniaceae) using high power light emitting diode. Rev. Árvore 2018, 42. [Google Scholar] [CrossRef]
- Lazzarini, L.E.S.; Bertolucci, S.K.V.; Pacheco, F.V.; dos Santos, J.; Silva, S.T.; de Carvalho, A.A.; Pinto, J.E.B.P. Quality and intensity of light affect Lippia gracilis Schauer plant growth and volatile compounds in vitro. Plant Cell Tissue Organ. Cult. 2018, 135, 367–379. [Google Scholar] [CrossRef]
- Li, R.; Huang, W.; Wang, X.; Liu, X.; Xu, Z. Effects of yellow, green, and different blue spectra on growth of potato plantlets in vitro. HortScience 2018, 53, 541–546. [Google Scholar] [CrossRef]
- Mamedes-Rodrigues, T.C.; Batista, D.S.; Napoleão, T.A.; Cruz, A.C.F.; Fortini, E.A.; Nogueira, F.T.S.; Romanel, E.; Otoni, W.C. Lignin and cellulose synthesis and antioxidative defense mechanisms are affected by light quality in Brachypodium distachyon. Plant Cell Tissue Organ. Cult. 2018, 133, 1–14. [Google Scholar] [CrossRef]
- Muneer, S.; Park, Y.G.; Jeong, B.R. Red and blue light emitting diodes (LEDs) participate in mitigation of hyperhydricity in in vitro grown carnation genotypes (Dianthus caryophyllus). J. Plant Growth Regul. 2018, 37, 370–379. [Google Scholar] [CrossRef]
- Nguyen, Q.H.; Park, Y.G.; Jeong, B.R. Promoted growth and development of carnation plantlets in vitro by ventilation and combined red and blue light. Flower Res. J. 2018, 26, 166–178. Available online: http://db.koreascholar.com/article.aspx?code=365555%27 (accessed on 17 November 2021). [CrossRef]
- Nhut, D.T.; Tung, H.T.; Tanaka, M. Enhanced growth and development of Cymbidium and Phalaenopsis plantlets cultured in vitro under light-emitting diodes. In Orchid Propagation: From Laboratories to Greenhouses-Methods and Protocols; Lee, Y.I., Yeung, E.T., Eds.; Springer Protocols Handbooks; Humana Press: New York, NY, USA, 2018; pp. 209–223. [Google Scholar] [CrossRef]
- Pawłowska, B.; Żupnik, M.; Szewczyk Taranek, B.; Cioć, M. Impact of LED light sources on morphogenesis and levels of photosynthetic pigments in Gerbera jamesonii grown in vitro. Hortic. Environ. Biotechnol. 2018, 59, 115–123. [Google Scholar] [CrossRef]
- Prokopiuk, B.; Cioć, M.; Maślanka, M.; Pawłowska, B. Effects of light spectra and benzyl adenine on in vitro adventitious bulb and shoot formation of Lilium regale EH Wilson. Propag. Ornam. Plants 2018, 18, 12–18. Available online: http://www.journal-pop.org/References/Vol_18_1(12-18).pdf (accessed on 17 November 2021).
- Rodrigues, P.H.V.; Arruda, F.; Forti, V.A. Slow-grown in vitro conservation of Heliconia champneiana cv. Splash under different light spectra. Sci. Agric. 2018, 75, 163–166. [Google Scholar] [CrossRef] [Green Version]
- Sant’Ana, C.R.D.O.; Paiva, R.; Reis, M.V.D.; Silva, D.P.C.D.; Silva, L.C. In vitro propagation of Campomanesia rufa: An endangered fruit species. Ciência Agrotecnol. 2018, 42, 372–380. [Google Scholar] [CrossRef]
- Souza, D.M.S.C. Fontes de luz na Micropropagação de Clones Híbridos de Corymbia. Dissertação Apresentada à Univ Federal de Viçosa, Como Parte das Exigências do Programa de Pós-Graduação em Ciência Florestal, para Obtenção do Título de Magister Scientiae. Brasil. 2018. Available online: http://www.locus.ufv.br/handle/123456789/19917 (accessed on 17 November 2021).
- Tung, H.T.; Nam, N.B.; Huy, N.P.; Luan, V.Q.; Hien, V.T.; Phuong, T.T.B.; Le, D.T.; Loc, N.H.; Nhut, D.T. A system for large scale production of chrysanthemum using microponics with the supplement of silver nanoparticles under light-emitting diodes. Sci. Hortic. 2018, 232, 153–161. [Google Scholar] [CrossRef]
- Wei, X.; Zhang, X.; Mao, J.; Liang, G.; Tong, H. Different light qualities modify morphology and expression of CsLHY in in vitro plantlets of Camillia sinensis. Int. J. Agric. Biol. 2018, 20, 676–682. [Google Scholar] [CrossRef]
- Mottus, M.; Sulev, M.; Baret, F.; Reinart, A.; Lopez, R. Photosynthetically Active Radiation: Measurement and Modeling. In Encyclopedia of Sustainability Science and Technology; Meyers., R.A., Ed.; Springer: New York, NY, USA, 2012. [Google Scholar] [CrossRef]
- Gago-Calderon, A.; Barceló-Muñoz, M.; Barceló-Muñoz, A. Descripción y estandarización de la iluminación LED para su utilización en el cultivo in vitro de plantas. In Proceedings of the XIV Reunión de la SECIVTV, El Ejido, Almería, Spain, 8–10 September 2021; Available online: https://riuma.uma.es/xmlui/handle/10630/22829 (accessed on 17 November 2021).
- Fujiwara, K.; Kozai, T. Physical microenvironment and its effects. In Automation and Environmental Control in Plant Tissue Culture; Aitken-Christie, T., Kozai, M., Smith, L., Eds.; Springer: Dordrecht, The Netherlands; Kluwer Academic Publishers: Alphen aan den Rijn, The Netherlands, 1995; pp. 319–369. [Google Scholar] [CrossRef]
- Tani, A.; Kiyota, M.; Taira, T.; Aiga, I. The effects oflight intensity, flow rate of aeration and plantlets on changes in temperatures in the vessel for plantlet culture. Plant Tissue Cult. Lett. 1991, 9, 133–135. [Google Scholar] [CrossRef]
- Pasqualetto, P.L. Vitrification in plant tissue culture. In Plant Aging; Springer: Boston, MA, USA, 1990; pp. 133–137. [Google Scholar] [CrossRef]
- Bula, R.; Tennessen, D.J.; Morrow, R.C.; Tibbitts, T.W. Light emitting diodes as a plant lighting source. HortScience 1991, 26, 203–205. [Google Scholar] [CrossRef] [PubMed] [Green Version]
- Olvera-Gonzalez, E.; Escalante-Garcia, N.; Myers, D.; Ampim, P.; Obeng, E.; Alaniz-Lumbreras, D.; Castaño, V. Pulsed LED-Lighting as an alternative energy savings technique for vertical farms and plant factories. Energies 2021, 14, 1603. [Google Scholar] [CrossRef]
- Huang, H.; Tang, H.F.; Chen, Y.; Zheng, X.F.; Hu, Y.; Wang, R.H.; Huang, M.L. Effect of intense pulsed light on Trichophyton rubrum growth in vitro. J. South. Med. Univ. 2017, 37, 853–857. [Google Scholar] [CrossRef]


| Energy Conversion | Visible Light | Ultra Violet (UV) | Infra-Red (IR) | Heat |
|---|---|---|---|---|
| Fluorescent lamps | 23% | 1% | 30% | 46% |
| Conventional Magnetic Ballast | High Efficiency Magnetic Ballast | Electronic Ballast |
|---|---|---|
| 20–25% | 14–16% | 8–11% |
| Technical Parameter | Quantity |
|---|---|
| Mercury content of the lamp | 2.80 mg |
| Control gear required | Electronic Ballast (+8–10% Power) |
| Average life (Nominal) | 14,000 h |
| Operating temperature range | −15–40 °C (Maximum luminous flux @ 25 °C) |
| Light color | Grolux (Chromaticity Not adjustable) |
| Species | Experimental Lighting Conditions | Parameters Studied | Remarks | References | |
|---|---|---|---|---|---|
| (A) | (B) | ||||
| Aeollanthus suaveolens | LEDs: W, G, Y, B, R, R:B (1:2.5, 2.5:1; 1:1) FL: CW (C) Graph spectrum but not given definition values or charactersitics | PPFD LED (μmol m−2 s−1): W [20, 57, 78, 102 and 139]; Monocromatic LED: undefined PPFD FL (μmol m−2 s−1): 42 SPECTRA PEN Z850 spectrometer; Qubit Systems QSO-S Procheck + Sensor-PAR Photon Flux device; Decagon Devices-Pullman. | Shoot and root no. and length; leaf no.; shoot, root and leaf DW; leaf area; total DW | Growth was optimal with a PPFD of 139 μmol m−2 s−1, CNOC and CHL content, increased at 20 μmol m−2 s−1. W LEDs and FL were similar for DW and growth, but R, B and Y LED inhibited the last | [22] |
| Stevia rebaudiana Bertoni | LED (nm): W (420) -undefined-, R (660), B (460) IP65 model, SMD 5050 RBG (Techno Lite®). FL: (4000–7000 nm) (C) -Typing error and undefined- | Illuminance (klux): CW FL 1, 2, 3 and 4 PPFD LED (μmol m−2 s−1): 40–50 | Shoot induction %, no. and length; leaf no.; FW; DW; callus formation; CNOC and CHL content | High-quality plants can be grown in vitro under B, R and W LEDs for mass propagation and genetic improvement | [23] |
| Clerodedum indicum and Acanthus ebracteats | LED (nm): W (400–700), B (425–500) and R (600–700) -undefined- | Irradiation: 61.5 W·m2 30 cm between light sources and plants | Verbascoside level | Methyjasmonate and B LEDs enhanced verbascoside level | [24] |
| Urtica dioica L. | LED: B, R, W and B:R (1:1, 2.5:1, 1:2.5) -undefined- FL: CW (C) -undefined- | PPFD LED (μmol m−2 s−1): 26, 51, 69, 94 and 130 PPFD FL (μmol m–2 s–1): 42 Portable spectrometer SPECTRA PEN Z850; Qubit Systems-Kingston. QSO-S Pro Check +Par Photon Flux Sensor; Decagon Devices; Pullman | Plant and root length, DW, leaf area, photosynthetic pigments, phenolics, favonoids and antioxidant activity | A PPFD of 94 μmol m−2 s−1 stimulated growth and DW. The antioxidant activity was directly proportional to the increase in light intensity | [25] |
| Brosimum gaudichaudii | LED (nm): W (400–700), B (400–490), R (645–700) and R:B (1:1, 1:3, 3:1) -undefined- | PPFD (μmol m−2 s−1): 100 ± 5 PAR sensor, model APG-SQ-316; Apogee | Shoot length, leaf no. and area, stem and leaf dry matter, total dry matter | R induced elongation. B and R:B enhanced the content of furanocoumarin, but B:R decreased the growth | [26] |
| Zingiber officinale Theilade | LED (nm): W (400−700), B (460), G (530), R (660), fR (720) and R:B (1:1) (400 and 660) LED Tubes, OSRAM Opto Semiconductors | PPFD (μmol m−2 s−1): W 15.3, fR 20.8, B 15.8, G 17.0, R 29.3, R:B 44.8 30 cm between light and plants | No. of Microsprouts, shoots, roots and leaves; shoot length; porphyrin, CHL and CNOC content | R LED improved rooting and shoot length, P stimulated micropropagation. G, R and P enhanced microshoot growth considerably, but fR and B, stimulated it too | [27] |
| Rosa x hybrida cv. Sena | CW FL cold bulbs 40 W & W LED bulbs 10W -undefined- | Shoot regeneration %, flowering induction %, abnormal flowers % | W LEDs (10W) reduced the % abnormal flowers in vitro, similar to W FLs (40 W) | [28] | |
| Capsicum frutescens | FL (Luz do Dia Especial) (40 W, Osram) -undefined- LEDs: W, R, B and R:B [6:4] (TEC LAMP®) -undefined- | PPFD (μmol m−2 s−1): 72 | Germination %; length; nodes no., no. of green and senescent leaves; FW, DW, CNOC, CHL | Porous membranes, R and B:R improved growth and development | [29] |
| Scrophularia kakudensis | LED (nm): R (621 and 710), B (450 and 475) (4 lamps PSLED1203-50A, Force Lighting) FL: CW 40 W, Philips -undefined- | PPFD (µmol m−2 s−1): 50 30 cm between light sources and plants | Growth, stomatal ultrastructure, phenols and flavonoids, activities of antioxidant enzymes, and protein expression | B or R LEDs improved the micropropagation. R and B elicited the synthesis of secondary metabolites | [30] |
| Droseraceae | LED: CW (7000 K), NW (4000 K) and WW (3000 K) FL: NW 3600 K Philips Master TL-D 58 W/835 | Illuminance (lx): 5000 measured:center of the shelf. PPFD (μmol m−2 s−1): FL 33.7 ± 11.4; LED 7000 K: 44.2 ± 15.3; LED 4000 K: 40.9 ± 13.7; LED 3000 K: 43.8 ± 14.8 GL Spectrolux spectrometer; GL Optic | Shoot length, growth, secondary metabolites production | LEDs results as a more efficient, eco-friendly and economically reasonable source of light for big scale in vitro production than FLs | [31] |
| Morus spp | LED (nm): R:G:B (635/520/452), R (635) and B (452). FL: W (C) Graph spectrum but not given definition values or charactersitics | PPFD (μmol m−2 s−1): 10 and 50 Spectral Colour Illumino meter; Hangzhou Hopoo | Deoxynojirimycin (DNJ) content | R LED particularly increased the DNJ production | [32] |
| Schomburgkia crispa Lindl. | LEDs: WW (3000 K) and CW (6500 K) FL: CW 6500 K [C] | PPFD LED (μmol m–2 s–1): WW 128; CW 58; and CW 108 PPFD FL (μmol m–2 s–1): CW FL 23 | Germination % | 3000 K LED induced a faster establishment and low mortality | [33] |
| Dracocephalum forrestii | LED (nm): B (430), R (670), B:R (7:3) and NW (430–670) -Graph spectrum but not given definition values- FL: CW [C] -undefined- | Spectrometer BTS256-LED Tester; Gigahertz-Optik PPFD (μmol m–2 s–1): 40 | Shoot proliferation and length; FW; DW; photosynthetic pigments; secondary compounds with therapeutic value | W LED induced the best proliferation. B was optimum for biomass and micropropagation. LEDs increaseed secondary metabolites accumulation | [34] |
| Hylocereus costaricensis | LEDs (nm): CW (400–700) [C], MW LEDs (540), R (660), B (440) and R:B (660 and 440). Osram Opto Semiconductors Darkness FL: CW Phillips TLD, 36 W Graphs of relative spectral distribution given | PPFD (μmol m–2 s–1): CW 30, MW 17.5, R 37.9, B 18.5, R:B 61.1, CW FL 30 SPIC200 portable spectral irradiance colourimeter; Everfine Corporation | Betalain pigment, phenolic and flavonoid content, antioxidant activity | R enhanced betalain content in Y and R callus. B and R + B light improved antioxidant properties. R enhanced phenolics, flavonoids and antioxidant activity in R callus | [35] |
| Pteris aspericaulis var. tricolor | LEDs (nm): W (450–470, 570–590), B (440) and R (660) | PPFD (μmol m−2 s−1): 40 | GGB differentiation frequency and FW, plant height, leaf morphology | LEDs did not affected GGB multiplication and differentiation. R promoted elongation, but B inhibited it | [36] |
| Ceratophyllum demersum | LED: W -undefined- | Iluminance (lux): 1500 | FW, DW, Cr uptake, BCF | In vitro plants are useful for Cr phytoremediation | [37] |
| Vaccinium corymbosum L. | LED: R:B (77:23) and W -undefined- FL: W -undefined- | PPFD (μmol m−2 s−1): 55 ± 12 | No. of shoots, FW, DW | R:B LEDs induced more production of meristems and biomass than W LED or FLs | [38] |
| Campomanesia pubescens (DC.) | LED (nm): R (600–700), B (400–490), W (400–700) and R:B (1:1) -undefined- | PPFD (μmol m−2 s−1): 50 ± 5 PPFD sensor QSO-S; Decagon Devices, Pullman | Biometry; leaf area and anatomy; MDA, DW; CHL, CNOC | R increased MDA, with oxidative damages. W, B:R enhanced biometry | [39] |
| Lippia filifolia | LED (nm): W (400–700) [C], B (450), R (653), R:B (664 and 448) | Spectrorad. R Tide USB 650 UV, Ocean Optics™ | Height, shoots no., FW, CHL, CNOC, others | R:B enhanced the growth and the regeneration | [40] |
| Passiflora edulis Sims | LED (nm): Combination of B (450), G (525), R (660), and IR (730) | PPFD (μmol m–2 s–1): 42 | Height, bud, root no., CHL content | R and mTR promoted a reliable propagation | [41] |
| Solanum tuberosum L. | LED: R (660), B (450), R:B (65:35) and R:B:G (520) (45:20:35) FL: W (C) -undefined- | PPFD (μmol m–2 s–1): 100 | Stem, root length and Φ, health index, leaf area, FW, DW, starch, others | B, R:B, R:B:G LEDs were better than FLs for micropropagation | [42] |
| Fritillaria cirrhosa D. Don | LED (nm): R (660), B (450), fR (730), CW (5000 K), WW (2700 K) R:B (8:1), R:G (525):B (7:1:1) and R:B:fR (1:1:1) | PPFD (μmol m–2 s–1): CW 57; WW 56; R:G:B 56; R:B 57; B 57; R 56; fR 10; R:B:fR 56 | No. of SE, FW, alkaloid content | R, fR increased alkaloid content. R, fR, R:B:fR enhanced FW and SE nº | [43] |
| Bambusa oldhamii Munro | LED (nm): B (455), R (630), R:B (30:70; 70:30) (TEC-LUX LED) FL: W (C) -undefined- | PPFD FL (μmol m–2 s–1): 40 | Shoot height, no. of shoots and leaves | B:R, TDZ and gas exchange increased shoot proliferation | [44] |
| Dysphania ambrosioides L. | LED: B, R, W and B:R [1:1, 2:1, 1:2] -undefined- | PPFD (μmol m–2 s–1): LED: 42; FL CW: 60 | Shoot length; leaf, shoot and root dry biomass; VCO | W, B:R [2:1] increased the growth. B reduced Z-ascaridole content | [45] |
| Limnophila aromatica & Rotala rotundifolia | LED: W, R, B, W:R:B (2:1:1), W:R:B (1:2:1), W:R:B (1:1:2) and W:R:B [1:1:1] -undefined- FL: W [C] -undefined- | Iluminance (lux): 1500 Luxometer PCE-EM 888 | Regeneration %, no. and length of shoots | W:R:B [1:2:1] was the most effective for in vitro propagation | [46] |
| Anoectochilus roxburghii | LED (nm): R (630), B (465), B:R (20:80), B:R:W (13.8: 72.4: 13.8; 13.8: 58.6: 27.6) FL: (C) -undefined- | PPFD (μmol m–2 s–1): 30 ± 2.13 Distance between plants and lights: 40–60 cm | Stem diameter, leaf no. and area, height, FW, DW, root no., stem anatomy, flavonoids | BR [1:4] enhanced the flavonoids content, the propagation and the medicinal value | [47] |
| Camellia oleífera Huajin | LED (nm): R (640), B (450), R:B (4:1) and R:B (1:4) LED: W (C) -undefined- | PPFD (μmol m–2 s–1): 50 ± 5 | Proliferation, length, height, CHL, CNOC, leaf anatomy, proteins | R:B [4:1] induced the highest proliferation coefficient | [48] |
| Brassica eruca, ‘Rocket’ and Brassica juncea, ‘Ruby Streaks’ | LED (nm): R (665), B (440) (Pro-Series 325 by LumiGrow) | PPFD (μmol m–2 s–1): 20, 70, 120, 250, 450 and 650 | Dry mass, hypocotyl and petiole elongation, size, plant coloring | B LED promoted elongation, but this varied with light intensity and plant species. | [49] |
| Solanum tuberosum L. | LED (nm): B (440), B (460), G (520), Y (590), R (620) and R (660) | PPFD (μmol m–2 s–1): 65 | Height, stem diameter, leaf and microtuber no., CHO | Light reduced the production cycle, and increased microtubers | [50] |
| Elaeis guineensis | LED (nm): R (660), B (460) and R:B [3:1] (660 and 460) LED W: 10,000 K; FL: W 6500 K, Phillips T5 28 W; DARK | FW, leaf no., shoot height, roots | R:B induced the growth. R enhanced the rooting | [51] | |
| Solanum tuberosum L. | LED (nm): Comb of UV-A (380) + UV-A (400) + B (450) + G (520) + R (660) + fR (735) FL: WW 2700 K (+C) DARK (-C) | PPFD LED max (μmol m–2 s–1): 1000 PPFD FL (μmol m–2 s–1): 2.8–4.6 | Sprout length, growth vigour | R at low irradiances, reduced elongation; fR at hight ones, reduced it according to the cv. | [52] |
| Saccharum officinarum L. | R:B LEDs (Philips Green Power R/B 150 43 W) DR:W LEDs (Philips GP DR/W 150 33 W) FL: W (OSRAM Sylvania) | PPDF (μmol m−2 s−1): R:B 70, 120 and 200 ± 25; DR:W 70 and 120; W FL 200 | Shoot height, leaf no., yellow leaf %, shoot and root no., root length, FW, DW, CHL | Increases in light intensity stimulated plant height and leaf nº, without negative effects | [53] |
| Cedrela fissilis Vell | LED: W:mB, W:mB:DR, W:mB:DR:fR -undefined- LED (nm): B (425–490), DR (620–700) and fR (700–740) FL [C] -undefined- | Length and no. of shoots, FW, DW | BA, WmBdR: enhanced FW, DW and length. Proteins were identified | [54] | |
| Rehmannia elata N.E. Brown ex Prein | W LED (8000–10,000 K) RB:B:lR:R:DR:fR (5:10:10:35:35:5) LED (nm): RB (430), B (460), lR (610), R (630), DR (660), fR (730) | PPFD (μmol m–2 s–1): 40 | Shoot %, axillary shoots no., leaf area and width, roots no. and length, CHL | PAR illumination and PGRs enhanced the regeneration | [55] |
| Solanum tuberosum L. | LED (nm): W (C) -undefined-; R (650), B (460), R:B (3:7), R:B (1:1) and R:B (7:3) | PPFD (μmol m–2 s–1): W 100, R and B 210 | Height, stem diameter, branches and leaves no., leaf area, FW, DW, health index, pigments, starch, soluble proteins, sugars and phenolics, ROS and ascorbate content | R:B (3:7) was optimal for plant development and growth | [56] |
| Physalis angulata | Luminaire: Screen filtered by Polysack’s Cromatinet® black photoconverter mesh with 50% shading with 6 lamps | LED (nm): B (450), R (660), B:R, G (525), Y (590) LED CW (7000 k) | O2, CO2, stem and root length, leaf area, nodal segments, CHL, CNOC, leaf anatomy | Filtered natural light, allowed photoautotrophic propagation. LEDs did not promote it | [57] |
| Hordeum vulgare L. | LED (nm): B (454.63), G (525.95), R (630.84) DARK in callus induction | Quantitative analysis of DNA methylation | The methylation depends on the light conditions | [58] | |
| Pfaffia glomerata | LED (nm): R (665), B (440), R:B (1:1), R:B (1:3) and R:B (3:1) | PPFD (μmol m−2 s−1): 80 | Stem and root length, leaf area, DW, CHL, CNOC | R and B LEDs enhanced biomass and 20E production | [59] |
| Libidibia ferrea | LED: R:B and W -undefined- | PPFD (μmol m–2 s–1): 31 ± 1 | Shoots length and no., multiplication, buds no. | R:B stimulated the growth | [60] |
| Corymbia. citriodora × C. torelliana and C. torelliana × C. citriodora | LED: CW -undefined- LED (nm): R:B (450 and 660) FL: -undefined- | Shoots length, no.; vigor, oxidation, CHL, CNOC content | R:B LEDs and sucrose enhanced elongation | [1] | |
| Hybrid Corymbia clones | LED: CW -undefined- LED (nm): R:B (450 and 660) FL: -undefined- | Length, no., vigor and oxidation of axillary shoots | R:B, BA and ninth subculture, enhanced multiplication | [61] | |
| Scutellaria baicalensis | LED (nm): B (420–480), R (600–650), WW (400–800) DARK [C] | PPFD (µmol m−2 s−1): 1 | Growth of callus, flavones content | Light increased the callus. B induced flavones content | [62] |
| Solanum xanthocarpum | LED (nm): B (460), G (510), R (660) and Y (570) LED W (400–700 nm) -undefined- DARK | PPFD (µmol m−2 s−1): 45–50 | Flavonoids, phenolics, phytochemicals, antioxidant activity | W increased the biomass. B, enhanced phytochemicals and phenolics content | [63] |
| Dendrobium Enopi x Dendrobium Pink Lady | LED CW (400–700 nm) LED (nm): fR (730), R (660), G (530), B (440) and B:R | PPFD (µmol m−2 s−1): CW 4.6, 5.2 and 17.0; fR 1.1, 9.1 and 20.8; R 1.3, 15.4 and 29.3; G 0.8, 6.2 and 16.9; B 0.9, 6.7 and 15.7; B:R 2.0, 20.3 and 44.8 | Phenolics content, secondary metabolites accumulation | B:R increased flavonoids. R FL pre-illumination reduced LED effects on metabolites production | [64] |
| Oryza sativa L. cv. Nipponbare | FL W and LED: B, B:R (3:1, 1:1; 1:3), R | PPFD (μmol m–2 s–1): 50 | Differentiation and budding rate, healthy index, plant no., length, CNOC, CHL, others | B improved callus regeneration. B:R [1:1] enhanced rice factory seedling cultivation | [65] |
| Cunninghamia lanceolata | LED: R:B (88.9:11.1), R:B:P (80:10:10), R:B:P:G (72.7:9.1:9.1:9.1), R:B:G (12.7:3.9:83.4) [C] | PPFD (μmol·m−2 s−1): 20 & 30 | Plant height and no., rooting %, root no. and length, area, CHL | R:B:P:G was the best for in vitro growth | [66] |
| Lippia grata Schauer | LED R:B [5:1;1:1] and R:G:B LED (nm): B (460), R (640) and G (530) FL: W -undefined- | Non-ventilation under FL PPFD (μmol m–2 s–1): 60 | Sprouts no., roots, leaves, FW, hyperhydricity, height, sucrose, CHO and CNOC content | Hyperhydricity was reduced under R:B and sealing; W decreased it in leaves | [67] |
| Carpesium triste Maxim. | LED: CW -undefined-, LED (nm): R (621–710), B (450–475), R:B (1:1) (400–700 nm | PPFD (μmol m–2 s–1): 50 | Shoot diameter and length, root length and no., FW, DW | R and B LEDs produced high-quality in vitro plants | [68] |
| Moluccella laevis L. | LED (nm): W 8000–10,000 K (400–700) and B (430):B (460):R (610):R (630):fR (730) (5:10:10:35:35:5) (LED lamps Commled Solutions) | PPFD (μmol m–2 s–1): 180 Portable LightMeter HD 2302.0 equipped with LP 471 PAR and LP471 UVA detectors (DeltaOhm) | Shoots and buds proliferation, axillary shoots no. and length, callus diameter, CHL | PGRs effect on shoot growth and development was stronger than the light infuence | [69] |
| Two tomato cvs: House Momotaro and Mini Carol | Eight-peak LED [C] (nm) R (625 and 660), B (420 and 450), G (520), fR (730), UV (390) and W (400–700 nm) -undefined-; DARK | PPFD (μmol m–2 s–1): 226–249 | ASA, DHA, antioxidant enzymes, H2O2, oxidative parameters | High light intensity enhanced ASA content. Differences with B and R LEDs were observed | [70] |
| Musa spp. CV. Dwarf Cavendish | LED R:B (18:2) FL: W -undefined- | Iluminance (lux): 1000 | Shoots no., length, FW, DW, CHO, CHL, CNOC | R:B LEDs improved in vitro propagation | [71] |
| Drosera burmannii Vahl and D. indica L. | LED (nm): W (400–700), B (425–500) and R (600–700) -undefined- DARK | Irradiance (W·m2): 61.5 Distance lamps and plants: 30 cm | Plumbagin content | B LED enhanced plumbagin level, being higher in aerial parts | [72] |
| Gerbera jamesonii | FL: W (C) -undefined- LED (nm); R:B (7:3) (670 and 430) | PPFD LED (µmol m−2 s−1): 40, 80 and 120 PPFD WFL (µmol m−2 s−1): 40 [C] | Multiplication, leaf no., morphometry, axillary shoots, height, FW, DW, CHL | R:B and BA improved growth. High radiation enhanced leaf features | [73] |
| Solanum tuberosum L. | LED (nm): B (450), G (530) and R (660) LED: WW [C] –undefined- | PPFD (µmol m−2 s−1): 100 Distance lamps and shelf: 60 cm | Height, diameter, FW, DW, leaf area and no., health index | B increased health index. Light quality induced DEGs patterns | [74] |
| Chickpeas | R LED -undefined- FL: (EN 12464-1 FLUORA) | PPFD (µmol m−2 s−1): 70 | Transgenic shoots, grafting | LEDs and micro-injury improved transformation | [75] |
| Lippia rotundifolia Cham | LED: W, R, B, R:B (1:1; 2.5:1;1:2.5) FL: CW -undefined- | PPFD FL CW (µmol m−2 s−1): 20, 54, 78, 88 and 110 PPFD (µmol m−2 s−1): 42 | Shoot length, leaf no., DW (shoot, leaf, root and total), CHL, CNOC | R:B and low intensity promoted high growth and pigments | [76] |
| Lycium barbarum L. (Goji Berry) | FL: W (400–700 nm) –undefined- R:B LED (630 and 460 nm) | PPFD W FL (µmol m−2 s−1): 36 PPFD LED (μmol m−2 s−1): 86 | Buds %, shoot length and no., leaf nº | RB stimulated shoots length and the multiplication | [77] |
| Hygrophila polysperma | LED: W, R, B, R:B, R:W, B:W, R:B:W -undefined- | No. of shoots | W:R:B incremented the shoots nº | [78] | |
| Bixa orellana L. | FL: CW 4200 K LED W -undefined- B:R -undefined- | PPFD (µmol m−2 s−1): 50, 150 and 200 | Leaf stomatal density, no. and area, bixin, MDA, CNOC, CHL | B:R and FL enhanced bixin and pigments depending on the cv. | [79] |
| Curculigo orchioides Gaertn | LED (nm): B (470), R (630), B:R (1:1) FL: CW (300–700 nm) -undefined- [C]. | PPFD (µmol m−2 s−1): 50 | Germination, shoots, roots, FW, DW, leaf area and density, CHL, CNOC, others | B and BR improved the synseed growth. R reduced growth and germination | [80] |
| Arnebia euchroma | FL CW (420 nm LED (nm): UV (410–416) B (450–455), R (650–660), R:B:W (25:25:50) and W//DARK | PPFD (µmol m−2 s−1): 60 | Germination rate, shoot no., FW, DW, naphthoquinones content | RBW, R enhanced growth. R increaded roots and dark the naphthoquinones content | [81] |
| Solanum tuberosum L. | LED (nm): R (660), B (450), R:B (80:20; 70:30;50:50) FL: CW -undefined- | PPFD (µmol m−2 s−1): 40 | FW, height, CHL, soluble sugar content | R:B (70:30) was the best | [82] |
| Fragaria x ananassa cv. Festival | LED (nm): fR (735):R (640):G (510):B (450):WW (3000 K) (15:55:15:10:5) FL: CW (C) -undefined- | PPFD LED (µmol m−2 s−1): 25, 50, 75 and 100 PPFD FL (µmol m−2 s−1): 45 | Survival rate, shoots no. and lenght, leaf area, height, root no., rooting %, FW, DW | PPFD of 75μmol m–2 s–1, R:fR:B:G:WW was suitable | [83] |
| Fagonia indica | LED (nm): W (380–780), B(380–560), G (480–670), Y (530–780), R (610–715) -undefined- FL: W -undefined-; DARK | PPFD (µmol m−2 s−1): 40–50 | FW, DW, flavonoid and phenolic contents, callus, antioxidative enzyme activities | W LED enhanced phenolics and flavonoids production. Under B LED, SOD and POD were best | [84] |
| Cariniana legalis (Martius) O. Kuntze | LED W: -undefined- LED: low B and DR, W:low B, DR: fR, W: medium B: DR, W:medium B:DR FR -undefined- FL: (C) -undefined- | PPFD (µmol m−2 s−1): 55 | Length and no. of shoots, shoot induction | B:R:fR light induced shoot elongation. W:B:R LED affected the endogenous contents of Pas | [85] |
| Acacia melanoxylon | W LED (400–700 nm) R:B LED (1:1; 1:4; 1:4) -undefined- FL: (C) -undefined- | PPFD (µmol m−2 s−1): W LED: 45, 90 and 135 LED and FL: 135 | Bud proliferation, growth, rooting rate, length and no. | R:B promoted growth. High photoperiod and intensity enhanced growth and reduced the proliferation | [86] |
| Pyrus communis L. | LED (nm): B (454), R (660), fR (745), R:B (1:1), fR:B (1:1), R:fR (1:1) FL: WW 3000 K (C) | PPFD (µmol m−2 s−1): 40 | No. and length of shoots, callus weight, leaf area, CHL, CNOC | R promoted shoots length; fR stimulated the nº, but reduced the shoot quality. B enhanced the callus growth | [87] |
| Tulipa tarda Stapf | FL: W (390–760 nm), R (647–770 nm), B (400–492 nm) DARK [C] | Frequency of differentiation, no. of adventitious bulbs, FW | Dark enhanced the adventitious bulbs nº. Light spectra did not produces differences | [88] | |
| Phalaenopsis ‘Fmk02010’ | LED: R, G, B, W, R:G, R:B, R:W G:B, G:W, B:W, R:G:B, R:B:W, R:G:W, G:B:W -all undefined- FL: W (C) -undefined- | PPFD (µmol m−2 s−1): 54 | No. and FW of PLBs, shoots, and roots, length of shoots | R, B or R:B used first and then W enhanced the regeneration and specifics CHO content | [89] |
| Gerbera jamesonii | LED (nm): R (657), B (450), R:B (8:2; 7:3; 6:4; 5:5) FL: W (C) -undefined- | PPDF (µmol m−2 s−1): 40 | Height; leaf length and no.; root length and no.; DW, CNOC, CHL | R:B (7:3) improved growth and photosynthetic activity | [90] |
| Chrysanthemum × grandiflorum, Gerbera jamesonii, Heuchera × hybrida, Ficus benjamina, and Lamprocapnos spectabilis | LED: B:G:R:FR (14:16:53:17; 12:19:61:8; 8:2:65:25) UV:B:G:R:FR (1:20:39:35:5) -undefined- FL: CW 6200 K (C) | PPFD FL (µmol m−2 s−1): 62–65 | Micropropagation efficiency, shoot length, leaf and root no., root length, FW, DW, CHL | B:G:R:fR LED was the best for plant quality, micropropagation and cost reduction | [91] |
| Ocimum basilicum | LED (nm): R (660), B (460), G (510), Y (570), W (400–700) FL W (400–700 nm) (C)-undef- DARK | PPFD (µmol m−2 s−1): 40–50 | Phenolic and flavonoid content | LEDs light is a potent elicitor for in vitro metabolites production | [92] |
| Stevia rebaudiana (Bertoni) | Solar Box (SB) LED LED: R:G:B, R:B LED WW (3000 K) FL: W 6500 K [C] | LED (nm): R (650), G (520), B (450) PPDF FL (µmol m−2 s−1): 49 PPDF LED (µmol m−2 s−1): 75, 135, 230 and 382 | Height, internode and leaf length, leaf width, FW and DW of roots and shoots | Light intensity at 75 to 230 μmol m−2 s−1 improved the plant development | [93] |
| Alpinia purpurata | LED: -undefined- FL -undefined- | PPFD (µmol m−2 s−1): 72 | Shoot and leaf no., shoot length | The light effect varied according to the cv. | [94] |
| Paeonia ostii Fengdan | LED: R, B, R:B –undefined- DARK (C) | PPFD (µmol m−2 s−1): 50 | Hypocotyl and epicotyl dormancy breaking % | Dormancy was broken in dark, R or B depending on the case | [95] |
| Bacopa monnieri (L.) Wettst | LED (nm): B (425–500), R (600–700) LED: W (400–700) (C); DARK | Triterpenoid saponin glycosides content | B light was the most suitable for bioactive compound content | [96] | |
| Cunninghamia (C.) lanceolata | R:B (4:1; 8:1), R:B:P (8:1:1), R:B:P:G (6:1:1:1; 8:1:1:1) W LED (C) -undefined- | LEDs (nm): Red (620–630), B (460–470), P (410–420), G (520–530) Illuminance (lux): 600–700 on the surface of the bottles | Rooting rate, root no., surface area and activity | R:B:P:G enhanced root growth, and R:B:P:G (8:1:1:1) was the best | [97] |
| Agastache rugosa | LED W: WL 2700 K; WL 3000 K, NW 4000 K LED (nm):RB (450), B (470), B (500), G (525), R (660), fR (720) FL: CW 4000 K | PPFD FL and WLED (μmol m−2 s−1): 40 | Axillary bud breaking %, axillary shoots no., length of shoot | The age of cultures, light and amino acids affected the phenolic compounds content | [98] |
| Punica granatum L. | LED (nm): UV (<400 nm), B (400–500), G (500–600), R (600–700), fR (700–800) | PPFD (μmol m−2 s−1): 200 ± 20 | Leaf no., leaf area, root length, shoot height, FW and DW of shoots, leaves and roots | FLs reduced the roots. B, R, high G, enhanced the morphological features | [99] |
| Myrtus comutis L. | LED (nm):B (430), R (670), R:B (70:30) FL: W 6200 K (C) | PPFD (μmol m−2 s−1): 35 | Multiplication, height, leaf no., FW, DW, CHL, CNOC, others | R stimulated growth and polyphenols. BA enhanced growth | [100] |
| Salvia miltiorrhiza | 12 light treatments. Combination of LED (nm): R (660), G (525), B (450), fR (730) and UV (380) | Tanshinone IIA (TSIIA) content | LEDs affected secondary metabolite production through gene regulation | [101] | |
| Solanum tuberosum | LED (nm): R (660), B (440) and G (525) LED WW -undefined- | PPFD (μmol m−2 s−1): 75 | Stem diameter, height, nodes no., leaf area, FW, DW | R:B stimulated the micropropagation and microtuber production | [102] |
| Ajuga multiflora Bunge | LED (nm): B (660), R (450) FL: CW -undefined- | PPFD (μmol m−2 s−1): 45 | Shoots no. and length, tocopherols, CNOC | WFL and 2% sucrose increased shoots number. B, R enhanced the micropropagation | [103] |
| Handroanthus ochraceus | LED: WW (peaks 475, 550 nm) -undefined- FL: W (peaks 400, 440, 490, 550, 615, 710 nm) -undefined- | PPFD (μmol m−2 s−1): 15, 20, 30, 40, 50 and 60 | Multiplication rate, hyper hydricity; roots %; shoots and roots FW, DW and length; leaf number | High-power LED irradiation increased the shoot growth | [104] |
| Lippia gracilis | LED -undefined-: R, B, R:B (2.5:1; 1:2.5) FL: CW –undefined- | PPFD (μmol m−2 s−1): 26, 51, 69, 94 and 130 | Shoot and root length, shoot and leaf no., DW, CHL, CNOC | R and 94 µmol m−2 s−1 stimulated the growth. B, the photosynthetic pigments | [105] |
| Solanum tuberosum L. | LED (nm): R (630), B (445–465), Y (590), G (520), R:B:Y [6:2:1], R:B:G (6:2:1), R:Y:G (6:2:1), R:B:G (6:2:1) FL: (400–700 nm) (C) -undef- | PPFD (μmol m−2 s−1): 72 ± 2 | Stem and root length, stem diameter, health index, leaf area, CHL, FW, DW, starch, others | R:B:Y LED increased the vigor in in vitro plants | [106] |
| Brachypodium distachyon | LED: CW -undefined- LED: B:R (450 and 660 nm) FL: CW -undefined- | PPFD FL (μmol m−2 s−1): 150 PPFD LED (μmol m−2 s−1): 56 | Height, DW, shoot no., panicles, roots, histochemical analyses | Light quality regulates cell wall deposition and lignification patterns | [107] |
| Dianches caryophyllus L. | LED: R and B -undefined- FL: CW -undefined- | PPFD (μmol m−2 s−1): 50 | Adventitious shoot, proteins levels | FLs increased hyperhydricity R and B LEDs reduced it | [108] |
| Dianthus caryophyllus L. | W LED [C] -undefined- LED: B, R, R:B -undefined- | Shoots no. and length, hyperhydricity, plant quality, CLH | B or R LEDs and ventilation improved the quality of plants | [109] | |
| Phalaenopsis y Cymbidium | LED: R, B, R:B (90:10), R:B LED (80:20), R:B LED (70:30) -undef- FL: Growlux [C] | PPDF FL (μmol m−2 s−1): 45 PPDF LED (μmol m−2 s−1): 60–75 | Leaf no, height, shoot and root FW, DW, root length and nº, CLH | R and B enhanced the in vitro propagation. R produced weak plants with thin stems | [110] |
| Gerbera jamesonii | LED (nm): R (430), B (670), R:B (50:50; 70:30), R:B:W (430–730) (40:40:20) and R:B:fR (730) (49:49:2) FL: CW 6200 K [C] | PPFD (μmol m−2 s−1): 40 | Shoot no., plant length and heigh, rooting %, roots length and no., leaf no., DW, CLH, CNOC | R:B (70:30) incremented the multiplication. R was optimal in rhizogenesis | [111] |
| Lilium regale | LED (nm): R (670), B (430) and R:B (70:30). FL: CW 6200 K (C) DARK | PPFD (μmol m−2 s−1): 35 | Regeneration %, bulbs, shoots and roots no. | B and B:R enhanced the organogenesis, dark and FL reduced it. R promoted roots, but reduced bulb growth | [112] |
| Heliconia Champneiana cv. Splash. | LED (nm): R (620–630), B (455–475) and R:B [70:30] FL: W (380–780 nm) [C] -undef- | PPFD (μmol m−2 s−1): 25 | Height, FW, no. and length of roots, no. of leaves | B reduced the growth, improved the quality and the survival in acclimatization | [113] |
| Campomanesia rufa | FL: W (20 W) -undefined- LED: R:B (7:3) -undefined- | PPDF FL (μmol m−2 s−1): 44 PPDF LED (μmol m−2 s−1): 98 | Shoots and buds no., shoots length, leaves no. | BAP and FL W FLs improved shoots and buds growth | [114] |
| Corymbia. torelliana x C. citriodora, C. citriodora x C. torelliana | LED (nm): B (450) and R (660) FL: Grolux DARK | PPFD (μmol m−2 s−1): 80 | Shoots length and no., contamination, oxidation | R, B LEDs produced the best results in in vitro propagation | [115] |
| Chrysanthemum morifolium Ramat cv. Jimba | LED (nm): G (565), B (450), R (660), Y (590), B:R (10:90; 20:80; 30:70; 40:60; 50:50; 60:40) FL: (C) -undefined- | PPFD (μmol m−2 s−1): 40–45 | FW, DW, leaf size, no. and stomata density, photosynthesis rate | Microponic system, R:B (70:30) and AgNPs enhanced the development | [116] |
| Camillia sinensis | LED: B, R, FR, W -undefined- FL: W (C) -undefined- | PPDF FL (μmol m−2 s−1): 30–40 PPDF LED (μmol m−2 s−1): 50 | Leaf area and FW, stem length and diameter, CLH, CNOC | R increased growth. B stimulated CsLHY expression and fR inhibited | [117] |
Publisher’s Note: MDPI stays neutral with regard to jurisdictional claims in published maps and institutional affiliations. |
© 2021 by the authors. Licensee MDPI, Basel, Switzerland. This article is an open access article distributed under the terms and conditions of the Creative Commons Attribution (CC BY) license (https://creativecommons.org/licenses/by/4.0/).
Share and Cite
Barceló-Muñoz, A.; Barceló-Muñoz, M.; Gago-Calderon, A. Effect of LED Lighting on Physical Environment and Microenvironment on In Vitro Plant Growth and Morphogenesis: The Need to Standardize Lighting Conditions and Their Description. Plants 2022, 11, 60. https://doi.org/10.3390/plants11010060
Barceló-Muñoz A, Barceló-Muñoz M, Gago-Calderon A. Effect of LED Lighting on Physical Environment and Microenvironment on In Vitro Plant Growth and Morphogenesis: The Need to Standardize Lighting Conditions and Their Description. Plants. 2022; 11(1):60. https://doi.org/10.3390/plants11010060
Chicago/Turabian StyleBarceló-Muñoz, Araceli, Marta Barceló-Muñoz, and Alfonso Gago-Calderon. 2022. "Effect of LED Lighting on Physical Environment and Microenvironment on In Vitro Plant Growth and Morphogenesis: The Need to Standardize Lighting Conditions and Their Description" Plants 11, no. 1: 60. https://doi.org/10.3390/plants11010060
APA StyleBarceló-Muñoz, A., Barceló-Muñoz, M., & Gago-Calderon, A. (2022). Effect of LED Lighting on Physical Environment and Microenvironment on In Vitro Plant Growth and Morphogenesis: The Need to Standardize Lighting Conditions and Their Description. Plants, 11(1), 60. https://doi.org/10.3390/plants11010060