Article

Soil Microbial Legacy Overrides the Responses of a Dominant Grass and Nitrogen-Cycling Functional Microbes in Grassland Soil to Nitrogen Addition

1
Key Laboratory of Vegetation Ecology, Ministry of Education, Jilin Songnen Grassland Ecosystem National Observation and Research Station, Institute of Grassland Science, Northeast Normal University, Changchun 130024, China
2
Jilin Provincial Key Laboratory of Ecological Restoration and Ecosystem Management, Northeast Normal University, Changchun 130024, China
*
Author to whom correspondence should be addressed.
Plants 2022, 11(10), 1305; https://doi.org/10.3390/plants11101305
Submission received: 28 March 2022 / Revised: 3 May 2022 / Accepted: 12 May 2022 / Published: 13 May 2022
(This article belongs to the Topic Plant-Soil Interactions)

Abstract

:
Both atmospheric nitrogen (N) deposition and soil microbial legacy (SML) can affect plant performance, the activity of soil N-cycling functional microbes and the relative abundance of N-cycling functional genes (NCFGs). In the grassland vegetation successional process, how the interaction of SML and N deposition affects the performance of dominant grass and NCFGs remains unclear. Therefore, we planted Leymus chinensis, a dominant grass in the Songnen grassland, in the soil taken from the early, medium, late, and stable successional stages. We subjected the plants to soil sterilization and N addition treatments and measured the plant traits and NCFG abundances (i.e., nifH, AOB amoA, nirS, and nirK). Our results showed the biomass and ramet number of L. chinensis in sterilized soil were significantly higher than those in non-sterilized soil, indicating that SML negatively affects the growth of L. chinensis. However, N addition increased the plant biomass and the AOB amoA gene abundance only in sterilized soils, implying that SML overrode the N addition effects because SML buffered the effects of increasing soil N availability on NCFGs. Therefore, we emphasize the potential role of SML in assessing the effects of N deposition on dominant plant performance and NCFGs in the grassland vegetation succession.

1. Introduction

There is increasing interest in the importance of soil microbial legacies and their role in ecological succession [1,2]. Generally, previous plant communities have a long-lasting effect on soil microorganisms through the root exudate and litter, thus forming specific microbial communities [3]. Furthermore, these specific microbial communities critically impact the growth of subsequent plants, and this microbe-mediated effect is called the soil microbial legacy [3,4]. In many ecosystems, soil microbial legacy can influence the biomass of plants, regulate the contents of plant carbon (C), nitrogen (N) and phosphorus (P), and influence the replacement of plant species over time [1,4]. Many studies have concluded that soil microbial legacy affects plant growth through plant-microbe interactions [1,5] and potentially drives ecological succession through soil pathogen accumulation [6], soil nutrition changes [7], and the effects of symbiotic microbes [5]. Additionally, some studies have confirmed that soil microbial legacy regulates the changes in plant communities via soil microorganisms [3,8], whereas how the soil microbial legacy of ecological succession affects dominant species is still poorly understood. Therefore, it is worthwhile to elucidate the mechanisms of soil microbial legacy effects on ecosystem succession.
Soil microbial legacies play a key role in grassland vegetation successions because grassland ecosystems are highly sensitive to changes in the soil microenvironment [9]. In the early successional stages of grassland ecosystems, pioneer species produce soil microbial legacy effects by influencing soil microbes. These effects potentially impact the invasion, colonization, and growth of subsequent plants inhabiting the same area [10]. After mid-successional stages (i.e., plant species abundance and total biomass are significantly higher than those in early successional stages), soil microbial legacy often causes soil pathogen accumulation, thus decreasing the biomass of dominant species and promoting community turnover [6]. However, some studies report that symbiotic microorganisms will alleviate the negative effects of soil microbial legacy on some dominant species in the late successional stage [5,11]. Likewise, different plant species have diverse responses to the same soil microbial legacy due to the complexity of soil microbial community composition and structure in grasslands [12]. Therefore, it remains unclear whether the soil microbial legacy has positive or negative effects on dominant species during the successional stages of grassland ecosystems.
Soil N-cycling functional microbes are the main factors by which soil microbial legacy affects plant growth [13,14]. Due to the positive correlation between soil N-cycling functional microbes and the abundances of N-cycling functional genes (NCFGs), the expression of NCFGs can reflect how soil microbial legacy affects plant growth through the N-cycling functional microbes [13,15,16]. For instance, some plants can modify the composition of soil ammonia-oxidizing bacterial genes (AOB amoA) and alter the N cycle, thus forming the soil microbial legacy that influences subsequent plant growth [13]. Likewise, the expression of soil denitrifying microbial genes (nirK and nirS) indicates that crops respond to previous crop rotations [16]. Although previous plant communities are the main factor that creates soil microbial legacy, the effect of soil microbial legacy in grassland ecosystems is also influenced by atmospheric N deposition [17,18]. In particular, N deposition directly affects the soil N cycle and indirectly affects the N cycle-mediated soil microbial legacy in grasslands [18].
N deposition can impact the soil N cycle and grassland vegetation succession by increasing soil N availability, changing the proportion of soil C, N and P, and decreasing soil pH [18,19]. Some studies have emphasized that N deposition is a necessary condition for the formation of soil microbial legacies [17,20]. For instance, soil legacy effects created by long-term N deposition will impact the vegetation composition [21]. Therefore, how soil microbial legacy interacts with subsequent N deposition is a critical question to be resolved for predicting future plant responses to a changing environment [22]. Noteworthily, some evidence indirectly showed interactions between the N deposition and the soil legacy [23,24]. For example, N addition increased perennial rhizomatous grasses in a heavily grazed area but increased annuals in an ungrazed area [24]. This finding may be due to the effects of N deposition on plant–soil interactions being dependent on the previous soil environment [25,26]. However, few studies have examined the interaction between soil microbial legacy and N deposition in successional grasslands, and the mechanism of these interactions thus remains unclear.
The Songnen grassland is located in the northeastern plains of China. More than 40% of these grasslands are dominated by Leymus chinensis [27]. L. chinensis is a perennial rhizomatous grass with strong tolerance to drought, high pH, and low fertility [28]. As a pioneer species of Songnen grassland restoration succession, the growth of L. chinensis may be affected by both soil microbial legacy and atmospheric N deposition. This study examined the effects of N cycle-mediated soil microbial legacy on L. chinensis and the interaction between soil microbial legacy and N deposition on soil N cycle in a grassland vegetation successional series. We conducted a mesocosm experiment using L. chinensis and the soils of four different successional stages, and N addition was used to simulate N deposition. Some evidence has indicated that most soil legacy negatively affects subsequent plants [4,29]; likewise, NCFGs can reflect the N cycle-mediated soil microbial legacies [13,16]; moreover, soil legacy has a buffering capacity for soil environmental change [30]. Therefore we hypothesized that (1) the N cycle-mediated soil microbial legacies negatively affect L. chinensis growth by regulating NCFG abundances; (2) the soil microbial legacy overrides the effects of N addition on NCFG abundances and plant growth through the interaction between plants and NCFGs instead of soil properties. This study provides an insight into how the soil microbial legacy affects the growth of dominant species under the atmospheric N deposition.

2. Results

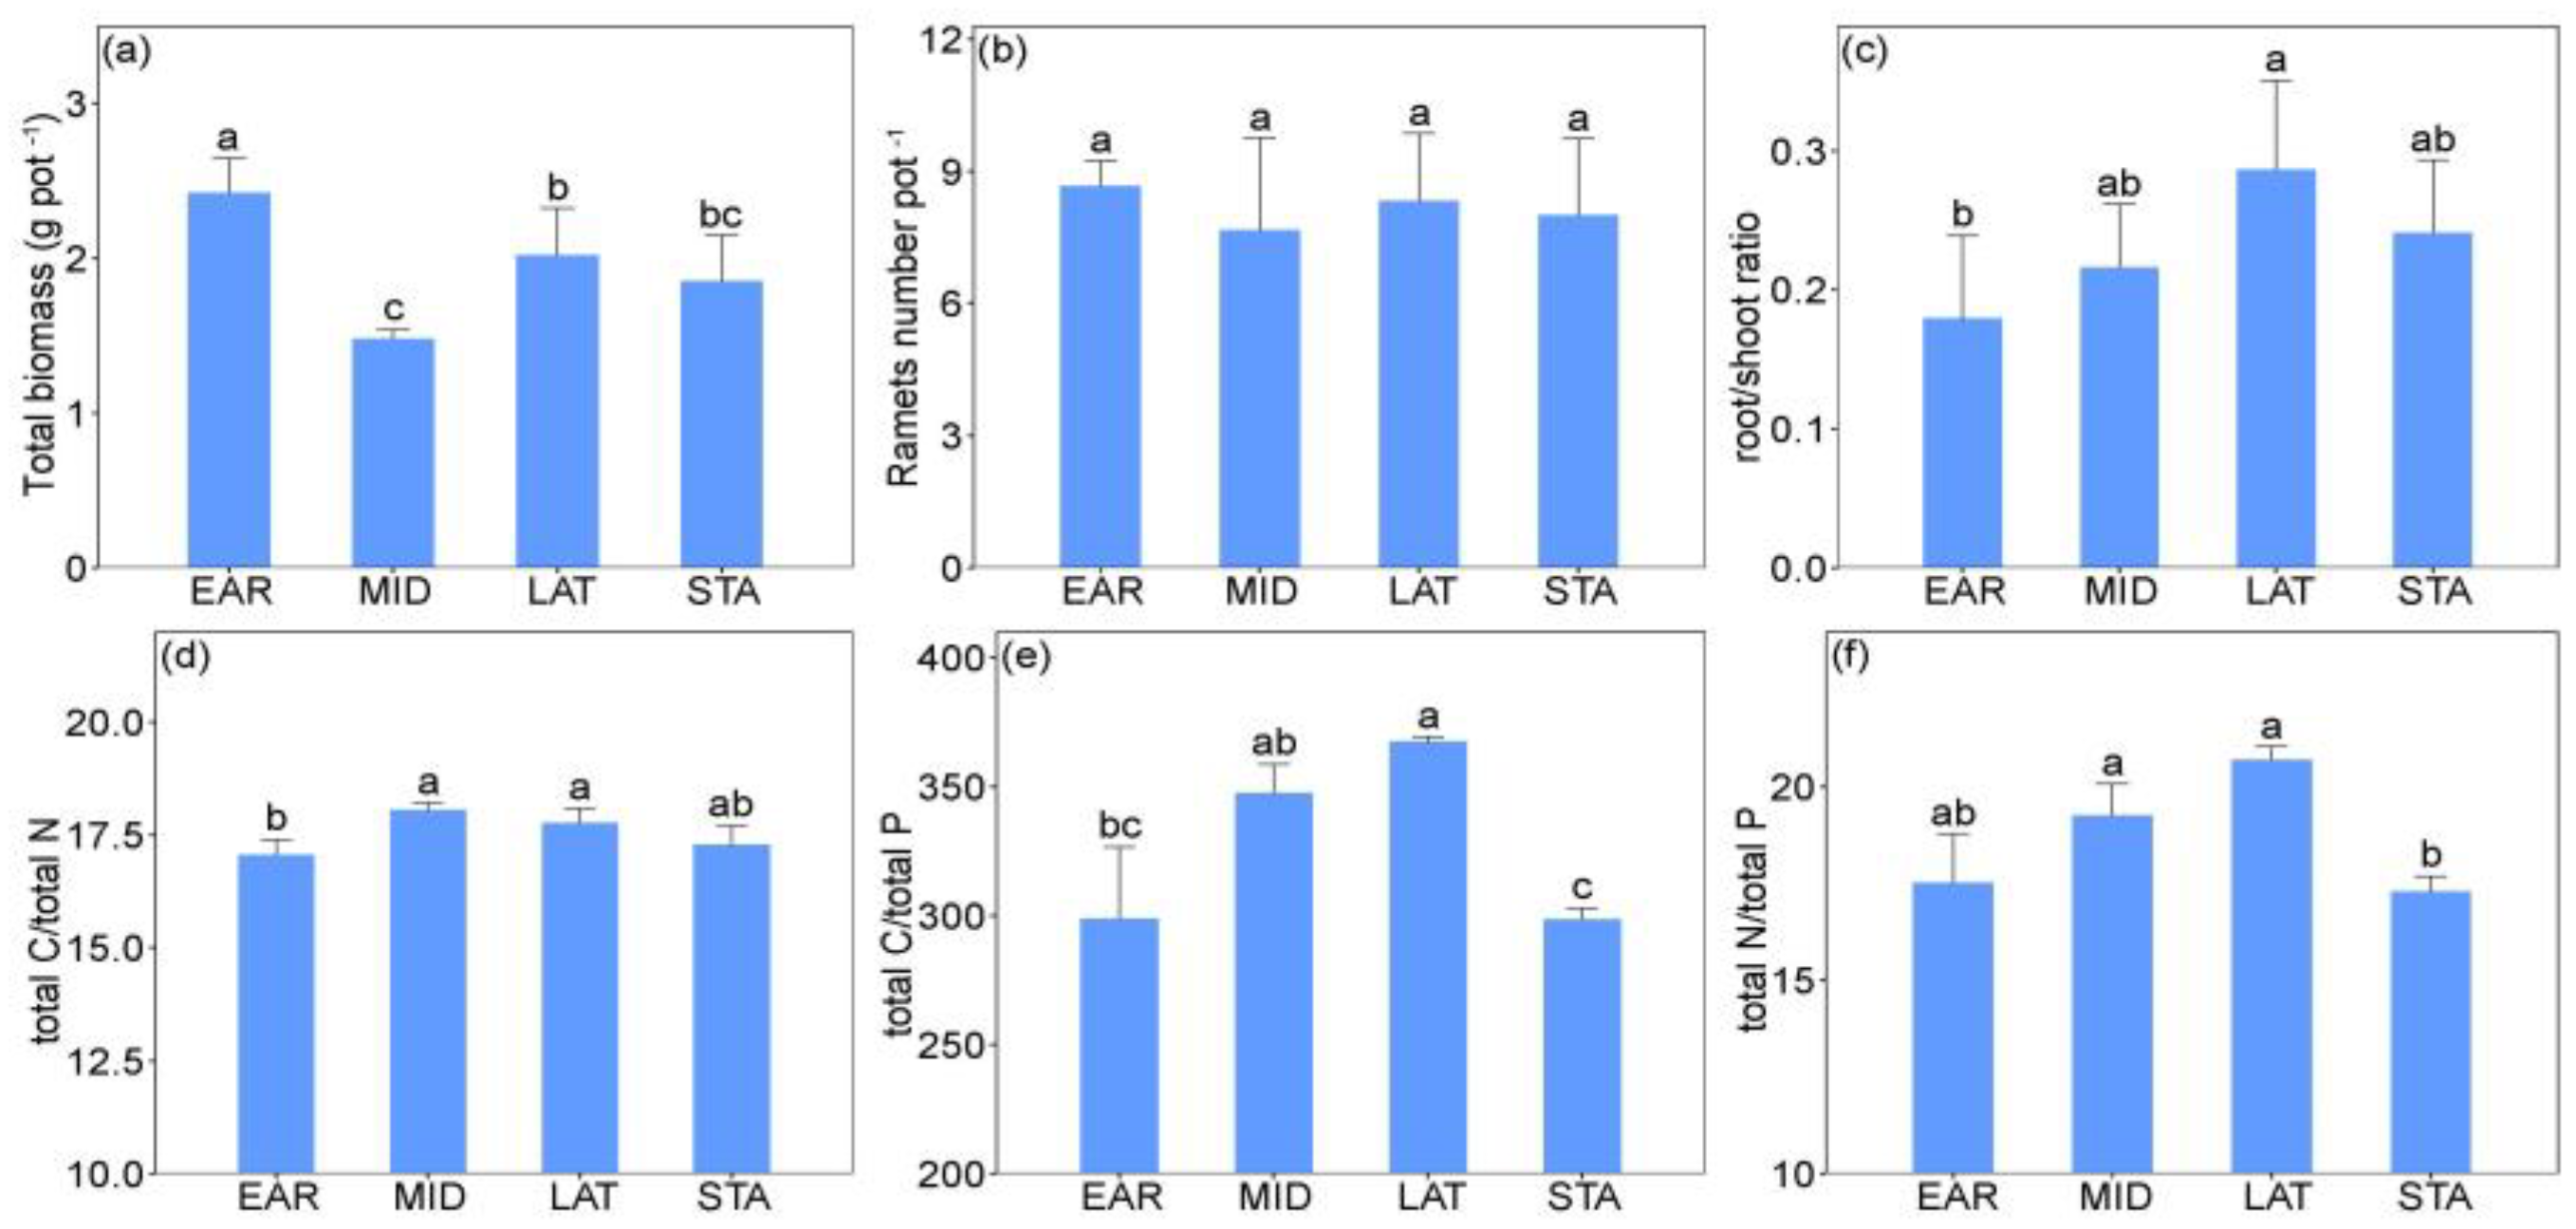
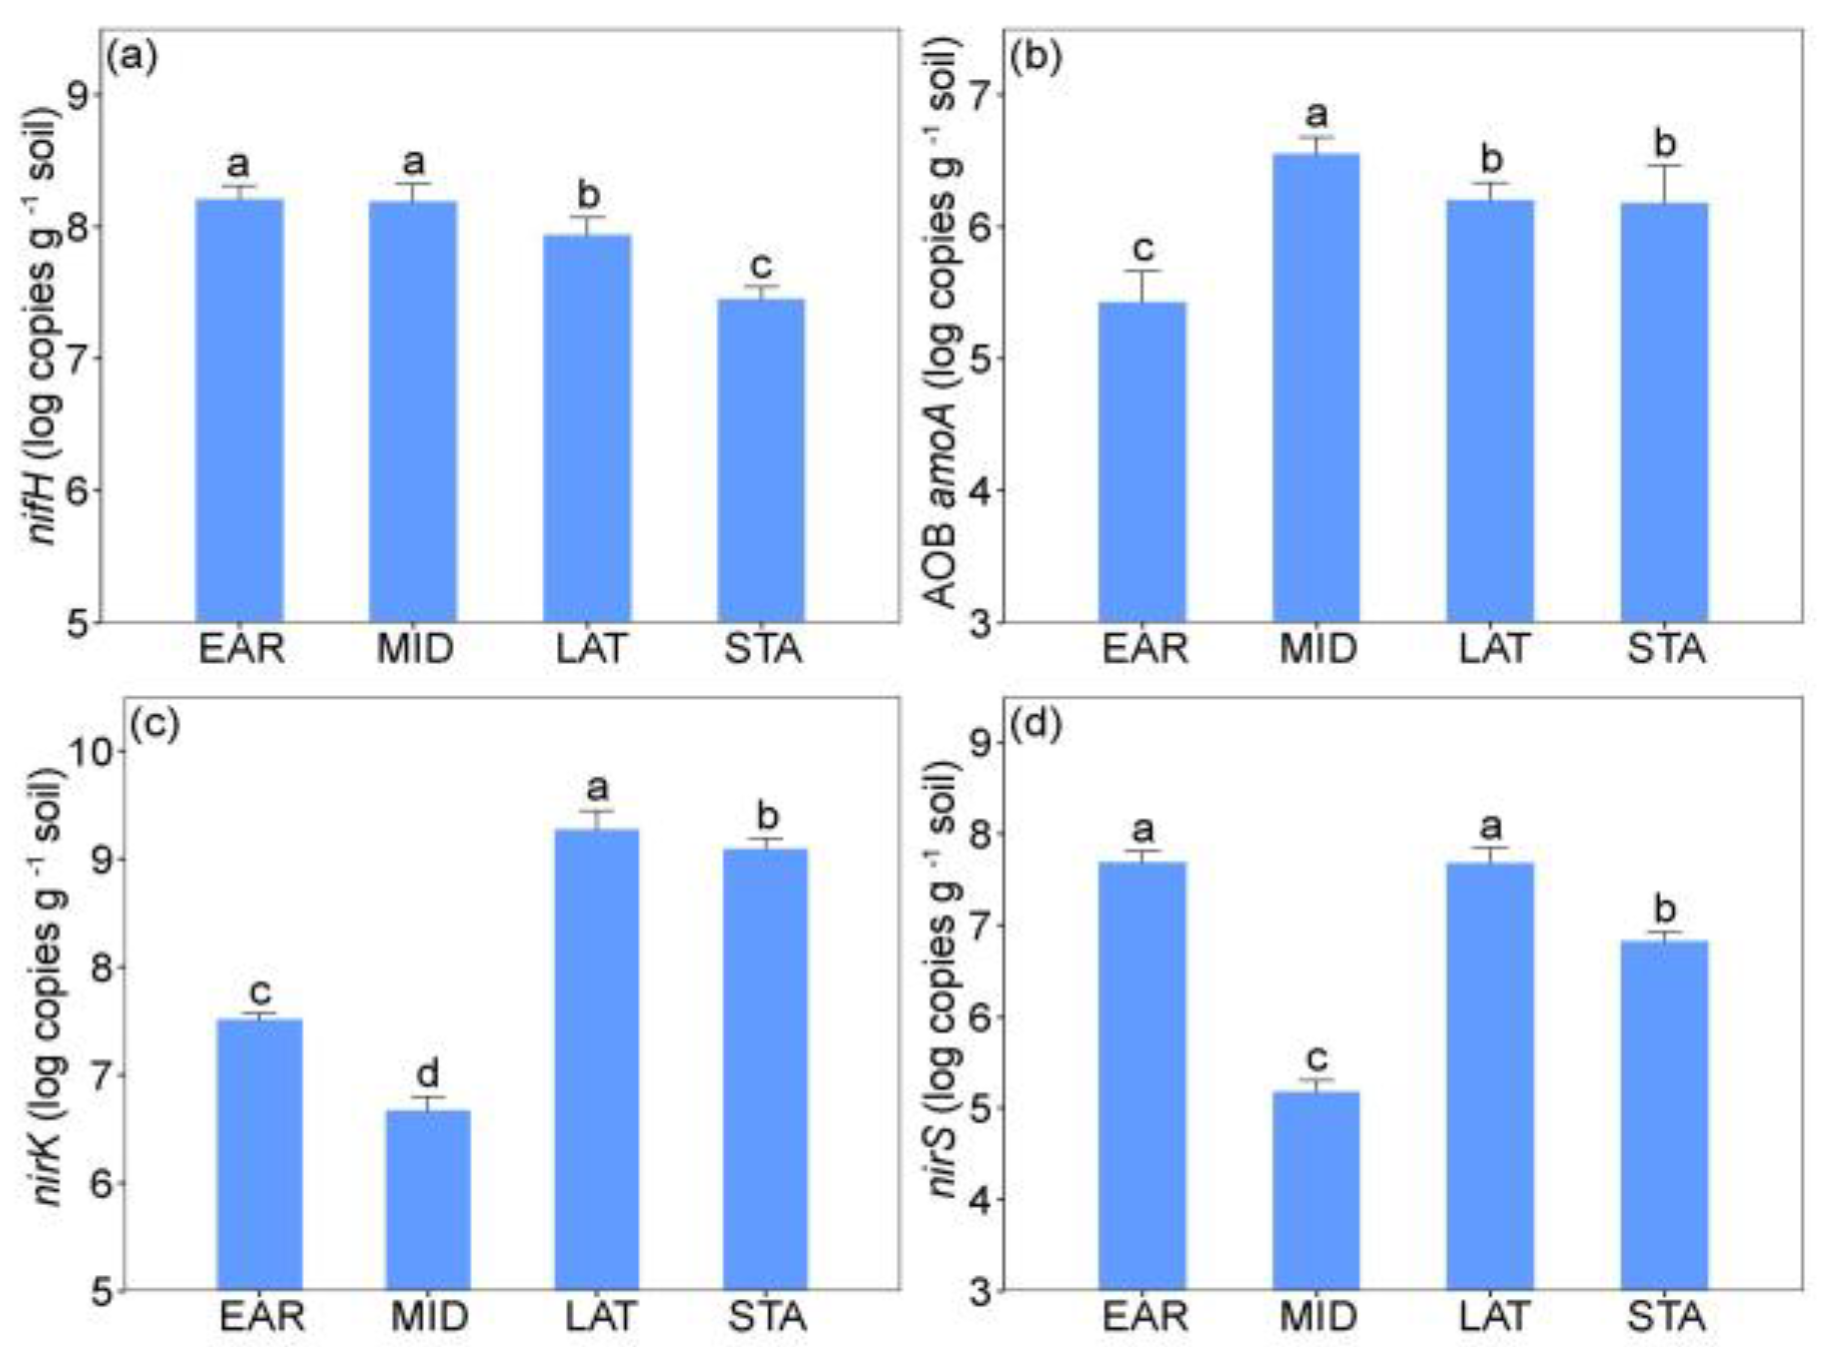
2.1. The Effects of Successional Stages and Sterilization on L. chinensis and NCFGs

The total biomass, root/shoot ratio, total C/total N, total C/total P, and total N/total P of L. chinensis were significantly different across the different successional stages (SU) (Table 1). The total biomass in the early successional stage (EAR) was significantly higher than that in the middle successional stage (MID), late successional stage (LAT) and stable successional stage (STA) (Figure 1a). The total C/total N in the MID and LAT stages was significantly higher than that in the EAR stage (Figure 1d). Finally, total C/total P and total N/total P in the MID and LAT stages were significantly higher than those in the STA stage (Figure 1e,f).
Soil sterilization (S) significantly affected the L. chinensis traits. Specifically, the interaction between SU and S significantly affected the total biomass, ramets number, total C/total N, total C/total P, and total N/total P (Table 1). In the SU × S treatment, the plant total biomass and ramets number were significantly different from those in the SU treatment (Figure 2a). The variability index (VI) values showed that the plant total biomass and ramets number in sterilized soils were 79.6% and 34.6% higher than those in non-sterilized soils (Figure 2a).
The abundances of all four NCFGs were significantly different among the four successional stages (Table 2). Compared to the LAT and STA stages, significantly higher values of nifH gene abundances were found in the EAR and MID stages (Figure 3a). The abundances of AOB amoA gene in the EAR stage were significantly lower than those in other successional stages (Figure 3b). The nirK gene abundances in the LAT and STA stages were significantly higher than those in the EAR and MID stages (Figure 3c). Likewise, the nirS gene abundances in the EAR and LAT stages were significantly higher than those in the MID and STA stages (Figure 3d).
The interaction between SU and S significantly affected the abundances of all four NCFGs (Table 2). The VI value showed that, compared with NCFG abundances in non-sterilized soils, the nifH gene abundances significantly decreased by 13.6% after soil sterilization. However, the AOB amoA, nirK, and nirS gene abundances in sterilized soils were 21.9%, 3.6%, and 13.6% higher than in non-sterilized soils, respectively (Figure 4a).

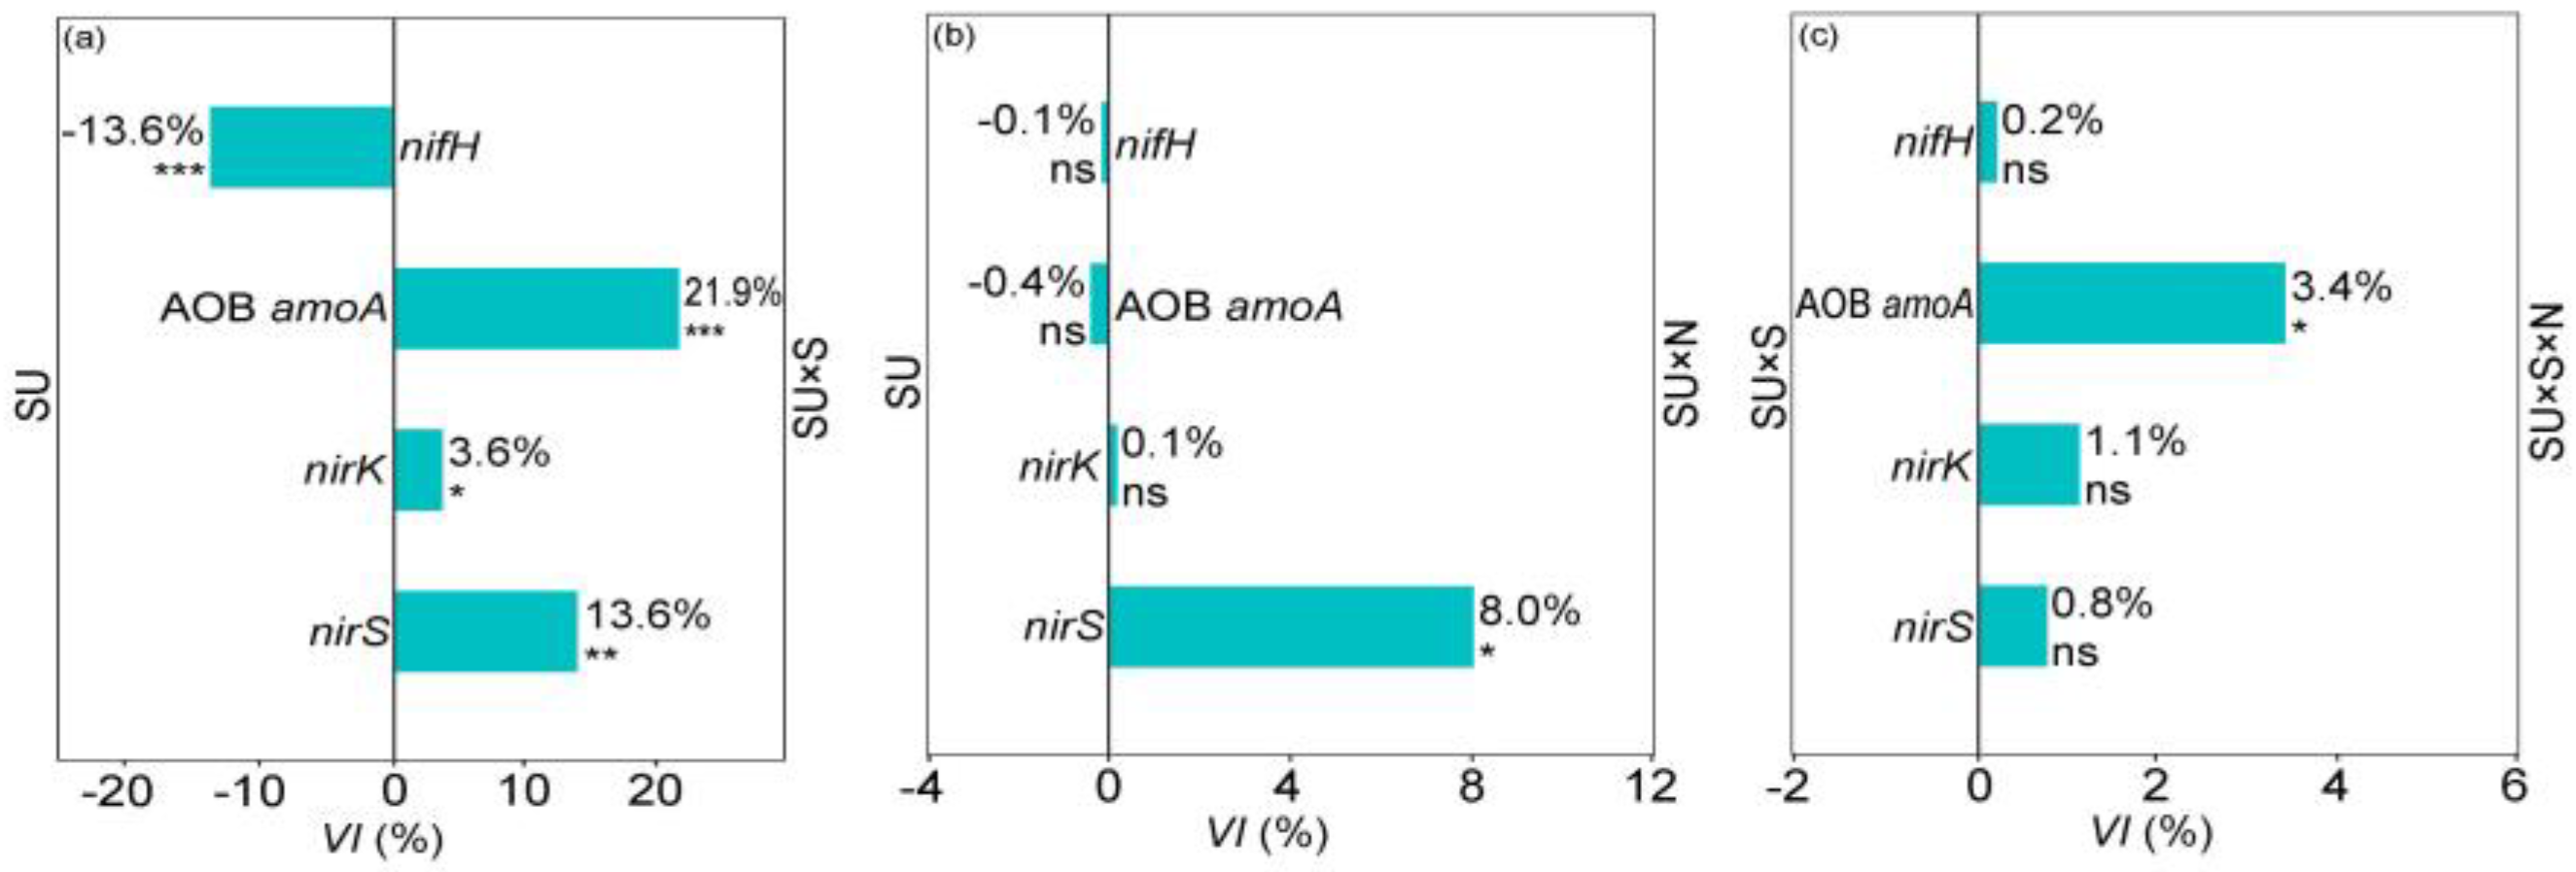
2.2. Soil Microbial Legacy Altered by N Addition

The interaction between SU and N significantly affected plant root/shoot ratio, while SU, S, and N had significant interaction effects on the plant ramets number, root/shoot ratio, total C/total P, and total N/total P (Table 1). There was no significant difference in L. chinensis traits between SU treatment and SU × N treatment (Figure 2b). However, the plant total biomass and total N/total P in the SU × S × N treatment were significantly higher than that in the SU × S treatment. In sterilized soils, N addition significantly increased plant total biomass and total N/total P by 7.2% and 5.9%, respectively (Figure 2c).
The interaction between SU and N significantly affected the nifH, AOB amoA, and nirS gene abundance. SU, S, and N had a significant interaction effect on nirK and nirS gene abundance (Table 2). The VI value showed that the nirS gene abundance in the SU × N treatment was significantly increased by 8.0% when compared those in the SU treatment (Figure 4b). Moreover, the AOB amoA gene abundance in the SU × S × N treatment was significantly higher than that in the SU × S treatment. Finally, N addition significantly increased the AOB amoA gene abundance by 3.4% in sterilized soils (Figure 4c).

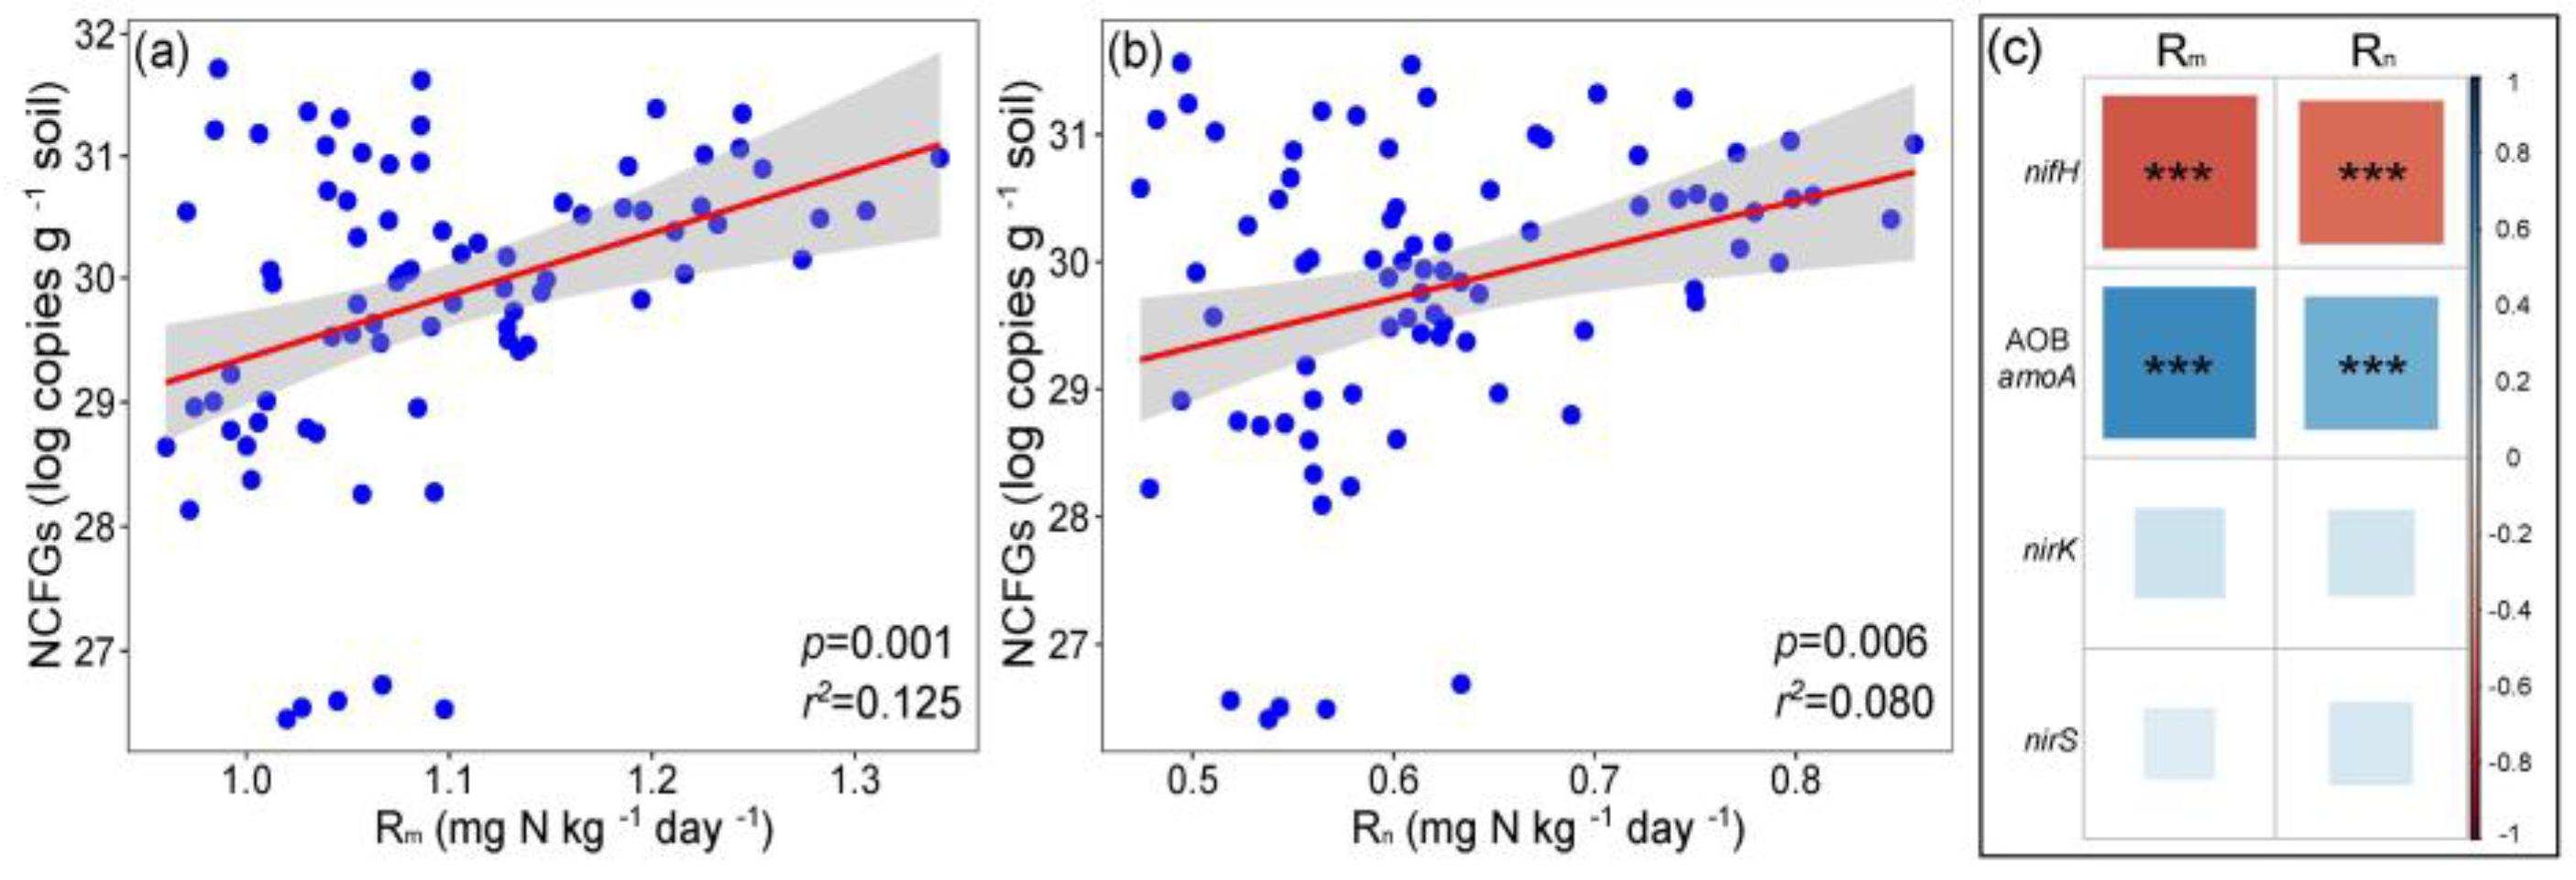
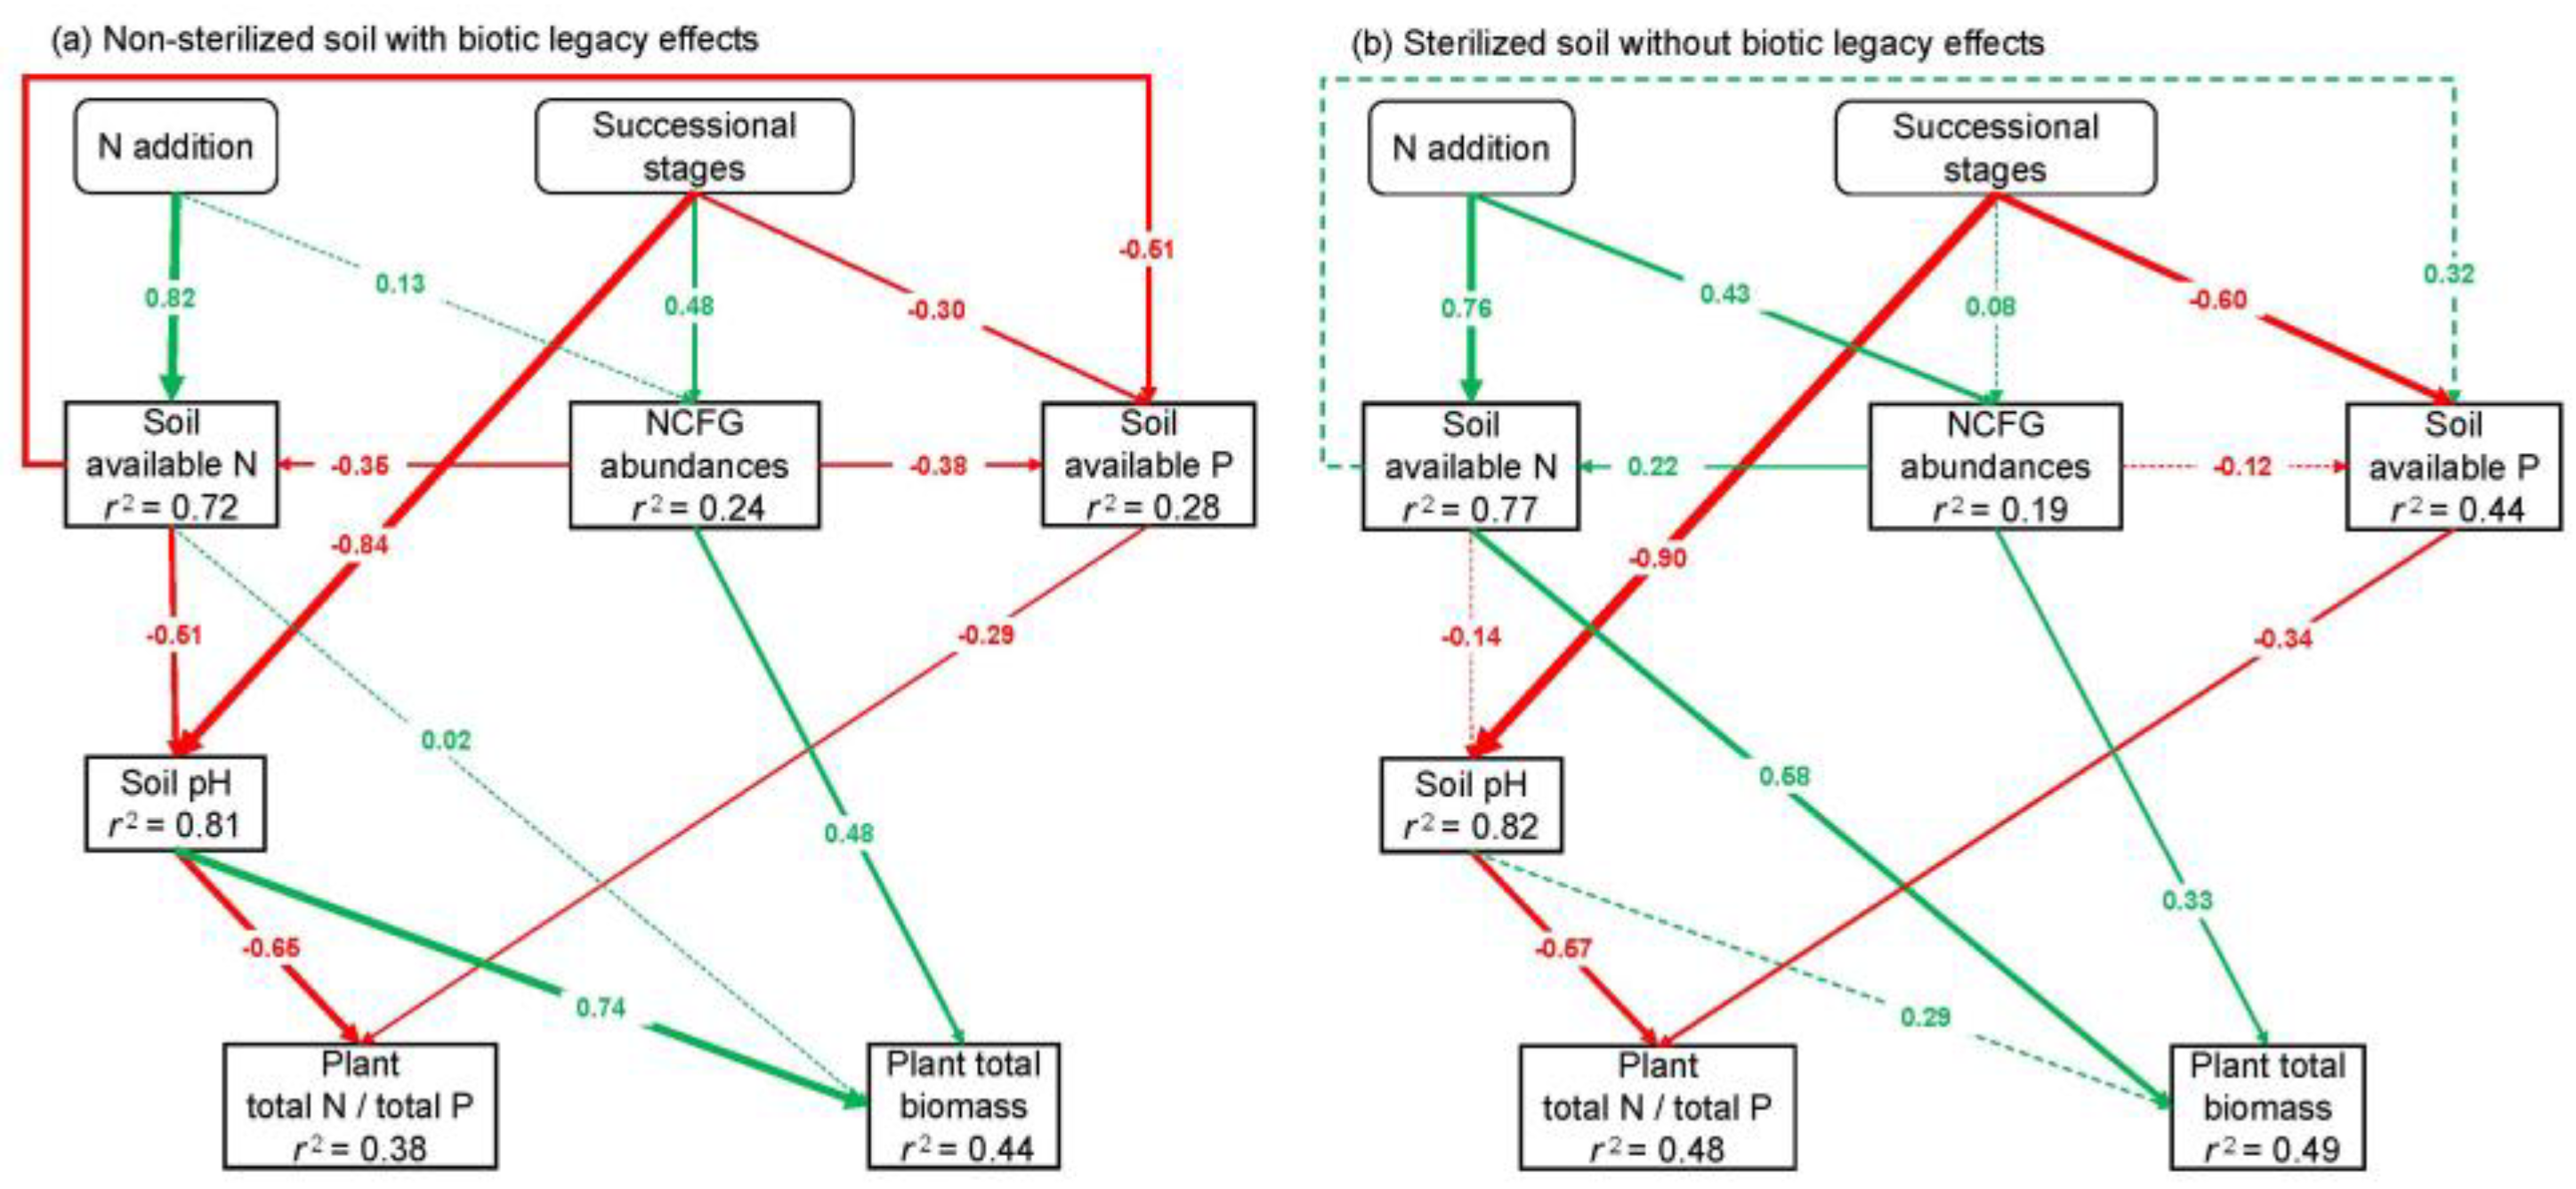
2.3. Key Factors and Pathways Influencing L. chinensis

Pearson correlation showed that the total abundances of NCFGs positively correlated with the net N nitrification rate (Rn) and the net mineralization rate (Rm) (Figure 5a,b). Furthermore, nifH gene abundance positively correlated with Rn and Rm, but AOB amoA gene abundance negatively correlated with Rn and Rm (Figure 5c). The structural equation models (SEM) showed that the successional stages (SU) and N addition were significantly correlated with plant total biomass and plant total N/total P (Figure 6). In non-sterilized soils, SU negatively affected soil available P and pH, and thus influenced plant total N/total P. Moreover, SU positively affected NCFG abundance, and the NCFG abundances positively affected the plant total biomass (Figure 6a). After soil sterilization, SU still exerted negative effects on plant total N/total P via soil available P and pH. However, in contrast to the non-sterilized soil, soil pH was not significantly correlated with plant total biomass. Additionally, the NCFG abundances retained their positive effect on plant total biomass in sterilized soils, but there was no significant correlation between SU and the NCFG abundances (Figure 6b). In non-sterilized soils, N addition positively affected soil available N. The increase in soil available N was negatively correlated with soil pH and available P, and thus indirectly influenced plant total biomass and total N/total P (Figure 6a). After soil sterilization, N addition positively affects plant total biomass through increasing soil available N. However, soil pH and available P were not correlated with soil available N in the sterilized soil. Moreover, N addition influenced plant total biomass through its positive correlation with the NCFG abundances in sterilized soils (Figure 6b).

3. Discussion

3.1. The Effects of Soil Microbial Legacy on L. chinensis and NCFGs

Soil microbial legacy is created by previous plant communities and critically influences subsequent plant growth through soil microbes [1,5]. In this study, soil microbial legacy during grassland vegetation succession inhibited the growth of L. chinensis (Figure 1a and Figure 2a). This result is consistent with a previous study, which showed that soil microbial legacy decreased plant biomass [5]. The negative effect of soil microbial legacy promotes vegetation succession in the early successional stage and thus enhances the plant species richness of the grassland [3,31]. However, the soil microbial legacy also negatively affects future individuals of the same species and is not conducive to a single plant species dominating in the late successional stage [32]. Therefore, the negative effects of soil microbial legacy on dominant L. chinensis may inhibit the formation of stable L. chinensis communities.
We found that the NCFGs are critical factors of soil microbial legacy affecting plant growth (Figure 6a), similarly to a recent study in which land-use legacy effects were significantly correlated with NCFG abundances [33]. Previous plant species and biomass may regulate the composition of soil microbial communities [3], and the soil microbial legacy caused by them will further impact the interaction between NCFGs and subsequent plants [16,34]. In detail, after the soil microbial legacy was eliminated, the ammonia-oxidizing bacterial gene (AOB amoA) and denitrifying microbe gene (nirS and nirK) increased significantly (Figure 4a). This result implies that soil microbial legacy can limit the processes of soil ammonia oxidation and denitrification [35]. Moreover, some studies have demonstrated that the expression of AOB amoA, nirK, and nirS are correlated with the rates of soil N cycle and positively impact the microbe-mediated N absorption of the plant [16,36,37]. As a result, the low expression of AOB amoA, nirK, and nirS genes may be a reason why soil microbial legacy inhibited the growth of dominant L. chinensis.

3.2. Soil Microbial Legacy Overrides N Addition Effects on L. chinensis and NCFGs

We found that the L. chinensis traits and NCFG abundances (except the nirS gene) did not significantly respond to N additions in non-sterilized soils (Figure 2b and Figure 4b). Our result indicates that soil microbial legacy from different successional stages has a buffering capacity for N deposition. Some evidence demonstrated that low concentrations of N addition enhanced plant growth and NCFG abundances [38,39]. However, our finding was different from these studies. The reason may be that the effects of soil environmental changes on soil microbial communities and soil N cycle were overwhelmed by the soil microbial legacy [40]. Consequently, plant growth and NCFGs showed a lag response to soil environmental changes in non-sterilized soils [30]. Furthermore, our results showed that N deposition promotes the biomass of L. chinensis and AOB amoA gene abundance in sterilized soils (Figure 3c and Figure 4c). This result is similar to a finding in temperate grasslands [41]. Thus, plant growth benefits from nitrification to obtain soil N [35]. However, in the present study, AOB amoA had no response to N addition in non-sterilized soils (Figure 4b). Hence, we speculated that soil microbial legacy could maintain the stability of ammonia-oxidizing bacterial communities [35,42]. In addition, soil sterilization breaks the composition of soil microbial communities and eliminates the effects of soil microbial legacy [43]. Therefore, N addition directly affected plant growth and NCFGs (especially AOB amoA genes) in sterilized soils. Overall, we conclude that the soil microbial legacy overrides the effects of N addition on the performance of L. chinensis and the abundances of NCFGs by comparing the results of N addition in non-sterilized versus sterilized soils.
Furthermore, our findings showed that soil microbial legacy did not alleviate the effects of N addition on nirS gene abundance (Figure 4b). In detail, nirS gene abundance positively correlates with the process of soil denitrification, especially in grassland soil [37,44]. Some studies indicated that soil denitrification did not respond to previous plant species richness but did respond positively to changes in the soil abiotic factors (especially soil N) [45,46]. Therefore, although the soil N cycle is regulated by soil microbial legacy, N addition can still affect the denitrification process by increasing soil N nutrition and thus influencing the nirS gene abundance in non-sterilized soil.

3.3. Key Factors Affecting L. chinensis and NCFGs

Our results showed a significant correlation between NCFGs and the process of soil N mineralization (Figure 5). This finding is similar to a study in which the expression of NCFGs can reflect changes in the microbe-mediated soil N cycle [47]. However, we found that the abundance of the nifH gene is negatively associated with soil N mineralization. The reason may be that nifH gene abundance determines the nitrogen-fixing process of microorganisms, but the nifH gene is not involved in the microbial nitrification process [48]. As such, there is no evidence that the N mineralization rates will influence the capability of microbial N fixation. Additionally, some reports have shown that the N nutrition of plant acquisition depends on abiotic and microbial pathways [49,50]. The abiotic pathway represents the direct N absorption of plants in the soil and depends on the contents of soil N availability [51]. The microbial pathway reflected that plants indirectly acquire nutrients through N-cycling functional microbes, involving plants exporting C to soil microorganisms in exchange for N [25]. Likewise, the microbial pathway of plant N nutrient absorption can change soil N mineralization rates through plant-microbe interactions and therefore influence the expression of NCFGs [16,36]. Hence, the NCFG gene abundances and the relationships between NCFGs and plant performance provide indicators for assessing the microbial pathway of plant N nutrient acquisition.
The SEM results demonstrated that soil pH, available N, and available P were the main abiotic factors affecting plant performance (Figure 6). These results are consistent with some studies showing that soil nutrient availability and pH significantly affected plant performance [52,53,54]. Furthermore, the increasing soil available N caused by N addition indirectly affects plant performance through available P and pH. The reason may be that N addition caused soil acidification and aggravated P limitation and thus impacted plant growth [44,55]. Moreover, previous studies have shown that soil sterilization is the most effective way to eliminate the soil microbial legacy, but sterilization also releases soil N availability [3,43]. Sterilization may reduce the effects of N addition on plant growth because high N concentrations in soil environments make plant performance less susceptible to nitrogen augmentation [56]. However, our results showed that N addition directly affected plant growth through soil available N but only in sterilized soil. Therefore, sterilization did not interfere with our assessment of the relationship between the soil microbial legacy and N addition. Consequently, we propose that soil microbial legacy can alleviate the direct effect of N addition on plant performance, even if the non-sterilized soils contain low N availability.
Our results showed that soil microbial legacy across different successional stages affects the growth of L. chinensis via NCFGs, and N addition had no direct effect on NCFG abundances in non-sterilized soils (Figure 6). Our findings support the view that soil microbial communities critically mediate soil microbial legacy [8,57,58]. Generally, this soil microbial legacy is created by the microbe-mediated N absorption of previous plants, especially in grasslands where soil N is limiting [59,60]. In detail, previous plants influence plant-microbial interactions to absorb more N nutrients, maintaining the stabilization of previous microbial communities (especially soil N-cycling functional microbes) in a changing soil environment [33,61], thus forming the soil microbial legacy [62,63]. Finally, the soil microbial legacy potentially impacts dominant plant performance through N-cycling functional microbes [13,15] and buffers the effects of N addition on NCFGs.
In this study, we conducted a greenhouse experiment in one growing season to test the soil microbial legacy, and the effectiveness of this method has been confirmed in previous studies [8,64]. Additionally, a previous study showed the advantage of pot experiments for examining individual plant species in response to soil legacies [43]. Accordingly, it is reasonable to explore the effects of soil microbial legacy on unique plant species through pot experiments. Moreover, our study did not include the effects of allelopathy and interspecific competition in plants. Admittedly, plant roots can secrete allelochemicals (e.g., phenolic acids and flavonoids) into the soil [65]. If these metabolites reach sufficient concentration and retention time in the soil, they will affect the growth of subsequent plants [15,65]. In addition, allelochemicals exuded by plants can directly impact the composition of microbial communities, thus creating soil legacies and influencing subsequent plants [13,15]. Likewise, in the field area, the effects of soil microbial legacy on plant growth may be more complex due to interspecific competition. Therefore, further studies still need to be considered for the results of allelopathy and interspecific competition on soil legacy.

4. Materials and Methods

4.1. Sampling Area Description

The study was conducted at the Tongyu Semi-Arid Climate-Environment Field Station (122°52′ E, 44°25′ N), which is part of the Chinese Academy of Sciences, located in the Songnen Plain, northeastern China. The Tongyu station covers an area of 477,000 m2 and has been fenced since the autumn of 2006 to prevent grazing. The zonal vegetation type is described as meadow steppe, and the dominant plant species is L. chinensis. The mean annual precipitation in the region is 404 mm, with 80% occurring from May to September, which coincides with the growing season. The mean annual temperature is 5.7 °C, with the lowest of −32 °C in December and the highest of 38.9 °C in June. The topography is flat, and there is strong soil heterogeneity that includes sandy soils, slight chernozem soils, salty alkaline soils, and meadow soils [29].
Before fencing was established at Tongyu station, this area had different grazing intensities (i.e., heavy grazing centered around the water sources). As a result, grasslands in this area vary in terms of their degradation status [27]. Likewise, recovery was heterogeneous and depended on soil type and the vegetation degradation status [31]. Thus, this recovery formed a “successional series” that contains multiple successional stages [66]. We selected four different successional stages in this “successional series”, including the early successional stage (EAR), the middle successional stage (MID), the late successional stage (LAT), and the stable community stage (STA), at Tongyu station. Different successional stages were identified by the indicators for grassland degradation [67,68] and the guidelines for rangeland degradation assessment [69]. The presence of these successional stages was confirmed by our field investigation in August 2019. The plant communities corresponding to the four successional stages were named the Chloris virgate + Kochia sieversiana community, L. chinensis + forbs community, L. chinensis + Lespedeza daurica, and L. chinensis community (Table 3) [70]. The EAR of C. virgate + K. sieversiana community had low plant diversity and mainly consisted of saline-alkali tolerant plants. In the MID community, the plant species were obviously more abundant, and L. chinensis had invaded and became the dominant species. However, the biomass of forbs was greater than the biomass of L. chinensis in the MID community. In the LAT community, the dominant species switched to L. chinensis and L. daurica, and the total biomass of L. chinensis was significantly enhanced compared with that in the EAR and MID. The STA community had a few plant species, and the dominant species switched to L. chinensis. With grassland restoration, the soil pH gradually decreased and the soil total C, total N, and total P gradually increased (Table 4).

4.2. Experimental Soil Preparation and Vegetation Survey

We selected the four successional stages (EAR, MID, LAT and STA) at Tongyu station. Four identical plant communities spaced at least 200 m apart were selected as the four blocks for each successional stage. Within the 50 m × 50 m region of each block, we randomly selected four 1 m × 1 m sampling sites. After removing the litter on the soil surface, 0.5 kg of soil was collected from 0–0.2 m depth at each sampling site using a soil auger (0.04 m diameter). Finally, 2 kg of soil was randomly collected from the four sampling sites and mixed together as a soil sample for each block. Consequently, we obtained 8 kg of soil from each successional stage. Because the upper 0–0.2 m of the soil encompasses most of the above plant community’s roots, the collected soils were sufficiently conditioned by the plant community [58]. These soils were then transported to the laboratory and sieved (2 mm) to eliminate soil invertebrates, and half of the sample was separated and sterilized with an autoclave (121 °C, 0.5 MPa, 60 min). Sterilized and unsterilized soils were used for the cultivation of L. chinensis.
On 15 August 2019, a field vegetation survey was conducted at each successional stage. One 1 m × 1 m plot was established near the above sampling sites. Therefore, there were four repeated vegetation survey plots at each successional stage. All plants in each plot were harvested, and then the average density, average height, aboveground biomass, and coverage of each plant species were measured. Aboveground biomass was measured by clipping all plants, drying at 60 °C for 48 h, and weighing the dried samples. Following the vegetation surveys, soil samples were collected using a soil auger (0.04 m diameter) from the upper 0–0.2 m of soil at three randomly selected points in each plot and combined to form a composite sample for analyzing soil properties.

4.3. Mesocosm Experimental Design and Execution

We used a randomized block design with three factors, including successional stage (i.e., EAR, MID, LAT, and STA), N addition (i.e., N not added and N added), and soil sterilization (i.e., sterilized soil and non-sterilized soil). We planted L. chinensis in soils collected from the four different successional stages. The N fertilizer that we used was NH4NO3, which had an N content of 35%. Then, 0.144 g of NH4NO3 was added to each pot. We sterilized the soils to eliminate soil microbial legacy effects. In addition, we used an N addition treatment to explore how N addition affects soil microbial legacy effects. Overall, we had a total of 16 (4 × 2 × 2) treatment combinations and five replicates for each treatment (Figure S1).
On 15 August 2018, L. chinensis seeds were collected from the L. chinensis grassland community at Tongyu station. On 1 April 2019, the L. chinensis seeds were surface-sterilized for 1 min using 1% sodium hypochlorite, rinsed, and sown in the nursery with sterilized soil, and seedlings were grown in the greenhouse at Jilin Songnen Grassland Ecosystem National Observation and Research Station, China (44°45′ N, 123°45′ E) (i.e., our greenhouse and laboratory mainly located here). On 1 May 2019, the four-week-old seedlings were transplanted into pots (polyethylene material, 0.12 m diameter, and 0.14 m height). Before the seedlings were transplanted, each pot was filled with 1.5 kg of natural or sterilized soil collected from the different successional stages in the grassland ecosystem. Three L. chinensis seedlings were planted in each pot. N additions totaling 10 g·N·m−2·year−1 were then divided into three equal parts, dissolved in 100 mL of water, and added to the pots at the beginning of May, June, or July. Similarly, 100 mL of water was added to each control pot. All the pots were randomly placed in a greenhouse (28 °C ± 3 °C daytime temperature, 19 °C ± 3 °C at nighttime temperature, relative humidity of 45% ± 5%, and maximum light intensity of 1900 μmol·m2·s1) and were turned once every two weeks. Distilled water was added to each pot once a week to ensure plant growth.

4.4. Sampling and Measurements of the Plants and Soil

After 12 weeks, plant and soil samples were collected on 1 August 2019. All L. chinensis was carefully removed from each pot, and the ramets number of each L. chinensis was recorded. The above- and belowground parts were separated and dried at 105 °C for 15 min and then at 65 °C for 48 h to measure the biomass. The total biomass and the root/shoot ratio of L. chinensis were then calculated using all L. chinensis in each pot. We ground the aboveground samples to produce particles size less than 1 mm. Next, total C was measured using a total organic carbon analyzer (Vario TOC, Elementar, Langenselbold, Germany), total N was determined using a Kjeldahl apparatus (Kjeltec 8400, FOSS, Hilleroed, Denmark), and total P was measured using an automatic discontinuous chemical analyzer (Smartchem 450, AMS, Guidonia, Italy). We also calculated total C/total N, total C/total P, and total N/total P using these data. There were five replicates for all plant traits.
Rhizosphere soils were collected using the “shaken off” method and sieved to 2 mm [71]. Then, soils from the same pot were mixed together to ensure the homogeneity of the soil sample in each pot. Afterward, each soil sample was divided into two equal parts. One part of the rhizosphere soil was air-dried to test the soil properties (i.e., pH, moisture, and the C, N and P contents). Soil pH was measured using a water suspension (water/soil = 5/1) and a pH meter (pH S-3C, INESA, Shanghai, China). Soil moisture was measured by drying the samples at 105 °C until a constant weight was reached. The methods used to measure the soil total C, soil total N, and soil total P were the same as those used for the plant samples. Soil available N was measured using a flow analyzer (Futura, AMS, Villeneuve-la-Garenne, France). Soil available P was determined using a spectrophotometer (UV5-500, METASH, Shanghai, China).
The second part of the rhizosphere soil sample was stored at −80 °C for the analysis of NCFG abundances and N mineralization rate. These NCFG genes included nitrogen-fixing bacterial genes (nifH), bacterial ammonia-oxidizing genes (AOB amoA), and bacterial denitrifying genes (nirS and nirK). Soil DNA was extracted using a PowerSoil® Kit (DNeasy® Powerlyzer®, Inc., Germantown, Tennessee, USA), and following the manufacturer’s protocol. DNA concentrations were measured using a NanoDrop 2000 to confirm the concentration of DNA. Samples were diluted to 20 ng DNA μL−1 using ultrapure water for quantitative real-time PCR (qPCR) measurements. Amplification of the qPCR products for NCFGs was assessed using a StepOneTM Real-Time PCR System (Applied Biosystems, CA, Foster City, CA, USA). With the 10 μL Fast qPCR Master Mix (High Rox) (BBI, Beijing, China), 0.4 uL (200 nm) primers, and 20 ng template DNA were added, and the reaction mixture was made up to a final volume of 20 μL. The details of the qPCR reactions of the nifH, AOB amoA, nirS, and nirK genes are shown in Table S1.
The net N nitrification rate (Rn) and net mineralization rate (Rm) were estimated by aerobic incubation [72]. 10 g soil was placed in a glass flask, and then a perforated parafilm was covered on the top. The soil was incubated in the dark at 25 °C. After 20 days, the NH4+-N and NO3-N concentrations of the incubated and non-incubated soils were measured using a flow analyzer (Futura, AMS, Villeneuve-la-Garenne, France). The Rn and Rm were derived from the following formulas:
Rn = Incubated   ( NO 3 ) Nonincubated   ( NO 3 ) 20 Rm = Incubated   ( NH 4 + NO 3 ) Nonincubated   ( NH 4 + NO 3 ) 20
In these equations, incubated (NO3) and incubated (NH4 + NO3) represent the NO3-N and the sum concentrations of NH4+-N and NO3-N in the incubated soil, respectively. Nonincubated (NO3) and nonincubated (NH4 + NO3) represent the NO3-N and the sum concentrations of NH4+-N and NO3-N before the soil incubation, respectively. The number 20 represents the number of incubation days. The measurements of each soil properties, NCFGs, Rn, and Rm had five replicates.

4.5. Statistical Analyses

Three-way ANOVA was used to test for the effects of different successional stages (SU), sterilization (S), and N addition (N) on plant traits, NCFG abundances, and soil properties. The soil microbial legacy effects were assessed by comparing SU and SU × S (i.e., soil sterilization to eliminate soil microbial legacy effects). The impact of N addition on the soil microbial legacy effects was assessed by comparing SU and SU × N. The N addition effect (without soil microbial legacy effects) on plant traits and NCFG abundances was determined by comparing SU × S and SU × S × N.
To quantify soil microbial legacy effects, N addition, and its effects on interactions with plant traits and NCFG abundances (i.e., SU compared with SU × S, SU compared with SU × N, and SU × S compared with SU × S × N), we used the following formula to calculate the variability index (VI) of plant traits and NCFG abundances:
V I = 100 % × E B E A E A
In the above equation, EA represents the mean pretreatment value for both sterilization and N addition, and EB represents the average posttreatment value. In other words, VI > 0 or VI < 0 represents the percent increase or decrease, respectively, after the treatment.
To testify the relationships between NCFG abundances and soil N mineralization rate, we conducted the correlation (Pearson) analyses with the NCFG abundances against soil Rn and Rm. The NCFGs include the abundances of nifH, AOB amoA, nirS, and nirK genes, and the total abundances of all four genes.
We used the structural equation model (SEM) to determine the key factors that significantly influenced plant growth and to analyze the interaction between soil microbial legacy effects and N addition. We treated successional stage (SU) and N addition as exogenous variables. Endogenous variables included all measured L. chinensis traits, the total abundance of NCFGs (including the abundances of the nifH, AOB amoA, nirS, and nirK genes), and all measured soil properties. We then selected the most important predictors according to the Akaike information criterion (AIC) [73]. The following were used to evaluate the fit of our models: the goodness of fit of the SEM was evaluated using a chi-square test (0 < chi-sq < 2, p > 0.05) and a root mean squared error of approximation (rmsea < 0.05). The standardized root mean square residual (srmr < 0.05) and comparative fit index (0.97 < cfi < 1) were used for the best-fitting SEM for each factor [74]. Significant differences in all statistical analyses were assessed using a t test at an alpha level of 0.05. All statistical analyses were conducted using R 4.0.2 [75].

5. Conclusions

The interaction between soil microbial legacy and N addition provides new insight into the mechanism that explains how the soil microbial legacy affects dominant L. chinensis under atmospheric N deposition. Our study demonstrates that soil microbial legacy negatively affected dominant L. chinensis. The negative effect of different successional stages for dominant L. chinensis may delay the grassland restoration into stable communities. Moreover, soil microbial legacy buffered the effects of N addition on NCFGs and plant performance, therefore promoting the asynchrony responses of soil abiotic factors, N-cycling functional microbes, and dominant plant growth to atmospheric N deposition. The buffering capacity of the soil microbial legacy explained the view that the dominant grass across the grassland successions does not respond to atmospheric N deposition in the short term. Consequently, we propose that soil microbial legacy decreased the effects of atmospheric N deposition on dominant grass.

Supplementary Materials

The following supporting information can be downloaded at: https://www.mdpi.com/article/10.3390/plants11101305/s1, Figure S1: The experimental framework of L. chinensis growth and soil N-cycling functional microbes in response to soil legacy and N addition across different successional stages; Table S1: Primers and reaction details of qPCR. References [76,77,78,79] are cited in the supplementary materials.

Author Contributions

Conceptualization, formal analysis, methodology, writing-review, F.X.; conceptualization, formal analysis, investigation, writing-original draft, methodology, visualization, M.Z.; methodology, validation, resources, supervision, X.L. (Xueli Li); methodology, validation, supervision, Z.L.; validation, X.L. (Xiaowei Liu); resources, Y.L. All authors have read and agreed to the published version of the manuscript.

Funding

This study was supported by the National Natural Science Foundation of China (31670524) and the Program for Introducing Talents to Universities (B16011).

Institutional Review Board Statement

Not applicable.

Informed Consent Statement

Not applicable.

Data Availability Statement

The data that supports the findings of this study are contained within the article and available from the corresponding author upon reasonable request.

Acknowledgments

We gratefully appreciate the CAS Tongyu Semi-arid Climate-Environment Field Station′s help for the confirmation of the field sampling area. We would like to thank Murphy Stephen at Yale University for his assistance with English language and grammatical editing of the manuscript.

Conflicts of Interest

The authors have no conflict of interests to declare.

References

  1. Van de Voorde, T.F.; Van der Putten, W.H.; Martijn, B.T. Intra-and interspecific plant-soil interactions, soil legacies and priority effects during old-field succession. J. Ecol. 2011, 99, 945–953. [Google Scholar] [CrossRef]
  2. Segnitz, R.M.; Russo, S.E.; Davies, S.J.; Peay, K.G. Ectomycorrhizal fungi drive positive phylogenetic plant-soil feedbacks in a regionally dominant tropical plant family. Ecology 2020, 101, e03083. [Google Scholar] [CrossRef] [PubMed]
  3. Ristok, C.; Poeschl, Y.; Dudenhöffer, J.H.; Ebeling, A.; Eisenhauer, N.; Vergara, F.; Wagg, C.; van Dam, N.M.; Weinhold, A. Plant species richness elicits changes in the metabolome of grassland species via soil biotic legacy. J. Ecol. 2019, 107, 2240–2254. [Google Scholar] [CrossRef] [Green Version]
  4. Kulmatiski, A.; Beard, K.H.; Stevens, J.R.; Cobbold, S.M. Plant-soil feedbacks: A meta-analytical review. Ecology 2008, 11, 980–992. [Google Scholar] [CrossRef] [PubMed]
  5. Kardol, P.; Cornips, N.J.; Kempen, M.M.L.; Bakx-Schotman, J.M.T.; Van der Putten, W.H. Microbe-mediated plant-soil feedback causes historical contingency effects in plant community assembly. Ecol. Monogr. 2007, 77, 147–162. [Google Scholar] [CrossRef] [Green Version]
  6. Reynolds, H.L.; Packer, A.; Bever, J.D.; Clay, K. Grassroots ecology: Plant-microbe-soil interactions as drivers of plant community structure and dynamics. Ecology 2003, 84, 2281–2291. [Google Scholar] [CrossRef] [Green Version]
  7. Baxendale, C.; Orwin, K.H.; Pommier, P.T.; Bardgett, R.D. Are plant-soil feedback responses explained by plant traits? New Phytol. 2014, 204, 408–423. [Google Scholar] [CrossRef]
  8. Kaisermann, A.; de Vries, F.T.; Griffiths, R.I.; Bardgett, R.D. Legacy effects of drought on plant-soil feedbacks and plant-plant interactions. New Phytol. 2017, 215, 1413–1424. [Google Scholar] [CrossRef] [Green Version]
  9. Liu, Y.; He, N.P.; Zhu, J.X.; Xu, L.; Yu, G.R.; Niu, S.L.; Sun, X.M.; Wen, X.F. Regional variation in the temperature sensitivity of soil organic matter decomposition in china’s forests and grasslands. Glob. Change Biol. 2017, 23, 3393–3402. [Google Scholar] [CrossRef]
  10. Jing, J.Y.; Bezemer, T.M.; Van der Putten, W.H. Complementarity and selection effects in early and mid-successional plant communities are differentially affected by plant-soil feedback. J. Ecol. 2015, 103, 641–647. [Google Scholar] [CrossRef]
  11. Kardol, P.; Bezemer, T.M.; Van der Putten, W.H. Temporal variation in plant-soil feedback controls succession. Ecol. Lett. 2006, 9, 1080–1088. [Google Scholar] [CrossRef] [PubMed]
  12. Klironomos, J.N. Feedback with soil biota contributes to plant rarity and invasiveness in communities. Nature 2002, 417, 67–70. [Google Scholar] [CrossRef] [PubMed]
  13. Hawkes, C.V.; Wren, I.F.; Herman, D.J.; Firestone, M.K. Plant invasion alters nitrogen cycling by modifying the soil nitrifying community. Ecol. Lett. 2005, 8, 976–985. [Google Scholar] [CrossRef] [PubMed]
  14. Tharayil, N.; Alpert, P.; Bhowmik, P.; Gerard, P. Phenolic inputs by invasive species could impart seasonal variations in nitrogen pools in the introduced soils: A case study with Polygonum cuspidatum. Soil Biol. Biochem. 2013, 57, 858–867. [Google Scholar] [CrossRef]
  15. Nsikani, M.M.; Novoa, A.; Van Wilgen, B.W.; Keet, J.H.; Gaertner, M. Acacia saligna’s soil legacy effects persist up to 10 years after clearing: Implications for ecological restoration. Austral. Ecol. 2017, 42, 880–889. [Google Scholar] [CrossRef] [Green Version]
  16. Wang, L.; Gan, Y.; Bainard, L.; Hamel, D.C.; St-Arnaud, M.; Hijri, M. Expression of N-cycling genes of root microbiomes provides insights for sustaining oilseed crop production. Environ. Microbiol. 2020, 22, 1–12. [Google Scholar] [CrossRef]
  17. Liu, W.; Ling, N.; Guo, J.; Yang, R.; Guo, S. Legacy effects of 8-year nitrogen inputs on bacterial assemblage in wheat rhizosphere. Biol. Fertil. Soils. 2020, 56, 583–596. [Google Scholar] [CrossRef]
  18. Lu, M.; Yang, Y.; Luo, Y.; Fang, C.; Zhou, X.; Chen, J.; Yang, X.; Li, B. Responses of ecosystem nitrogen cycle to nitrogen addition: A meta-analysis. New Phytol. 2011, 189, 1040–1050. [Google Scholar] [CrossRef]
  19. Clark, C.M.; Tilman, D. Loss of plant species after chronic low-level nitrogen deposition to prairie grasslands. Nature 2008, 451, 712–715. [Google Scholar] [CrossRef]
  20. Vankoughnett, M.R.; Henry, H.A.L. Soil freezing and N deposition: Transient vs multi-year effects on plant productivity and relative species abundance. New Phytol. 2014, 202, 1277–1285. [Google Scholar] [CrossRef]
  21. Van Paassen, J.G.; Britton, A.J.; Mitchell, R.J.; Street, L.E.; Johnson, D.; Coupar, A.; Woodin, S.J. Legacy effects of nitrogen and phosphorus additions on vegetation and carbon stocks of upland heaths. New Phytol. 2020, 228, 226–237. [Google Scholar] [CrossRef] [PubMed]
  22. Chen, Q.; Wang, Z.L.; Zou, C.B.; Fan, Y.; Dittert, K.; Lin, S. Legacy effects of historical grazing affect the response of vegetation dynamics to water and nitrogen addition in semi-arid steppe. Appl. Veg. Sci. 2018, 21, 229–239. [Google Scholar] [CrossRef]
  23. De Long, J.R.; Fry, E.L.; Veen, G.F.; Kardol, P. Why are plant-soil feedbacks so unpredictable, and what to do about it? Funct. Ecol. 2019, 33, 118–128. [Google Scholar] [CrossRef] [Green Version]
  24. Bai, Y.; Wu, J.; Clark, C.M.; Naeem, S.; Pan, Q.; Huang, J.; Zhang, L.X.; Han, X. Tradeoffs and thresholds in the effects of nitrogen addition on biodiversity and ecosystem functioning: Evidence from inner Mongolia Grasslands. Glob. Change Biol. 2010, 16, 358–372. [Google Scholar] [CrossRef]
  25. Brzostek, E.R.; Fisher, J.B.; Phillips, R.P. Modeling the carbon cost of plant nitrogen acquisition: Mycorrhizal trade-offs and multipath resistance uptake improve predictions of retranslocation. J. Geophys. Res.-Biogeo. 2014, 119, 1684–1697. [Google Scholar] [CrossRef]
  26. Barel, J.M.; Kuyper, T.W.; De Boer, W.; Douma, J.C.; De Deyn, G.B. Legacy effects of diversity in space and time driven by winter cover crop biomass and nirogen concentration. J. Appl. Ecol. 2018, 55, 299–310. [Google Scholar] [CrossRef]
  27. Wang, R.Z.; Ripley, E.A. Effects of grazing on a Leymus chinensis grassland on the Songnen plain of north-eastern China. J. Arid Environ. 1997, 36, 307–318. [Google Scholar] [CrossRef]
  28. Wang, Z.W.; Li, L.H.; Han, X.G.; Ming, D. Do rhizome severing and shoot defoliation affect clonal growth of Leymus chinensis at ramet population level? Acta Oecol. 2004, 26, 255–260. [Google Scholar] [CrossRef]
  29. Gao, Y.; Sun, S.; Xing, F.; Mu, X.; Bai, Y. Nitrogen addition interacted with salinity-alkalinity to modify plant diversity, microbial plfas and soil coupled elements: A 5-year experiment. Appl. Soil Ecol. 2019, 137, 78–86. [Google Scholar] [CrossRef]
  30. Lu, X.; Mao, Q.; Mo, J.; Gilliam, F.S.; Zhou, G.; Luo, Y.; Zhang, W.; Huang, J. Divergent responses of soil buffering capacity to long-term N deposition in three typical tropical forests with different land-use history. Environ. Sci. Technol. 2015, 49, 4072–4080. [Google Scholar] [CrossRef]
  31. Jiang, S.C.; He, N.P.; Wu, L.; Zhou, D.W. Vegetation restoration of secondary bare saline-alkali patches in the Songnen plain, China. Appl. Veg. Sci. 2010, 13, 47–55. [Google Scholar] [CrossRef]
  32. Heinen, R.; Hannula, S.E.; De Long, J.R.; Huberty, M.; Jongen, R.; Kielak, A.; Steinauer, K.; Zhu, F.; Bezemer, T.M. Plant community composition steers grassland vegetation via soil legacy effects. Ecol. Lett. 2020, 23, 973–982. [Google Scholar] [CrossRef] [PubMed]
  33. Katulanda, P.M.; Walley, F.L.; Janzen, H.H.; Helgason, B.L. Land use legacy regulates microbial community composition in transplanted chernozems. Appl. Soil Ecol. 2018, 129, 13–23. [Google Scholar] [CrossRef]
  34. Li, H.; Yang, S.; Xu, Z.; Yan, Q.; Li, X.; Van Nostrand, J.D.; He, Z.; Yao, F.; Han, X.; Zhou, J.; et al. Responses of soil microbial functional genes to global changes are indirectly influenced by aboveground plant biomass variation. Soil Biol. Biochem. 2017, 104, 18–29. [Google Scholar] [CrossRef] [Green Version]
  35. Shannon-Firestone, S.; Reynolds, H.L.; Phillips, R.P.; Flory, S.L.; Yannarell, A. The role of ammonium oxidizing communities in mediating effects of an invasive plant on soil nitrification. Soil Biol. Biochem. 2015, 90, 266–274. [Google Scholar] [CrossRef]
  36. Ribbons, R.R.; Levy-Booth, D.J.; Masse, J.; Grayston, S.J.; Mcdonald, M.A.; Vesterdal, L.; Prescott, C.E. Linking microbial communities, functional genes and nitrogen-cycling processes in forest floors under four tree species. Soil Biol. Biochem. 2016, 103, 181–191. [Google Scholar] [CrossRef] [Green Version]
  37. Almaraz, M.; Wong, M.Y.; Yang, W.H. Looking back to look ahead: A vision for soil denitrification research. Ecology 2020, 101, e02917. [Google Scholar] [CrossRef] [Green Version]
  38. Hallin, S.; Jones, C.M.; Schloter, M.; Philippot, L. Relationship between N-cycling communities and ecosystem functioning in a 50-year-old fertilization experiment. ISME J. 2009, 3, 597–605. [Google Scholar] [CrossRef]
  39. Hamonts, K.; Clough, T.J.; Stewart, A.; Clinton, P.W.; Richardson, A.E.; Wakelin, S.A.; O’Callaghan, M.; Condron, L.M. Effect of nitrogen and waterlogging on denitrifier gene abundance, community structure and activity in the rhizosphere of wheat. FEMS Microbiol. Ecol. 2013, 83, 568–584. [Google Scholar] [CrossRef]
  40. Kulmatiski, A.; Beard, K.H. Long-term plant growth legacies overwhelm short-term plant growth effects on soil microbial community structure. Soil Biol. Biochem. 2011, 43, 823–830. [Google Scholar] [CrossRef]
  41. Lin, Z.; Yang, Y.; Zhan, X.; Zhang, C.; Wu, D. Technical reports: Plant and environment interactions responses of a dominant temperate grassland plant (Leymus chinensis) to elevated carbon dioxide and nitrogen addition in China. J. Environ. Qual. 2010, 39, 251–259. [Google Scholar] [CrossRef]
  42. Wyngaard, N.; Franklin, D.H.; Habteselassie, M.Y.; Mundepi, A.; Cabrera, M.L. Legacy effect of fertilization and tillage systems on nitrogen mineralization and microbial communities. Soil Sci. Soc. Am. J. 2016, 80, 1262. [Google Scholar] [CrossRef]
  43. Brinkman, E.P.; Van der Putten, W.H.; Bakker, E.; Verhoeven, K.J.F. Plant-soil feedback: Experimental approaches, statistical analyses and ecological interpretations. J. Ecol. 2010, 98, 1063–1073. [Google Scholar] [CrossRef]
  44. Zhang, C.J.; Yang, Z.L.; Shen, J.P.; Sun, Y.F.; Wang, J.T.; Han, H.Y.; Wan, S.Q.; Zhang, L.M.; He, J.Z. Impacts of long-term nitrogen addition, watering and mowing on ammonia oxidizers, denitrifiers and plant communities in a temperate steppe. Appl. Soil Ecol. 2018, 130, 241–250. [Google Scholar] [CrossRef]
  45. Ye, C.; Chen, C.R.; Du, M.; Liu, W.Z.; Zhang, Q.F. Revegetation affects soil denitrifying communities in a riparian ecotone. Ecol. Eng. 2017, 103, 256–263. [Google Scholar] [CrossRef]
  46. Niklaus, P.A.; Roux, L.R.; Poly, F.; Buchmann, N.; Scherer-Lorenzen, M.; Weigelt, A.; Barnard, R.L. Plant species diversity affects soil-atmosphere fluxes of methane and nitrous oxide. Oecologia 2016, 181, 919–930. [Google Scholar] [CrossRef] [PubMed] [Green Version]
  47. Coca-Salazar, A.; Richaume, A.; Florio, A.; Carnol, M. Response of ammonia-oxidizing bacteria and archaea abundance and activity to land use changes in agricultural systems of the central andes. Eur. J. Soil Biol. 2021, 102, 103263. [Google Scholar] [CrossRef]
  48. Regan, K.; Stempfhuber, B.; Schloter, M.; Rasche, F.; Prati, D.; Philippot, L.; Boeddinghaus, R.S.; Kandeler, E.; Marhan, S. Spatial and temporal dynamics of nitrogen fixing, nitrifying and denitrifying microbes in an unfertilized grassland soil. Soil Biol. Biochem. 2017, 109, 214–226. [Google Scholar] [CrossRef]
  49. Ordonez, J.C.; Bodegom, P.M.V.; Witte, J.P.M.; Wright, I.J.; Reich, P.B.; Aerts, A. A global study of relationships between leaf traits, climate and soil measures of nutrient fertility. Global Ecol. Biogeogr. 2009, 18, 137–149. [Google Scholar] [CrossRef]
  50. Van der Putten, W.H.; Vet, L.E.M.; Harvey, J.A.; Wäckers, F.L. Linking above and belowground multitrophic interactions of plants, herbivores, pathogens, and their antagonists. Trends. Ecol. Evol. 2001, 16, 547–554. [Google Scholar] [CrossRef]
  51. Carlson, M.; Forcella, F.; Wortman, S.; Clay, D.; Clay, S.A. Organic fertilizer abrasive grits increase soil available nitrogen, plant height, and biomass. Agr. Geosci. Environ. 2020, 3, 1–14. [Google Scholar] [CrossRef]
  52. Lozano, Y.M.; Hortal, S.; Armas, C.; Pugnaire, F.I. Interactions among soil, plants, and microorganisms drive secondary succession in a dry environment. Soil Biol. Biochem. 2014, 78, 298–306. [Google Scholar] [CrossRef]
  53. Nadal-Romero, E.; Cammeraat, E.; Pérez-Cardiel, E.; Lasanta, T. Effects of secondary succession and afforestation practices on soil properties after cropland abandonment in humid Mediterranean mountain areas. Agr. Ecosyst. Environ. 2016, 228, 91–100. [Google Scholar] [CrossRef] [Green Version]
  54. Scott, D.A.; Rosenzweig, S.T.; Baer, S.G.; Blair, J.M. Changes in Potential Nitrous Oxide Efflux during Grassland Restoration. J. Environ. Qual. 2019, 48, 1913–1917. [Google Scholar] [CrossRef]
  55. Huang, J.; Yu, H.; Lin, H.; Zhang, Y.; Searle, E.B.; Yuan, Z. Phosphorus amendment mitigates nitrogen addition-induced phosphorus limitation in two plant species in a desert steppe, China. Plant Soil 2016, 399, 221–232. [Google Scholar] [CrossRef]
  56. Han, W.; Fang, J.; Guo, D.; Zhang, Y. Leaf nitrogen and phosphorus stoichiometry across 753 terrestrial plant species in china. New Phytol. 2005, 168, 377–385. [Google Scholar] [CrossRef]
  57. Barnard, R.L.; Osborne, C.A.; Firestone, M.K. Responses of soil bacterial and fungal communities to extreme desiccation and rewetting. ISME J. 2013, 7, 2229–2241. [Google Scholar] [CrossRef]
  58. De Long, J.R.; Semchenko, M.; Pritchard, W.J.; Cordero, I.; Fry, E.L.; Jackson, B.G.; Kurnosova, K.; Ostle, N.J.; Johnson, D.; Baggs, E.M.; et al. Drought soil legacy overrides maternal effects on plant growth. Funct. Ecol. 2019, 33, 1400–1410. [Google Scholar] [CrossRef]
  59. Moreau, D.; Bardgett, R.D.; Finlay, R.D.; Jones, D.L.; Philippot, L. A plant perspective on nitrogen cycling in the rhizosphere. Funct. Ecol. 2019, 33, 540–552. [Google Scholar] [CrossRef] [Green Version]
  60. Pilbeam, D.J. The Utilization of Nitrogen by Plants: A Whole Plant Perspective. In Annual Plant Reviews. Nitrogen Metabolism in Plants in the Post-genomic Era; Foyer, C.H., Zhang, H., Eds.; Wiley-Blackwell: Oxford, UK, 2010; Volume 42, pp. 305–351. [Google Scholar]
  61. Hendriks, M.; Mommer, L.; de Caluwe, H.; Smit-Tiekstra, A.E.; van der Putten, W.H.; de Kroon, H. Independent variations of plant and soil mixtures reveal soil feedback effects on plant community overyielding. J. Ecol. 2013, 101, 287–297. [Google Scholar] [CrossRef]
  62. De Deyn, G.B.; Quirk, H.; Yi, Z.; Oakley, S.; Ostle, N.J.; Bardgett, R.D. Vegetation composition promotes carbon and nitrogen storage in model grassland communities of contrasting soil fertility. J. Ecol. 2009, 97, 864–875. [Google Scholar] [CrossRef]
  63. Wang, X.L.; Li, L.; Zhao, W.; Zhao, J.X. Rhododendron aureum Georgi formed a special soil microbial community and competed with above-ground plants on the tundra of the Changbai Mountain, China. Ecol. Evol. 2017, 7, 7503–7514. [Google Scholar] [CrossRef] [PubMed]
  64. Heinen, R.; Biere, A.; Bezemer, T.M. Plant traits shape soil legacy effects on individual plant-insect interactions. OIKOS 2020, 129, 261–273. [Google Scholar] [CrossRef] [Green Version]
  65. Khanh, T.D.; Chung, M.I.; Xuan, T.D.; Tawata, S. The exploitation of crop allelopathy in sustainable agricultural production. J. Agron. Crop Sci. 2005, 191, 172–184. [Google Scholar] [CrossRef]
  66. Liu, X.W.; Li, X.L.; Li, X.T.; Ma, W.J.; Guo, Q.; Zhu, X.R.; Xing, F. Dominant plant identity determines the soil extracellular enzyme activities of entire communities in the semi-arid grassland. Appl. Soil Ecol. 2021, 161, 1–9. [Google Scholar] [CrossRef]
  67. Su, D.X.; Zhang, Z.H. Parameters for Degradation, Sandification and Salification of Rangelands; General Administration of Quality Supervision, Inspection and Quarantine of the People’s Republic: Beijing, China, 2004; Available online: https://www.antpedia.com/standard/567725.html (accessed on 24 May 2019).
  68. Wang, D.L.; Guo, J.X.; Li, J.D. Theory and Technology of the Restoration in Songnen Alkali-Saline Grassland; Science Press: Beijing, China, 2019. [Google Scholar]
  69. Pellant, M.; Shaver, P.; Pyke, D.A.; Herrick, J.E. Interpreting Indicators of Rangeland Health, version 4; Department of the Interior, Bureau of Land Management, National Science and Technology Center: Denver, CO, USA, 2005. Available online: https://www.blm.gov/nstc/library/techref.htm (accessed on 24 May 2019).
  70. Wu, Z.Y.; Wang, X.B. The Vegetation of China; Science Press: Beijing, China, 1995. [Google Scholar]
  71. Aira, M.; G´omez-Brand´on, M.; Lazcano, C.; Bååth, E.; Domínguez, J. Plant genotype strongly modifies the structure and growth of maize rhizosphere microbial communities. Soil Biol. Biochem. 2010, 42, 2276–2281. [Google Scholar] [CrossRef]
  72. Hart, S.C.; Stark, J.M.; Davidson, E.A.; Firestone, M.K. Nitrogen mineralization, immobilization, and nitrification. Methods Soil Anal. Part 2 Microbiol. Biochem. Prop. 1994, 5, 985–1018. [Google Scholar] [CrossRef] [Green Version]
  73. Burnham, K.P.; Anderson, D.R. Model Selection and Multimodel Inference: A Practical Information-Theoretic Approach; Springer: New York, NY, USA, 2002. [Google Scholar]
  74. Schermelleh-Engel, K.; Moosbrugger, H.; Müller, H. Evaluating the fit of structural equation models: Tests of significance and descriptive goodness-of-fit measures. MPR-Online 2003, 8, 23–74. Available online: http://citeseerx.ist.psu.edu/viewdoc/summary?doi=10.1.1.506.1827 (accessed on 26 March 2020).
  75. R Core Team. R: A Language and Environment for Statistical Computing; R Foundation for Statistical Computing: Vienna, Austria, 2015; Available online: https://www.R-project.org (accessed on 10 July 2018).
  76. Vadakattu, G.; Zhang, B.; Penton, C.R.; Yu, J.; Tiedje, J.M. Diazotroph diversity and nitrogen fixation in summer active perennial grasses in a mediterranean region agricultural soil. Front. Mol. Biosci. 2019, 6, 115. [Google Scholar]
  77. Nogueira, C.B.; Menéndez, E.; Helena, M.; Bahena, R.; Velázquez, E.; Scotti, M.R. The N-fixing legume periandra mediterranea constrains the invasion of an exotic grass (Melinis minutiflora P. Beauv) by altering soil N cycling. Sci. Rep. 2019, 9, 11033. [Google Scholar] [CrossRef]
  78. Cuer, C.A.; Rodrigues, R.D.A.R.; Balieiro, F.C.; Jesus, J.; Silva, E.P.; Alves, B.J.R. Short-term effect of Eucalyptus plantations on soil microbial communities and soil-atmosphere methane and nitrous oxide exchange. Sci. Rep. 2018, 8, 15133. [Google Scholar] [CrossRef] [PubMed] [Green Version]
  79. Zhang, Y.; Hao, X.; Garcia-Lemos, A.M.; Nunes, I.; Nicolaisen, M.H.; Nybroe, O. Different Effects of Soil Fertilization on Bacterial Community Composition in the Penicillium canescens Hyphosphere and in Bulk Soil. Appl. Environ. Microbiol. 2020, 86, 1–16. [Google Scholar] [CrossRef] [PubMed] [Green Version]
Figure 1. The differences in the traits of L. chinensis among the four successional stages. (a) plant total biomass; (b) ramets number; (c) root/shoot ratio; (d) total C/total N; (e) total C/total P; (f) total N/ total P. According to the Tukey’s test, different letters indicate significance among the four successional stages (p < 0.05). Vertical bars represent mean ± SE, n = 5. EAR, early successional stage; MID, middle successional stage; LAT, late successional stage; STA, stable community stage. total C, total carbon; total N, total nitrogen; total P, total phosphorus; total C/total N, total C/total P, and total N/total P indicate their ratios. Different letters indicate significant (p < 0.05) among different successional stages.
Plants 11 01305 g001
Figure 2. Variability index (VI) of plant traits in different treatment combinations of successional stages (SU), sterilization (S), and N addition (N). SU vs. SU × S (a) indicate the changes of plant traits after we eliminate soil microbial legacy effects; SU vs. SU × N (b) indicate the impact of N addition on plant traits (with soil microbial legacy effects); SU × S vs. SU × S × N (c) indicate the N addition effect on plant traits (without soil microbial legacy effects). The percentages indicate the VI of different traits of L chinensis; ***, p < 0.001; **, p < 0.01; *, p < 0.05; ns, no significant difference.
Plants 11 01305 g002
Figure 3. The differences of N-cycling functional gene abundances among the four successional stages. (a) nifH gene abundance; (b) AOB amoA gene abundance; (c) nirK gene abundance; (d) nirS gene abundance. According to the Tukey’s test, different letters indicate significant among the four successional stages (p < 0.05). Vertical bars represent mean ± SE, n = 5. EAR, early successional stage; MID, middle successional stage; LAT, late successional stage; STA, stable community stage. Different letters indicate significant (p < 0.05) among different successional stages.
Plants 11 01305 g003
Figure 4. Variability index (VI) of N-cycling functional gene abundances (NCFGs) on the different treatments. SU, Successional stages; S, Sterilization; N, N addition. SU vs. SU × S (a) indicate the changes of NCFGs after we eliminate soil microbial legacy effects; SU vs. SU × N (b) indicate the impact of N addition on NCFGs (with soil microbial legacy effects); SU × S vs. SU × S × N (c) indicate the N addition effect on NCFGs (without soil microbial legacy effects). The percentages indicate the VI of different plant traits, significant difference are shown in: ***, p < 0.001; **, p < 0.01; *, p < 0.05; ns, no significant difference.
Plants 11 01305 g004
Figure 5. Net mineralization rate (Rm) and net N nitrification rate (Rn) in relation to N-cycling functional gene abundances (NCFGs). (a), the total relationship between NCFGs and Rm; (b), the total relationship between NCFGs and Rn; (c), the details of each N-cycling functional gene in relation to Rm and Rn; ***, p < 0.001.
Plants 11 01305 g005
Figure 6. Structural equation models revealed the effects of successional stages and N addition on soil available nitrogen (N) and phosphorus (P), soil pH, N-cycling functional gene (NCFG) abundances, plant total biomass and total N/total P. Green and red arrows indicate positive and negative relationships, respectively. Continuous and dashed arrows indicate significant (p < 0.05) relationships and no significant (p > 0.05) relationships, respectively. Numbers on arrows are standardized path coefficients. The thickness of the arrow indicates the strength of the relationship. r2 values associated with response variables indicate the proportion of variation explained by relationships with other variables. Results of model fitting: (a) chisq = 0.238, rmsea = 0.000, srmr = 0.008, cfi = 1.000, p value = 0.626, (b) chisq = 1.060, rmsea = 0.050, srmr = 0.014, cfi = 0.999, p value = 0.303.
Plants 11 01305 g006
Table 1. Three-way ANOVA of the effects of different treatments on L. chinensis traits.
Plant TraitsSUSNSU × SSU × NS × NSU × S × N
FpFpFpFpFpFpFp
total biomass3.9020.018360.040<0.0017.6910.0092.9400.0482.6610.0650.0010.9701.5920.210
ramets number0.8010.50223.043<0.0010.0640.8023.2410.0350.4610.7110.5740.4541.1610.340
root/shoot2.1780.1109.2780.0050.0140.9071.9590.1402.7550.0590.2240.6394.8820.007
total C/total N14.387<0.0013.1280.0860.4520.5063.2320.0352.9510.0470.5350.4701.4040.260
total C/total P26.907<0.0013.6910.0640.8020.3774.7760.0071.4570.2450.5500.4644.7270.008
total N/total P15.960<0.00115.303<0.0012.9400.0965.4820.0040.3070.8200.1480.70312.648<0.001
Treatments: Successional stages (SU), Sterilization (S), N addition (N), and their interactions. total C, total carbon; total N, total nitrogen; total P, total phosphorus; total C/total N, total C/total P, and total N/total P indicate their ratios. The significant values are defined as p < 0.05.
Table 2. Three-way ANOVA of the effects of different treatments on N-cycling functional gene (NCFG) abundances.
NCFG
Abundances
SUSNSU × SSU × NS × NSU × S × N
FpFpFpFpFpFpFp
nifH30.853<0.001463.562<0.0010.0830.7754.8640.0071.6970.1870.9350.3410.2920.831
AOB amoA30.525<0.001440.357<0.0013.7520.06212.933<0.0011.3250.2834.3970.0440.8460.479
nirK329.179<0.00120.557<0.0011.0910.30420.197<0.0010.1830.9071.2450.2731.8020.167
nirS48.667<0.00158.224<0.00111.2660.00230.589<0.00111.870<0.0017.5350.01012.241<0.001
Treatments: Successional stages (Su), Sterilization (S), N addition (N), and their interactions. nifH, nitrogen fixing bacteria; AOB amoA, ammonia oxidizing bacteria; nirK and nirS, denitrifying bacteria. The significant values are defined as p < 0.05.
Table 3. The vegetation characteristics of different successional stages in the grassland restoration processing (mean ± SE, n = 4).
Successional StagesCommunity TypeMain Plant SpeciesAboveground
Biomass (g/m2)
Density (ramet/m2)Height (m)Coverage (%)
EARChloris virgata +
Kochia sieversiana
C. virgata18.72 ± 11.67192.50 ± 140.440.17 ± 0.0534.50 ± 24.31
K. sieversiana82.61 ± 12.09528.00 ± 338.830.23 ± 0.0763.75 ± 22.87
Artemisia scoparia15.21 ± 7.5572.50 ± 37.380.26 ± 0.0715.00 ± 8.29
MIDLeymus chinensis + forbsL. chinensis148.69 ± 15.41285.00 ± 46.350.35 ± 0.0955.00 ± 14.72
Calamagrostis macrolepis3.45 ± 2.784.25 ± 2.300.34 ± 0.108.00 ± 5.12
Lespedeza daurica7.99 ± 6.0810.50 ± 8.700.20 ± 0.083.75 ± 1.99
K. sieversiana2.07 ± 1.011.50 ± 0.910.28 ± 0.101.38 ± 0.43
A. scoparia1.31 ± 0.454.50 ± 2.650.26 ± 0.101.50 ± 1.00
Allium mongolicum1.33 ± 0.532.50 ± 1.650.30 ± 0.061.38 ± 0.80
LATL. chinensis +
L. daurica
L. chinensis227.22 ± 36.47384.00 ± 36.370.49 ± 0.0948.75 ± 14.45
C. macrolepis33.94 ± 41.5862.00 ± 75.150.56 ± 0.098.75 ± 14.36
L. daurica70.27 ± 20.4376.50 ± 38.990.49 ± 0.1331.25 ± 16.52
STAL. chinensisL. chinensis234.64 ± 35.61431.00 ± 164.900.47 ± 0.0985.00 ± 8.16
Carex duriuscula24.89 ± 12.96612.00 ± 272.820.17 ± 0.0530.00 ± 7.07
Note: EAR, early successional stage; MID, middle successional stage; LAT, late successional stage; STA, stable community stage.
Table 4. The soil properties of different successional stages in the grassland restoration processing (mean ± SE, n = 4).
Successional StagesEARMIDLATSTA
Soil pH9.71 ± 0.118.77 ± 0.438.13 ± 0.298.46 ± 0.13
Soil moisture (%)10.04 ± 0.008.86 ± 0.018.58 ± 0.0111.37 ± 0.01
Soil total C (mg/kg)7182.50 ± 1065.00117,25.00 ± 907.0612,130.00 ± 2150.6612,480.00 ± 2170.44
Soil total N (mg/kg)175.95 ± 12.69222.70 ± 30.59278.75 ± 17.33235.15 ± 15.29
Soil total P (mg/kg)212.80 ± 22.99251.75 ± 18.13238.30 ± 20.77270.30 ± 13.10
Soil available N (mg/kg)14.29 ± 1.9315.85 ± 2.5913.60 ± 2.2712.10 ± 0.56
Soil available P (mg/kg)1.38 ± 0.232.32 ± 0.201.22 ± 0.181.50 ± 0.12
Note: EAR, early successional stage; MID, middle successional stage; LAT, late successional stage; STA, stable community stage; C, carbon; N, nitrogen; P, phosphorus.
Publisher’s Note: MDPI stays neutral with regard to jurisdictional claims in published maps and institutional affiliations.

