Abstract
Sweet cherry is an important fruit crop in China with a high economic value. From 2019 to 2020, a leaf spot disease was reported, with purplish-brown circular lesions in three cultivating regions in China. Twenty-four Fusarium isolates were obtained from diseased samples and were identified based on morphological characteristics and multi-locus phylogenetic analyses. Seven species, including F. luffae (7 isolates), F. lateritium (6 isolates), F. compactum (5 isolates), F. nygamai (2 isolates), F. citri (2 isolates), F. ipomoeae (1 isolate) and F. curvatum (1 isolate) were identified. The pathogenicity test showed that analyzed strains of all species could produce lesions on detached cherry leaves. Therefore, Fusarium was proved to be a pathogen of cherry leaf spots in China. This is the first report of F. luffae, F. compactum, F. nygamai, F. citri, F. ipomoeae and F. curvatum on sweet cherry in China.
1. Introduction
Sweet cherry (Prunus avium L.) is an economically important fruit crop widely planted in temperate regions worldwide. The cherry industry in China developed rapidly in the last decade, with 233,000 ha of cultivation area and a yield of 1,700,000 tons in 2019 [1,2]. Even with ideal conditions, various diseases occur on cherries, among which leaf spot is one of the most common and widespread [3]. Since the first report from the USA in 1878, the disease has spread quickly and occurred in most growing areas around the world [4]. The disease causes premature defoliation of leaves, the reduction of tree vigor and winter hardiness, and even tree death, leading to a bad quality of cherries [5]. Blumeriella jaapii was regarded as the causal agent of cherry leaf spot disease in Europe and North America [6]. In addition, several other associated fungi were reported. In Israel, the pathogen of cherry leaf spot was identified as Cercospora circumscissa, which caused a 40% yield loss in 1975 [7]. Additionally, Alternaria alternata and Pseudocercospora pruni-persicicola were reported as causing leaf spot in Greece and Korea, respectively [8,9]. In China, Alternaria cerasi and Passalora circumscissa were identified to cause “black spot” and “brown spot” of sweet cherry according to their morphology in the early days, respectively [10,11]. In recent years, more pathogenic species have been reported based on morphological characterization coupled with phylogenetic analysis, including four Alternaria species, three Colletotrichum species and four Didymellaceae species [3,12,13]. In this study, Fusarium spp. were isolated from cherry leaf spots for the first time, which supplemented the pathogen variety of the disease.
2. Results
2.1. Symptom Observation, Sample Collection and Fungal Isolation
Fifteen leaf spot samples were collected from sweet cherry trees cultured in open fields with the following symptoms, (1) small purple-brownish spots which may merge with expansion (Figure 1A,B); (2) circular or irregular brownish gray necrotic lesions with dark brown margin (Figure 1C,D). Twenty-four Fusarium isolates were obtained by tissue isolation, among which 13 were from Beijing, 9 from Shandong and 2 from Liaoning (Table 1).
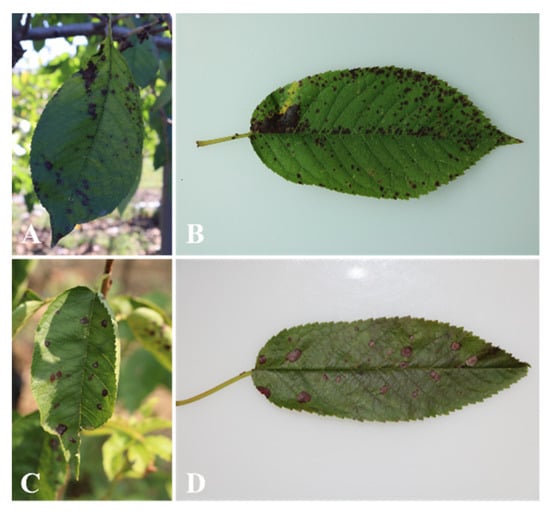
Figure 1.
Symptoms of cherry leaf spot. (A,B) symptom type 1; (C,D) symptom type 2.

Table 1.
Information and GenBank accessions of Fusarium isolates obtained in this study.
2.2. Molecular Characterization and Phylogenetic Analysis
The ITS sequences of isolates showed 100% similarity to Fusarium spp. based on BLAST analysis. Reference sequences of Fusarium were downloaded from the NCBI database (Table S1). Phylogenic trees of Fusarium incarnatum-equiseti species complex (FIESC), Fusarium lateritium species complex (FLSC), Fusarium fujikuroi species complex (FFSC) and Fusarium oxysporum species complex (FOSC) were constructed using combined sequence alignment. The sequences were deposited in the GenBank, and accession numbers were obtained (Table 1).
Phylogenetic analysis of FIESC was constructed based on the combined CaM, rpb2 and tef1 multi-locus dataset, with Fusarium concolor (CBS 961.87) as the outgroup taxon (Figure 2). Both maximum likelihood and Bayesian analyses resulted in the same topology. Among the ninety-six fungal isolates in the dataset, fifteen were from the current study. Seven isolates clustered with F. luffae in two branches with 67% ML bootstrap and 1.0 BYPP, and 70% ML bootstrap, respectively, five clustered with F. compactum with 81% ML bootstrap and 0.99 BYPP, two clustered with F. citri with 63% ML bootstrap and 0.95 BYPP, and one isolate clustered with F. ipomoeae with 99% ML bootstrap and 1.0 BYPP.
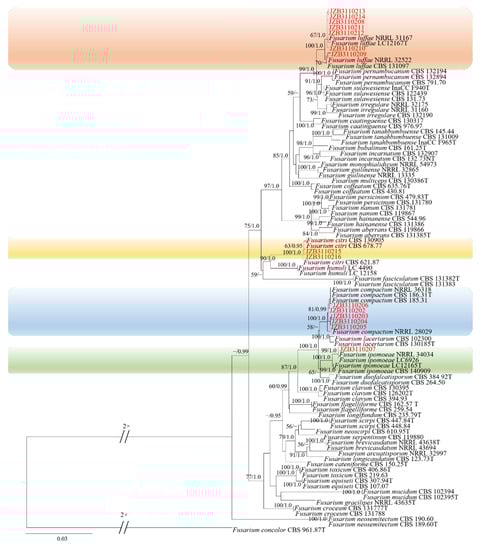
Figure 2.
Phylogenetic tree generated by maximum likelihood analysis (RAxML) of FIESC based on the combined CaM, rpb2 and tef1 sequence data. The tree is rooted with Fusarium concolor (CBS 961.87). The best-scoring RAxML tree with a final likelihood value of –11,974.052080 is presented. The matrix had 701 distinct alignment patterns, with 7.69% of undetermined characters or gaps. Estimated base frequencies were as follows: A = 0.258901, C = 0.260331, G = 0.245699, T = 0.235069; substitution rates AC = 1.002698, AG = 4.065670, AT = 1.349366, CG = 0.882966, CT = 10.506153, GT = 1.000000; gamma distribution shape parameter α = 0.751525. ML bootstrap support values ≥50% and Bayesian posterior probabilities (BYPP) ≥ 0.95 are given near the nodes. The scale bar indicates 0.03 changes per site. Isolates belonging to this study are given in red.
Phylogenetic analysis of FLSC was constructed based on combined rpb2, tef1 and tub2 multi-locus dataset, with Fusarium buharicum (CBS 796.70) as the outgroup taxon (Figure 3). Both maximum likelihood and Bayesian analyses resulted in the same topology. Six isolates clustered with F. lateritium with 94% ML bootstrap and 1.0 BYPP.
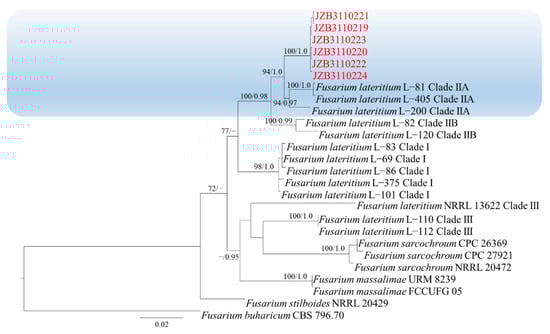
Figure 3.
Phylogenetic tree generated by maximum likelihood analysis (RAxML) of FLSC based on the combined rpb2, tef1 and tub2 sequence data. The tree is rooted with Fusarium buharicum (CBS 796.70). The best-scoring RAxML tree with a final likelihood value of −5602.556442 is presented. The matrix had 358 distinct alignment patterns, with 32.15% being undetermined characters or gaps. Estimated base frequencies were as follows: A = 0.236754, C = 0.282131, G = 0.242563, T = 0.238552; substitution rates AC = 2.260928, AG = 7.239234, AT = 2.341489, CG = 1.331525, CT = 16.787035, GT = 1.000000; gamma distribution shape parameter α = 1.252177. ML bootstrap support values ≥50% and Bayesian posterior probabilities (BYPP) ≥ 0.95 are given near the nodes. The scale bar indicates 0.02 changes per site. Isolates belonging to this study are given in red.
Phylogenetic analysis of FFSC was constructed based on the combined tef1, rpb2, tub2 and CaM multi-locus dataset, with Fusarium nirenbergiae (CBS 744.97) as the outgroup taxon (Figure 4). Both maximum likelihood and Bayesian analyses resulted in the same topology. Two isolates clustered with F. nygamai with 100% ML bootstrap and 1.0 BYPP.
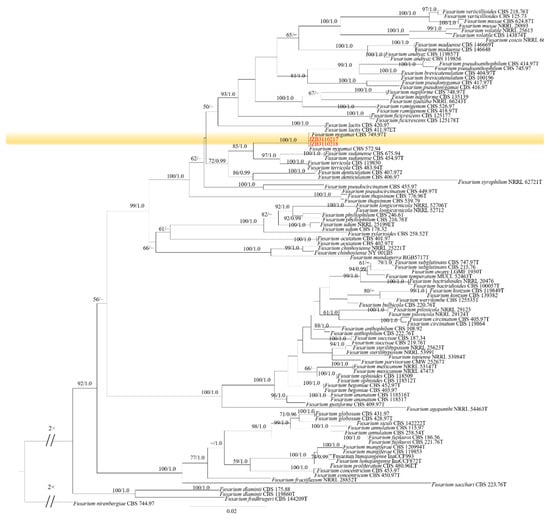
Figure 4.
Phylogenetic tree generated by maximum likelihood analysis (RAxML) of FFSC based on the combined tef1, rpb2, tub2 and CaM sequence data. The tree is rooted with Fusarium nirenbergiae (CBS 744.97). The best-scoring RAxML tree with a final likelihood value of –16,169.804811 is presented. The matrix had 1172 distinct alignment patterns, with 12.61% of undetermined characters or gaps. Estimated base frequencies were as follows: A = 0.246851, C = 0.265429, G = 0.243377, T = 0.244344; substitution rates AC = 1.195289, AG = 4.703565, AT = 1.258970, CG = 0.717390, CT = 9.004544, GT = 1.000000; gamma distribution shape parameter α = 0.838651. ML bootstrap support values ≥50% and Bayesian posterior probabilities (BYPP) ≥ 0.95 are given near the nodes. The scale bar indicates 0.03 changes per site. Isolates belonging to this study are given in red.
Phylogenetic analysis of FOSC was constructed based on the combined rpb2, tef1 and tub2 multi-locus dataset, with Fusarium foetens (CBS 120665) and Fusarium udum (CBS 177.31) as the outgroup taxa (Figure 5). Both maximum likelihood and Bayesian analyses resulted in the same topology. One isolate clustered with F. curvatum with 69% ML bootstrap and 1.0 BYPP.
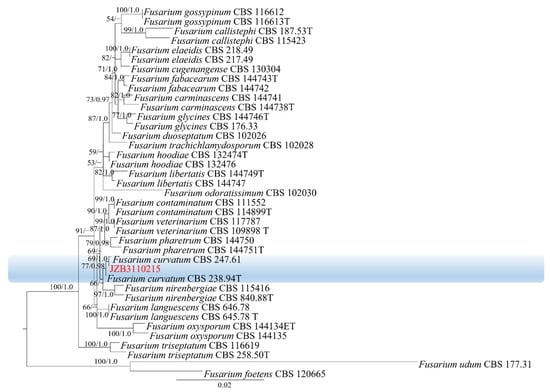
Figure 5.
Phylogenetic tree generated by maximum likelihood analysis (RAxML) of FOSC based on the combined rpb2, tef1 and tub2 sequence data. The tree is rooted with Fusarium foetens (CBS 120665) and Fusarium udum (CBS 177.31). The best-scoring RAxML tree with a final likelihood value of −4987.801452 is presented. The matrix had 199 distinct alignment patterns, with 0.90% of undetermined characters or gaps. Estimated base frequencies were as follows: A = 0.251044, C = 0.269288, G = 0.238899, T = 0.240769; substitution rates AC = 1.155437, AG = 2.887244, AT = 0.424595, CG = 0.728892, CT = 5.651969, GT = 1.000000; gamma distribution shape parameter α = 1.022063. ML bootstrap support values ≥50% and Bayesian posterior probabilities (BYPP) ≥ 0.95 are given near the nodes. The scale bar indicates 0.02 changes per site. Isolates belonging to this study are given in red.
2.3. Morphological Observation
Morphological characteristics were shown in Figure 6, Table 2 and Table 3. Based on cultural and morphological characters, Fusarium isolates were consistent with F. compactum, F. ipomoeae, F. luffae, F. citri, F. nygamai, F. lateritium and F. curvatum, as previously described [14,15,16].
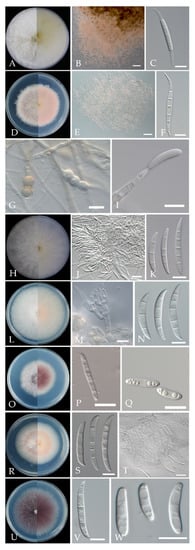
Figure 6.
Morphological characteristics of Fusarium species isolated from cherry leaf spot. (A) Colony of F. compactum; (B) Sporodochia of F. compactum on carnation leaf; (C) Macroconidia of F. compactum on CLA; (D) Colony of F. ipomoeae; (E) Sporodochia of F. ipomoeae; (F) Macroconidia of F. ipomoeae; (G) Chlamydospores of F. ipomoeae; (H) Colony of F. luffae; (I) Conidiophore of F. luffae on aerial hyphae; (J) Sporodochia of F. luffae; (K) Macroconidia of F. luffae; (L) Colony of F. citri; (M) Conidiogenous cells of F. citri formed on sporodochia; (N) Macroconidia of F. citri; (O) Colony of F. nygamai; (P) Macroconidia of F. nygamai; (Q) Microconidia of F. nygamai; (R) Colony of F. lateritium; (S) Macroconidia of F. lateritium; (T) Sporodochia of F. lateritium; (U) Colony of F. curvatum; (V) Macroconidia of F. curvatum; (W) Microconidia of F. curvatum. scale bar: (A,C,D,F–I,K–S,U–W) = 10 μm; (J,T) = 20 μm; (B,E) = 100 μm.
Table 2.
Characteristics of colonies of Fusarium fungi cultivated on PDA.
Table 3.
Description of conidia of Fusarium fungi cultivated on CLA.
2.4. Pathogenicity Test
Three days post-inoculation, all Fusarium isolates were pathogenic to detached cherry leaves, resulting in lesions similar to the disease symptoms observed in the field (Figure 7). The disease incidences [(symptomatic sites/total inoculated sites) × 100%] and lesion diameter of wounded and unwounded leaves of each species are reported in Table 4. No symptoms were observed on the control leaves. According to the result, F. compactum, F. luffae and F. ipomoeae were the most aggressive and caused lesion diameters of more than 10 mm. The other species were relatively less virulent, with lesion diameters varying from 7 mm to 10 mm, and lesion diameters did not differ significantly. The disease incidence of wounded leaves was slightly higher than that of unwounded leaves, while unwounded leaves of some species appeared to form larger lesion diameters. The fungi were re-isolated from the lesions successfully and identified using morphology and molecular analyses.
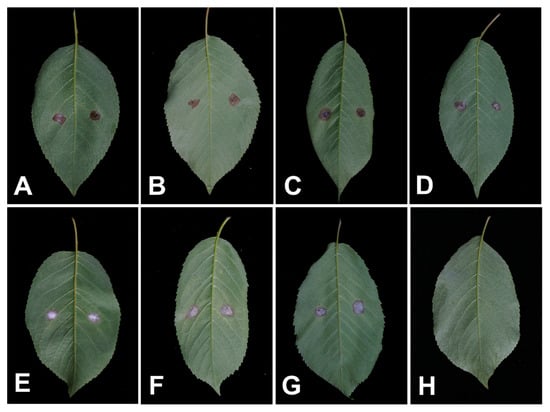
Figure 7.
The pathogenicity test of Fusarium spp. on detached cherry leaves three days post-inoculation. (A–G) Detached leaves inoculation of F. luffae, F. lateritium, F. compactum, F. nygamai, F. citri, F. ipomoeae and F. curvatum, respectively. Left side of the leaf was wounded before inoculation, right side was unwounded; (H) Control.
Table 4.
Features of colonies and macroconidia for Fusarium species isolated in this study. (lowercase letters indicate the significant differences for lesion diameters (p < 0.05).
3. Discussion
Leaf spot is a common and severe disease of sweet cherry caused by various pathogens, while the occurrence of Fusarium on sweet cherry has not been reported before in the world. Fusarium is one of the most renowned genera, which includes a large number of saprotrophs, endophytes or pathogens [17]. As a common plant pathogen, Fusarium spp. can cause many diseases with a wide range of hosts, usually causing wilts, blights, rots, and cankers (Ma et al., 2013). Fusarium can also be the causal agent of leaf spot disease in several plants including Dracaena, mango, peanut and Bletilla striata [18,19,20,21].
Fusarium species reported on sweet cherry are usually associated with trunk disease. Fusarium oxysporum has been reported as the pathogen of cherry root and crown rot in Canada [22], and F. lateritium was reported to cause trunk diseases in Australia [23]. Five Fusarium species have also been reported to cause postharvest rot on Chinese cherry [24]. In this study, Fusarium species were identified as causal agents of cherry leaf spot based on morphological characteristics and molecular phylogenetic analyses. Among them, seven were pathogenic to cherry leaves; specifically, F. compactum, F. luffae and F. ipomoeae showed relatively high virulence.
Fusarium compactum had been regarded as a saprophyte, while being reported as the pathogen of corm and root rot of banana, a fatal canker on Italian cypress, and a wilt and root rot of peanuts [25,26,27]. Fusarium ipomoeae, F. luffae and F. citri were introduced as new species in the study reported on Fusarium incarnatum-equiseti complex from China [15]. Afterwards, F. ipomoeae was reported to cause leaf spots on peanut and Bletilla striata [20,21], F. luffae was reported to cause fruit rot on muskmelon in China [28], and F. citri was initially isolated from Citrus [15]. Fusarium nygamai was first observed on a basal stalk and root rot of grain sorghum [29] and can also cause root rot on other crops including cotton, maize, millet, rice and sorghum [14]. Fusarium lateritium can cause wilt, tip or branch dieback, or cankers on many woody trees and shrubs including some important fruit trees and coffee [14]. These species all have records as pathogens; therefore, attention should be paid to the Fusarium leaf spot on sweet cherry plant, which may cause severe damage in some conditions.
Relevant results in the current study expand the pathogenic fungal species on sweet cherry, and further research is necessary to understand the influence of Fusarium on cherry diseases.
4. Materials and Methods
4.1. Sample Collection and Isolation of Fungal Strains
From 2019 to 2020, cherry leaf spot samples were collected from farmers’ fields in Beijing, Liaoning and Shandong Provinces in China. Each sample contains three leaves from a tree. Lesions were selected randomly and diseased tissues at the junction of disease and healthy region were cut into 5 × 5 mm squares, then surface-sterilized using 75% ethanol for 30 s and washed three times using sterile water. After drying on sterilized filter paper, tissues were transferred to potato dextrose agar (PDA) plates and incubated at 25 °C, and the hyphae from colony margins were transferred to fresh PDA plates after five days. After sporulation, single-spore isolation was conducted to get purified cultures.
4.2. DNA Extraction, PCR Amplification and Phylogenetic Analysis
Mycelia were collected from the cultures on PDA media for seven days, and genomic DNA was extracted using the CTAB method. The internal transcribed spacer (ITS) region was amplified first using the primers ITS5/ITS4 [30], and sequences were searched using BLASTn (Basic Local Alignment Search Tool) on NCBI (National Center for Biotechnology Information) to identify reference sequences. Then, the RNA polymerase second largest subunit (rpb2), translation elongation factor 1-alpha (tef-1), beta-tubulin (tub2) and calmodulin (CaM) genes were amplified, and the primers were listed in Table 5. The 50 μL reaction system for amplification contained 25 μL 2 × Taq PCR Master Mix (Biomed, Beijing, China), 21 μL double-distilled water, 1 μL of each forward and reverse primers (10 μM) and 2 μL DNA template. PCR conditions were as follows: initial denaturation at 94 °C for 3 min, followed by 34 cycles of denaturation at 94 °C for 30 s, primer annealing at the temperatures for 1 min and extension at 72 °C for 1 min, and final extension at 72 °C for 10 min. The PCR products were examined in 1.5% agarose gel and sequenced by Tsingke Biotech Co., Ltd. (Beijing, China). The sequences generated in the current study and reference sequences of Fusarium species downloaded from the GenBank database of NCBI (Table S1) were aligned with MAFFT v. 7 (https://mafft.cbrc.jp/alignment/server/ (accessed on 18 March 2022) [31]. Aligned gene regions were adjusted manually where necessary and combined with BioEdit 7.0.9.0.
Table 5.
Primers used in this study.
Maximum likelihood (ML) phylogenic analyses of species complexes were conducted using RAxML-HPC2 on XSEDE (v8.2.8) through the CIPRES Science Gateway (https://www.phylo.org/portal2 (accessed on 13 April 2022) [32]. The evolutionary model GTR + I + G was applied to all gene regions, and bootstrap support values were obtained by running 1000 pseudo replicates.
The Bayesian Inference (BI) analyses were performed based on the Markov Chain Monte Carlo sampling (BMCMC) method using MrBayes v3.1.2 to evaluate posterior probabilities (BYPP) [33]. Six simultaneous Markov chains were run for 2,000,000 generations and trees were sampled at every 1000th generation.
Phylogenetic trees were visualized with FigTree v1.4.0 and edited in Microsoft Office PowerPoint 2016. The ML bootstrap supports greater than or equal to 50% and Bayesian posterior probabilities greater than or equal to 0.95 are shown at the nodes in the resulting phylogenetic tree. The sequences generated in this study were deposited in the GenBank.
4.3. Morphological Identification
The isolates were cultured on PDA and carnation leaf agar (CLA) to observe colony and conidia morphology respectively [14]. Mycelial discs of 4 mm diam were inoculated at the center of PDA plates and incubated in the dark at 25 °C. Colony diameters were measured after five days, and cultural features were examined and photographed. Isolates inoculated on CLA were cultured under 12/12 h light/dark cycle conditions for 10 days, the characteristics of micro- and macroconidia were observed under Axiocam 506 color Imager Z2 photographic microscope (Carl Zeiss Microscopy GmbH, Jena, Germany) and measurements were made with ZEN Pro 2012 (Carl Zeiss Microscopy).
4.4. Pathogenicity Assays
A pathogenicity test was conducted by inoculating detached leaves with spore suspension. Representative isolates of each species were cultured on PDA at 25 °C until sporulation. Tender, healthy-looking leaves of P. avium cv. ‘Tieton’ were collected from Tongzhou Experimental Station for Cherries, Beijing Academy of Forestry and Pomology Sciences, Beijing, China. Leaves were surface sterilized with 75% ethanol for 30 s, rinsed three times with sterile water and air-dried on sterilized filter paper. Spores collected from cultures were dispersed in sterile water and the concentration was adjusted to 1.0 × 10⁶/mL using a hemocytometer. Four small holes were pierced on the left side of the vein by a sterile needle for the wounded inoculation. Then, 20 μL spore suspension was inoculated on the wounds and non-wound treatment was performed on symmetrical halves of each leaf. Six leaves were inoculated for each isolate with three replicates. Sterile water was used as the control. Leaves were incubated in disinfected plastic boxes at 25 °C and 80% relative humidity, with a 12/12 h light/dark cycle. Disease incidence (%) [(symptomatic sites/total inoculated sites) × 100%] was calculated and lesion diameters were measured after the appearance of symptoms. The fungal strains used for leaves inoculation were re-isolated to confirm Koch’s postulates. Data were subjected to a one-way analysis of variance (ANOVA) using the software IBM SPSS Statistics v20 to determine the significance of the differences. Means of different species were separated using the least significant difference test at the p = 0.05 level.
Supplementary Materials
The following supporting information can be downloaded at: https://www.mdpi.com/article/10.3390/plants11202760/s1, Table S1: Sequences of used in the phylogenetic analyses with GenBank accession numbers.
Author Contributions
Conceptualization, J.Y., W.Z. and K.W.T.C.; methodology, Y.Z., W.Z. and S.J.; software, Y.Z.; validation, W.Z. and K.W.T.C.; formal analysis, Y.Z.; investigation, Y.Z., W.Z. and S.J.; resources, J.Y., W.Z. and Y.Z.; data curation, Y.Z. and W.Z.; writing—original draft preparation, Y.Z.; writing—review and editing, W.Z., X.L. and K.W.T.C.; visualization, Y.Z. and W.Z.; supervision, J.Y., W.Z., K.W.T.C. and K.D.H.; project administration, J.Y. and W.Z.; funding acquisition, J.Y. and W.Z. All authors have read and agreed to the published version of the manuscript.
Funding
This research was funded by Beijing Academy of Agriculture and Forestry Sciences (KJCX20210403) and Beijing Municipal Science and Technology Project (Z201100008020014).
Data Availability Statement
All the newly produced sequences are deposited in the GenBank and the accession numbers are given in Table 1.
Conflicts of Interest
The authors declare no conflict of interest.
References
- Huang, Z.G.; Liu, C.L.; Li, M.; Zhao, G.R.; Li, Y.H. The development situation of sweet cherry industry in China and abroad during recent two decades and prognostication for the future. J. Fruit Sci. 2014, 31, 1–6. (In Chinese) [Google Scholar]
- Duan, X.W.; Li, M.; Tan, Y.; Zhang, X.M.; Wang, B.G.; Yan, G.H.; Wang, J.; Pan, F.R.; Liu, Q.Z.; Zhang, K.C. Fruit scientific research in new China in the past 70 years: Cherry. J. Fruit Sci. 2019, 36, 1339–1351. (In Chinese) [Google Scholar]
- Chethana, K.W.T.; Jayawardene, R.S.; Zhang, W.; Zhou, Y.Y.; Liu, M.; Hyde, K.D.; Li, X.H.; Wang, J.; Zhang, K.C.; Yan, J.Y. Molecular characterization and pathogenicity of fungal taxa associated with cherry leaf spot disease. Mycosphere 2019, 10, 490–530. [Google Scholar] [CrossRef]
- Holb, I.J. Some biological features of cherry leaf spot (Blumeriella jaapii) with special reference to cultivar susceptibility. Int. J. Hortic. Sci. 2009, 15, 91–93. [Google Scholar] [CrossRef]
- Wharton, P.S.; Iezzoni, A.; Jones, A.L. Screening cherry germ plasm for resistance to leaf spot. Plant Dis. 2003, 87, 471–477. [Google Scholar] [CrossRef] [PubMed]
- Schuster, M.; Tobutt, K.R. Screening of cherries for resistance to leaf spot, Blumeriella jaapii. Acta Hortic. 2004, 663, 239–244. [Google Scholar] [CrossRef]
- Sztejnberg, A. Etiology and control of cherry leaf spot disease in Israel caused by Cercospora circumscissa. Plant Dis. 1986, 70, 349. [Google Scholar] [CrossRef]
- Thomidis, T.; Tsipouridis, C. First report of Alternaria leaf spot on cherry trees in Greece. Plant Dis. 2006, 90, 680. [Google Scholar] [CrossRef]
- Choi, I.Y.; Braun, U.; Park, J.H.; Shin, H.D. First report of leaf spot caused by Pseudocercospora Pruni-Persicicola on sweet cherry in Korea. Plant Dis. 2014, 98, 693. [Google Scholar] [CrossRef]
- Zhu, J.L.; Chang, Y.Y. Identification and biological characterization of the pathogen causing cherry black target spot. China Fruits 2004, 3, 9–12. (In Chinese) [Google Scholar]
- Liu, B.Y.; Zhang, W.; Luan, B.H.; Wang, Y.Z. Identification of pathogen and epidemic dynamics of brown spot of sweet cherry. J. Fruit Sci. 2012, 29, 634–637. (In Chinese) [Google Scholar]
- Yang, L.P.; Jin, M.J.; Cui, L.X.; Li, T.H.; An, J.; Wei, L.J.; Chang, T.; Yang, C.D. Isolation and identification of the pathogen causing cherry black spot in Gansu Province. J. Fruit Sci. 2020, 37, 891–899. (In Chinese) [Google Scholar]
- Tang, Z.; Lou, J.; He, L.; Wang, Q.; Chen, L.; Zhong, X.; Wu, C.; Zhang, L.; Wang, Z.Q. First Report of Colletotrichum fructicola causing anthracnose on cherry (Prunus avium) in China. Plant Dis. 2022, 106, 317. [Google Scholar] [CrossRef] [PubMed]
- Leslie, J.F.; Summerell, B.A. The Fusarium Laboratory Manual, 1st ed.; Blackwell Pub: Ames, IA, USA, 2006. [Google Scholar]
- Wang, M.M.; Chen, Q.; Diao, Y.Z.; Duan, W.J.; Cai, L. Fusarium incarnatum-equiseti complex from China. Persoonia 2019, 43, 70–89. [Google Scholar] [CrossRef]
- Lombard, L.; Sandoval-Denis, M.; Lamprecht, S.C.; Crous, P.W. Epitypification of Fusarium oxysporum—Clearing the taxonomic chaos. Persoonia 2019, 43, 1–47. [Google Scholar] [CrossRef]
- Sandoval-Denis, M.; Guarnaccia, V.; Polizzi, G.; Crous, P.W. Symptomatic citrus trees reveal a new pathogenic lineage in Fusarium and two new Neocosmospora Species. Persoonia 2018, 40, 1–25. [Google Scholar] [CrossRef]
- Baka, Z.A.M.; Krzywinski, K. Fungi associated with leaf spots of Dracaena Ombet (Kotschy and Peyr). Microbiol. Res. 1996, 151, 49–56. [Google Scholar] [CrossRef]
- Guo, Z.; Yu, Z.; Li, Q.; Tang, L.; Guo, T.; Huang, S.; Mo, J.; Hsiang, T.; Luo, S. Fusarium species associated with leaf spots of mango in China. Microb. Pathogenesis 2021, 150, 104736. [Google Scholar] [CrossRef]
- Xu, M.; Zhang, X.; Yu, J.; Guo, Z.; Li, Y.; Wu, J.; Chi, Y. First report of Fusarium ipomoeae causing peanut leaf spot in China. Plant Dis. 2021, 105, 3754. [Google Scholar] [CrossRef]
- Zhou, L.Y.; Yang, S.F.; Wang, S.M.; Lv, J.W.; Wan, W.Q.; Li, Y.H.; Zhou, H. Identification of Fusarium ipomoeae as the causative agent of leaf spot disease in Bletilla Striata in China. Plant Dis. 2021, 105, 1204. [Google Scholar] [CrossRef] [PubMed]
- Úrbez-Torres, J.R.; Boulé, J.; Haag, P.; Hampson, C.; O’Gorman, D.T. First report of root and crown rot caused by Fusarium oxysporum on sweet cherry (Prunus avium) in British Columbia. Plant Dis. 2016, 100, 855. [Google Scholar] [CrossRef]
- Cook, R.P.; Dubé, A.J. Host-Pathogen Index of Plant Diseases in South Australia; South Australian Department of Agriculture: Adelaide, Australia, 1989. [Google Scholar]
- Wang, C.; Wang, Y.; Wang, L.; Li, X.; Wang, M.; Wang, J. Fusarium species causing postharvest rot on Chinese cherry in China. Crop Prot. 2021, 141, 105496. [Google Scholar] [CrossRef]
- Frisullo, S.A.; Logrieco, A.; Moretti, A.; Grammatikaki, G.; Bottalico, A. Banana corm and root rot by Fusarium compactum in Crete. Phytopatho. Mediterr. 1994, 33, 78–82. [Google Scholar]
- Madar, Z.; Kimchi, M.; Solel, Z. Fusarium canker of Italian cypress. Eur. J. Forest Pathol. 1996, 26, 107–112. [Google Scholar] [CrossRef]
- Saleh, O.I. Wilt, root rot and seed diseases of groundnut in El-Minia governorate, Egypt. Egypt. J. Phytopathol. 1997, 25, 1–18. [Google Scholar]
- Zhang, X.P.; Cao, X.D.; Dang, Q.Q.; Liu, Y.G.; Zhu, X.P.; Xia, J.W. First report of fruit rot caused by Fusarium luffae in muskmelon in China. Plant Dis. 2022, 106, 1763. [Google Scholar] [CrossRef]
- Trimboli, D.S.; Burgess, L.W. Fungi associated with basal stalk rot and root rot of dryland grain sorghum in New South Wales. Plant Prot. Q. 1985, 1, 3–9. [Google Scholar]
- White, T.J. Amplification and direct sequencing of fungal ribosomal RNA genes for phylogenetics. PCR Protoc. Guide Methods Appl. 1990, 31, 315–322. [Google Scholar]
- Katoh, K.; Rozewicki, J.; Yamada, K.D. MAFFT online service: Multiple sequence alignment, interactive sequence choice and visualization. Brief. Bioinform. 2019, 20, 1160–1166. [Google Scholar] [CrossRef]
- Miller, M.A.; Pfeiffer, W.; Schwartz, T. Creating the CIPRES Science Gateway for inference of large phylogenetic trees. In Proceedings of the 2010 Gateway Computing Environments Workshop (GCE), New Orleans, LA, USA, 14 November 2010; pp. 1–8. [Google Scholar]
- Ronquist, F.; Huelsenbeck, J.P. MrBayes 3: Bayesian phylogenetic inference under mixed models. Bioinformatics 2003, 19, 1572–1574. [Google Scholar] [CrossRef]
- Reeb, V.; Lutzoni, F.; Roux, C. Contribution of RPB2 to multilocus phylogenetic studies of the euascomycetes (Pezizomycotina, Fungi) with special emphasis on the lichen-forming Acarosporaceae and evolution of polyspory. Mol. Phylogenet. Evol. 2004, 32, 1036–1060. [Google Scholar] [CrossRef]
- Liu, Y.J.; Whelen, S.; Hall, B.D. Phylogenetic relationships among ascomycetes: Evidence from an RNA polymerase II subunit. Mol. Biol. Evol. 1999, 16, 1799–1808. [Google Scholar] [CrossRef] [PubMed]
- O’Donnell, K.; Kistler, H.C.; Cigelnik, E.; Ploetz, R.C. Multiple evolutionary origins of the fungus causing panama disease of banana: Concordant evidence from nuclear and mitochondrial gene genealogies. Proc. Natl. Acad. Sci. USA 1998, 95, 2044–2049. [Google Scholar] [CrossRef] [PubMed]
- O’Donnell, K.; Kistler, H.C.; Tacke, B.K.; Casper, H.H. Gene genealogies reveal global phylogeographic structure and reproductive isolation among lineages of Fusarium graminearum, the fungus causing wheat scab. Proc. Natl. Acad. Sci. USA 2000, 97, 7905–7910. [Google Scholar] [CrossRef] [PubMed]
- O’Donnell, K.; Cigelnik, E. Two divergent intragenomic rDNA ITS2 types within a monophyletic lineage of the fungus Fusarium are nonorthologous. Mol. Phylogenet. Evol. 1997, 7, 103–116. [Google Scholar] [CrossRef]


Publisher’s Note: MDPI stays neutral with regard to jurisdictional claims in published maps and institutional affiliations. |
© 2022 by the authors. Licensee MDPI, Basel, Switzerland. This article is an open access article distributed under the terms and conditions of the Creative Commons Attribution (CC BY) license (https://creativecommons.org/licenses/by/4.0/).