Article

Comprehensive Genome-Wide Analysis and Expression Pattern Profiling of PLATZ Gene Family Members in Solanum Lycopersicum L. under Multiple Abiotic Stresses

1
Department of Agricultural Education, Sunchon National University, 413 Jungangno, Suncheon 57922, Republic of Korea
2
Department of Biology, Yangon University of Education, Kamayut Township 11041, Yangon Region, Myanmar
3
Graduate School of Biotechnology and Crop Biotech Institute, Kyung Hee University, Yongin 17104, Republic of Korea
4
Department of Botany, University of Narowal, Narowal 51600, Pakistan
5
Department of Plant Bioscience, College of Natural Resources and Life Science, Pusan National University, Miryang-si 50463, Gyeongsangnam-do, Republic of Korea
6
Department of Horticulture, Kyungpook National University, Daegu 41566, Republic of Korea
*
Author to whom correspondence should be addressed.
Plants 2022, 11(22), 3112; https://doi.org/10.3390/plants11223112
Submission received: 2 October 2022 / Revised: 8 November 2022 / Accepted: 10 November 2022 / Published: 15 November 2022
(This article belongs to the Special Issue Applications of Bioinformatics in Plant Resources and Omics)

Abstract

:
PLATZ (plant AT-rich sequence and zinc-binding) family proteins with two conserved zinc-dependent DNA-binding motifs are transcription factors specific to the plant kingdom. The functions of PLATZ proteins in growth, development, and adaptation to multiple abiotic stresses have been investigated in various plant species, but their role in tomato has not been explored yet. In the present work, 20 non-redundant Solanum lycopersicum PLATZ (SlPLATZ) genes with three segmentally duplicated gene pairs and four tandemly duplicated gene pairs were identified on eight tomato chromosomes. The comparative modeling and gene ontology (GO) annotations of tomato PLATZ proteins indicated their probable roles in defense response, transcriptional regulation, and protein metabolic processes as well as their binding affinity for various ligands, including nucleic acids, peptides, and zinc. SlPLATZ10 and SlPLATZ17 were only expressed in 1 cm fruits and flowers, respectively, indicating their preferential involvement in the development of these organs. The expression of SlPLATZ1, SlPLATZ12, and SlPLATZ19 was up- or down-regulated following exposure to various abiotic stresses, whereas that of SlPLATZ11 was induced under temperature stresses (i.e., cold and heat stress), revealing their probable function in the abiotic stress tolerance of tomato. Weighted gene co-expression network analysis corroborated the aforementioned findings by spotlighting the co-expression of several stress-associated genes with SlPLATZ genes. Confocal fluorescence microscopy revealed the localization of SlPLATZ–GFP fusion proteins in the nucleus, hinting at their functions as transcription factors. These findings provide a foundation for a better understanding of the structure and function of PLATZ genes and should assist in the selection of potential candidate genes involved in the development and abiotic stress adaptation in tomato.

1. Introduction

A transcription factor (TF) is a regulatory protein with one or more DNA-binding domains that can control the expression of target genes by binding directly to their promoter regions. From a combinatorial gene regulation perspective, TFs can also physically interact with each other to control diverse cellular processes [1]. The evolution of the TF families does not always demonstrate a robust corresponding correlation among plants, animals, and yeast. In the dicotyledonous model plant Arabidopsis, more than 5% of its genome codes for over 1500 transcription factors, nearly 45% of which belong to plant-specific TF families [2]. Some classes of transcription factors identified more abundantly in plants (i.e., WRKY, NAC, and AP2/EREBP families) display their critical roles in plant-specific mechanisms such as secondary metabolism, responses to plant hormones, and the development of unique characteristics of distinct cell types [3,4,5,6].
Plant AT-rich sequence and zinc binding (PLATZ) proteins, identified as a novel class of zinc-dependent DNA-binding proteins, belong to the plant-specific TF family. They maintain the distinctive structural conformation of the zinc finger protein family and harbor two evolutionarily conserved domains required for zinc-dependent DNA binding, namely C-x2-H-x11-C-x2-C-x(4–5)-C-x2-C-x(3–7)-H-x2-H and C-x2-C-x(10–11)-C-x3-C [7]. The two conserved regions of PLATZ genes identified in a variety of plant species differ from the zinc-binding motifs of other zinc finger proteins, such as COSTANS/CONSTANS-like (CO/COLs), GATA finger (C-x2-C-x(17–18)-C-x2-C), the DNA-binding finger (Dof), LIM (C2HC5), and RING (C3HC4) [8,9,10,11]. These zinc finger proteins, which have been categorized into several different types according to the quantity and arrangement of their cysteine and histidine residues that bind the zinc ion [12], regulate various cellular functions, including binding of RNA, regulation of apoptosis, transcriptional control, and interaction among proteins [13]. Additionally, their functions as key transcriptional regulators implicated in the defense and acclimation responses of various plant species have been well documented [13,14]. Since the first PLATZ gene member, PsPLATZ1, was identified from pea (Pisum sativum) in 2001 as a transcriptional inhibitor that binds to A/T-rich regions [7], it has aroused the interest of researchers to explore the functions of PLATZ transcription factors in diverse plant species.
PLATZ transcription factors regulate the growth and development of numerous plant species. In rice, the PLATZ transcription factor GL6 interacts with transcription factor class C1 and RNA polymerase III subunit C53 to control spikelet number and grain length [15], while the PLATZ protein SHORT GRAIN6 (SG6) modulates seed size and the division of spikelet hull cells by interacting with DP transcription factor and cell division regulators [16]. Floury3 (FL3), encoding a PLATZ transcription factor in maize, regulates endosperm development and the accumulation of storage materials in maize grains through the interaction with transcription factor class C1 (TFC1) and RNA polymerase III subunit 53 (RPC53) [17]. Another maize PLATZ transcription factor, ZmPLATZ2, also functions in the regulation of starch synthesis in maize by directly binding to the CAAAAAAA motif in the promoter region of ZmSSI [18]. The important roles of PLATZ proteins in the secondary growth of Populus stems were demonstrated through transcriptome analysis [19]. The PLATZ transcription factor ORESARA15 (ORE15) controls leaf development and senescence in Arabidopsis by modulating the rate and duration of early cell proliferation and the GRF/GIF regulatory pathway [20], whereas ABA-INDUCED expression 1 (AIN1), a putative PLATZ protein family member in Arabidopsis, affects the elongation of the primary root in response to ABA induction [21]. It has been recently reported that ORE15 also regulates root meristem enlargement in Arabidopsis via auxin and cytokinin signaling-related pathways [22].
In addition to their involvement in the growth and developmental processes of plants, PLATZ transcription factors also play a crucial role in plant acclimatization to various environmental stimuli. AtPLATZ1 and AtPLATZ2 are reported to play a regulatory role in desiccation tolerance in vegetative tissues and seeds of Arabidopsis [23]. The expression of PhePLATZ1 is induced by osmotic stress, and the PhePLATZ1-overexpressing transgenic Arabidopsis lines show higher tolerance to drought stress compared to wild-type plants [24]. Furthermore, AtPLATZ4 functions as a positive regulator in ABA response and drought tolerance in Arabidopsis by directly interacting with the A/T-rich sequences in the promoter of PIP2;8 [25]. By contrast, GmPLATZ17 plays a negative regulatory role in the drought tolerance of soybean by suppressing the transcription of GmDREB5 [26]. AtPLATZ2 functions redundantly with AtPLATZ7 as a negative regulator in the salt stress adaptation of Arabidopsis by repressing the expression of CBL4/SOS3 and CBL10/SCaBP8 [27]. The overexpression of cotton PLATZ1 in Arabidopsis enhances the osmotic and salt stress tolerance of the resulting transgenic lines at the germination and seedling stages [28], while that of soybean PLATZ1 in Arabidopsis shows delayed germination under osmotic stress [29]. Furthermore, several reports have demonstrated that PLATZ genes in multiple plant species are responsive to various hormones and abiotic stresses [28,30,31,32].
Tomato (Solanum lycopersicum L.) is of commercial value due to its widespread production and consumption around the globe. As a result of the abundance of several nutrients, such as lycopene, lutein, Zeaxanthin, potassium, ascorbic acid, and β-carotene in tomato, it is also the second most significant vegetable crop in the world [33]. With the availability of whole genome sequences of tomato cultivars as well as with its numerous interesting features, such as compound leaves, a sympodial shoot, and fleshy fruit, which cannot be analyzed in other model plants (i.e., Arabidopsis and rice), tomato has also been extensively studied as a model organism for fleshy-fruited plants [34]. Genome-wide analyses utilize various bioinformatics tools to explore the characteristics of gene family members, gene structures, phylogenetic relationships, expression profiles, gene ontologies, putative gene functions, and so forth. The data extracted from genome-wide identification studies provide researchers with valuable information and an initial framework for further functional verification of potential candidate genes that can be exploited for plant genetic improvement [35]. A genome-wide characterization of the PLATZ gene family in diverse plant species has been conducted [14,32,36,37,38,39,40], but there has been no systematic investigation of their phylogenetic relationships or characteristics in solanaceous crops. The productivity and fruit quality of tomato are severely affected by various adverse environmental stresses, and hence it is essential to identify the potential novel genes implicated in the abiotic stress responses of tomato for the utilization of these genes in the genetic improvement of tomato [41]. Therefore, we conducted expression profiling of tomato PLATZ genes at various developmental stages and on exposure to diverse abiotic stresses. In addition to the genome-wide characterization of SlPLATZ proteins, their subcellular localization assays and gene co-expression network analysis using RNA sequencing data were carried out to shed light on their probable functional role in tomato. This study aimed to provide a solid foundation for further functional verification of potential PLATZ transcription factors for the improvement of abiotic stress adaptation in tomato.

2. Results

2.1. Identification and Sequence Analysis of PLATZ Family Members in Tomato

A total of 20 non-redundant PLATZ genes were identified in the tomato genome and designated as SlPLATZ1SlPLATZ20 in accordance with their chromosomal positions. In silico analyses revealed that the lengths of predicted PLATZ proteins varied from 137 (SlPLATZ6) to 255 (SlPLATZ14) amino acids (aa), and their molecular weight ranged between 15.94 and 29.16 kDa for SlPLATZ6 and SlPLATZ14, respectively. The theoretical pI value of only one protein (SlPLATZ6) was less than 7, whereas those of the other 19 proteins were greater than 7, revealing that all tomato PLATZ family proteins were basic proteins, except SlPLATZ6. The GRAVY of SlPLATZ proteins ranged between −0.217 and −0.709, showing that all these proteins were hydrophilic. Further information on SlPLATZ family proteins, including locus IDs, is shown in Table 1.

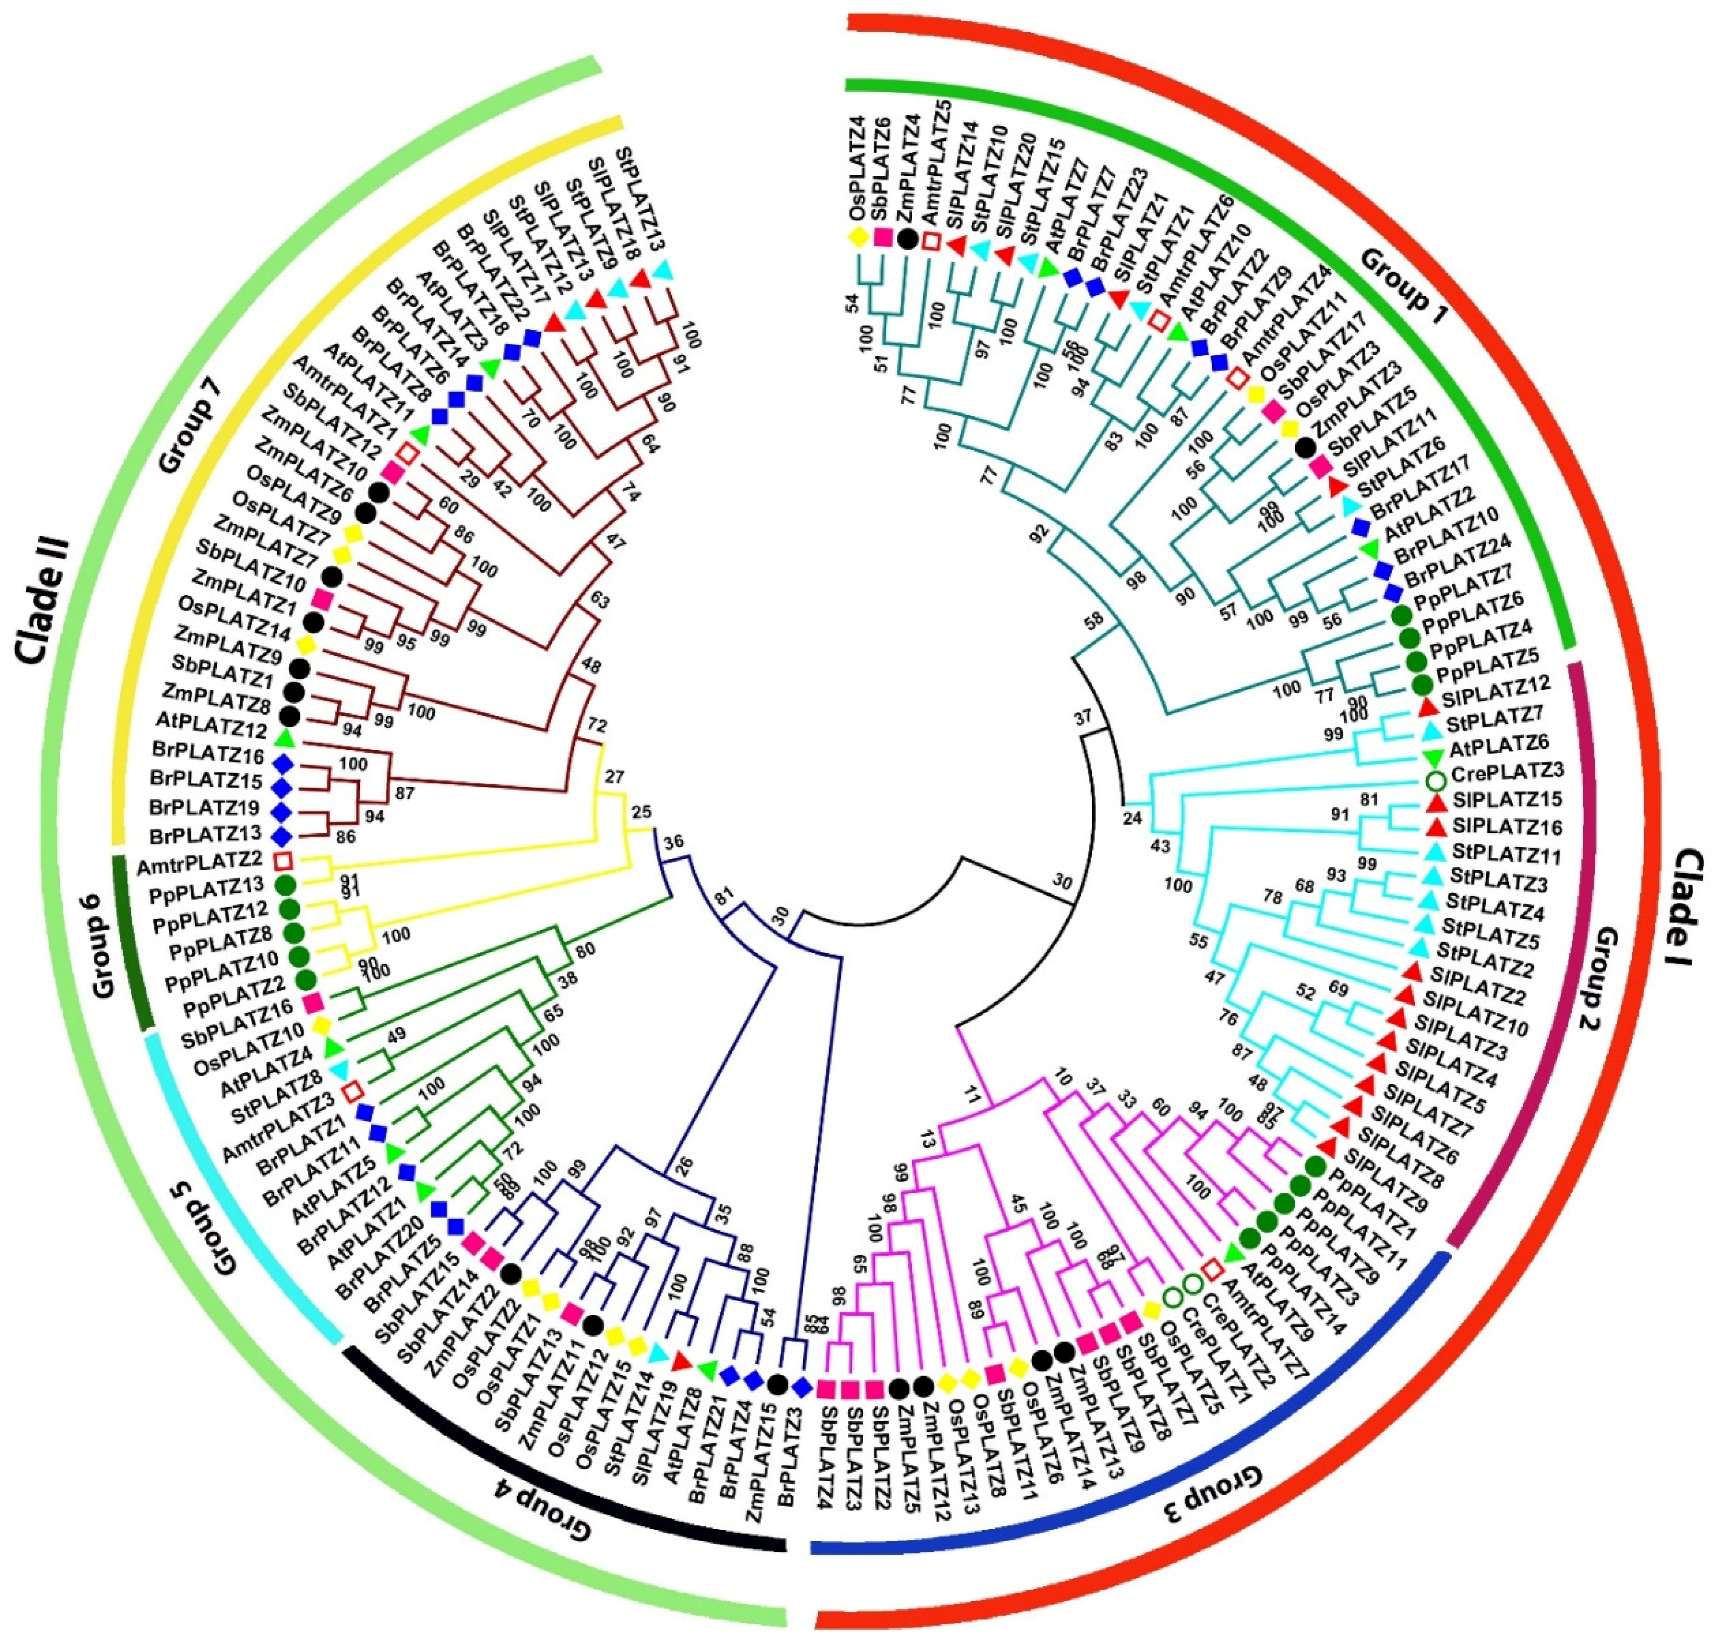
2.2. Multiple Protein Sequence Alignment and Phylogenetic Analysis

Multiple sequence alignment of tomato PLATZ proteins with a PLATZ protein from the model plant Arabidopsis underlined the evolutionary conservation of PLATZ proteins from tomato and Arabidopsis (Figure 1), particularly the presence of the two conserved regions, the first region harboring five cysteine and three histidine residues [C-x2-H-x11-C-x2-C-x(4–5)-C-x2-C-x(3–5)-H-x2-H] and the second region with four cysteine residues [C- x2-C-x(10–12)-C-x3-C], crucial for zinc-dependent DNA binding [38,39]. However, it is interesting to note that SlPLATZ6 is the only protein devoid of the second conserved region. To investigate the evolutionary relationship of the SlPLATZ gene family, a phylogenetic tree was constructed using PLATZ proteins from 10 different plant species. (Figure 2). PLATZ family members from various plant species were divided into two primary clades, which can be further categorized into seven groups based on their phylogenetic affinity. The evolutionary tree constructed indicated a major grouping of homologous proteins from monocots (maize, rice, and sorghum) and dicots (Brassica rapa, tomato, Arabidopsis, and potato) together with lower plants. Intriguingly, PLATZ proteins from the green alga Chlamydomonas reinhardtii were distributed specifically in groups 2 and 3 of clade I and clustered with the homologs from monocots, dicots, and the basal angiosperm Amborella trichopoda. The paralogous proteins from the moss Physcomitrella patens were clustered together in groups 1 and 3, but PpPLATZ13 was paired with the homolog from A. trichopoda in group 6. The basal angiosperm homologs, distributed in groups 1, 3, 5, 6, and 7, were clustered not only with those from dicots and monocots but also with those from the lower plants. The 20 tomato PLATZ proteins were allocated to four of the seven groups, except groups 3, 5, and 6. The greatest number (12) of SlPLATZs was arranged in group 2, while the smallest number (1) was in group 4. Groups 1 and 7 included four and three SlPLATZ proteins, respectively. PLATZ proteins from tomato were grouped specifically with those of their evolutionarily closely related species, potato.

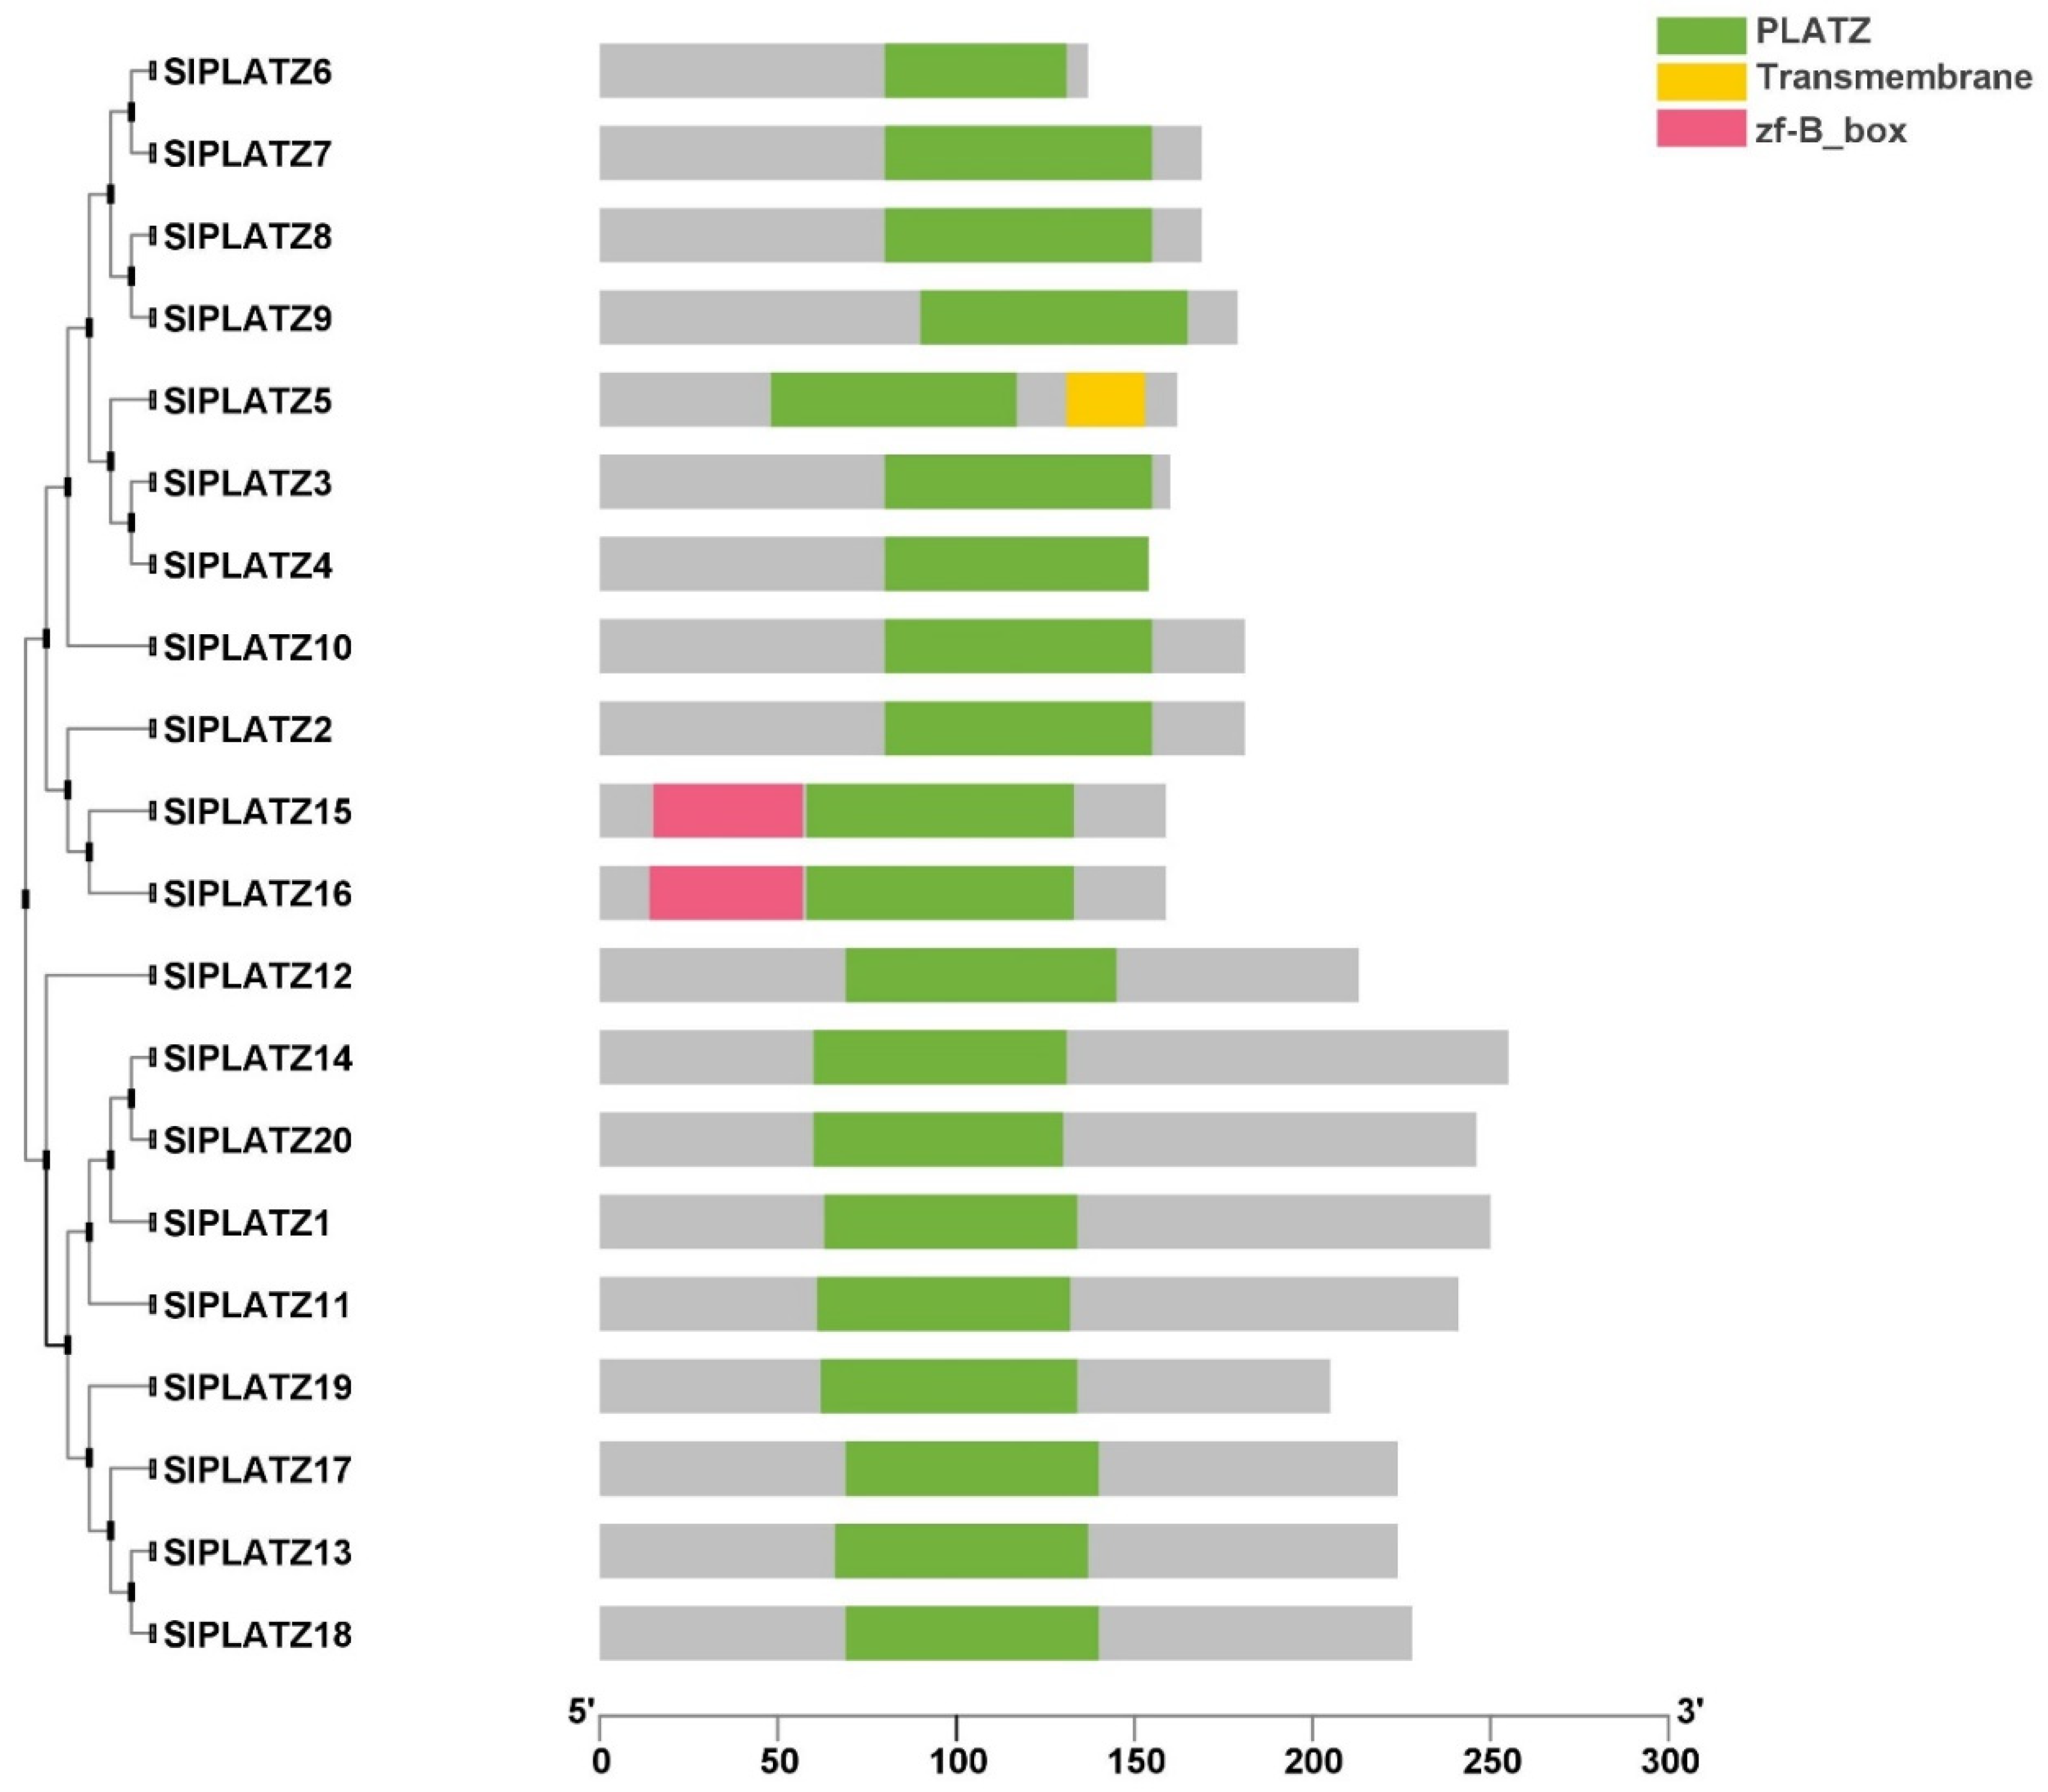
2.3. Conserved Domain Prediction, Gene Structure, and Motif Composition of SlPLATZ Genes

PLATZ proteins are composed of a conserved PLATZ domain with or without additional types of domains. Seventeen out of 20 SlPLATZ proteins comprised only the PLATZ domain, while the remaining three SlPLATZ proteins were composed of the PLATZ domain and an additional domain, viz., the B-box-type zinc finger domain (BBOX) or transmembrane domain (TM) (Figure 3). Among the three proteins having an additional domain, SlPLATZ4 was the only member harboring a TM domain in the rear of the PLATZ domain, while a BBOX domain positioned before the PLATZ domain was predicted in SlPLATZ15 and SlPLATZ16. Analysis of the exon–intron distribution of the SlPLATZ genes indicated that there was no gene lacking an intron in their coding sequences (Figure S1). Except for SlPLATZ5, which contained only one intron, all SlPLATZ genes have between two and three introns. Intriguingly, the paralogous gene pairs in the same clades, such as SlPLATZ15 and SlPLATZ16, shared the identical gene structure in terms of intron number and exon length.
To further analyze the structural diversity of the PLATZ gene family, we explored the composition of conserved motifs in SlPLATZ proteins with respect to the PLATZ homologous proteins from Arabidopsis and rice (Figures S2 and S3). The paralogous gene pairs and orthologous gene pairs from the three plant species harbored almost identical motif compositions. The motif organization of most SlPLATZ proteins belonging to phylogenetic group 2 is almost identical, with the exception of SlPLATZ5, which contained only motifs 1, 3, and 6. Motifs 1 and 5, which resided in the PLATZ domain region, were the most prevalent motifs in nearly all the PLATZ homologs of three plant species, except for AtPLATZ9 and OsPLATZ15, which were devoid of motif 1 and 5, respectively. Intriguingly, motif 7 was uniquely present in most SlPLATZ protein members belonging to group 2, but not identified in any PLATZ homologs from rice and Arabidopsis. In addition, motif 9 was specific to certain PLATZ proteins from all plant species belonging to group 1.

2.4. Chromosomal Distribution, Gene Duplication, and Microsynteny Analysis of SlPLATZ Genes

SlPLATZ genes were unequally dispersed on eight of the twelve chromosomes (Chr), except for Chr03, Chr05, Chr09, and Chr12 (Figure S4). The majority of tomato chromosomes harbored a small number of PLATZ genes (1–3) residing near the distal end of the chromosomes, while Chr02 possessed 10 genes located in the central region of the chromosome. Of the chromosomes with a lesser number of PLATZ genes, Chr07 had three genes, which was followed by Chr08 with two genes. The remaining five chromosomes (Chr01, Chr04, Chr06, Chr10, and Chr11) carried only one gene each.
A total of seven duplicated gene pairs were identified in the tomato PLATZ gene family (Table 2, Figures S4 and S5). Among the 20 SlPLATZ genes, four gene pairs (SlPLATZ2/SlPLATZ3, SlPLATZ3/SlPLATZ4, SlPLATZ6/SlPLATZ7, and SlPLATZ15/SlPLATZ16) were predicted to be tandemly duplicated, while three gene pairs (SlPLATZ13/SlPLATZ18, SlPLATZ14/SlPLATZ20, and SlPLATZ17/SlPLATZ18) were detected as segmental duplicates. The duplicated genes of each pair were located in the same phylogenetic group. The mode of selection pressure imposed on the SlPLATZ gene duplicates was identified based on Ka/Ks values. The Ka/Ks ratios of all SlPLATZ gene duplicates were lower than 1, revealing that these genes had undergone strong purifying/negative selection with little variation after duplication. The computation of the Ka/Ks ratios of gene duplicates indicated that the duplication events were predicted to have occurred between 1.05 and 31.43 million years ago (MYA). These duplicated gene pairs may have diverged in the last 1–31 million years.
Furthermore, a comparative microsyntenic analysis was performed to investigate the phylogenetic relationship between tomato, Arabidopsis, and rice. No orthologous gene pairs were predicted between rice and Arabidopsis, whereas we identified seven orthologs between tomato and Arabidopsis and two orthologs between tomato and rice, respectively (Figure 4). SlPLATZ18 was orthologous to three PLATZ genes (AtPLATZ3, AtPLATZ11, and AtPLATZ12) from Arabidopsis, while SlPLATZ12 and SlPLATZ17 were orthologous to AtPLATZ6 and AtPLATZ11, respectively. Intriguingly, SlPLATZ1 and SlPLATZ11 were collinear with the PLATZ genes from both Arabidopsis and rice. SlPLATZ1 and SlPLATZ11 were orthologous to AtPLATZ10 and OsPLATZ6, and OsPLATZ11 and SlPLATZ2, respectively.

2.5. Analysis of Cis-Acting Elements and miRNA Target Sites in SlPLATZ Genes

We analyzed the cis-regulatory elements in the upstream regions of SlPLATZ gene family members to explore their probable involvement in the transcriptional regulation on exposure to diverse abiotic stresses. Different numbers of cis-acting elements associated with phytohormones and abiotic stress adaptation were predicted in the promoter sequences of tomato PLATZ genes (Figure S6 and Table S4). The identified stress-responsive cis-elements were LTR (related to low temperature and hypersalinity stress and defense), TC-rich repeats (involved in defense and stress responses), drought-responsive MYB-binding site (MBS), and WUN motifs (implicated in wounding responses), whereas those associated with hormones were TGA elements and AuxRR-core (related to the auxin response), ABA-responsive ABRE elements, TGA elements and AuxRR-core (with roles in the auxin response), TCA-elements (implicated in the SA response), the TGACG- and CGTCA-motifs (involved in the jasmonic acid [JA] response), and gibberellic acid (GA) response-related TATC- and P-boxes.
Transcription factors (TFs) and microRNAs (miRNAs) are crucial gene regulatory factors, and miRNA-mediated regulation of transcription factors plays a vital role in plant development and stress tolerance [42]. Thus, we examined the miRNA target sequences in SlPLATZ genes to shed light on the relationship between miRNA and tomato PLATZ transcription factors in environmental stress response. A total of 12 out of 20 tomato PLATZ genes were predicted to be the target genes of diverse tomato miRNAs, including sly-miR159, sly-miR162, sly-miR171a, sly-miR319a, sly-miR319b, sly-miR319c-3p, sly-miR396a-5p, sly-miR396b, sly-miR403-5p, sly-miR482a, sly-miR5303, sly-miR6024, sly-miR9469-3p, sly-miR9472-3p, and sly-miR9478-3p, which are involved in the development and stress response of tomato (Table S5).

2.6. Analysis of Three-Dimensional Structures of Predicted SlPLATZ Proteins

The 3D model structures of tomato PLATZ proteins predicted through the I-TASSER server showed creditable values of parameters used in comparative modeling (Figure 5), including the percentage of sequence identity, coverage, and Z-scores (Tables S6 and S7). This indicated the reliability of the predicted SlPLATZ models. The binding sites in the resulting 3D models were determined with Discovery Studio v.21.1, and the secondary structural components predicted in the models ranged from 2–8 for α-helices, 5–8 for β-strands, and 8–15 for coils, respectively. The majority of duplicated gene pairs in the SlPLATZ gene family displayed similar secondary structural components, but SlPLATZ3 and SlPLATZ4 had variable numbers of β-strands and coils, which were 5–8 and 10–12, respectively (Table S8).
The prediction of the binding residues based on an alignment between the template and the generated SlPLATZ models revealed that five SlPLATZ proteins (SlPLATZ1, SlPLATZ2, SlPLATZ5, SlPLATZ13, and SlPLATZ17) showed binding affinity to nucleic acids, while eight proteins (SlPLATZ3, SlPLATZ4, SlPLATZ6, SlPLATZ7, SlPLATZ9, SlPLATZ15, SlPLATZ16, and SlPLATZ19) displayed binding affinity to zinc. SlPLATZ18 was the only protein that showed an affinity to both nucleic acids and zinc. The remaining six proteins that lacked binding affinity to both nucleic acids and zinc (SlPLATZ8, SlPLATZ10, SlPLATZ11, SlPLATZ12, SlPLATZ14, and SlPLATZ20) were predicted to bind to other diverse ligands such as peptide, mannose, copper, calcium, magnesium, cyanide, phosphate, glutathione, chlorophyll-a, and glycine (Table S9).
Gene ontology (GO) terms predicted from the modeling of SlPLATZ proteins by the I-TASSER web tool suggested that the modeled SlPLATZ proteins might function in diverse biological processes, such as cellular defense response, transcriptional regulation, gene expression, translation, protein maturation, and protein metabolic processes (Table S10).

2.7. Expression Profiling of Tomato PLATZ Genes in Various Organs

To further explore the possible functional role of SlPLATZ genes in developmental processes, we studied their expression patterns in different tomato tissues (leaves, stems, roots, flowers, 1 cm fruits, IM fruits, MG fruits, B fruits, and B5 fruits) through RT−qPCR analysis in the tomato cultivar Ailsa Craig. The higher homology in the cDNA sequences of most SlPLATZ genes inhibits the availability of the sequence regions to design the primers for the expression analysis (Figure S7). Thus, nine tomato PLATZ genes, viz., SlPLATZ1, SlPLATZ5, SlPLATZ10, SlPLATZ11, SlPLATZ12, SlPLATZ14, SlPLATZ17, SlPLATZ19, and SlPLATZ20, were studied for expression profiling in various tomato organs. The expression of SlPLATZ5, SlPLATZ14, and SlPLATZ20 was not determined in any of the organs studied. Among the remaining six SlPLATZ genes, two genes (SlPLATZ10 and SlPLATZ17) displayed tissue-specific expression, while the other genes (i.e., SlPLATZ1, SlPLATZ11, SlPLATZ12, and SlPLATZ19) exhibited varied transcript levels across the different organs tested (Figure 6).
The transcripts of SlPLATZ10 were detected solely in 1 cm fruits but not in any other organs examined. Likewise, the expression of SlPLATZ17 was determined in no organ, except in flowers. SlPlATZ1 was expressed in all tomato organs, except in breaker 5 fruits. Relative to the control (leaves), SlPlATZ1 showed peak expression in 1 cm fruits (~12-fold), which was followed by flowers (~10-fold) and immature green fruits (~6-fold), respectively. It is noteworthy that the expression of SlPlATZ1 was higher in the early developmental stages of tomato fruits, and then gradually diminished at the late developmental stages. The transcript levels of SlPlATZ11 were higher (>6-fold) in flowers, roots, and stems compared with the control. However, its expression was downregulated (2.7-fold relative to the control) in 1 cm fruits and was not determined at all in the remaining developmental stages of tomato fruits.
The expression of SlPlATZ12 was detected in various organs tested, and it showed the highest expression (>15-fold) in stems, followed by roots (>7-fold), and 1 cm fruits (2.6-fold), respectively, compared to the control. However, in contrast to the control, the transcript levels of SlPlATZ12 were downregulated in the other developmental stages of fruits (i.e., IM fruits (>2-fold), MG fruits (>1.6-fold), breaker fruits (>3.6-fold), and breaker 5 fruits (>8.8-fold)). SlPlATZ19 showed the highest transcription levels in flowers (>1.5-fold over the control). Its expression is also higher in the vegetative organs (i.e., leaves, stems, and roots) compared with the five fruit developmental stages. The transcripts of SlPlATZ19 were reduced in 1 cm fruits (2.5-fold), IM fruits (2.7-fold), MG fruits (4.4-fold), breaker fruits (~2-fold) and breaker 5 fruits (4.5-fold) in comparison with the control.

2.8. Expression Analysis of SlPLATZ Genes in Response to Abiotic Stresses and Phytohormone Treatment

To explicate the probable functions of SlPLATZ genes in response to various abiotic stresses and the stress hormone ABA, the expression profiles of SlPLATZ genes (SlPLATZ1, SlPLATZ15, SlPLATZ10, SlPLATZ11, SlPLATZ12, SlPLATZ14, SlPLATZ17, SlPLATZ19, and SlPLATZ20) in the leaves sampled before and after exposure to different stress treatments were analyzed via qRT−PCR assay. SlPLATZ5, SlPLATZ10, SlPLATZ14, SlPLATZ17, and SlPLATZ20 did not display detectable expression in all leaves harvested from control, abiotic stress-, or ABA-treated plants, while the other tomato PLATZ genes (SlPLATZ1, SlPLATZ11, SlPLATZ12, and SlPLATZ19) were differentially expressed under these treatments (Figure 7A–E).
SlPLATZ1, SlPLATZ12, and SlPLATZ19 displayed responses to drought treatment, while the transcript levels of SlPLATZ11 were not significantly altered at all time points of the stress period (Figure 7A). In comparison with the control (0 h), the transcript levels of SlPLATZ1 were significantly induced by >2-fold at 24 h after drought treatment and peaked (>3-fold) at 48 h in response to drought stress. Although the expression of SlPLATZ1 was unchanged at 60 h upon exposure to drought conditions, it was upregulated (>2-fold vs. the control) again at the last stage of the drought period. Similarly, SlPLATZ19 was highly up-regulated (2.9- to 8.2-fold) at all stages of drought treatment relative to the control. By contrast, the mRNA transcript levels of SlPLATZ12 were considerably downregulated (>2- to >55-fold relative to the control) throughout the drought stress period.
Under salt stress, the transcripts of SlPLATZ1 were initially repressed by ~2-fold at 1 h after salt treatment compared with the control, but significantly upregulated (2.3-fold) at the last time point of the stress period. SlPLATZ12 expression was induced (>1.6-fold over the control) at 3 h of exposure to saline conditions but decreased from 1.5- to 1.8-fold at the later stages of salt treatment. Salinity stress attenuated the expression of SlPLATZ11 and SlPLATZ19 from 2.4 to 3-fold at 1 h and 9 h of the stress period, respectively (Figure 7B).
In response to low-temperature conditions, SlPLATZ11 showed upregulation from 1.6- to 2-fold relative to the control at all stages of cold treatment. Likewise, the expression levels of SlPLATZ12 were induced by 1.6- to 2-fold throughout the cold stress period. By contrast, the expression of SlPLATZ1 was downregulated (1.9- to 2.6-fold over the control) at all time points following exposure to cold treatment. The transcripts of SlPLATZ19 were initially unchanged at 1 h following cold exposure but decreased significantly, 1.3- to 4-fold, at the later time points of low-temperature stress (Figure 7C).
Under heat stress, the expression of SlPLATZ1 initially declined by ~2-fold at 1 h of exposure to high-temperature conditions but recovered at 3 h and subsequently rose (2- to 4-fold) at 9 h and 24 h compared to the control. SlPLATZ11 was downregulated by 2.3-fold at 1 h after heat exposure but significantly upregulated (1.6- to 2-fold) at 3 h and 24 h. Similarly, the transcript accumulation levels of SlPLATZ12 were attenuated (2-fold vs. the control) at 1 h following exposure to a high temperature but rose 2.1-fold at 3 h. On the contrary, SlPLATZ19 was significantly repressed by 1.6- to 3.3-fold at most stages of heat treatment (Figure 7D).
The expression levels of SlPLATZ1 were remarkably reduced (1.5- to 3.4-fold relative to the control) in the early phases of ABA treatment but significantly elevated (1.5- to 2-fold) at the later stages. SlPLATZ12 was repressed by >1.8-fold at 1 h following exposure to ABA stress, whereas SlPLATZ12 was minimally upregulated (1.3-fold) at 3 h. By contrast, the transcripts of SlPLATZ19 were not significantly altered upon exposure to exogenous ABA application (Figure 7E).

2.9. Weighted Gene Co-Expression Network (WGCNA) Analysis and Functional Enrichment Analysis

WGCNA was conducted to construct the co-expression network of SlPLATZ genes using RNA-seq data (Figure 8). A total of 150 genes were detected in the co-expression networks of SlPLATZ genes. Specifically, 116, 10, and 24 genes were involved in the gene co-expression networks of SlPLATZ17, SlPLATZ18, and SlPLATZ19, respectively. The KEGG enrichment analysis of the co-expressed genes indicated that the co-expressed genes in the network of SlPLATZ genes were implicated in diverse biological pathways, including plant–pathogen interaction, RNA transport, mismatch repair, MAPK signaling pathway, biosynthesis of secondary metabolites, fatty acid biosynthesis, biosynthesis of amino acids, phenylpropanoid biosynthesis, nitrogen metabolism, protein export, and so forth (Figure 9, Tables S11 and S12). However, certain co-expressed genes have not been annotated in any biological process. Intriguingly, SlSHMT2 (Solyc02g091560.3) and a RIN--G finger gene (Solyc08g081370) responsive to multiple abiotic stresses, SnRK1 (Solyc02g067030) and SlZF-31 (Solyc08g063040) associated with abiotic stress tolerance of tomato, a NAC gene (Solyc04g005610) responsive to drought and salinity treatments, an abiotic stress-inducible gene SlGS2 (Solyc01g080280), AHL5 (Solyc08g008030) implicated in the resistance to the oomycete pathogen Phytophthora capsica, and Glutaredoxin (Solyc08g062970) responsive to pathogen infection were co-expressed with the hub gene SlPLATZ19. SlGS2 (Solyc01g080280) inducible by various abiotic stresses, a stress-inducible gene coding for Chaperonin 21 (Solyc12g009250), and SnRK1 (Solyc02g067030) associated with stress tolerance in tomato were also present in the co-expression network of SlPLATZ18. Furthermore, SlPLATZ17 showed co-expression with several abiotic stress-associated genes, such as SlAPRR5 (Solyc03g081240) inducible by seawater stress, SlTLP6 (Solyc04g071750) responsive to osmotic stress, a gene encoding nucleolar protein 6 (Solyc02g085230) inducible by aluminum stress, and low-temperature inducible genes SlGRAS4 (Solyc01g100200) and SlPLDβ1(Solyc08g080130). We also identified several genes inducible by pathogen infection in the co-expression network of SlPLATZ17, such as SlPP2C48 (Solyc06g076100), and genes that codify a GRAS transcription factor (Solyc07g063940), a major latex-like protein (Solyc08g023660), and a leucine-rich repeat receptor-like serine/threonine protein kinase (Solyc11g017270) (Figure 8).

2.10. Subcellular Location Analysis of SlPLATZ Proteins

The subcellular locations of SlPLATZ proteins predicted by the WoLF-PSORT server indicated that they were localized to the nucleus or cytoplasm (Table 1). For the further verification of their subcellular localization, full-length cDNAs of three SlPLATZ genes (SlPLATZ11, SlPLATZ12, and SlPLATZ19) were fused to the green fluorescent protein (GFP) and transiently expressed in rice protoplasts. Confocal imaging of protein fluorescence revealed that the fluorescence signals of SlPLATZ11 were observed not only in the nucleus but also in a large part of the cytoplasm. SlPLATZ12 was exclusively localized to the nucleus, while SlPLATZ19 was localized to the nucleus with its strong fluorescence signals detected in the cytosol (Figure 10).

3. Discussion

PLATZ genes, identified specifically in the plant kingdom, are novel zinc-dependent DNA-binding transcription factors that constitute a multi-gene family across a wide variety of plant species [14,32,36,37,38,39,40]. In support of previous findings, we identified 20 PLATZ genes in the tomato genome, revealing their existence as a multiple-gene family in tomato. This finding suggested that PLATZ genes might play pivotal biological roles in several diverse plant species.
Our phylogenetic analysis divided the PLATZ proteins from various plant species into two major clades (Figure 2). Of these clades, only clade I contained the PLATZ homologs from the green alga Chlamydomonas reinhardtii, suggesting that the proteins from clade I, especially groups 2 and 3, may be more primitive compared with those from clade II, and they might have evolved before the divergence of chlorophytes and streptophytes over one billion years ago [43]. The phylogenetic groups 4, 5, and 7 of clade II contained solely clusters of PLATZ homologous proteins from angiosperms, suggesting that the corresponding proteins from these groups might have arisen before the monocot–dicot split occurred (~200 million years ago) [44]. Intriguingly, group 2 of clade I predominantly consisted of the corresponding proteins from solanaceous crops (tomato and potato) together with the homolog from Arabidopsis (AtPLATZ6) and green alga (CrePLATZ3), suggesting that these members from Arabidopsis and solanaceous crops in group 2 may have emerged from the same progenitor before the divergence of algae and streptophytes. Notably, the tomato PLATZ proteins formed a cluster with their orthologs from potato in groups 1, 4, and 7 with 100% bootstrap support, underlying the evolutionary conservation of these PLATZ members in the solanaceous family.
Conserved domain analysis revealed that the majority of tomato PLATZ proteins were composed of only a single PLATZ domain, while an additional domain was identified in a few of them (Figure 3). This finding indicated that the integration of additional domains in SlPLATZ proteins may contribute to the diversification and enlargement of the SlPLATZ gene family. In addition, the similarity between the first conserved region of the PLATZ domain with certain double zinc finger domains, namely LIM (C2HC5) and RING (C3HC4) [11], and the second region of the PLATZ domain with the GATA finger (C2C2) [9] suggested that the conserved regions of the plant-specific PLATZ domain might have evolved and diversified from its ancestral zinc finger motifs through nucleotide substitution and minor insertion/deletion mutations.
Analysis of the conserved motifs and exon–intron composition in SlPLATZ genes revealed the structural similarity among the majority of SlPLATZ genes clustered in the same phylogenetic groups, suggesting their structural conservation in the more closely related SlPLATZ family members (Figures S1 and S2). The similar motif composition of paralogous and orthologous gene pairs from tomato, Arabidopsis, and rice suggested the important role of these conserved motifs in the expansion of the PLATZ gene family and the evolutionary conservation of those motifs during species evolution.
Gene duplication is an important evolutionary mechanism that enhances the adaption of organisms to diverse environments by generating additional genes [45,46]. The prediction of three segmentally duplicated gene pairs and four tandemly duplicated gene pairs in the SlPLATZ gene family suggested that both segmental and tandem gene duplication triggered the expansion of the tomato PLATZ gene family during evolution. Our finding is in line with the previous reports that identified several duplicated gene pairs responsible for the enlargement of the PLATZ gene family in multiple plant species [14,32,38,39,40]. Group-specific gene duplication events were observed in the tomato PLATZ gene family since the duplicated genes of each pair belonged to the same phylogenetic groups (Table 2).
The microsynteny analysis revealed more orthologous gene pairs between tomato and Arabidopsis and very few orthologs between tomato and rice (Figure 4). This result showed that tomato is evolutionarily more closely related to the dicotyledonous model plant Arabidopsis, in comparison with the monocotyledonous model plant rice. Two SlPLATZ genes were collinear with those of both Arabidopsis and rice, suggesting that these orthologous genes in tomato, Arabidopsis, and rice may have existed before the divergence of the ancestral genes during the evolutionary process.
The upstream regions of numerous stress-related genes have been identified to contain a variety of stress-associated cis-regulatory elements [47,48,49]. The prediction of a diverse number of stress-responsive and hormone-related cis-acting elements in the promoter regions of many SlPLATZ genes (Figure S6 and Table S4) supported the abiotic stress responsiveness of SlPLATZ genes. For instance, the presence of the ABA-responsive element ABRE and the low-temperature responsive element LTR in the promoter region of SlPLATZ1, the LTR element and the drought-responsive element MBS in that of SlPLATZ12, and the LTR element in that of SlPLATZ19 suggested that these cis elements might act as molecular switches in their response to these stress conditions. Our result was corroborated by the presence of stress-responsive cis-elements in the promoters of PLATZ family members in diverse plant species [38,39,40].
Furthermore, fifteen tomato miRNAs implicated in the development and stress tolerance of tomato (namely, sly-miR159, sly-miR162, sly-miR171a, sly-miR319a, sly-miR319b, sly-miR319c-3p, sly-miR396a-5p, sly-miR396b, sly-miR403-5p, sly-miR482a, sly-miR5303, sly-miR6024, sly-miR9469-3p, sly-miR9472-3p, and sly-miR9478-3p) targeted to cleave twelve SlPLATZ genes [50,51,52,53,54,55,56,57,58,59], hinting at the miRNA-mediated regulation of SlPLATZ transcription factors in the development and stress adaptation of tomato (Table S5). For example, sly-miR396a-5p and sly-miR396b are involved in drought stress response in tomato [53,54]. The presence of their target site in SlPLATZ19 suggests they might regulate SlPLATZ19 in the drought acclimation of tomato. Interestingly, SlPLATZ11, SlPLATZ13, and SlPLATZ17 were predicted to be the targets of multiple miRNAs. These findings suggested that multiple miRNAs may regulate the expression of a single SlPLATZ gene in the stress adaptation of tomato.
To further explore the molecular structure and functions of SlPLATZ proteins, a 3D structure prediction was conducted (Figure 5). The comparative modeling of SlPLATZ proteins predicted their binding affinities with diverse ligands, including nucleic acids and peptide molecules. Furthermore, gene ontology (GO) annotations for the obtained SlPLATZ models suggested their putative functions in a variety of biological processes, including cellular defense response, transcriptional regulation, and protein metabolic processes (Table S10). This result suggested their crucial biological roles in tomato, including functioning as transcription factors.
Differential expression of genes in various tissues provides valuable clues about their functional diversity and possible roles in developmental processes. The tissue-specific expression and differential expression patterns of tomato PLATZ gene family members in different organs suggested their functional diversity in the development of tomato (Figure 6). This result is consistent with the tissue-specific expression and varied expression in various organs of PLATZ genes in other plant species [36,39].
The mRNA transcripts of SlPLATZ5, SlPLATZ14, and SlPLATZ20 were undetectable in any organ examined, suggesting that they could be pseudogenes in the tomato genome or might be expressed only at certain critical developmental stages. In addition to providing mechanical strength to the aerial parts of plants, the stem mediates the long-distance movement of water and minerals to facilitate plant growth under both favorable and unfavorable conditions. The predominant expression of SlPLATZ12 in stems hinted at its putative function in the development of stems and the abiotic stress adaptation of tomato. Flowering and floral development, regulated by numerous floral genes and various environmental factors, are prerequisites for fruit set and important for crop yield [60]. The flower-specific expression of SlPLATZ17 indicated its potential function in the development of flower organs in tomato. Besides SlPLATZ17, the transcript levels of SlPLATZ11 and SlPLATZ19 were the most abundant in flowers, revealing their likely function in the development of flowers (Figure 6).
SlPLATZ10 is a fruit-specific gene that was expressed preferentially in 1 cm fruits but not in any other organs. This finding suggested that it may have a specific function in the initial developmental phase in tomato. SlPLATZ1 showed the highest expression in 1 cm fruit, but its expression gradually declined at later fruit developmental phases, highlighting its putative function in different developmental stages of tomato fruit, especially in the cell division stage of tomato (Figure 6).
Plant responses and adaptation to a wide range of abiotic stimuli are closely linked to differential gene expression mediated by a complex network of multiple transcription factors and a variety of stress-related genes via an ABA-dependent or ABA-independent pathway [42,61,62]. The functions of PLATZ transcription factors in plant abiotic stress tolerance and their responses to various stress and hormone treatments have been well documented [14,32,40]. Here we showed that tomato SlPLATZ genes (i.e., SlPLATZ1, SlPLATZ11, SlPLATZ12, and SlPLATZ19) were also responsive to different abiotic stress treatments (Figure 7A–E), suggesting their functional role in abiotic stress responses of tomato. Drought stress triggered significant alterations in the expression levels of SlPLATZ1, SlPLATZ12, and SlPLATZ19. The transcripts of SlPLATZ1 and SlPLATZ19 were markedly induced at most or all stages of drought treatment, respectively, whereas the expression of SlPLATZ12 was considerably suppressed at all time points following exposure to drought (Figure 7A). Our finding on the responses of SlPLATZ genes to drought stress is well correlated with a previous report in which the overexpression of PLATZ genes from bamboo and Arabidopsis was observed to promote drought tolerance in the transgenic Arabidopsis lines with respect to the wild-type plants [23,24,25], and another report in which the expression of PLATZ-TF7 (Zm00001d051511) was induced in drought-tolerant maize plants under drought treatment [31].
On exposure to salinity stress, SlPLATZ genes (SlPLATZ1, SlPLATZ11, SlPLATZ12, and SlPLATZ19) displayed remarkable changes in their transcription levels (Figure 7B). The expression of SlPLATZ12 and SlPLATZ19 was up- or down-regulated under salt treatment, whereas that of SlPLATZ11 and SlPLATZ19 decreased (2- to 3-fold over the control) in the early phase and late phase of the saline stress period, respectively. These responses of SlPLATZ genes under salt treatment revealed their probable involvement in the salt stress adaptation of tomato. This result is consistent with a previous report wherein GhPLATZ1-overexpressing transgenic Arabidopsis plants showed robust resistance to osmotic and salt stress [28].
In response to low temperature, the expression of SlPLATZ genes was significantly up- or down-regulated. The transcription levels of SlPLATZ11 and SlPLATZ12 were sharply elevated throughout the cold stress period. Conversely, SlPLATZ1 and SlPLATZ19 were significantly downregulated following cold exposure (Figure 7C). These findings highlighted the fact that tomato PLATZ genes may also play a role in the adaptation of tomato to low-temperature stress. Our finding is supported by recent work reporting that the expression of most PhePLATZ genes is induced in response to cold treatment [32].
High-temperature stress also remarkably altered the expression profiles of SlPLATZ genes (Figure 7D). SlPLATZ1, SlPLATZ11, and SlPLATZ12 exhibited similar responses to heat stress, with significantly downregulated transcript levels at the early stages of heat treatment, followed by sharply upregulated expression levels at the later stages. SlPLATZ19 was markedly downregulated in multiple phases of the stress period, indicating the putative functions of SlPLATZ genes in the heat stress response of tomato. This result is corroborated by a previous study reporting the upregulation of the PLATZ gene (Ca01g07220) in the heat-tolerant pepper cultivar compared with the sensitive cultivar [30].
The regulation of various stress-associated genes by the stress hormone ABA has been extensively investigated in order to enhance plant adaptation to unfavorable environmental stresses, including drought, salt, cold, and heat stress [63,64,65]. SlPLATZ1 showed remarkable responses to ABA treatment, while the expression of SlPLATZ19 was not significantly altered and that of SlPLATZ11 and SlPLATZ12 was responsive only at one time point following exposure to ABA treatment (Figure 7E). This finding implies that SlPLATZ1 may have a possible function in the abiotic stress adaptation of tomato through an ABA-dependent pathway, whereas the function of the other genes (SlPLATZ11, SlPLATZ12, and SlPLATZ19) is unlikely to be related to ABA.
To further explore the functions of SlPLATZ proteins, their subcellular localization was empirically observed under a confocal microscope after the transient expression of the SlPLATZ–GFP fusion proteins in the rice protoplast. The nuclear-specific localization of SlPLATZ12 suggested its specific role in transcriptional regulation as a transcription factor. The localization of SlPLATZ11 and SlPLATZ19 in both the nucleus and the cytoplasm spotlighted the possibility that they might shuttle between the cytoplasm and the nucleus to play a regulatory role in various cellular signaling pathways in addition to their role in gene regulation as transcription factors. Our finding is consistent with the previous studies that reported the localization of PLATZ proteins in the nucleus or the nucleus and cytoplasm [26,39].
To gain a better understanding of the putative functions of SlPLATZ genes, the gene co-expression network analysis of SlPLATZs was performed using the RNA-seq data. The co-expressed genes identified in the networks of SlPLATZ17, SlPLATZ18, and SlPLATZ19 were implicated in various biological pathways, including stress adaptation in tomato, underlying their biological importance in tomato (Figure 8 and Figure 9, Tables S11 and S12). Expression profiling via qRT−PCR analysis revealed that SlPLATZ19 was responsive to various abiotic stresses. This finding was corroborated by the presence of numerous stress-associated genes, such as SlSHMT2 (Solyc02g091560.3), SnRK1 (Solyc02g067030), SlGS2 (Solyc01g080280), AHL5 (Solyc08g008030), SlZF-31 (Solyc08g063040), Glutaredoxin (Solyc08g062970), a RING Finger gene (Solyc08g081370), and a NAC gene, in the gene co-expression network of SlPLATZ19 [66,67,68,69,70,71,72,73].
In addition, multiple stress-related genes, including SlGS2 (Solyc01g080280), SnRK1 (Solyc02g067030), and Chaperonin 21 (Solyc12g009250), were co-expressed with SlPLATZ18 [68,70,74]. The hub gene SlPLATZ17 also constituted a co-expression network with several stress-responsive genes in tomato, namely SlAPRR5 (Solyc03g081240), SlTLP6 (Solyc04g071750), SlGRAS4 (Solyc01g100200), SlPLDβ1 (Solyc08g080130), SlPP2C48 (Solyc06g076100), a gene encoding nucleolar protein 6 (Solyc02g085230), a GRAS transcription factor (Solyc07g063940), a major latex-like protein (Solyc08g023660), and a leucine-rich repeat receptor-like serine/threonine-protein kinase (Solyc11g017270) [75,76,77,78,79,80,81,82,83]. These results suggested that SlPLATZ genes may have important functions in abiotic stress tolerance in tomato.

4. Materials and Methods

4.1. Identification and Sequence Analysis of PLATZ Genes in the Tomato Genome

We downloaded Arabidopsis thaliana PLATZ protein sequences from TAIR https://www.Arabidopsis.org/ (accessed on 31 March 2022) and the HMM profile of SlPLATZ (PF04640) from the Pfam database http://pfam.xfam.org/ (accessed on 31 March 2022). Then, we performed basic local alignment search tool (BLAST) searches with default parameters of the Sol genomics database using AtPLATZ protein sequences and the HMM profile of SlPLATZ (PF04640) as queries. The resulting 20 non-redundant SlPLATZ protein sequences were validated using the SMART web tool http://smart.emblheidelberg.de/ (accessed on 1 April 2022), the NCBI CDD search https://www.ncbi.nlm.nih.gov/Structure/bwrpsb/bwrpsb.cgi (accessed on 1 April 2022), and the Pfam database to reconfirm the existence of the PLATZ domain. The protein length, molecular weight, GRAVY values (grand average of hydropathicity index), and isoelectric points of the identified SlPLATZ proteins were investigated using the Expasy server http://cn.expasy.org/tools/protparam.html (accessed on 4 April 2022). The Open Reading Frame Finder tool https://www.ncbi.nlm.nih.gov/orffinder/ (accessed on 4 April 2022) was employed to determine the open reading frames of the SlPLATZ genes. Clustal Omega and ESPript web tools were used for multiple-protein sequence alignment [84,85]. The Multiple EM for Motif Elicitation (MEME) web server http://meme-suite.org/ (accessed on 18 April 2022) was employed to analyze the conserved motifs in the full-length protein sequences from Arabidopsis, tomato, and rice. The analysis conditions were set as follows: a maximum number of 10 motifs and a motif length between 6 and 50 amino acids. The exon–intron structure of SlPLATZ genes was investigated using the Gene Structure Display Server (GSDS) http://gsds.cbi.pku.edu.cn/ (accessed on 7 April 2022). The web tool “WoLF-PSORT” https://wolfpsort.hgc.jp/ (accessed on 6 May 2022) was used to predict the subcellular localization of the identified SlPLATZ proteins.

4.2. Phylogenetic Analysis of Tomato PLATZ Proteins

The full-length PLATZ protein sequences from 10 plant species were aligned using ClustalW, which was followed by phylogenetic analysis using the neighbor-joining (NJ) method with 1000 bootstrap replications in MEGA 6.0 [86]. The deduced PLATZ protein sequences of Chalamdomonas renhadi, Physcomitrium patens, Amborella trichopoda, tomato, potato, Arabidopsis, and Sorghum bicolor were retrieved from the Phytozome database http://www.phytozome.net (accessed on 31 March 2022), while those of rice, maize, and Brassica rapa were obtained from the literature [38]. The gene names and accession numbers used in the phylogenetic tree are shown in Table S1.

4.3. Chromosomal Locations, Gene Duplication, and Microsynteny Analysis

The chromosomal locations of SlPLATZ genes were investigated using the Sol genomic database and then visualized with TBtools. Gene duplications among SlPLATZ genes were analyzed with the one-step MCScanX program of TBtools software [87] and examined by BLASTP with an E-value < 10−10. The synonymous (Ks) and non-synonymous (Ka) nucleotide substitution rates of duplicated SlPLATZ gene pairs were investigated using the method of Nei and Gojobori [88]. The mode of selection was determined by the analyzed Ka/Ks ratio [89]. The divergence time (T) of the predicted duplicated gene pairs was estimated using the formula T = Ks/2r MYA (millions of years ago). Ks is the synonymous substitution rate per site, and r is considered the constant for dicotyledonous plants of 1.5 × 10⁻⁸ substitutions per site per year [90]. The microsynteny analysis of PLATZ genes across tomato, Arabidopsis, and rice was conducted using a reciprocal BLAST search approach against the entire genomes of these species. The duplicated gene pairs were visualized using TBtools software [87].

4.4. Prediction of Cis-Acting Elements and miRNA Target Sites

The psRNATarget online tool http://plantgrn.noble.org/psRNATarget/analysis (accessed on 16 July 2022) was employed to predict the putative miRNA sequences in tomato PLATZ genes. The putative cis-regulatory elements located within 1500 bp upstream from the transcription start point of SlPLATZ genes were analyzed using the PlantCare database http://bioinformatics.psb.ugent.be/webtools/plantcare/html/ (accessed on 11 April 2022).

4.5. Homology Modeling of SlPLATZ Proteins

The protein sequences of SlPLATZ1-20 were used as input to perform the 3D structure prediction through the I-TASSER server. The 3D models of tomato PLATZ proteins were generated from multiple threading alignments with LOMETS and iterative TASSER assembly simulations [91]. The template analogs were identified, and the best-modeled structures were selected based on the maximum scores. The generated 3D models were refined using ModRefiner [92]. The final modeled 3D structures and ligand-binding sites of SlPLATZ proteins were visualized with Discovery Studio v.21.1. The putative functions of modeled PLATZ proteins were predicted via the I-TASSER server according to global and local similarity to template proteins curated in the PDB with known structures and functions.

4.6. Plant Sample Collection and Stress Treatments

Tomato seeds (Solanum lycopersicum L. cv. Ailsa Craig) were germinated in commercial horticultural soil for seedlings and maintained in a growth chamber controlled at 25 °C day/20 °C night, a 16-h light/8-h dark photoperiod, a relative humidity of 55–70%, and a light intensity of 300 μmol m−2 s−1 until they developed into 28-day-old seedlings. Following the collection of fresh roots, stems, and leaves from 28-day-old plants for organ-specific expression analysis, the remaining plants were moved to a greenhouse adjusted at 25/20 °C day/night temperatures until they reached the reproductive stage for the harvesting of flower and fruit samples. For the expression profiling at different fruit developmental stages, the following samples were collected: (i) young fruits approximately 7 days after pollination and 1 cm in diameter (1 cm fruits), (ii) immature fruits approximately 21 days after pollination (IM fruits), (iii) mature green fruits approximately 35 days after pollination (MG fruits), (iv) fruits at the breaker stage when the green color of mature fruits alters to light yellow-orange (B fruits), and (v) fruits 5 days after the breaker stage (B5 fruits) [49].
Leaf samples from 28-day-old tomato seedlings treated with various abiotic stress stimuli (salt (NaCl), drought, heat, cold, and abscisic acid (ABA)) were collected to analyze the expression patterns of SlPLATZ genes in response to different abiotic stress conditions. The transcript levels of SlPLATZ genes were monitored at 0, 1, 3, 9, and 24 h after treatment with heat, cold, salt (NaCl), and abscisic acid (ABA), and at 0, 24, 48, 60, and 72 h after drought treatment. Drought stress was imposed on the tomato plants by withholding water for 72 h [93]. ABA treatment was applied to the plants by spraying leaves with 100 μM ABA [94]. To impose heat and cold stress, the tomato seedlings were incubated in a growth chamber adjusted at 40 °C and 4 °C, respectively. Salt stress was induced by immersing roots in a nutrient solution with 200 mM NaCl, and the plants in the nutrient solution without salt were used as the 0 h control. Tomato seedlings grown in soil under normal conditions (25 °C) served as the 0 h controls for heat, cold, drought, and ABA treatment [95]. All plant samples were collected from three biological replicates, immediately frozen in liquid nitrogen, and stored at −80 °C for further use.

4.7. Expression Profiling of SlPLATZ Genes by qRT−PCR

Total RNA was extracted from all samples using an RNeasy Mini kit (Qiagen, Hilden, Germany) and purified with an RNase-free DNase I kit (Qiagen, Hilden, Germany) following the manufacturer’s instructions. The quality and quantity of extracted RNA were measured using a NanoDrop® 1000 spectrophotometer (Wilmington, DE, USA). A Superscript® III First-Strand cDNA synthesis kit (Invitrogen, Carlsbad, CA, USA) was used to synthesize cDNA from 1μg of total RNA in accordance with the manufacturer’s protocols. The gene-specific primers for SlPLATZ genes were designed using Primer3 software http://frodo.wi.mit.edu/primer3/input.htm (accessed on 25 April 2022) (Table S2), and a melting curve analysis was conducted to validate the specificity of each primer set [95]. The 18S rRNA (F: AAAAGGTCGACGCGGGCT, R: CGACAGAAGGGACGAGAC) from tomato was used as a control gene for normalization [96]. qRT-PCR analysis was conducted in a total volume 10 μL reaction mixture comprising 1 μL (50 ng) cDNA, 2 μL forward and reverse primers of 5 pmol concentration, 5 μL of iTaq SYBR Green (Qiagen, Hilden, Germany), and 2 μL double distilled water. A LightCycler® 96SW 1.1 (Roche, Germany) was used for amplification and determination of the Cq value of the samples with the following PCR parameters: pre-denaturation at 94 °C for 5 min, followed by 40 cycles at 94 °C for 15 s, annealing at 60 °C for 20 s, and extension at 72 °C for 30 s. The 2−∆∆Ct method was employed to analyze the relative expression of each gene against each treatment [97].

4.8. Co-Expression Network Analysis of SlPLATZ Genes

Raw RNA-Seq data used for the gene co-expression network analysis were downloaded from the NCBI SRA database (Table S3). The quality assessment on raw sequence reads was performed using the FastQC toolkit [98]. The raw reads were cleaned by removing low-quality reads and adapter contamination. HISAT2 2.1.0 was used to map the cleaned reads against the tomato reference genome ITAG4.0 [99]. The number of reads that mapped on exons was analyzed with FeatureCounts 1.6.2 [100]. The expression was analyzed as the fragment per kb per million reads (FPKM) by using DESeq2 software [101]; removeBatchEffect processing was carried out to remove the batch effect in R [102]. For the construction of the co-expression network of SlPLATZ genes, weighted gene co-expression network analysis (WGCNA) was conducted using those genes with an FPKM greater than 1 in R [103]. The co-expression networks were constructed using Cytoscape https://cytoscape.org/ (accessed on 29 June 2022). We used the top co-expressed genes from the network figures for GO and KEGG analysis, which was accomplished using the KOBAS web tool http://kobas.cbi.pku.edu.cn/ (accessed on 11 July 2022).

4.9. Subcellular Localization

The coding regions of SlPLATZ genes were amplified with gene-specific primers (Table S13) and then cloned in the pGA3452 vector driven by the maize Ubi1 promoter to generate SlPATZ –GFP fusion proteins [104]. A vector that expresses an NLS-mRFP fusion protein served as a nuclear marker. The SlPLATZ–GFP fusion construct and the NLS-mRFP construct were introduced into rice Oc cell protoplasts using the electroporation method [105]. After incubation overnight at 28 °C in the dark for 12 to 16 h, the resulting transformants were examined for the detection of fluorescent signals under a confocal fluorescence microscope (BX61; Olympus, Tokyo, Japan) using bright field illumination, the GFP channel, and the RFP channel.

4.10. Statistical Analysis

The data were analyzed using two-tailed Student’s t-tests in SigmaPlot 14 (SYSTAT and MYSTAT Products, United States and Canada). Asterisks (*, **, and ***) were used to denote the statistical significance at p-value <0.05, <0.01, and <0.001, respectively.

5. Conclusions

We identified 20 non-redundant SlPLATZ genes, most of which harbored two conserved regions essential for zinc-dependent DNA binding, in the tomato genome. Gene duplication analysis spotlighted the fact that both segmental and tandem gene duplication events are accountable for the expansion of the PLATZ gene family in tomato over the course of evolution. The potential functions of SlPLATZ genes in the abiotic stress acclimation of tomato were highlighted by expression profiling that revealed the responses of SlPLATZ1, SlPLATZ11, SlPLATZ12, and SlPLATZ19 to diverse abiotic stresses and gene co-expression network analysis that uncovered the co-expression of several stress-related genes in the networks of SlPLATZ11, SlPLATZ17, and SlPLATZ19. The tissue-specific expression of SlPLATZ10 and SlPLATZ17, and the varied expression levels of SlPLATZ1, SlPLATZ11, SlPLATZ12, and SlPLATZ19 in diverse organs suggested their different functional roles in the development of tomato. The predominant localization of selected SlPLATZ–GFP fusion proteins in the nucleus revealed their putative function as transcription factors. Our results provide valuable information for the further functional elucidation of potential PLATZ transcription factors implicated in the development and abiotic stress tolerance of tomato.

Supplementary Materials

The following supporting information can be downloaded at: https://www.mdpi.com/article/10.3390/plants11223112/s1, The following is attached as supplementary material related to this article: Figure S1. Schematic depiction of the exon–intron distribution of the PLATZ genes in tomato. Figure S2. Schematic representation of 10 conserved motifs identified in the PLATZ proteins from tomato, Arabidopsis, and rice. Figure S3. Overview of conserved motifs of PLATZ proteins from tomato, Arabidopsis, and rice investigated by the MEME web tool. Figure S4. Chromosomal distribution of the SlPLATZ gene family. Figure S5. Schematic diagram of the segmentally duplicated SlPLATZ gene pairs identified in tomato. Figure S6. Prediction of hormone and stress related cis-regulatory elements in the promoter regions of SlPLATZ genes. Figure S7. Homology in the cDNA sequences of SlPLATZ genes. Table S1. List of cis-regulatory elements predicted in the promoters of tomato PLATZ genes. Table S2. miRNA sequence characteristics of PLATZ genes in tomato. Table S3. Parameters used in 3D modeling of SlPLATZ proteins. Table S4. Model validation data for the predicted structures of SlPLATZ proteins. Table S5. Elements of secondary structure predicted in SlPLATZ proteins. Table S6. Predicted ligands and ligand-binding residues in SlPLATZ proteins. Table S7. Gene ontology (GO) annotation for SlPLATZ proteins. Table S8. Significantly enriched KEGG pathways for SlPLATZ co-expressed genes. Table S9. Annotated KEGG pathways and gene ontology of SlPLATZ co-expressed genes. Table S10. List of the PLATZ protein sequences used to construct the phylogenetic tree. Table S11. The primer sequences used in qRT−PCR analysis of the SlPLATZ genes. Table S12. Information of samples used to analyze RNA-seq data. Table S13. The primer sequences used in subcellular localization analysis.

Author Contributions

M.-Y.C., D.-j.L., C.-K.K. and J.-S.J. supervised and designed the experiments. A.H.W. and L.-H.C. carried out the experiments. A.H.W., M.M.R. and M.W. performed the bioinformatic analysis. A.H.W. and A.H.N. conducted the data analysis. A.H.W. wrote the manuscript. A.H.W. revised the manuscript. All authors reviewed and approved the article. All authors have read and agreed to the published version of the manuscript.

Funding

This study was supported by the National Research Foundation of Korea (NRF) Grant funded by the Korean government (MSIT) (no. NRF2018R1A2B6001781).

Institutional Review Board Statement

Not applicable.

Informed Consent Statement

Not applicable.

Data Availability Statement

Not applicable.

Conflicts of Interest

The authors declare that they have no known competing financial interests or personal relationships that could have appeared to influence the work reported in this paper.

Abbreviations

PLATZ, plant AT-rich sequence and zinc-binding; CDS, coding sequence; MW, molecular weight; Pi, isoelectric point; GRAVY, grand average of hydropathicity; Ka, nonsynonymous; Ks, synonymous; HMM, hidden Markov model; MCScanX, Multiple Collinearity Scan toolkit; 3D, three-dimensional; ABA, abscisic acid; WGCNA, weighted gene co-expression network analysis; qRT−PCR, quantitative real-time PCR.

References

  1. Brkljacic, J.; Grotewold, E. Combinatorial control of plant gene expression. Biochim. Biophys. Acta Gene Regul. Mech. 2017, 1860, 31–40. [Google Scholar] [CrossRef] [PubMed] [Green Version]
  2. Riechmann, J.L.; Heard, J.; Martin, G.; Reuber, L.; Jiang, C.Z.; Keddie, J.; Adam, L.; Pineda, O.; Ratcliffe, O.J.; Samaha, R.R.; et al. Arabidopsis transcription factors: Genome-wide comparative analysis among eukaryotes. Science 2000, 290, 2105–2110. [Google Scholar] [CrossRef] [PubMed]
  3. Eulgem, T.; Rushton, P.J.; Robatzek, S.; Somssich, I.E. The WRKY superfamily of plant transcription factors. Trends Plant Sci. 2000, 5, 199–206. [Google Scholar] [CrossRef]
  4. Kizis, D.; Lumbreras, V.; Pagès, M. Role of AP2/EREBP transcription factors in gene regulation during abiotic stress. FEBS Lett. 2001, 498, 187–189. [Google Scholar] [CrossRef] [Green Version]
  5. Olsen, A.N.; Ernst, H.A.; Leggio, L.L.; Skriver, K. NAC transcription factors: Structurally distinct, functionally diverse. Trends Plant Sci. 2005, 10, 79–87. [Google Scholar] [CrossRef]
  6. Naeem, M.; Shahzad, K.; Saqib, S.; Shahzad, A.; Younas, M.; Afridi, M.I. The Solanum melongena COP1LIKE manipulates fruit ripening and flowering time in tomato (Solanum lycopersicum). Plant Growth Regul. 2022, 96, 369–382. [Google Scholar] [CrossRef]
  7. Nagano, Y.; Furuhashi, H.; Inaba, T.; Sasaki, Y. A novel class of plant-specific zinc-dependent DNA-binding protein that binds to a/T-rich DNA sequences. Nucleic Acids Res. 2001, 29, 4097–4105. [Google Scholar] [CrossRef] [Green Version]
  8. Griffiths, S.; Dunford, R.P.; Coupland, G.; Laurie, D.A. The evolution of CONSTANS-like gene families in barley, rice, and Arabidopsis. Plant Physiol. 2003, 131, 1855–1867. [Google Scholar] [CrossRef] [Green Version]
  9. Teakle, G.R.; Manfield, I.W.; Graham, J.F.; Gilmartin, P.M. Arabidopsis thaliana GATA factors: Organisation, expression and DNA-binding characteristics. Plant Mol. Biol. 2002, 50, 43–57. [Google Scholar] [CrossRef]
  10. Noguero, M.; Atif, R.M.; Ochatt, S.; Thompson, R.D. The role of the DNA-binding One Zinc Finger (DOF) transcription factor family in plants. Plant Sci. 2013, 209, 32–45. [Google Scholar] [CrossRef]
  11. Schwabe, J.W.; Klug, A. Zinc mining for protein domains. Nat. Struct. Biol. 1994, 1, 345–349. [Google Scholar] [CrossRef]
  12. Zhang, J.; Liu, J.F.; Zhao, T.T.; Ren, J.; Xu, X.Y. Research progress of plant C2H2 zinc finger protein. Mol. Plant Breed. 2018, 29, 1133–1141. [Google Scholar]
  13. Ciftci-Yilmaz, S.; Mittler, R. The zinc finger network of plants. Cell. Mol. Life Sci. 2008, 65, 1150–1160. [Google Scholar] [CrossRef]
  14. He, X.; Liu, M.; Fang, Z.; Ma, D.; Zhou, Y.; Yin, J. Genome-wide Analysis of a Plant AT-rich Sequence and Zinc-binding Protein (PLATZ) in Triticum Aestivum. Phyton 2021, 90, 971. [Google Scholar] [CrossRef]
  15. Wang, A.; Hou, Q.; Si, L.; Huang, X.; Luo, J.; Lu, D.; Zhu, J.; Shangguan, Y.; Miao, J.; Xie, Y.; et al. The PLATZ transcription factor GL6 affects grain length and number in rice. Plant Physiol. 2019, 180, 2077–2090. [Google Scholar] [CrossRef] [PubMed] [Green Version]
  16. Zhou, S.R.; Xue, H.W. The rice PLATZ protein SHORT GRAIN6 determines grain size by regulating spikelet hull cell division. J. Integr. Plant Biol. 2020, 62, 847–864. [Google Scholar] [CrossRef]
  17. Li, Q.; Wang, J.; Ye, J.; Zheng, X.; Xiang, X.; Li, C.; Fu, M.; Wang, Q.; Zhang, Z.; Wu, Y. The maize imprinted gene Floury3 encodes a PLATZ protein required for tRNA and 5S rRNA transcription through interaction with RNA polymerase III. Plant Cell 2017, 29, 2661–2675. [Google Scholar] [CrossRef] [Green Version]
  18. Li, H.; Wang, Y.; Xiao, Q.; Luo, L.; Zhang, C.; Mao, C.; Du, J.; Long, T.; Cao, Y.; Yi, Q.; et al. Transcription factor ZmPLATZ2 positively regulate the starch synthesis in maize. Plant Growth Regul. 2021, 93, 291–302. [Google Scholar] [CrossRef]
  19. Chao, Q.; Gao, Z.F.; Zhang, D.; Zhao, B.G.; Dong, F.Q.; Fu, C.X.; Liu, L.J.; Wang, B.C. The developmental dynamics of the Populus stem transcriptome. Plant Biotechnol. J. 2019, 17, 206–219. [Google Scholar] [CrossRef] [Green Version]
  20. Kim, J.H.; Kim, J.; Jun, S.E.; Park, S.; Timilsina, R.; Kwon, D.S.; Kim, Y.; Park, S.J.; Hwang, J.Y.; Nam, H.G.; et al. ORESARA15, a PLATZ transcription factor, mediates leaf growth and senescence in Arabidopsis. New Phytol. 2018, 220, 609–623. [Google Scholar] [CrossRef] [Green Version]
  21. Dong, T.; Yin, X.; Wang, H.; Lu, P.; Liu, X.; Gong, C.; Wu, Y. ABA-INDUCED expression 1 is involved in ABA-inhibited primary root elongation via modulating ROS homeostasis in Arabidopsis. Plant Sci. 2021, 304, 110821. [Google Scholar] [CrossRef] [PubMed]
  22. Timilsina, R.; Kim, Y.; Park, S.; Park, H.; Park, S.J.; Kim, J.H.; Park, J.H.; Kim, D.; Park, Y.I.; Hwang, D.; et al. ORESARA 15, a PLATZ transcription factor, controls root meristem size through auxin and cytokinin signalling-related pathways. J. Exp. Bot. 2022, 73, 2511–2524. [Google Scholar] [CrossRef] [PubMed]
  23. González-Morales, S.I.; Chávez-Montes, R.A.; Hayano-Kanashiro, C.; Alejo-Jacuinde, G.; Rico-Cambron, T.Y.; de Folter, S.; Herrera-Estrella, L. Regulatory network analysis reveals novel regulators of seed desiccation tolerance in Arabidopsis thaliana. Proc. Natl. Acad. Sci. USA 2016, 113, E5232–E5241. [Google Scholar] [CrossRef] [PubMed] [Green Version]
  24. Zhang, K.; Lan, Y.; Wu, M.; Wang, L.; Liu, H.; Xiang, Y. PhePLATZ1, a PLATZ transcription factor in moso bamboo (Phyllostachys edulis), improves drought resistance of transgenic Arabidopsis thaliana. Plant Physiol. Biochem. 2022, 186, 121–134. [Google Scholar] [CrossRef]
  25. Liu, M.; Wang, C.; Ji, Z.; Zhang, L.; Li, C.; Huang, J.; Yang, G.; Yan, K.; Zhang, S.; Zheng, C.; et al. Regulation of drought tolerance in Arabidopsis involves PLATZ4-mediated transcriptional suppression of PIP2. bioRxiv. 2021. [Google Scholar] [CrossRef]
  26. Zhao, J.; Zheng, L.; Wei, J.; Wang, Y.; Chen, J.; Zhou, Y.; Chen, M.; Wang, F.; Ma, Y.; Xu, Z.S. The soybean PLATZ transcription factor GmPLATZ17 suppresses drought tolerance by interfering with stress-associated gene regulation of GmDREB5. Crop J. 2022, 10, 1014–1025. [Google Scholar] [CrossRef]
  27. Liu, S.; Yang, R.; Liu, M.; Zhang, S.; Yan, K.; Yang, G.; Huang, J.; Zheng, C.; Wu, C. PLATZ2 negatively regulates salt tolerance in Arabidopsis seedlings by directly suppressing the expression of the CBL4/SOS3 and CBL10/SCaBP8 genes. J. Exp. Bot. 2020, 71, 5589–5602. [Google Scholar] [CrossRef]
  28. Zhang, S.; Yang, R.; Huo, Y.; Liu, S.; Yang, G.; Huang, J.; Zheng, C.; Wu, C. Expression of cotton PLATZ1 in transgenic Arabidopsis reduces sensitivity to osmotic and salt stress for germination and seedling establishment associated with modification of the abscisic acid, gibberellin, and ethylene signalling pathways. BMC Plant Biol. 2018, 18, 218. [Google Scholar] [CrossRef] [Green Version]
  29. So, H.A.; Choi, S.J.; Chung, E.; Lee, J.H. Molecular characterization of stress-inducible PLATZ gene from soybean (Glycine max L.). Plant Omics 2015, 8, 479–484. [Google Scholar]
  30. Li, T.; Xu, X.; Li, Y.; Wang, H.; Li, Z.; Li, Z. Comparative transcriptome analysis reveals differential transcription in heat-susceptible and heat-tolerant pepper (Capsicum annum L.) cultivars under heat stress. J. Plant Biol. 2015, 58, 411–424. [Google Scholar] [CrossRef]
  31. Zenda, T.; Liu, S.; Wang, X.; Liu, G.; Jin, H.; Dong, A.; Yang, Y.; Duan, H. Key maize drought-responsive genes and pathways revealed by comparative transcriptome and physiological analyses of contrasting inbred lines. Int. J. Mol. Sci. 2019, 20, 1268. [Google Scholar] [CrossRef] [PubMed] [Green Version]
  32. Zhang, K.; Lan, Y.; Shi, Y.; Gao, Y.; Wu, M.; Xu, Y.; Xiang, Y. Systematic analysis and functional characterization of the PLATZ transcription factors in Moso bamboo (Phyllostachys edulis). J. Plant Growth Regul. 2022, 130, 431–444. [Google Scholar] [CrossRef]
  33. Costa, J.M.; Heuvelink, E. The Global Tomato Industry. In Tomatoes; CABI Publishing: Wallingford, UK, 2018; pp. 276–313. ISBN 9781780641942. [Google Scholar]
  34. Kimura, S.; Sinha, N. Tomato (Solanum Lycopersicum): A model fruit-bearing crop. Cold Spring Harb. Protoc. 2008, 3, pdb-emo105. [Google Scholar] [CrossRef] [PubMed]
  35. Safder, I.; Shao, G.; Sheng, Z.; Hu, P.; Tang, S. Genome-wide identification studies–A primer to explore new genes in plant species. Plant Biol. 2022, 24, 9–22. [Google Scholar] [CrossRef] [PubMed]
  36. Wang, J.; Ji, C.; Li, Q.; Zhou, Y.; Wu, Y. Genome-wide analysis of the plant-specific PLATZ proteins in maize and identification of their general role in interaction with RNA polymerase III complex. BMC Plant Biol. 2018, 18, 221. [Google Scholar] [CrossRef] [PubMed]
  37. Han, X.; Rong, H.; Tian, Y.; Qu, Y.; Xu, M.; Xu, L.A. Genome-Wide Identification of PLATZ Transcription Factors in Ginkgo biloba L. and Their Expression Characteristics During Seed Development. Front. Plant Sci. 2022, 13, 946194. [Google Scholar] [CrossRef] [PubMed]
  38. Azim, J.B.; Khan, M.F.H.; Hassan, L.; Robin, A.H.K. Genome-wide characterization and expression profiling of plant-specific PLATZ transcription factor family genes in Brassica rapa L. Plant Breed. Biotechnol. 2020, 8, 28–45. [Google Scholar] [CrossRef]
  39. Fu, Y.; Cheng, M.; Li, M.; Guo, X.; Wu, Y.; Wang, J. Identification and characterization of PLATZ transcription factors in wheat. Int. J. Mol. Sci. 2020, 21, 8934. [Google Scholar] [CrossRef]
  40. Li, J.; Feng, S.; Zhang, Y.; Xu, L.; Luo, Y.; Yuan, Y.; Yang, Q.; Feng, B. Genome-wide identification and expression analysis of the plant-specific PLATZ gene family in Tartary buckwheat (Fagopyrum tataricum). BMC Plant Biol. 2022, 22, 160. [Google Scholar] [CrossRef]
  41. Wai, A.H.; Naing, A.H.; Lee, D.J.; Kim, C.K.; Chung, M.Y. Molecular genetic approaches for enhancing stress tolerance and fruit quality of tomato. Plant Biotechnol. Rep. 2020, 14, 515–537. [Google Scholar] [CrossRef]
  42. Hernández, Y.; Sanan-Mishra, N. miRNA mediated regulation of NAC transcription factors in plant development and environment stress response. Plant Gene 2017, 11, 190–198. [Google Scholar] [CrossRef]
  43. Merchant, S.S.; Prochnik, S.E.; Vallon, O.; Harris, E.H.; Karpowicz, S.J.; Witman, G.B.; Terry, A.; Salamov, A.; Fritz-Laylin, L.K.; Maréchal-Drouard, L.; et al. The Chlamydomonas genome reveals the evolution of key animal and plant functions. Science 2007, 318, 245–250. [Google Scholar] [CrossRef] [PubMed]
  44. Wolfe, K.H.; Gouy, M.; Yang, Y.W.; Sharp, P.M.; Li, W.H. Date of the monocot-dicot divergence estimated from chloroplast DNA sequence data. Proc. Natl. Acad. Sci. USA 1989, 86, 6201–6205. [Google Scholar] [CrossRef] [PubMed] [Green Version]
  45. Cannon, S.B.; Mitra, A.; Baumgarten, A.; Young, N.D.; May, G. The roles of segmental and tandem gene duplication in the evolution of large gene families in Arabidopsis thaliana. BMC Plant Biol. 2004, 4, 10. [Google Scholar] [CrossRef] [PubMed] [Green Version]
  46. Li, Z.; Jiang, H.; Zhou, L.; Deng, L.; Lin, Y.; Peng, X.; Yan, H.; Cheng, B. Molecular evolution of the HD-ZIP I gene family in legume genomes. Gene 2014, 533, 218–228. [Google Scholar] [CrossRef] [PubMed]
  47. Priest, H.D.; Filichkin, S.A.; Mockler, T.C. Cis-regulatory elements in plant cell signaling. Curr. Opin. Plant Biol. 2009, 12, 643–649. [Google Scholar] [CrossRef]
  48. Biłas, R.; Szafran, K.; Hnatuszko-Konka, K.; Kononowicz, A.K. Cis-regulatory elements used to control gene expression in plants. Plant Cell Tissue Organ Cult. 2016, 127, 269–287. [Google Scholar] [CrossRef] [Green Version]
  49. Wai, A.H.; Waseem, M.; Khan, A.M.M.; Nath, U.K.; Lee, D.J.; Kim, S.T.; Kim, C.K.; Chung, M.Y. Genome-wide identification and expression profiling of the PDI gene family reveals their probable involvement in abiotic stress tolerance in tomato (Solanum lycopersicum L.). Genes 2021, 12, 23. [Google Scholar] [CrossRef]
  50. Zhang, B. MicroRNA: A new target for improving plant tolerance to abiotic stress. J. Exp. Bot. 2015, 66, 1749–1761. [Google Scholar] [CrossRef]
  51. Cheng, H.Y.; Wang, Y.; Tao, X.; Fan, Y.F.; Dai, Y.; Yang, H.; Ma, X.R. Genomic profiling of exogenous abscisic acid-responsive microRNAs in tomato (Solanum lycopersicum). BMC Genom. 2016, 17, 423. [Google Scholar] [CrossRef] [Green Version]
  52. Chen, L.; Meng, J.; Zhai, J.; Xu, P.; Luan, Y. MicroRNA396a-5p and-3p induce tomato disease susceptibility by suppressing target genes and upregulating salicylic acid. Plant Sci. 2017, 265, 177–187. [Google Scholar] [CrossRef] [PubMed]
  53. Liu, M.; Yu, H.; Zhao, G.; Huang, Q.; Lu, Y.; Ouyang, B. Profiling of drought-responsive microRNA and mRNA in tomato using high-throughput sequencing. BMC Genom. 2017, 18, 481. [Google Scholar] [CrossRef] [PubMed]
  54. Eom, S.H.; Lee, H.J.; Lee, J.H.; Wi, S.H.; Kim, S.K.; Hyun, T.K. Identification and Functional Prediction of Drought-Responsive Long Non-Coding RNA in Tomato. Agronomy 2019, 9, 629. [Google Scholar] [CrossRef] [Green Version]
  55. Liu, M.; Yu, H.; Zhao, G.; Huang, Q.; Lu, Y.; Ouyang, B. Identification of drought-responsive microRNAs in tomato using high-throughput sequencing. Funct. Integr. Genom. 2018, 18, 67–78. [Google Scholar] [CrossRef] [PubMed]
  56. Tripathi, A.; Goswami, K.; Tiwari, M.; Mukherjee, S.K.; Sanan-Mishra, N. Identification and comparative analysis of microRNAs from tomato varieties showing contrasting response to ToLCV infections. Physiol. Mol. Biol. Plants 2018, 24, 185–202. [Google Scholar] [CrossRef] [PubMed]
  57. López-Galiano, M.J.; Sentandreu, V.; Martínez-Ramírez, A.C.; Rausell, C.; Real, M.D.; Camañes, G.; Ruiz-Rivero, O.; Crespo-Salvador, O.; García-Robles, I. Identification of stress associated microRNAs in Solanum lycopersicum by high-throughput sequencing. Genes 2019, 10, 475. [Google Scholar] [CrossRef] [PubMed] [Green Version]
  58. Shi, X.P.; Jiang, F.L.; Wen, J.Q.; Cui, S.Y.; Zhou, Y.Z.; Wu, Z. MicroRNA319 family members play an important role in Solanum habrochaites and S. lycopersicum responses to chilling and heat stresses. Biol. Plant 2019, 63, 200–209. [Google Scholar] [CrossRef]
  59. Zhou, X.; Cui, J.; Meng, J.; Luan, Y. Interactions and links among the noncoding RNAs in plants under stresses. Theor. Appl. Genet. 2020, 133, 3235–3248. [Google Scholar] [CrossRef]
  60. Koutinas, N.; Pepelyankov, G.; Lichev, V. Flower induction and flower bud development in apple and sweet cherry. Biotechnol. Biotechnol. Equip. 2010, 24, 1549–1558. [Google Scholar] [CrossRef]
  61. Qin, F.; Shinozaki, K.; Yamaguchi-Shinozaki, K. Achievements and challenges in understanding plant abiotic stress responses and tolerance. Plant Cell Physiol. 2011, 52, 1569–1582. [Google Scholar] [CrossRef] [Green Version]
  62. Banerjee, A.; Roychoudhury, A. Abscisic-acid-dependent basic leucine zipper (bZIP) transcription factors in plant abiotic stress. Protoplasma 2017, 254, 3–16. [Google Scholar] [CrossRef] [PubMed]
  63. Huang, Y.C.; Niu, C.Y.; Yang, C.R.; Jinn, T.L. The heat stress factor HSFA6b connects ABA signaling and ABA-mediated heat responses. Plant Physiol. 2016, 172, 1182–1199. [Google Scholar] [CrossRef] [PubMed]
  64. Suzuki, N.; Bassil, E.; Hamilton, J.S.; Inupakutika, M.A.; Zandalinas, S.I.; Tripathy, D.; Luo, Y.; Dion, E.; Fukui, G.; Kumazaki, A.; et al. ABA is required for plant acclimation to a combination of salt and heat stress. PLoS ONE 2016, 11, e147625. [Google Scholar] [CrossRef] [PubMed] [Green Version]
  65. Luo, D.L.; Ba, L.J.; Shan, W.; Kuang, J.F.; Lu, W.J.; Chen, J.Y. Involvement of WRKY transcription factors in abscisic-acid-induced cold tolerance of banana fruit. J. Agric. Food Chem. 2017, 65, 3627–3635. [Google Scholar] [CrossRef]
  66. Al-Abdallat, A.M.; Ali-Sheikh-Omar, M.A.; Alnemer, L.M. Overexpression of two ATNAC3-related genes improves drought and salt tolerance in tomato (Solanum lycopersicum L.). Plant Cell Tissue Organ Cult. 2015, 120, 989–1001. [Google Scholar] [CrossRef]
  67. Yang, Y.X.; Wang, M.M.; Yin, Y.L.; Onac, E.; Zhou, G.F.; Peng, S.; Xia, X.J.; Shi, K.; Yu, J.Q.; Zhou, Y.H. RNA-seq analysis reveals the role of red light in resistance against Pseudomonas syringae pv. tomato DC3000 in tomato plants. BMC Genom. 2015, 16, 120. [Google Scholar] [CrossRef] [Green Version]
  68. Liu, L.; Wang, J.; Han, Z.; Sun, X.; Li, H.; Zhang, J.; Lu, Y. Molecular analyses of tomato GS, GOGAT and GDH gene families and their response to abiotic stresses. Acta Physiol. Plant. 2016, 38, 1–14. [Google Scholar] [CrossRef]
  69. Howden, A.J.; Stam, R.; Martinez Heredia, V.; Motion, G.B.; Ten Have, S.; Hodge, K.; Marques Monteiro Amaro, T.M.; Huitema, E. Quantitative analysis of the tomato nuclear proteome during Phytophthora capsici infection unveils regulators of immunity. New Phytol. 2017, 215, 309–322. [Google Scholar] [CrossRef] [Green Version]
  70. Yu, C.; Song, L.; Song, J.; Ouyang, B.; Guo, L.; Shang, L.; Wang, T.; Li, H.; Zhang, J.; Ye, Z. ShCIGT, a Trihelix family gene, mediates cold and drought tolerance by interacting with SnRK1 in tomato. Plant Sci. 2018, 270, 140–149. [Google Scholar] [CrossRef]
  71. Yang, L.; Miao, M.; Lyu, H.; Cao, X.; Li, J.; Li, Y.; Li, Z.; Chang, W. Genome-wide identification, evolution, and expression analysis of RING finger gene family in Solanum lycopersicum. Int. J. Mol Sci. 2019, 20, 4864. [Google Scholar] [CrossRef] [Green Version]
  72. Pei, T.; Bao, Y.; Wu, T.; Wang, Z.; Wang, Y.; Liu, Q.; Yang, H.; Jiang, J.; Zhang, H.; Li, J.; et al. Silencing of the SlZF-31 gene decreases the salt stress tolerance and drought tolerance of tomato. Plant Cell Tissue Organ Cult. 2021, 146, 191–201. [Google Scholar] [CrossRef]
  73. Liu, Z.; Pan, X.; Wang, C.; Yun, F.; Huang, D.; Yao, Y.; Gao, R.; Ye, F.; Liu, X.; Liao, W. Genome-wide identification and expression analysis of serine hydroxymethyl transferase (SHMT) gene family in tomato (Solanum lycopersicum). PeerJ 2022, 10, e12943. [Google Scholar] [CrossRef] [PubMed]
  74. Nveawiah-Yoho, P. Mechanisms for Salt Tolerance and Susceptibility in Tomato. Ph.D. Thesis, Tennessee State University, Nashville, TN, USA, 2012. [Google Scholar]
  75. Okekeogbu, I.; Ye, Z.; Sangireddy, S.R.; Li, H.; Bhatti, S.; Hui, D.; Zhou, S.; Howe, K.J.; Fish, T.; Yang, Y.; et al. Effect of aluminum treatment on proteomes of radicles of seeds derived from Al-treated tomato plants. Proteomes 2014, 2, 169–190. [Google Scholar] [CrossRef] [PubMed]
  76. Niu, Y.; Zhao, T.; Xu, X.; Li, J. Genome-wide identification and characterization of GRAS transcription factors in tomato (Solanum lycopersicum). PeerJ 2017, 5, e3955. [Google Scholar] [CrossRef] [PubMed] [Green Version]
  77. Li, S.; Zhang, J.; Liu, L.; Wang, Z.; Li, Y.; Guo, L.; Li, Y.; Zhang, X.; Ren, S.; Zhao, B.; et al. SlTLFP8 reduces water loss to improve water-use efficiency by modulating cell size and stomatal density via endoreduplication. Plant Cell Environ. 2020, 43, 2666–2679. [Google Scholar] [CrossRef]
  78. Liu, Y.; Shi, Y.; Zhu, N.; Zhong, S.; Bouzayen, M.; Li, Z. SlGRAS4 mediates a novel regulatory pathway promoting chilling tolerance in tomato. Plant Biotechnol. J. 2020, 18, 1620–1633. [Google Scholar] [CrossRef]
  79. Basim, H.; Basim, E.; Tombuloglu, H.; Unver, T. Comparative transcriptome analysis of resistant and cultivated tomato lines in response to Clavibacter michiganensis subsp. michiganensis. Genomics 2021, 113, 2455–2467. [Google Scholar] [CrossRef]
  80. Mu, X.; Zhang, L.; Wang, H.; Cao, S.; Yao, J.; Li, T.; Xia, X. Growth and transcriptome analysis of tomato under seawater stress. S. Afr. J. Bot. 2021, 137, 463–474. [Google Scholar] [CrossRef]
  81. Pereyra-Bistraín, L.I.; Ovando-Vázquez, C.; Rougon-Cardoso, A.; Alpuche-Solís, Á.G. Comparative RNA-Seq Analysis Reveals Potentially Resistance-Related Genes in Response to Bacterial Canker of Tomato. Genes 2021, 12, 1745. [Google Scholar] [CrossRef]
  82. Qiu, J.; Ni, L.; Xia, X.; Chen, S.; Zhang, Y.; Lang, M.; Li, M.; Liu, B.; Pan, Y.; Li, J.; et al. Genome-Wide Analysis of the Protein Phosphatase 2C Genes in Tomato. Genes 2022, 13, 604. [Google Scholar] [CrossRef]
  83. Song, C.; Wu, M.; Zhou, Y.; Gong, Z.; Yu, W.; Zhang, Y.; Yang, Z. NAC-mediated membrane lipid remodeling negatively regulates fruit cold tolerance. Hortic. Res. 2022, 9, uhac039. [Google Scholar] [CrossRef] [PubMed]
  84. Sievers, F.; Wilm, A.; Dineen, D.; Gibson, T.J.; Karplus, K.; Li, W.; Lopez, R.; McWilliam, H.; Remmert, M.; Söding, J.; et al. Fast, scalable generation of high-quality protein multiple sequence alignments using Clustal Omega. Mol. Syst. Biol. 2011, 7, 539. [Google Scholar] [CrossRef] [PubMed]
  85. Robert, X.; Gouet, P. Deciphering key features in protein structures with the new ENDscript server. Nucl. Acids Res. 2014, 42, 320–324. [Google Scholar] [CrossRef] [PubMed] [Green Version]
  86. Tamura, K.; Stecher, G.; Peterson, D.; Filipski, A.; Kumar, S. MEGA6: Molecular evolutionary genetics analysis version 6.0. Mol. Biol. Evol. 2013, 30, 2725–2729. [Google Scholar] [CrossRef] [Green Version]
  87. Chen, C.; Chen, H.; Zhang, Y.; Thomas, H.R.; Frank, M.H.; He, Y.; Xia, R. TBtools: An integrative toolkit developed for interactive analyses of big biological data. Mol. Plant 2020, 13, 1194–1202. [Google Scholar] [CrossRef]
  88. Nei, M.; Gojobori, T. Simple methods for estimating the numbers of synonymous and nonsynonymous nucleotide substitutions. Mol. Biol. Evol. 1986, 3, 418–426. [Google Scholar]
  89. Nekrutenko, A.; Makova, K.D.; Li, W.H. The KA/KS ratio test for assessing the protein-coding potential of genomic regions: An empirical and simulation study. Genome Res. 2002, 12, 198–202. [Google Scholar] [CrossRef] [Green Version]
  90. Koch, M.A.; Haubold, B.; Mitchell-Olds, T. Comparative evolutionary analysis of chalcone synthase and alcohol dehydrogenase loci in Arabidopsis, Arabis, and related genera (Brassicaceae). Mol. Biol. Evol. 2000, 17, 1483–1498. [Google Scholar]
  91. Yang, J.; Yan, R.; Roy, A.; Xu, D.; Poisson, J.; Zhang, Y. The I-TASSER Suite: Protein structure and function prediction. Nat. Methods 2015, 12, 7–8. [Google Scholar] [CrossRef] [Green Version]
  92. Xu, D.; Zhang, Y. Improving the physical realism and structural accuracy of protein models by a two-step atomic-level energy minimization. Biophys. J. 2011, 101, 2525–2534. [Google Scholar] [CrossRef] [Green Version]
  93. Ayaz, A.; Huang, H.; Zheng, M.; Zaman, W.; Li, D.; Saqib, S.; Zhao, H.; Lü, S. Molecular Cloning and Functional Analysis of GmLACS2-3 Reveals Its Involvement in Cutin and Suberin Biosynthesis along with Abiotic Stress Tolerance. Int. J. Mol. Sci. 2021, 22, 9175. [Google Scholar] [CrossRef] [PubMed]
  94. Wai, A.H.; Waseem, M.; Cho, L.H.; Kim, S.T.; Lee, D.J.; Kim, C.K.; Chung, M.Y. Comprehensive genome-wide analysis and expression pattern profiling of the SlHVA22 gene family unravels their likely involvement in the abiotic stress adaptation of tomato. Int. J. Mol. Sci. 2022, 23, 12222. [Google Scholar] [CrossRef] [PubMed]
  95. Wai, A.H.; Cho, L.H.; Peng, X.; Waseem, M.; Lee, D.J.; Lee, J.M.; Kim, C.K.; Chung, M.Y. Genome-wide identification and expression profiling of Alba gene family members in response to abiotic stress in tomato (Solanum lycopersicum L.). BMC Plant Biol. 2021, 21, 530. [Google Scholar] [CrossRef] [PubMed]
  96. Balestrini, R.; Gómez-Ariza, J.; Lanfranco, L.; Bonfante, P. Laser microdissection reveals that transcripts for five plant and one fungal phosphate transporter genes are contemporaneously present in arbusculated cells. Mol. Plant Microbe Interact. 2007, 20, 1055–1062. [Google Scholar] [CrossRef] [PubMed]
  97. Schmittgen, T.D.; Livak, K.J. Analyzing real-time PCR data by the comparative CT method. Nat. Protoc. 2008, 3, 1101–1108. [Google Scholar] [CrossRef]
  98. Andrews, S. FastQC A quality control tool for high throughput sequence data. In Babraham Bioinformatics; Babraham Institute: Cambridge, UK, 2010. [Google Scholar]
  99. Kim, D.; Paggi, J.M.; Park, C.; Bennett, C.; Salzberg, S.L. Graph-based genome alignment and genotyping with HISAT2 and HISAT-genotype. Nat. Biotechnol. 2019, 37, 907–915. [Google Scholar] [CrossRef]
  100. Liao, Y.; Smyth, G.K.; Shi, W. featureCounts: An efficient general-purpose read summarization program. Bioinformatics 2014, 30, 923–930. [Google Scholar] [CrossRef] [Green Version]
  101. Love, M.I.; Huber, W.; Anders, S. Moderated estimation of fold change and dispersion for RNA-seq data with DESeq2. Genome Biol. 2014, 15, 1–21. [Google Scholar] [CrossRef] [Green Version]
  102. Smyth, G.K. Limma: Linear Models for Microarray Data. In Bioinformatics and Computational Biology Solutions Using R and Bioconductor; Springer: New York, NY, USA, 2005; pp. 397–420. [Google Scholar]
  103. Langfelder, P.; Horvath, S. WGCNA: An R package for weighted correlation network analysis. BMC Bioinform. 2008, 9, 559. [Google Scholar] [CrossRef] [Green Version]
  104. Kim, S.R.; Lee, D.Y.; Yang, J.I.; Moon, S.; An, G. Cloning vectors for rice. J. Plant Biol. 2009, 52, 73. [Google Scholar] [CrossRef]
  105. Page, M.T.; Parry, M.A.; Carmo-Silva, E. A high-throughput transient expression system for rice. Plant Cell Environ. 2019, 42, 2057–2064. [Google Scholar] [CrossRef] [PubMed]
Figure 1. Multiple sequence alignment of all deduced tomato PLATZ polypeptides with that of Arabidopsis. The green box highlights the first conserved region [C-x2-H-x11-C-x2-C-x(4–5)-C-x2-C-x(3–5)-H-x2-H] and the blue box marks the second conserved region [C-x2-C-x(10–12)-C-x3-C], which are essential for zinc-dependent DNA binding. The yellow underline indicates the location of the PLATZ domain. The elements of the secondary structure determined using the ESPript 3.0 web server are represented by gray bars (α-helices) and blue-green arrows (β-strands) above the alignment.
Plants 11 03112 g001
Figure 2. Phylogenetic analysis of PLATZ proteins. Full-length polypeptide sequences from tomato (Solanum lycopersicum), potato (Solanum tuberosum), Arabidopsis (Arabidopsis thaliana), rice (Oryza sativa), great millet (Sorghum bicolor), maize (Zea mays), Amborella (Amborella trichopoda), moss (Physcomitrella patens), and green alga (Chlamydomonas reinhardtii) were used to construct the phylogenetic tree by the neighbor-joining method in MEGA6 software with 1000 bootstrap replicates.
Plants 11 03112 g002
Figure 3. Schematic depiction of the conserved domains of the tomato PLATZ proteins. The transmembrane domain (TM), the PLATZ domain, and the B-box-type (B_box) zinc finger domain identified in SlPLATZ proteins are displayed in yellow, green, and red boxes, respectively.
Plants 11 03112 g003
Figure 4. Schematic diagram depicting the microsyntenic relationship of PLATZ genes across Arabidopsis, tomato, and rice. The chromosomes from three plant species are illustrated with the scale in megabase pairs (Mbp) and marked in gray for Arabidopsis, yellow for rice, and aqua for tomato, respectively. Blue lines link the segmentally duplicated genes in tomato.
Plants 11 03112 g004
Figure 5. The final 3D modeled structures of SlPLATZ proteins generated using Discovery Studio v.21.1. The components of secondary structure: α-helices (red), β-sheets (cyan), coils (green), and loops (gray) and the four binding sites: site 1 (yellow sphere), site 2 (green sphere), site 3 (red sphere), and site 4 (blue sphere), are displayed in the predicted 3D structures of (AT) SlPLATZ1–SlPLATZ20.
Plants 11 03112 g005
Figure 6. qRT−PCR expression analysis of SlPLATZ genes in various organs. The organs used for the expression analysis are leaves (L), roots (R), stems (S), flowers (F), 1 cm fruits (1 cm), immature fruits (IM), mature green fruits (MG), breaker fruits (B), and fruits 5 days after breaker stage (B5). Error bars indicate the standard deviations of the means of three independent biological replicates. *, **, and *** represent the significant difference between the control samples (leaves) and the samples from the other organs according to Student’s t−test, at p−values <0.05, <0.01, and <0.001, respectively.
Plants 11 03112 g006
Figure 7. (AE) qRT−PCR analysis of SlPLATZ genes on exposure to different abiotic stresses and ABA treatment. The standard deviations of the average of three biological replicates of the qRT−PCR analysis are represented by error bars. The significant difference between the control samples (0 h) and the stress-treated samples of SlPLATZ genes is indicated by the asterisks (*, **, and ***) determined by Student’s t−test at p−values < 0.05, <0.01, and <0.001, respectively.
Plants 11 03112 g007
Figure 8. Gene co-expression network analysis of SlPLATZ genes. The co-expressed genes identified in the networks of SlPLATZ17 (A), SlPLATZ18 (B), and SlPLATZ19 (C).
Plants 11 03112 g008
Figure 9. Bubble chart of the KOBAS enrichment analysis for co-expressed genes with SlPLATZ genes. Each bubble denotes an enriched function, and the sizes of the bubble from small to large reflect the following values: [0.05, 1], [0.01, 0.05], [0.001, 0.01], [0.0001, 0.001], [1 × 10⁻¹⁰, 0.0001], [0, 1×10⁻¹⁰].
Plants 11 03112 g009
Figure 10. Subcellular localization analysis of SlPLATZ11, SlPLATZ12, and SlPLATZ19 by transiently expressing the SlPLATZs–GFP fusion constructs in Oc cell protoplasts. The NLS-mRFP construct served as a control for a nuclear protein. Scale bars = 100 μm.
Plants 11 03112 g010
Table 1. In silico analysis of PLATZ genes and their corresponding proteins in tomato.
Gene NameLocus NameORF (bp)Chromosome No. Protein Subcellular LocalizationNo. of Introns
Length (aa)PLATZ Domain
Start-End (aa)
MW (kDa)pIGRAVY
SlPLATZ1Solyc01g091000753125063–13427.768.76−0.272Nucleus3
SlPLATZ2Solyc02g033100546218180–15520.889.2−0.528Nucleus3
SlPLATZ3Solyc02g033110483216080–15518.418.69−0.628Nucleus3
SlPLATZ4Solyc02g033120462215480–15417.548.92−0.568Nucleus2
SlPLATZ5Solyc02g036120489216248–11719.198.26−0.217Cytoplasm1
SlPLATZ6Solyc02g036130414213780–13115.948.61−0.382Nucleus2
SlPLATZ7Solyc02g036140510216980–15519.298.7−0.359Nucleus2
SlPLATZ8Solyc02g036170510216980–15519.348.95−0.397Nucleus2
SlPLATZ9Solyc02g036200540217990–16520.498.86−0.335Nucleus3
SlPLATZ10Solyc02g036230546218180–15520.869.48−0.709Cytoplasm3
SlPLATZ11Solyc02g068510726224161–13227.396.64−0.445Nucleus3
SlPLATZ12Solyc04g008090642421369–14524.739.18−0.57Nucleus2
SlPLATZ13Solyc06g061240675622466–13725.349.54−0.651Nucleus2
SlPLATZ14Solyc07g007320768725560–13129.168.55−0.433Nucleus2
SlPLATZ15Solyc07g049120480715958–13318.588.89−0.61Cytoplasm2
SlPLATZ16Solyc07g049130480715958–13318.589.22−0.633Nucleus2
SlPLATZ17Solyc08g005100675822469–14025.629.37−0.498Nucleus2
SlPLATZ18Solyc08g076860687822869–14025.579.39−0.393Nucleus2
SlPLATZ19Solyc10g0858006181020562–13422.99.08−0.393Nucleus2
SlPLATZ20Solyc12g0104707411224660–13028.028.45−0.427Nucleus2
ORF, open reading frame; bp, base pair; aa, amino acid; kDa, kilo Dalton; pI, isoelectric point; MW, molecular weight; GRAVY, Grand average of hydropathicity.
Table 2. Predicted Ka/Ks ratios of the duplicated SlPLATZ gene pairs along with their divergence time.
Duplicated Gene PairKaKsKa/KsDuplication TypeTypes of SelectionTime (MYA)
SlPLATZ2 vs. SlPLATZ30.11300.21890.5162tandemPurifying selection7.30
SlPLATZ3 vs. SlPLATZ40.02790.03150.8857tandemPurifying selection1.05
SlPLATZ6 vs. SlPLATZ70.04140.04680.8855tandemPurifying selection1.56
SlPLATZ15 vs. SlPLATZ160.02180.07040.3092tandemPurifying selection2.35
SlPLATZ13 vs. SlPLATZ180.09480.79820.1188SegmentalPurifying selection26.61
SlPLATZ14 vs. SlPLATZ200.10040.84760.1184SegmentalPurifying selection28.25
SlPLATZ17 vs. SlPLATZ180.14770.94300.1567SegmentalPurifying selection31.43
Ks, the number of synonymous substitutions per synonymous site; Ka, the number of non-synonymous substitutions per nonsynonymous site; MYA, million years ago.
Publisher’s Note: MDPI stays neutral with regard to jurisdictional claims in published maps and institutional affiliations.

