1. Introduction
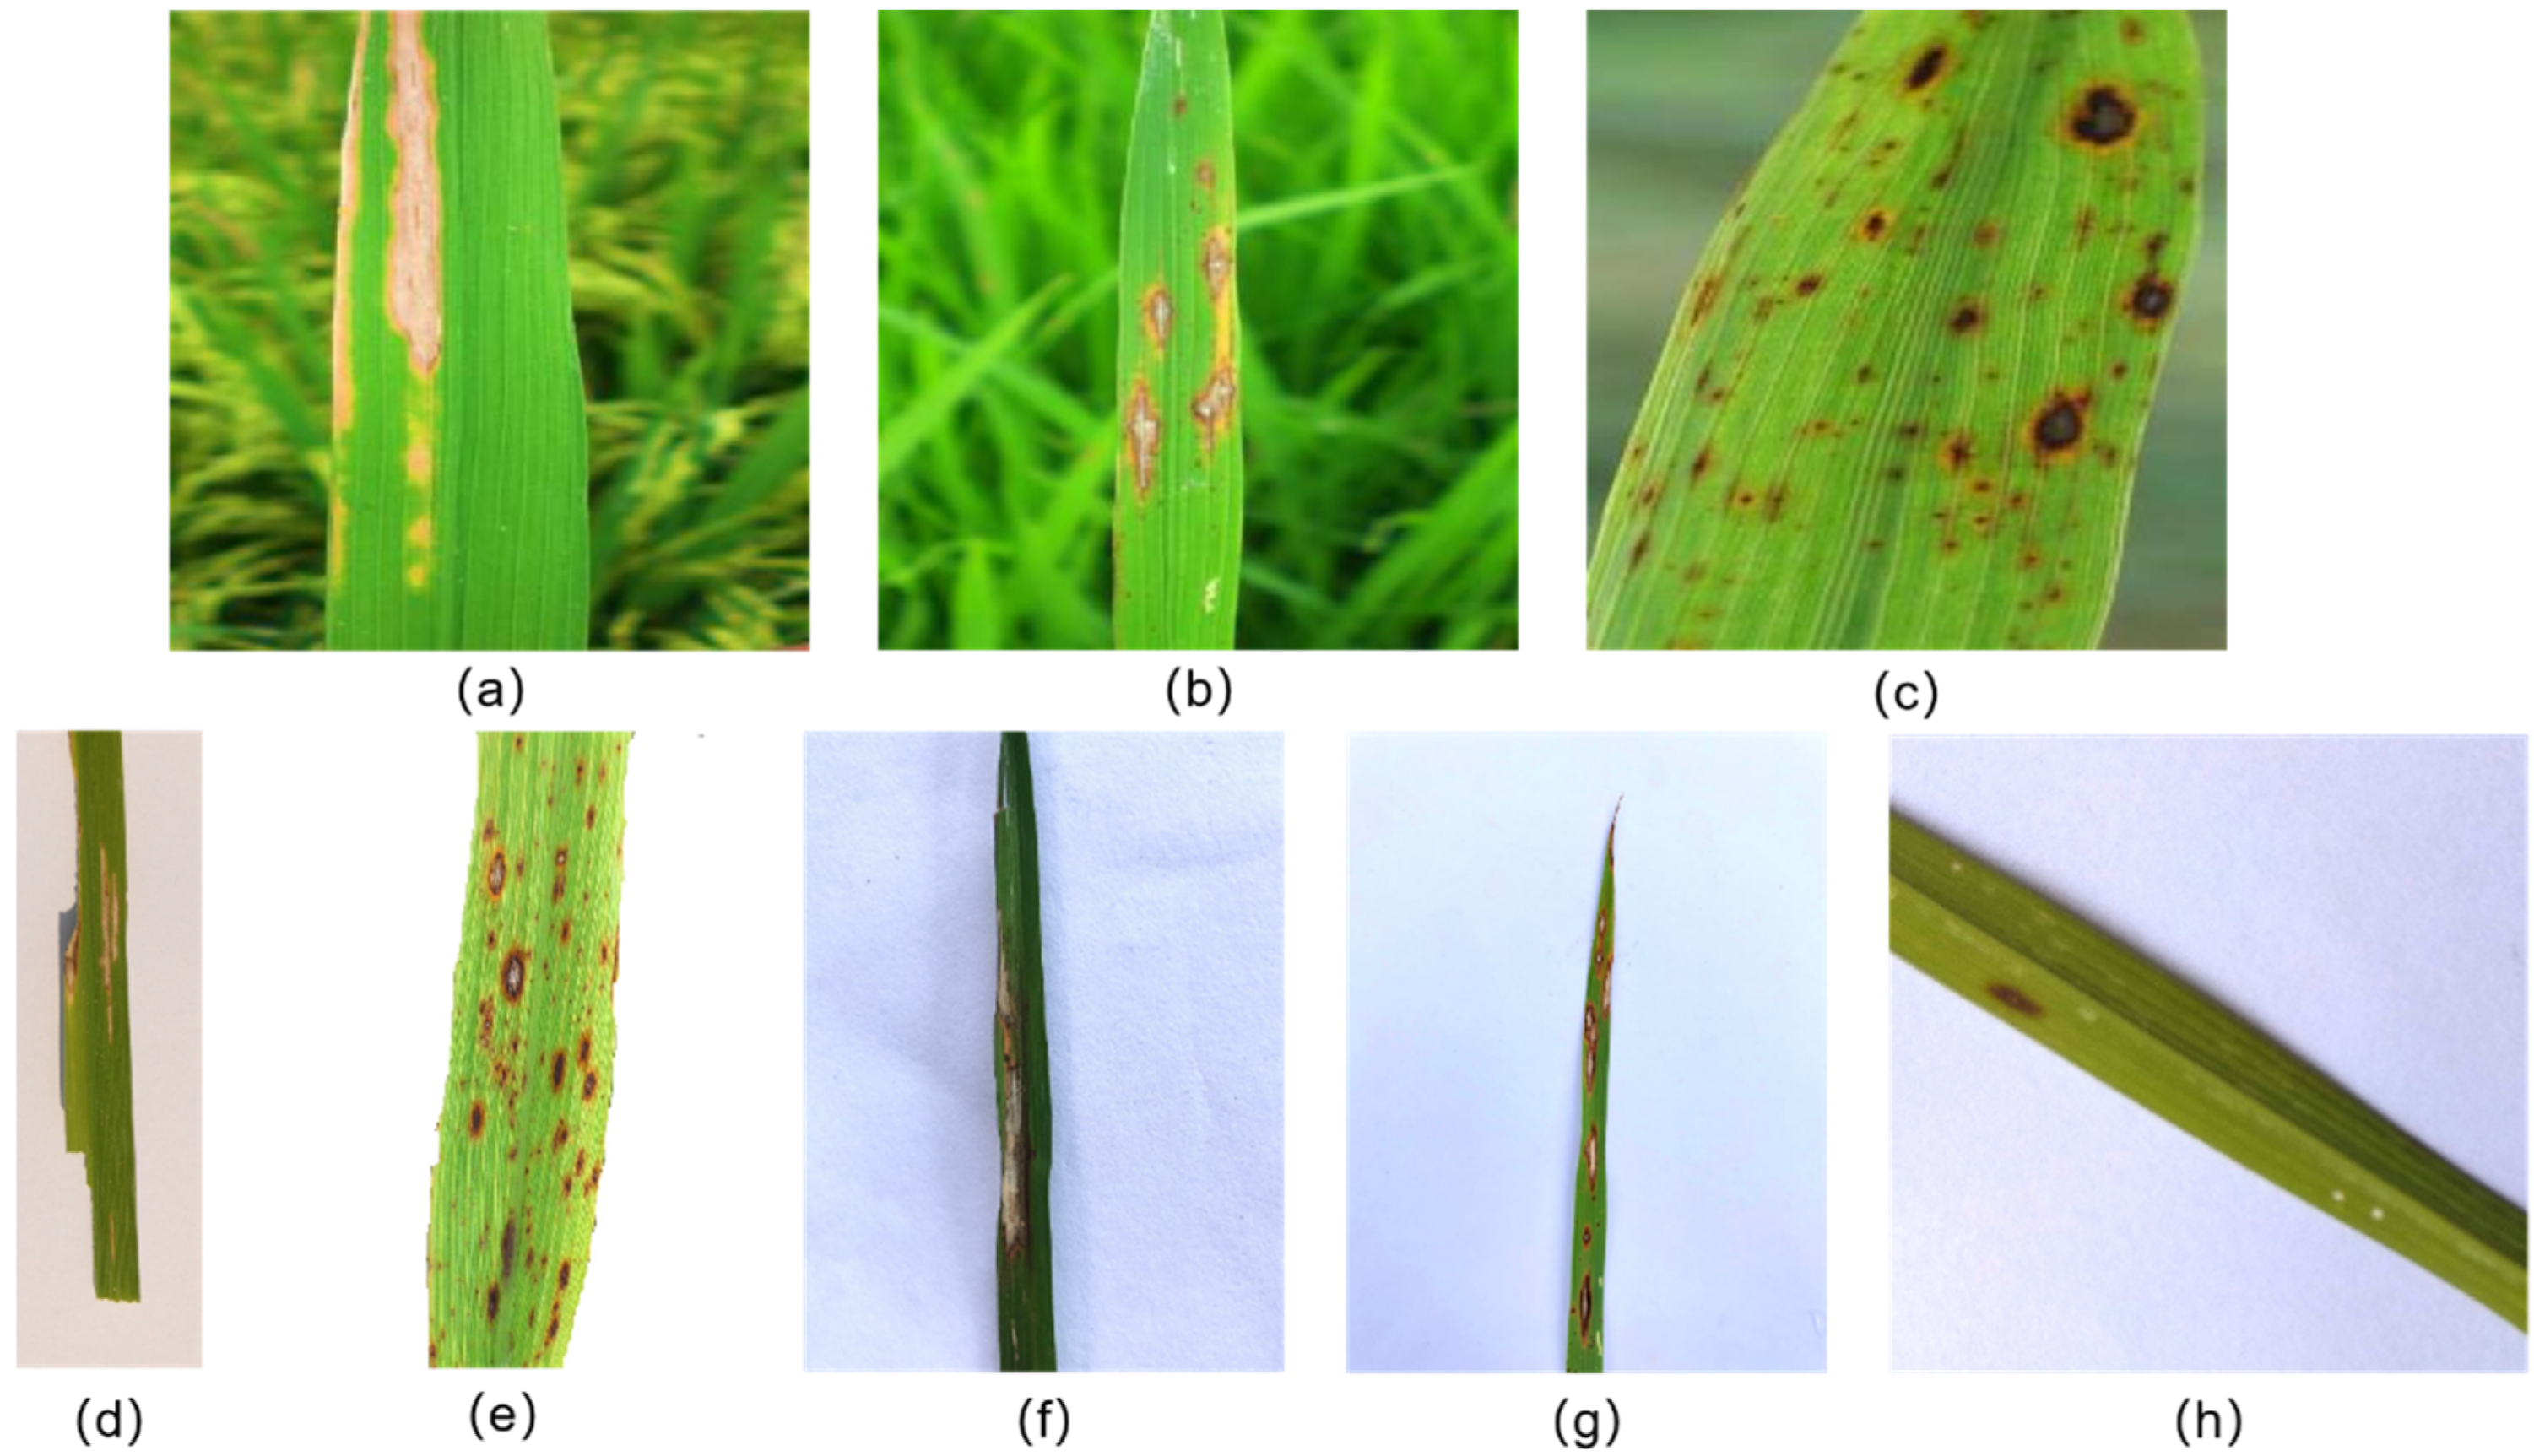
Rice diseases are one of the most complex, variable and insurmountable factors affecting the growth of rice, causing not only reductions in yield and quality but also food security problems. Some more severe diseases in rice production are bacterial blight, blast and brown spot [
1]. Due to the ambiguity, complexity and similarity of the symptoms between different diseases, and the fact that some newbie farmers are unable to accurately diagnose and grasp the occurrence and development of rice diseases [
2], quickly, efficiently and accurately detecting areas where rice diseases occur and identifying their disease types and degree of incidence to provide the necessary information for disease control has become an important issue facing rice cultivation.
Rice disease detection uses computer vision technology to detect rice disease-infested areas and their exact locations under complex natural conditions. It is a prerequisite for the accurate classification and identification of rice diseases and the assessment of disease damage levels. It is also a key to accurately locating rice disease areas and guiding plant protection equipment to target spraying. Early rice disease target detection algorithms used a sliding window strategy to select region proposals, extracted region proposal features and finally used a classifier to classify them to obtain the target area [
3]. Although this method can locate disease targets without missing them, the redundant region proposal generated can be computationally intensive. It takes more time to traverse all the disease images, resulting in poor detection performance. In addition, the feature extraction of region proposal uses manual methods such as grey-scale co-occurrence matrix [
4], textural descriptors [
5] and local binary patterns [
6], and the extracted features are more focused on the underlying features such as disease colour and shape, resulting in poor robustness of disease detection; the classifier uses support vector machines [
7], Bayesian classifiers [
8], unsupervised clustering [
9] and other machine learning algorithms for disease recognition, with slow recognition speed and low accuracy rate.
Deep learning can automatically learn features from disease image data, which has the advantages of high learning ability, high upper-performance limit, good portability and wide coverage compared with traditional machine learning, which can avoid the limitations of manual feature engineering [
10]. Datasets are the basis for building deep learning models, and the dataset’s quality determines whether the deep learning model can be trained successfully. According to the survey, several publicly available plant disease image datasets have been formed [
11]. The datasets for rice disease research are fragmented, scattered and redundant, and few datasets are publicly available. Therefore, most of the existing deep learning-based plant disease diagnosis methods use data augmentation to improve the models’ recognition, detection and segmentation accuracy. The commonly used data augmentation methods are classified into traditional, supervised and unsupervised. Bhagat et al. used traditional data enhancement methods such as geometric transformation, colour transformation and fuzzy transformation to expand crop disease image data that are simple and easy to operate, but the amount of information they add is limited [
12]. Therefore, the accuracy of the model is also limited. Hu et al. used SinGAN to generate many plant leaf disease images [
13], but the method requires additional training overhead. The copy-paste method was proposed by snapping out instances, then dithering, flipping and pasting them onto another image, where each operation had large randomness [
14]. Still, the randomness of its dithering, flipping, pasting position and number of pastes made the synthesised images challenging to understand because they did not match the actual scene.
With the rapid development of semantic segmentation models, many models have been introduced into plant disease segmentation and classification. However, it is challenging with existing models to achieve a good trade-off between accuracy and scale. Gonçalves et al. compared six pixel-level classification prediction methods and obtained relatively high accuracy with three models, FPN, UNet and DeepLabv3+ (Xception), all of which had parameter data sizes above 25 m, and SegNet, PSPNet and DeepLabv3+ (Moblienetv2) all had model parameter counts of less than 8.0 million, despite the relatively weak model generalization [
15]. However, high-accuracy and lightweight models are required for accurate plant disease segmentation and easy deployment on mobile devices. Furthermore, there are many challenges with semantic segmentation models for plant foliar disease classification and segmentation studies, with the overall difficulties centred on the complexity of the context and the characteristics of the disease itself. To overcome these challenges, some researchers have improved the model architecture for plant disease segmentation and classification and produced a richer dataset [
16,
17,
18]. Hu et al. used the UNet network model to reduce the influence of complex backgrounds on the assessment results and then used a multiconvolutional neural network model to automatically identify tea diseases in small samples [
13]. Ji et al. used a two-step approach to detect grapevine black measles disease and estimate the severity to better extract disease features, first by segmenting the leaves and disease using the DeepLabv3+ semantic segmentation model based on ResNet50 and second by developing a fuzzy rule-based system for each feature to predict the degree of damage caused by the disease [
19]. However, most of these models only target a single disease of a single crop in the same period and do not consider the impact of similarities between symptoms of different diseases of the same crop and changes in symptoms of the same disease of the same crop in different periods on the accuracy of the models; therefore, so the robustness of the trained models is poor, and their generalisability is weak.
Traditional plant disease severity estimation relies on manual experience. However, this method is inefficient and requires large labour and time expenditures, and the assessment results are often subjective and unreliable. In addition, more research has been carried out to automatically estimate plant disease severity by building direct models, i.e., by qualitative classification and the detection of plant disease images [
20,
21,
22]. However, most of these models cannot achieve refined quantitative estimates, and direct models have disadvantages such as poor interpretability and weak migration performance and require retraining the model when the evaluation criteria change [
23]. A novel method proposed for plant disease severity estimation is a semantic segmentation model to achieve the pixel-level classification of plant disease images and thus obtain the percentage of the lesion-to-leaf area required for plant disease severity estimation. Wang et al. proposed a two-stage model fusing DeepLabv3+ and UNet to segment cucumber leaves and disease spots based on the ratio of segmented disease spots to the leaf pixel area [
24] and classified disease severity based on the percentage of segmented marks in the leaf pixel area. Chen et al. proposed a new segmentation model, BLSNet, for rice bacterial streak disease and classified severity classes based on the ratio of lesion area to total leaf area [
23]. However, different plant diseases have different severity estimation criteria, and studies on the fine assessment of rice disease severity are few and limited to evaluation criteria based on area percentage, but the timely prevention and control of mid- to late-stage diseases cannot be accurately assessed with small but densely distributed disease areas.
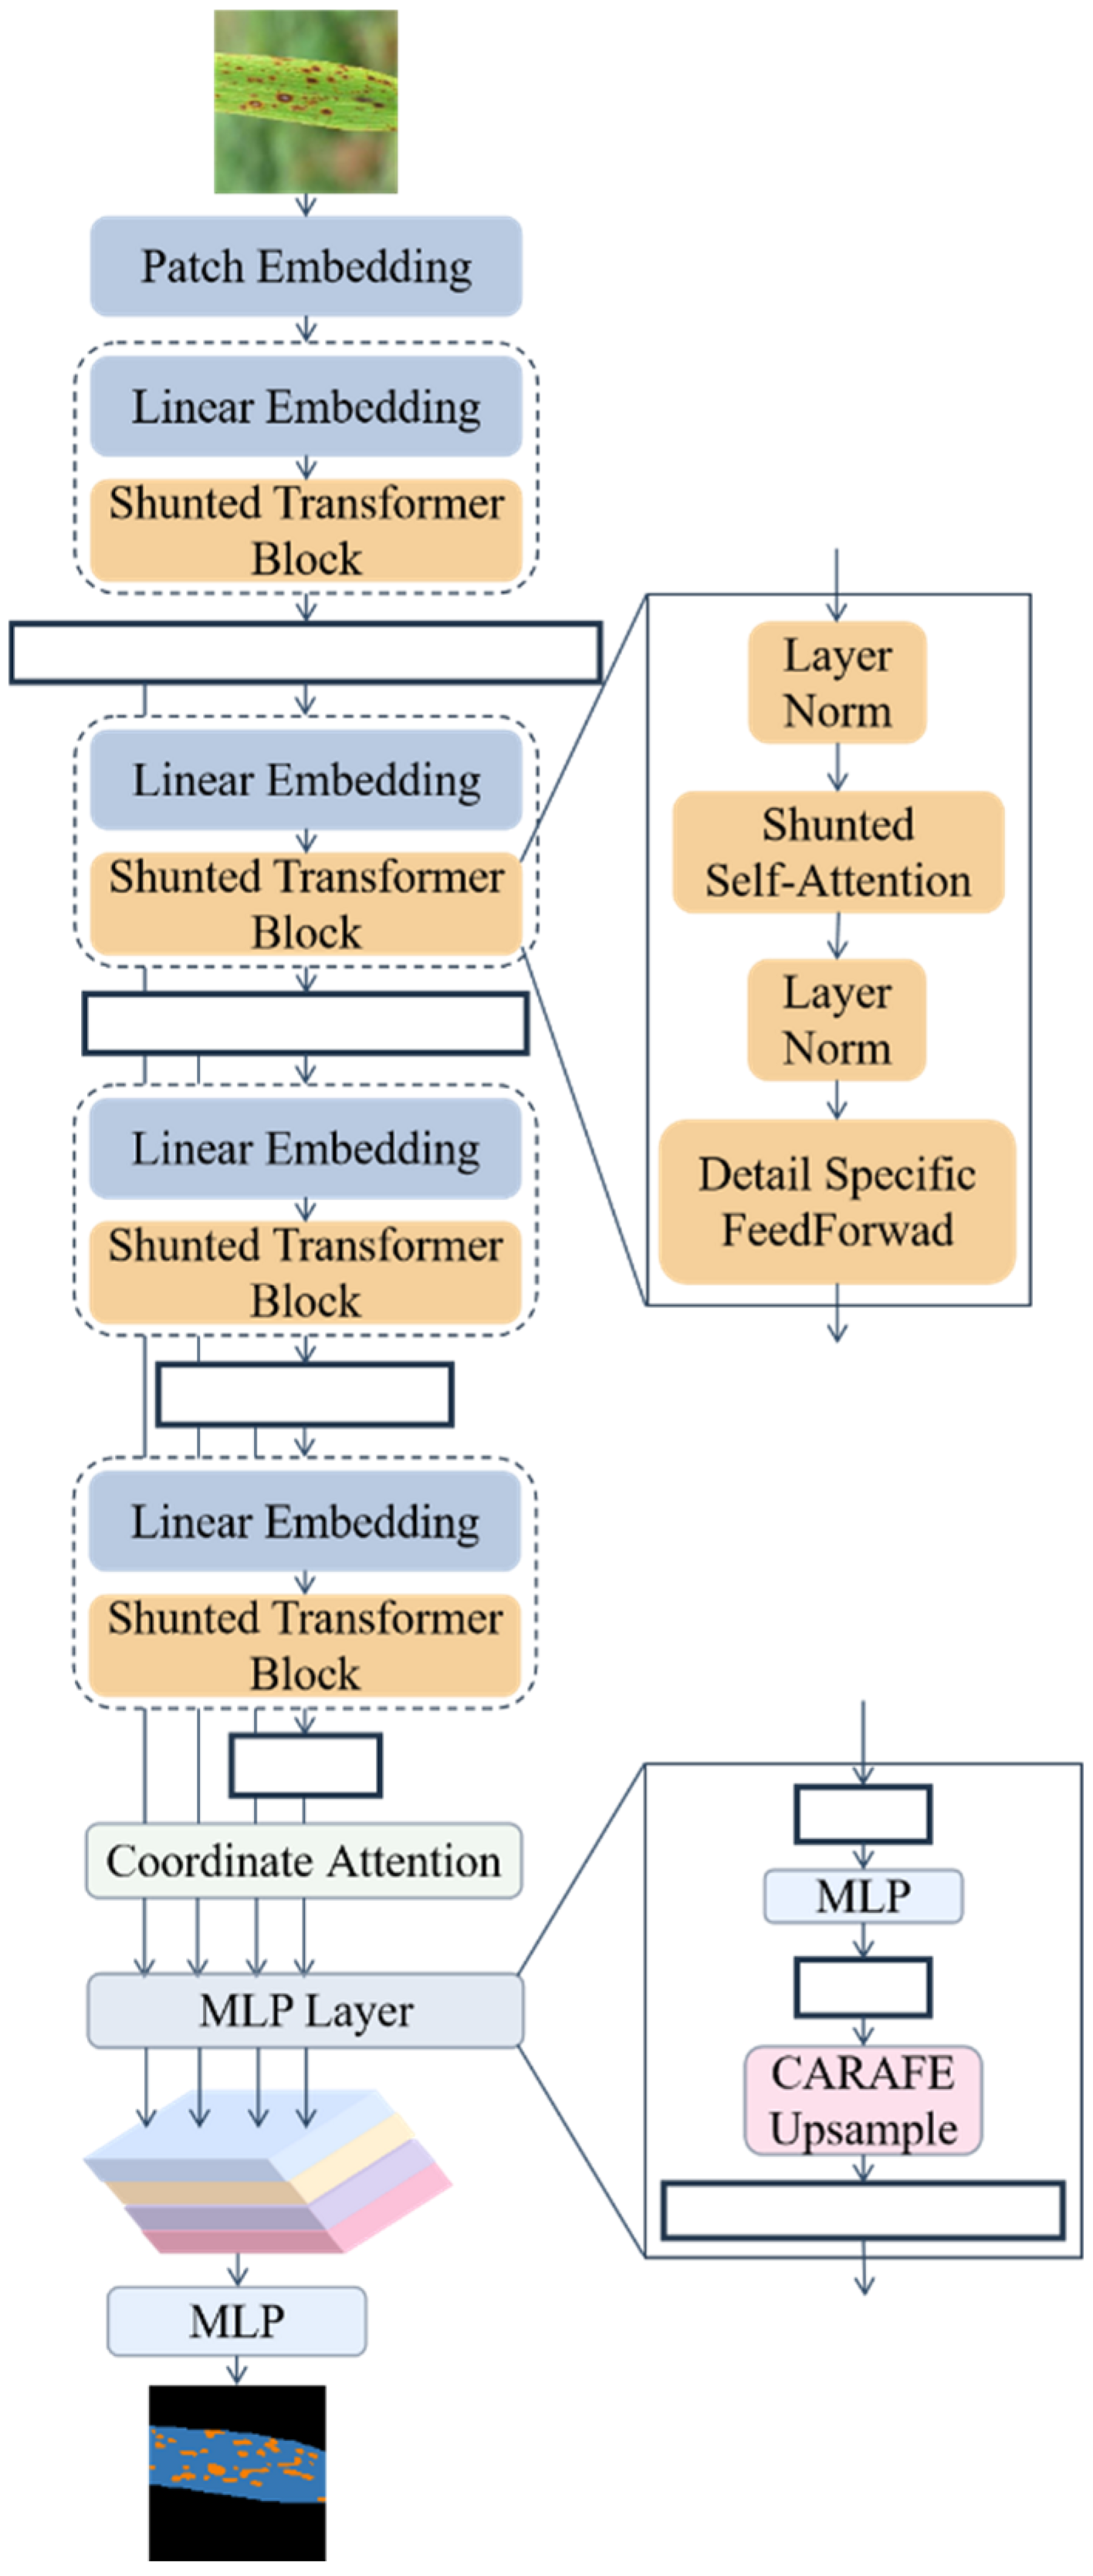
To solve the above problems, this paper proposes a new rice leaf disease identification and segmentation model, RSegformer. The main contributions of this paper are:
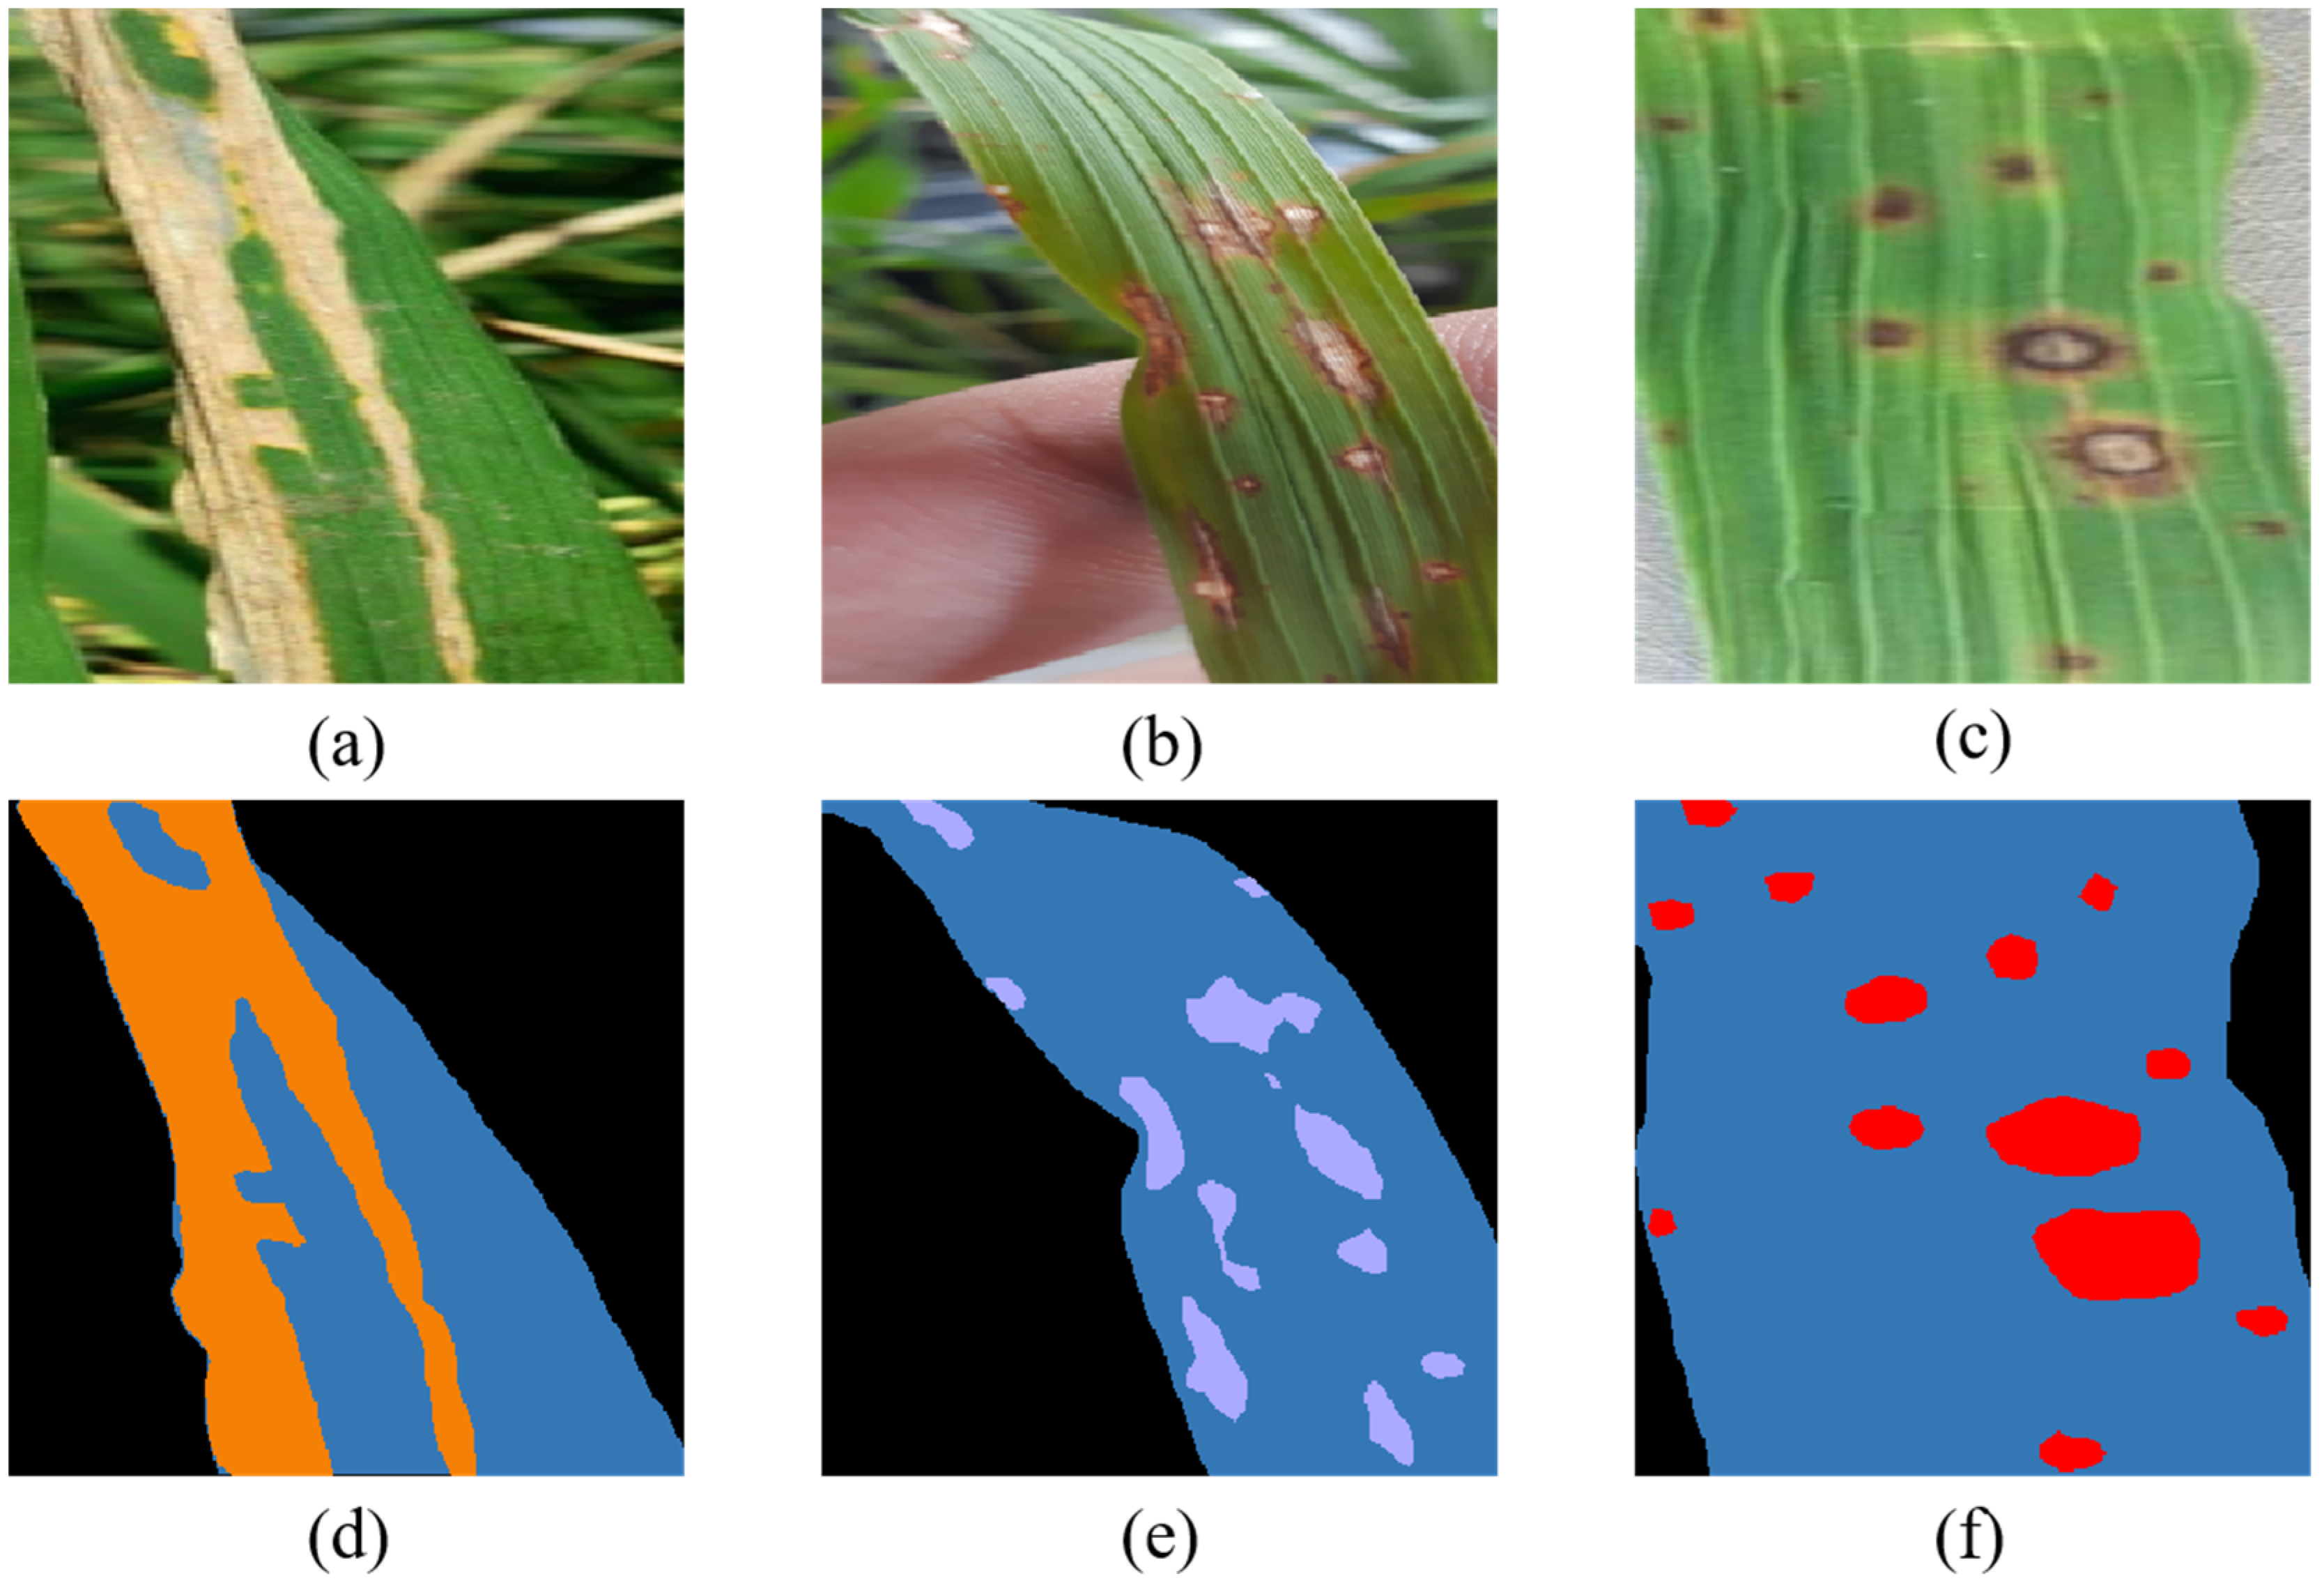
(1) A publicly available dataset of common rice diseases was collected and annotated with semantic segmentation.
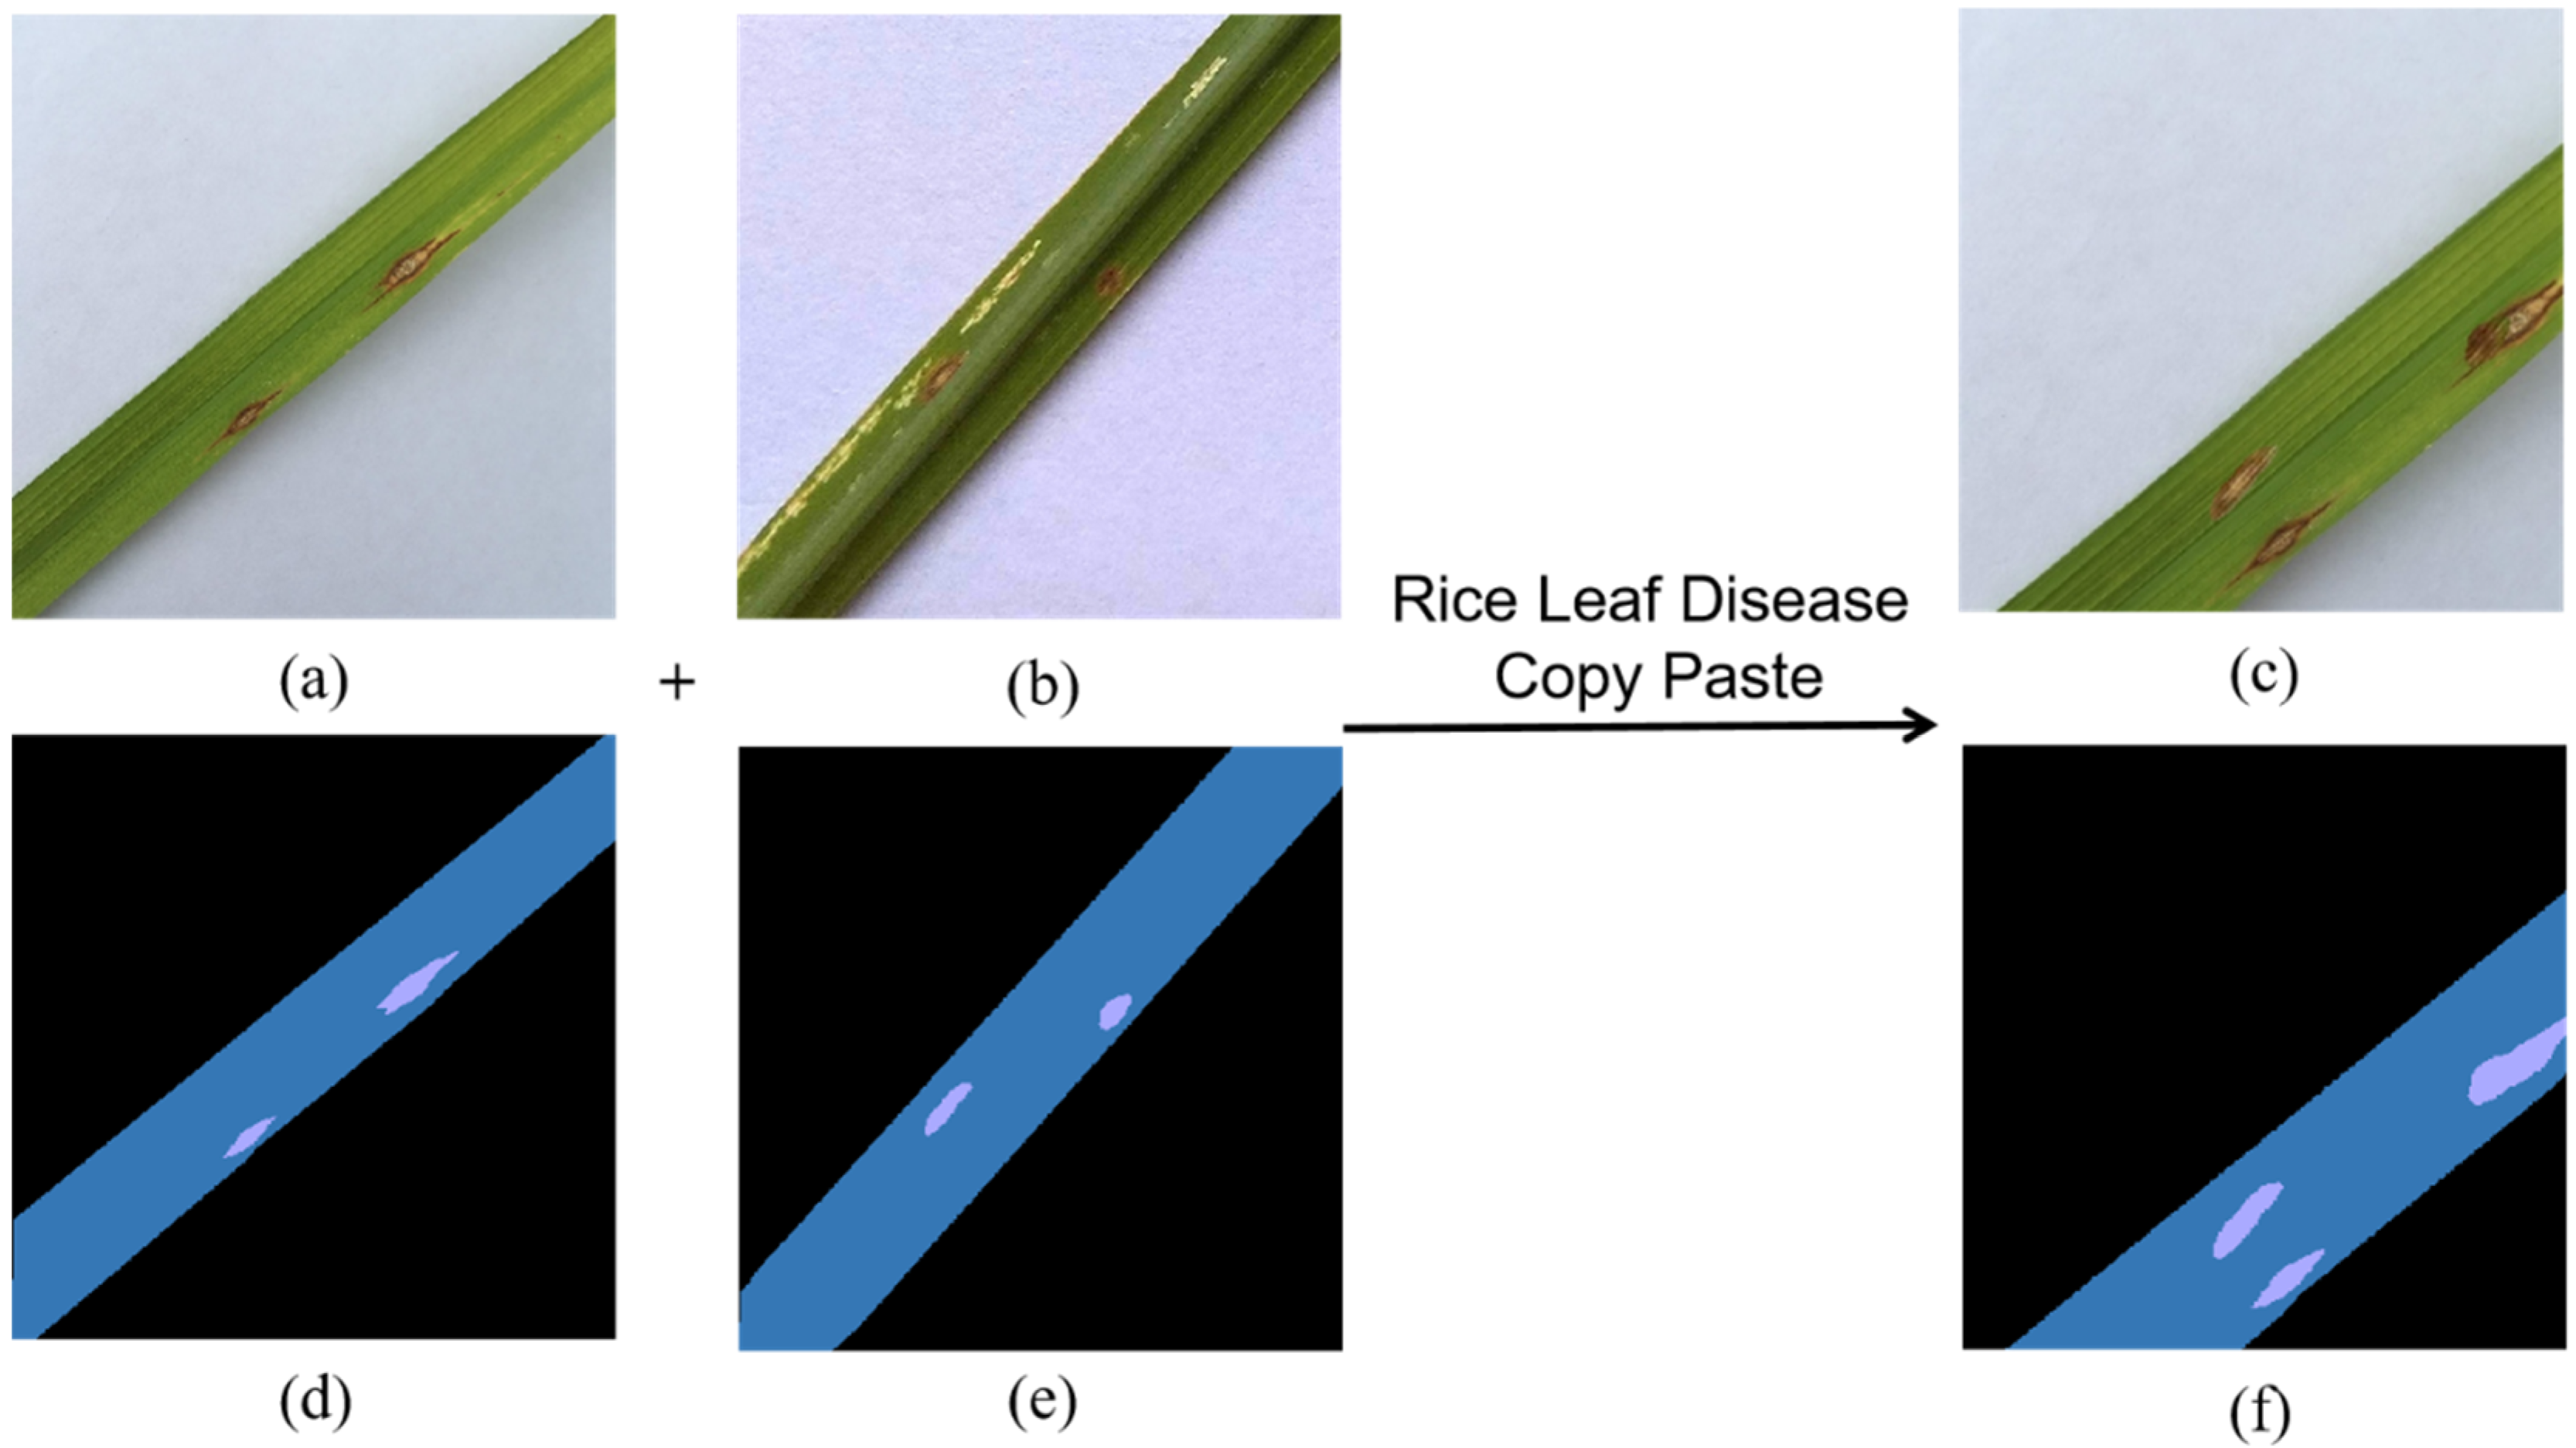
(2) A data enhancement method for rice disease images was proposed based on the copy-and-paste idea to generate more images that match the symptoms of rice diseases.
(3) A new rice disease segmentation model, RSegformer, was proposed, with MIoU reaching 85.38% on a parametric count of 14.36 million.
(4) An index for classifying rice leaf disease classes by combining the ratio of spots to leaf area and the number of spots is proposed to provide a valuable reference for the practical application of leaf disease severity estimation in other plants.
4. Discussion
4.1. Validation of Data Augmentation Methods
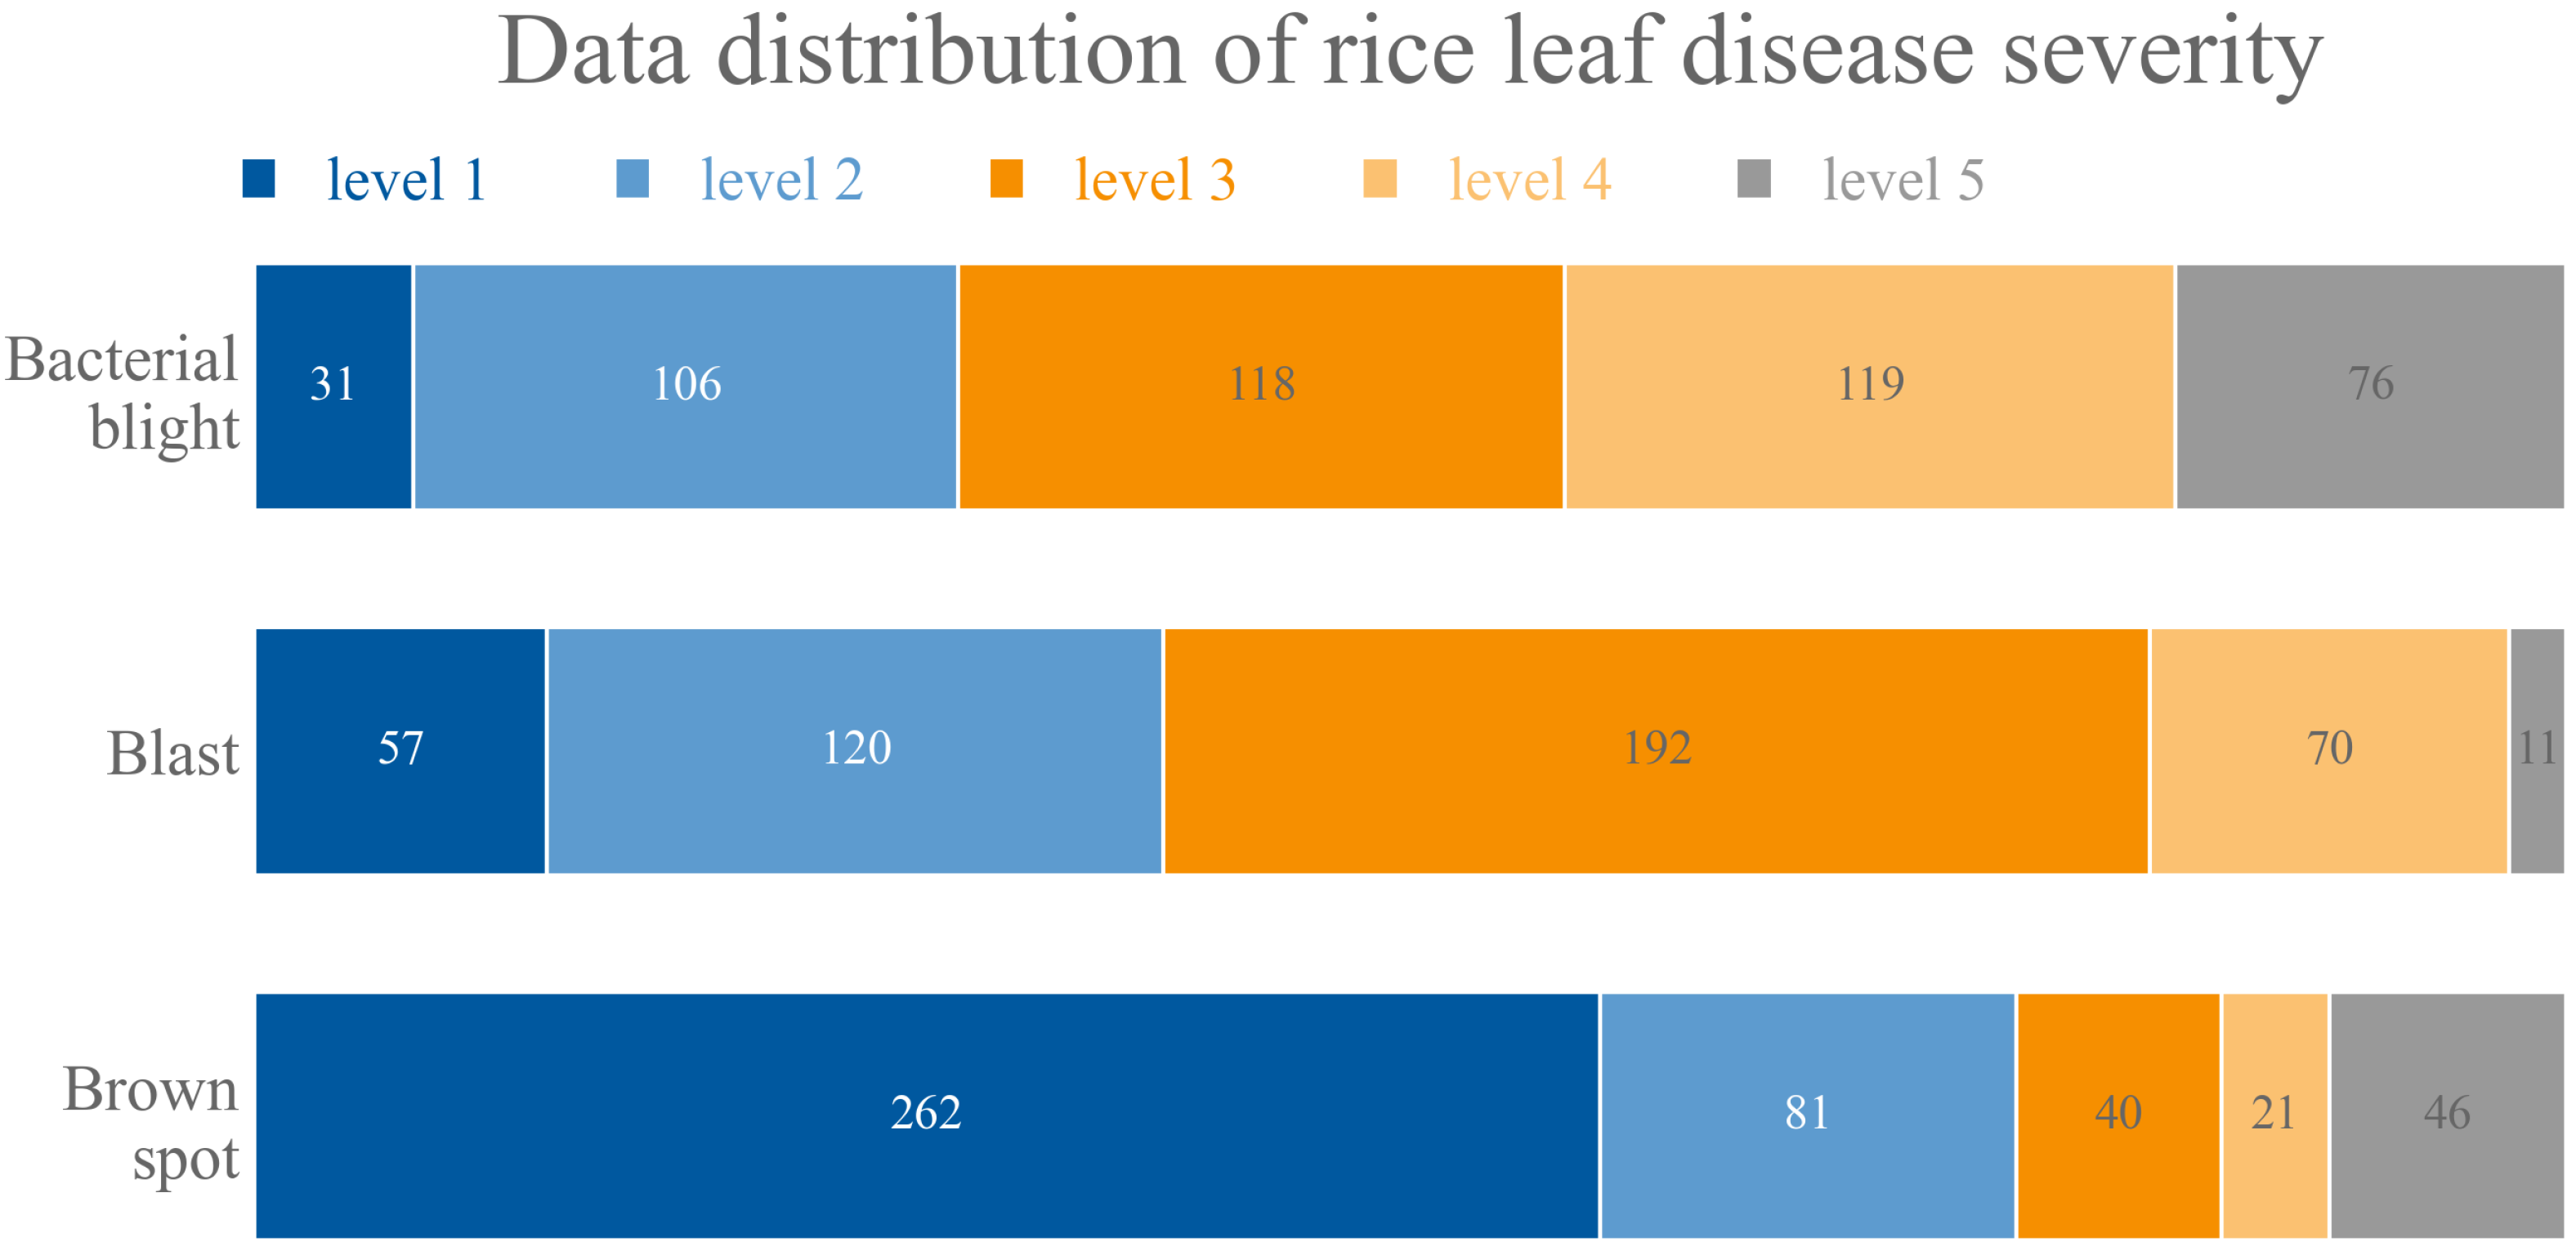
In this experiment, we chose three of the more popular network models, namely PSPNet, HRNet and OCRNet. To verify the effectiveness and superiority of our proposed data augmentation method and to validate the performance change when RLDCP was used a different number of times, we compared the segmentation accuracy of four datasets (the original dataset, the dataset obtained after running the traditional data augmentation method twice and the dataset obtained after running the RLDCP augmentation method once and then twice) on three classical semantic segmentation models, using MIoU as the evaluation metric. The original dataset contained 450 disease images, and with each data enhancement, the number of datasets increased by 450. Thus, a single data augmentation produced a dataset with 900 disease images and double data augmentation produced a dataset with 1350 disease images. It is worth noting that in order to obtain more valid information from the original image by traditional data augmentation methods, we chose two classical traditional data augmentation methods, namely random rotation and the addition of pretzel noise. In particular, we divided the data within each level of the three diseases in turn in a ratio of 8:2 to form the training and validation sets required for our experiments. The experimental results are shown in
Table 3. We found that the MIOU values of the dataset enhanced using the RLDCP method increased on the different network models, demonstrating the effectiveness of RLDCP in the segmentation process.
Observation of
Table 3 revealed that (1) traditional data enhancement methods reduced the segmentation performance of the model. We analysed the reason for this, probably because the datasets we used originated from three different environments with widely varying data distributions. The limited amount of information added by random rotation and pretzel noise amplified this imbalance by repeating memory on the data. (2) The RLDCP data enhancement method effectively improves model segmentation accuracy. Compared with the original datasets PSPNet, HRNet and OCRNet, MIoU improved by 5.47%, 6.34% and 5.04% after two RLDCP data augmentations, respectively. We analyse that this may be because the rice leaf disease copy paste method synthesises reasonable rice leaf disease images by restricted copy-paste, which effectively expands the sample data volume, reduces the impact of data distribution differences and improves the generalisability of the model. (3) Training with the data augmented with one RLDCP data augmentation, MIOU increased significantly for all three models. When we added another RLDCP data augmentation, MIOU also increased for all three models. We believe that as the amount of data increases, MIoU will tend to saturate. Although the traditional data enhancement method also increased the amount of data, it did not increase the MIOU, so our proposed RLDCP method is effective.
4.2. Model Comparison Experiments
In this experiment, we split the 1350 disease images obtained using two RLDCP data augmentations into a training and validation set in a ratio of 8:2.
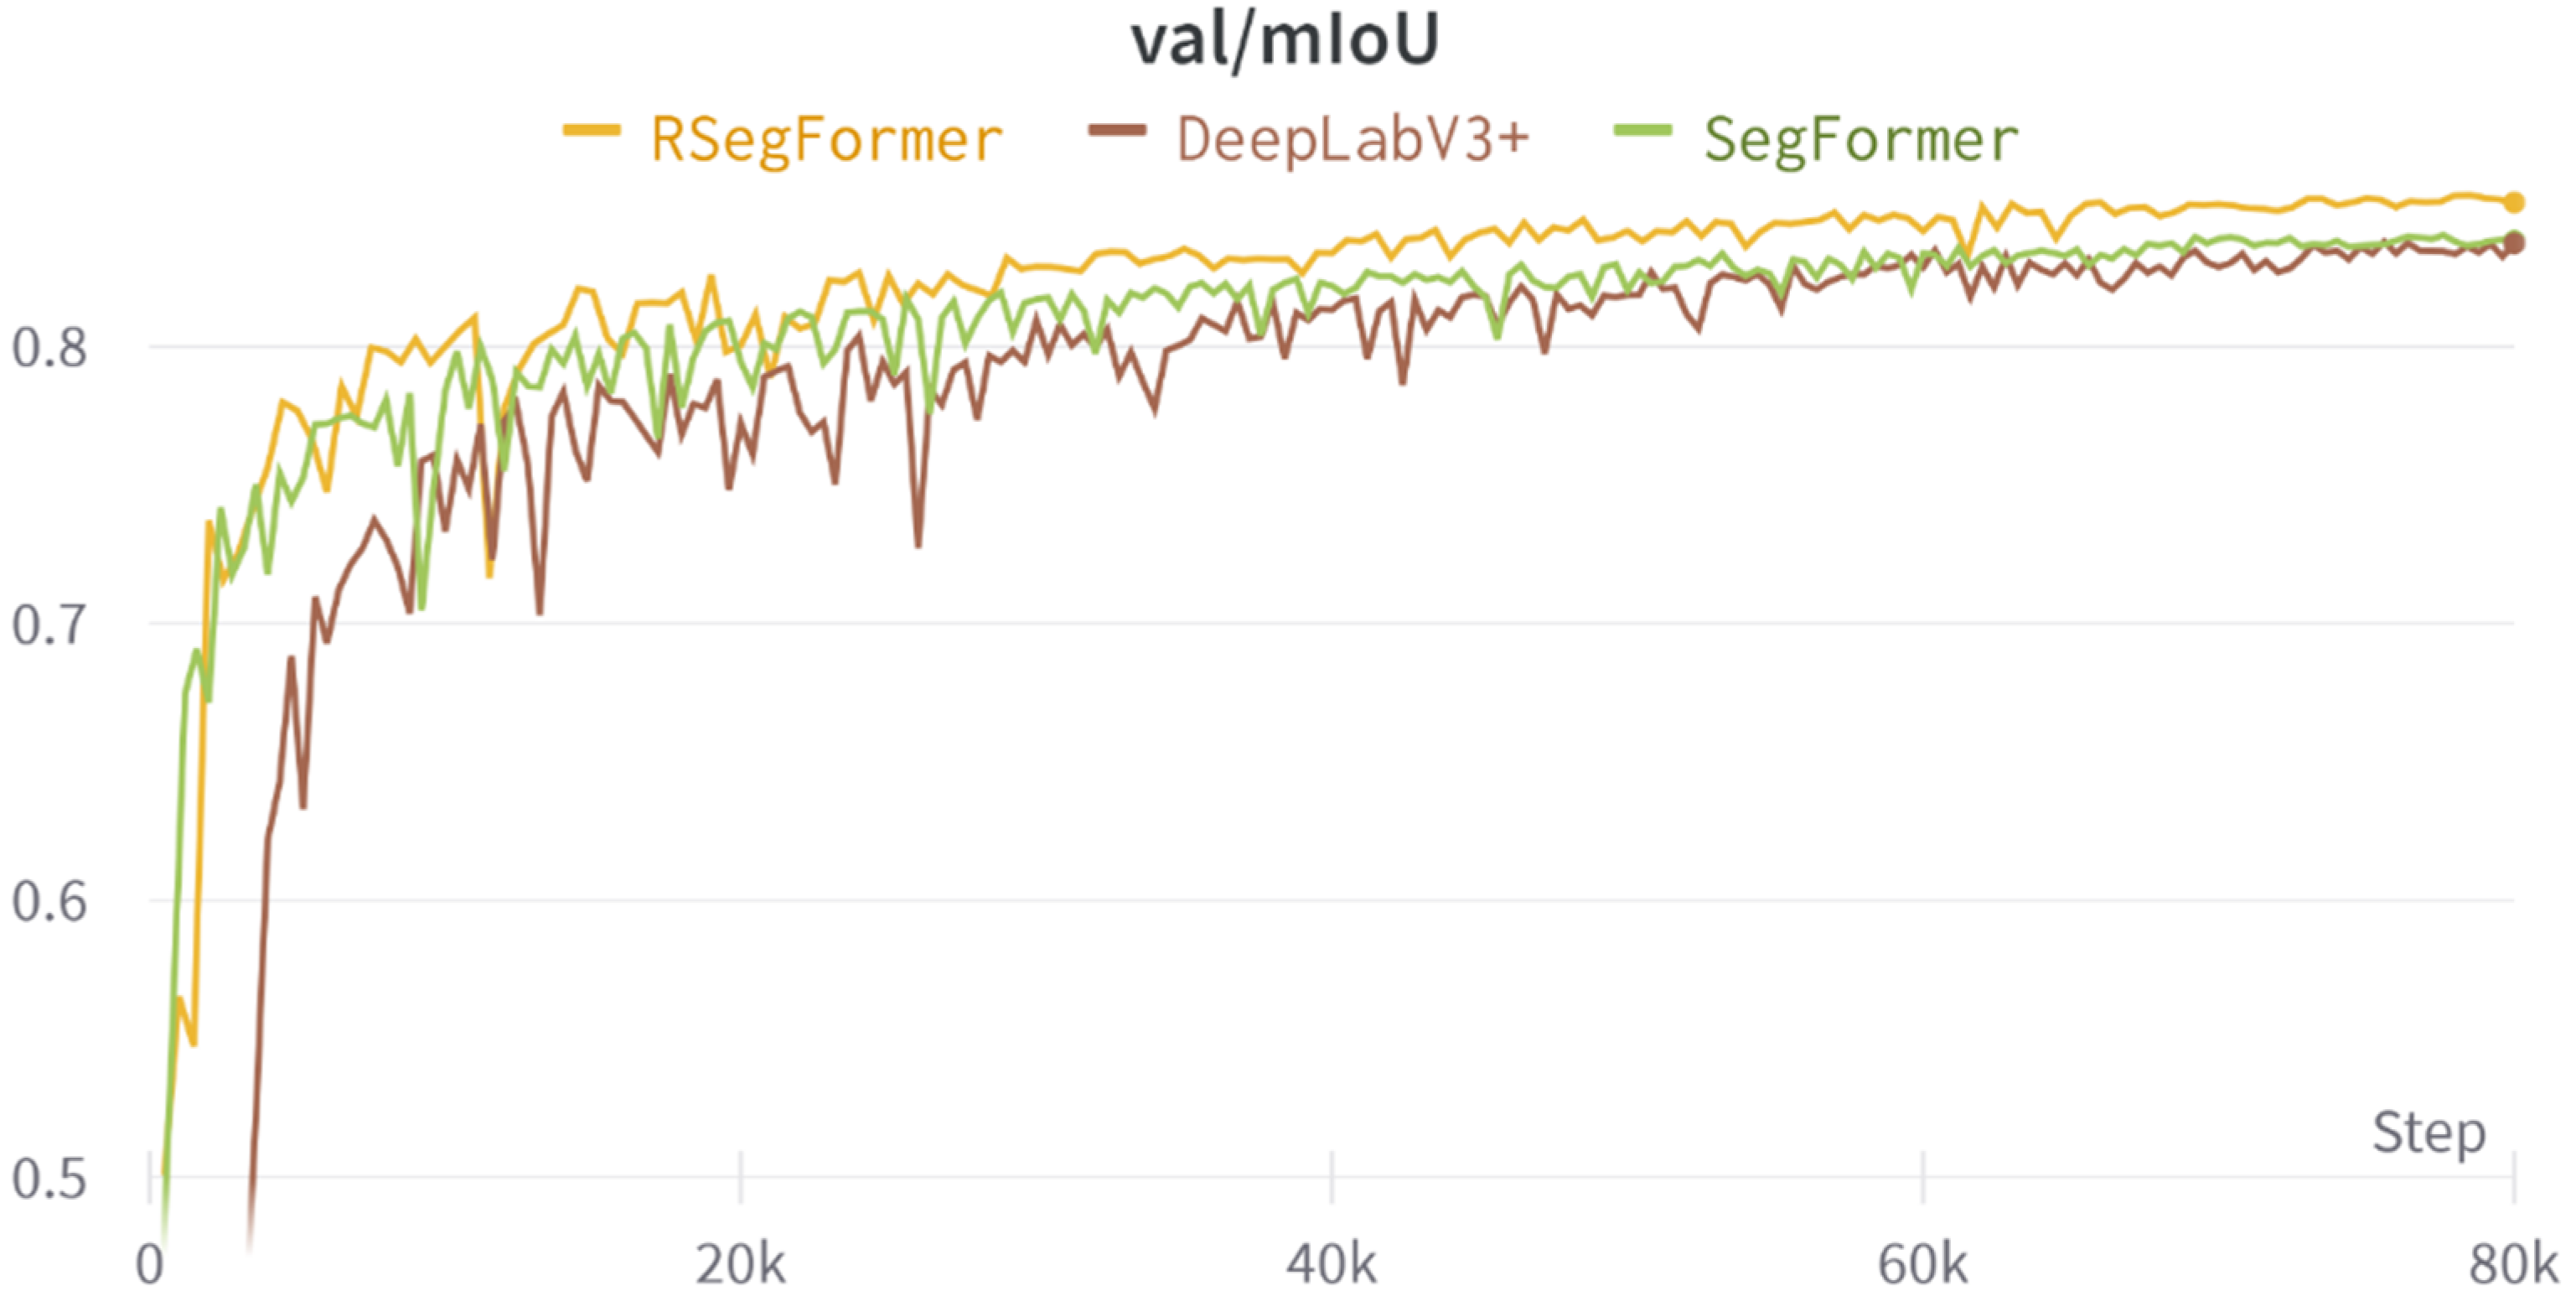
Figure 6 shows the MIoU validation curves for the Deeplabv3+, Segformer and RSegformer models. It can be seen that compared with the Deeplabv3+ and Segformer models, the RSegformer model starts with relatively high accuracy, converges faster, has less oscillation and has the highest MIoU throughout, indicating that the network model has high stability and generalisability.
Table 4 shows the number of parameters, flops and their comparative performance in rice leaf disease segmentation for the three models. The RSegformer was experimentally shown to outperform DeepLabv3+ and Segformer in terms of MIoU. Relative to the Segformer model, RSegformer improved IoU for bacterial blight, blast, brown spot and leaf segmentation by 1.44%, 2.28%, 1.96% and 1.34%, respectively.
To compare the segmentation performance of different models, we calculated the number of parameters and FLOPs of RSegformer and models of different sizes such as DeepLabv3+ (ResNet18), Segformer (MiT-B1) and Segformer (MiT-B2) and obtained MIoU based on the training and validation results. From
Table 4, we can see that the RSegformer model has the second highest number of parameters and GFLOPs after Segformer (MiT-B1) but achieves the highest MIoU and achieves a better balance of model accuracy and speed.
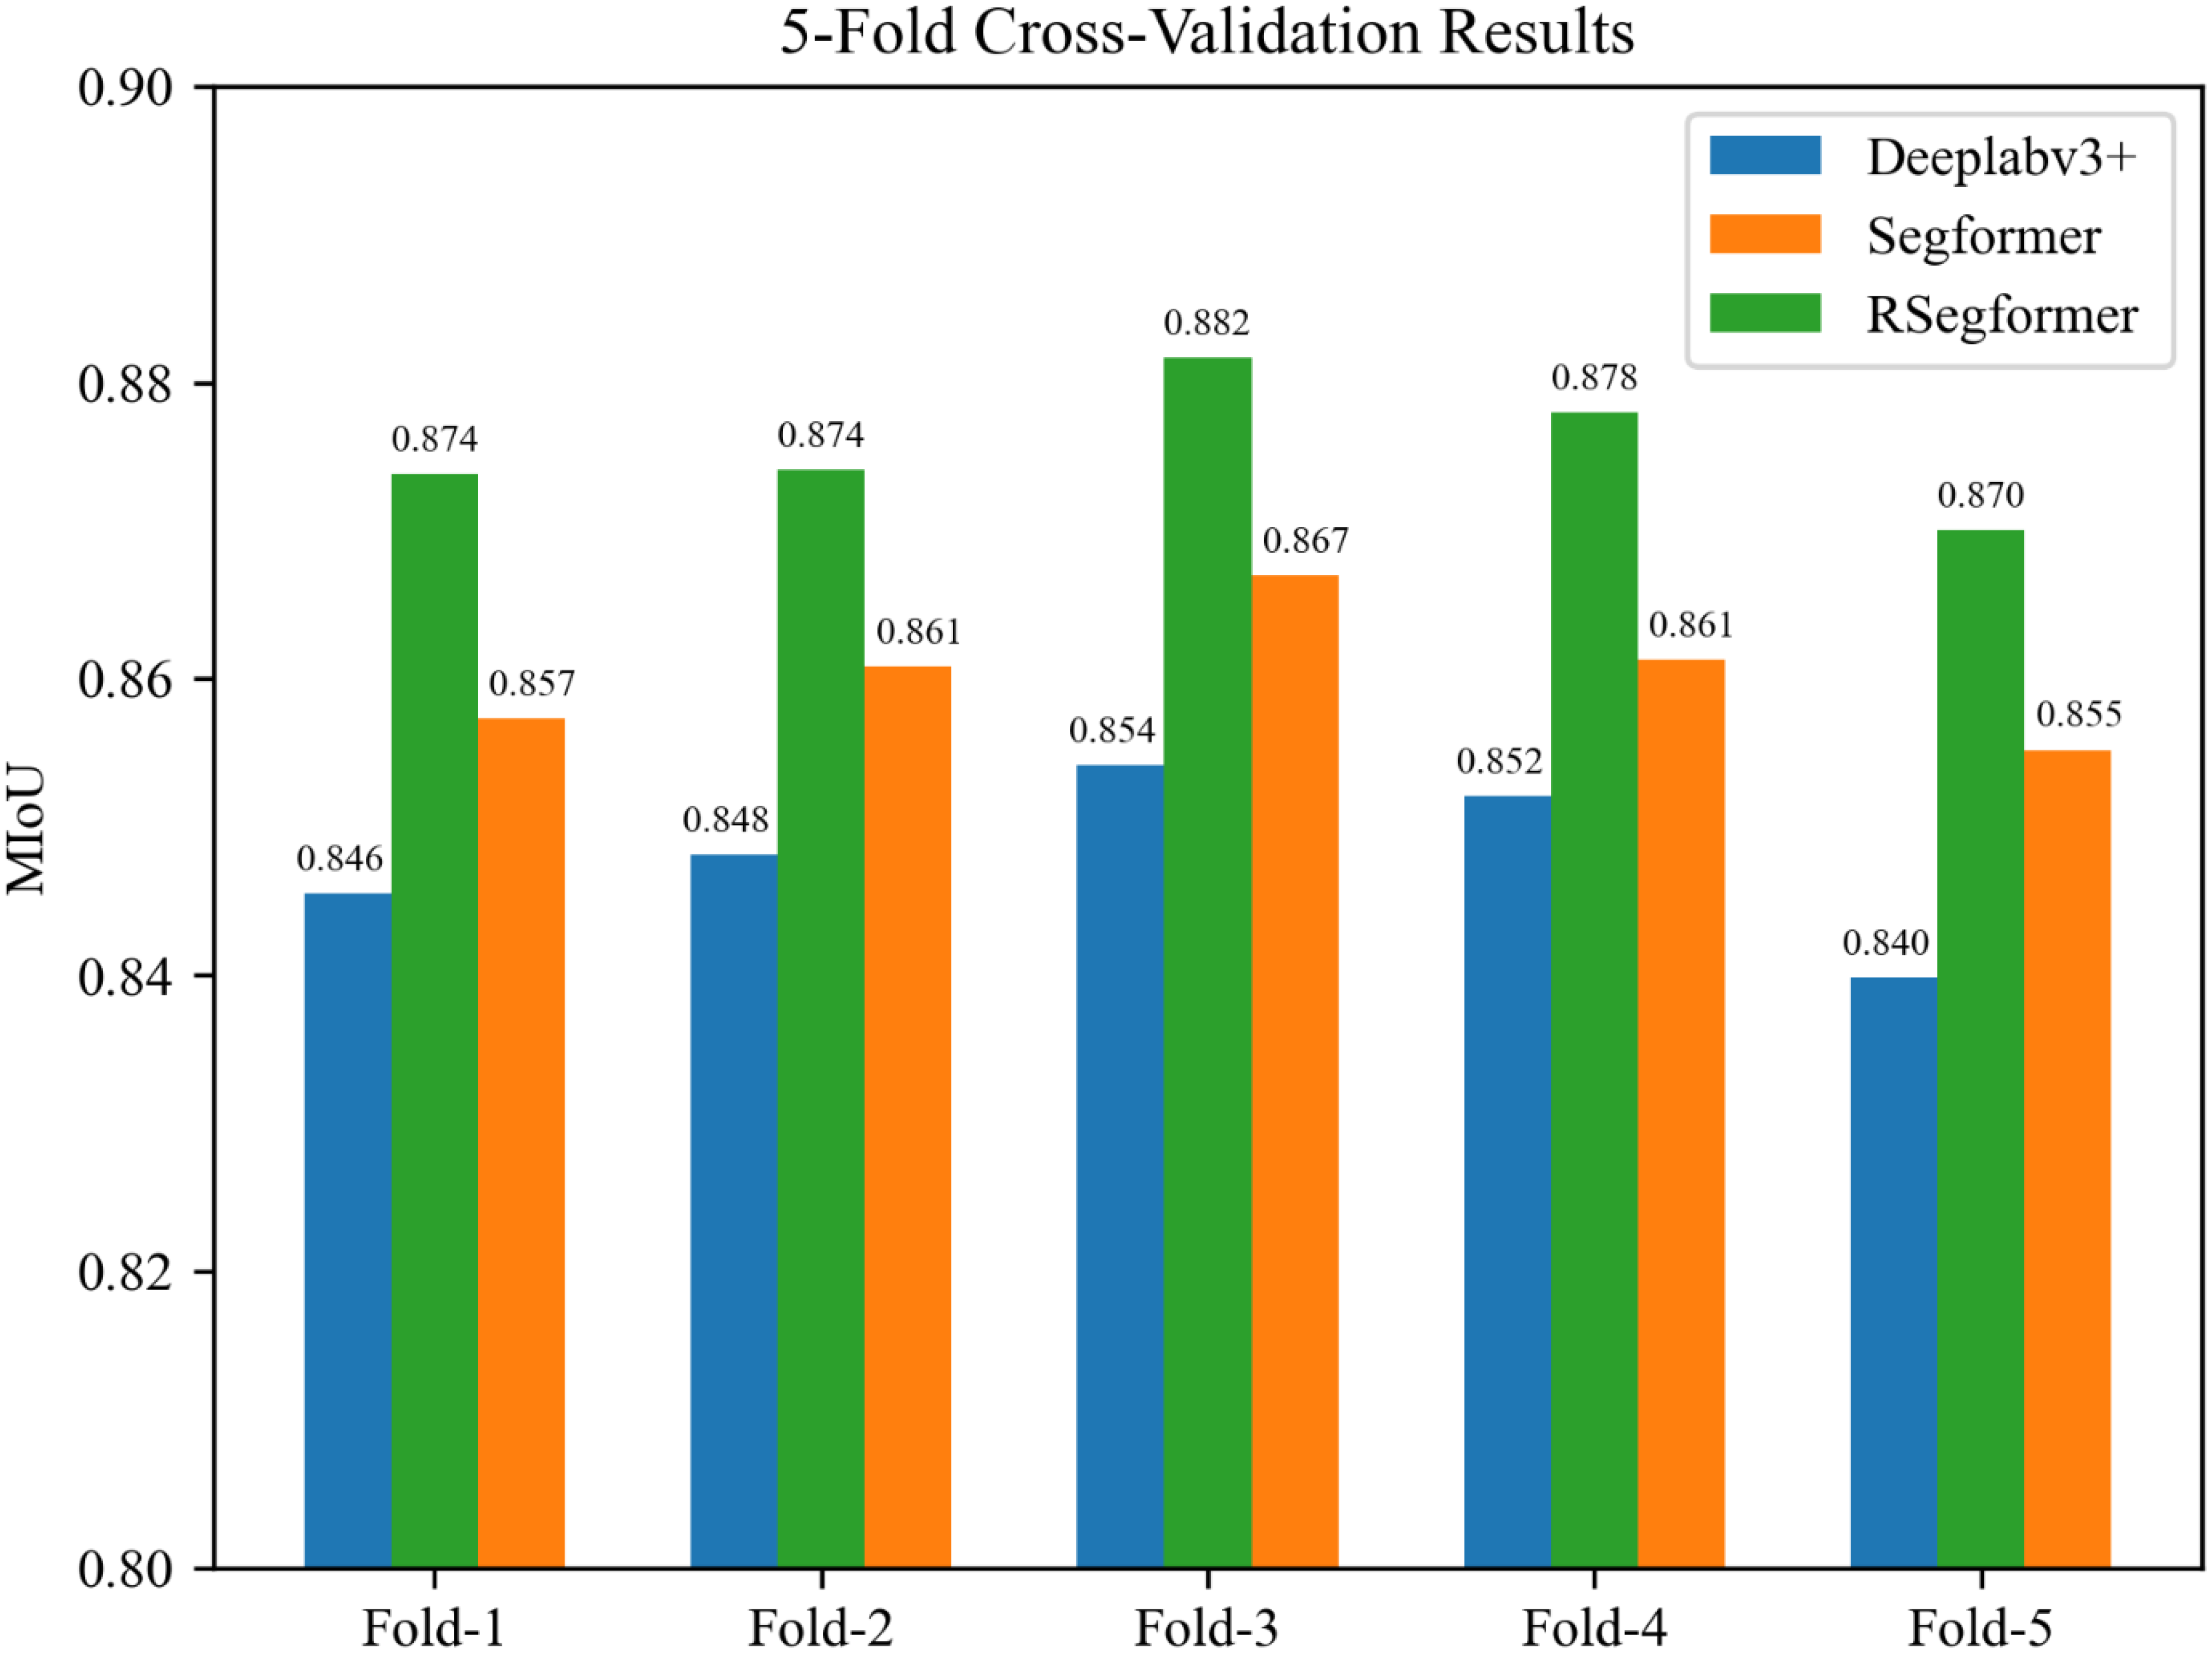
In this experiment, a fivefold cross-validation approach was chosen in order to obtain more accurate training results to verify that our chosen model was valid and reliable. Firstly, the dataset obtained after twice using RLDCP data augmentation was divided into five subsets, and in each subset, the number of each level of each disease was equally divided. Secondly, during the training process, one of these five subsets was sequentially used as the validation set and the remaining four subsets were used as the training set for the experiment, constituting five sets of training and validation data. Finally, these five sets of data were trained on each of the three models. It is noticeable that we set the batch size to 4 this time and the total number of iterations trained remained the same. The results are shown in
Figure 7.
Firstly, the MIoUs of the three models fluctuated less among the five sets of experiments. Secondly, the differences between the three models were relatively stable in each experiment. Finally, it is evident that RSegformer performed best among the three models, with MIoUs on average 1.5% and 2.5% higher than Segformer and Deeplabv3+, respectively.
To verify that the cross-validation results of the three models were statistically significantly different, and because the crossover experiments for the three models were independent of each other and their results were consistent with continuity, normality and homogeneity of variance, we chose a one-way analysis of variance (ANOVA) and used SPSS software for statistical analysis. The ANOVA results showed that the different models had significantly different effects on MIoU, F = 39.853,
p = 0.000005, as shown in
Table 5. The multiple mean comparison results showed that the RSegformer model was significantly better than Segformer and Deeplabv3+.
4.3. Model Ablation Study
The ablation experiments were designed to investigate the effectiveness of the sampling operators on the shunted transformer, CA attention and CARAFE. We compared the IoUs of background, leaf, bacterial blight, blast, brown spot and the overall MIoU, as shown in
Table 6. The segmentation performance of the models that did not use these methods was below the maximum accuracy of RSegformer.
Model 1 is the original Segformer model, Model 2 is the model after replacing the encoding part of the Segformer model with shunted transformer and Model 3 is the model after adding CA attention to the middle part of encoding and decoding on top of Model 2. Model 4 is the model after replacing the bilinear up-sampling with CARAFE in the decoding part on top of Model 2.
After replacing the coding backbone with shunted transformer, the segmentation accuracy improved for almost all diseases and leaves and backgrounds except for rice bacterial blight. This may be because SSA has better feature extraction for small targets through multiscale token aggregation, which unifies multiscale feature extraction within a single self-attentive layer and therefore has better segmentation capability for dense micro-miniature disease spots such as brown spots and rice blast.
The segmentation accuracy of rice bacterial blight disease improved with the addition of CA attention. This may be because CA attention takes into account the relationships of the location information in the feature space, which enables the model to capture the long-distance dependence between spatial locations. Therefore, there is an improvement in segmenting images of rice bacterial blight, which has an onset colour similar to that of rice ears and a wide distribution area.
All disease segmentation accuracies improved significantly with the addition of the CARAFE operator. This may be because the CARAFE up-sampling method has a larger perceptual field and can make better use of the surrounding information and also the up-sampling kernel in CARAFE is related to the semantic information of the feature map, enabling up-sampling based on the input content. Thus, it can significantly improve the overall segmentation performance of the network.
When CA attention and CARAFE cooperate, the segmentation accuracy of all diseases except brown spot improved. We determined that this may be because since CARAFE can better capture semantic information, CA attention can better capture feature spatial location information, and the combination of the two to complement each other effectively improves the model’s segmentation performance.
4.4. Comparison of Model Inference Results
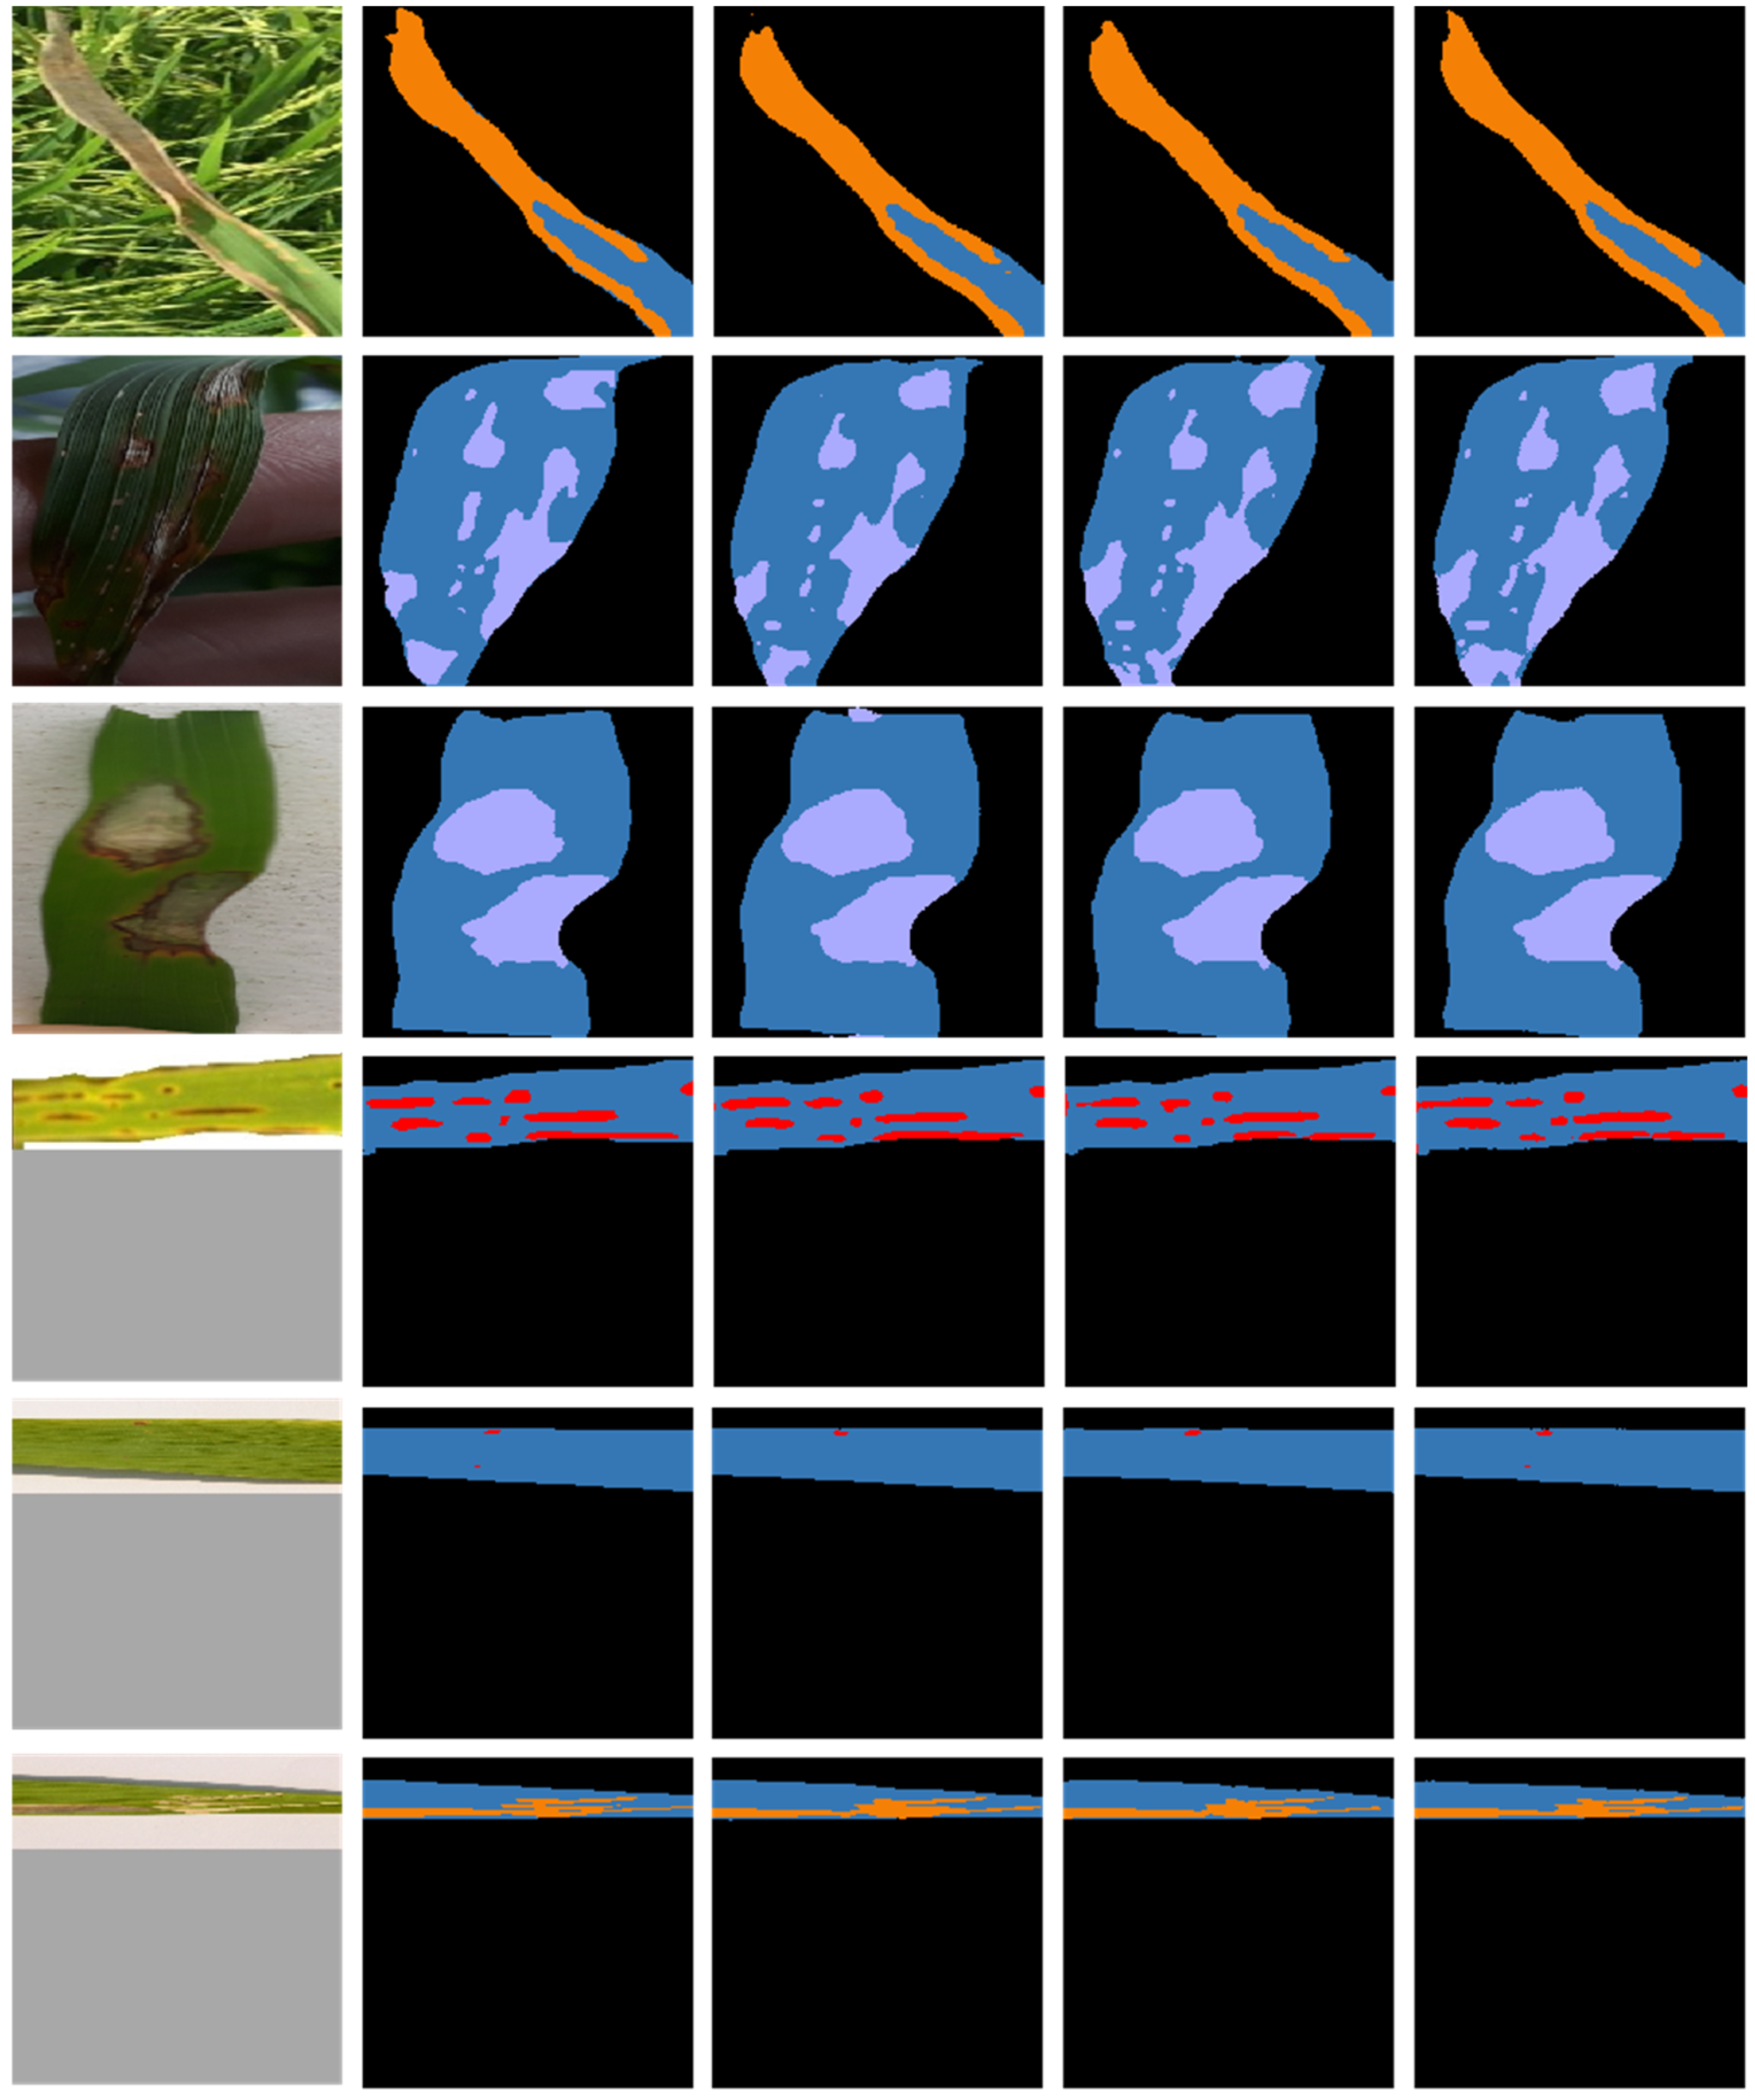
To investigate the segmentation performance of Deeplabv3+, Segformer and RSegformer, we analysed the inference results. This is shown in
Figure 8. From the first row, it can be seen that RSegformer identifies leaf edge contours better than the other models in the presence of complex background interference. The second row shows that RSegformer can still detect rice blast onset areas and achieve fine segmentation under dark light conditions. In the third row, Deeplabv3+ misdetects the white-grey area above the leaf as a bacterial blight lesion in the segmentation, but Segformer and RSegformer do not, as the rice blast onset area exhibits very similar colour symptoms to the background. In the fourth row, it can be seen that the RSegformer model segmented the blurred edges of brown spot disease very well, in line with the conclusion obtained in the ablation study that CA attention significantly improved the fine segmentation of margins. In the fifth row, we find that Deeplabv3+, and Segformer both show missed detection of fine disease spots. RSegformer can segment accurately, which has important implications for the timely monitoring and early warning of rice diseases. The sixth row uses the synthetic leaf of rice bacterial blight disease and its inference results after data enhancement, and the segmented area of RSegformer was closer to the labelled image.
4.5. Comparison of Rice Disease Severity Estimates
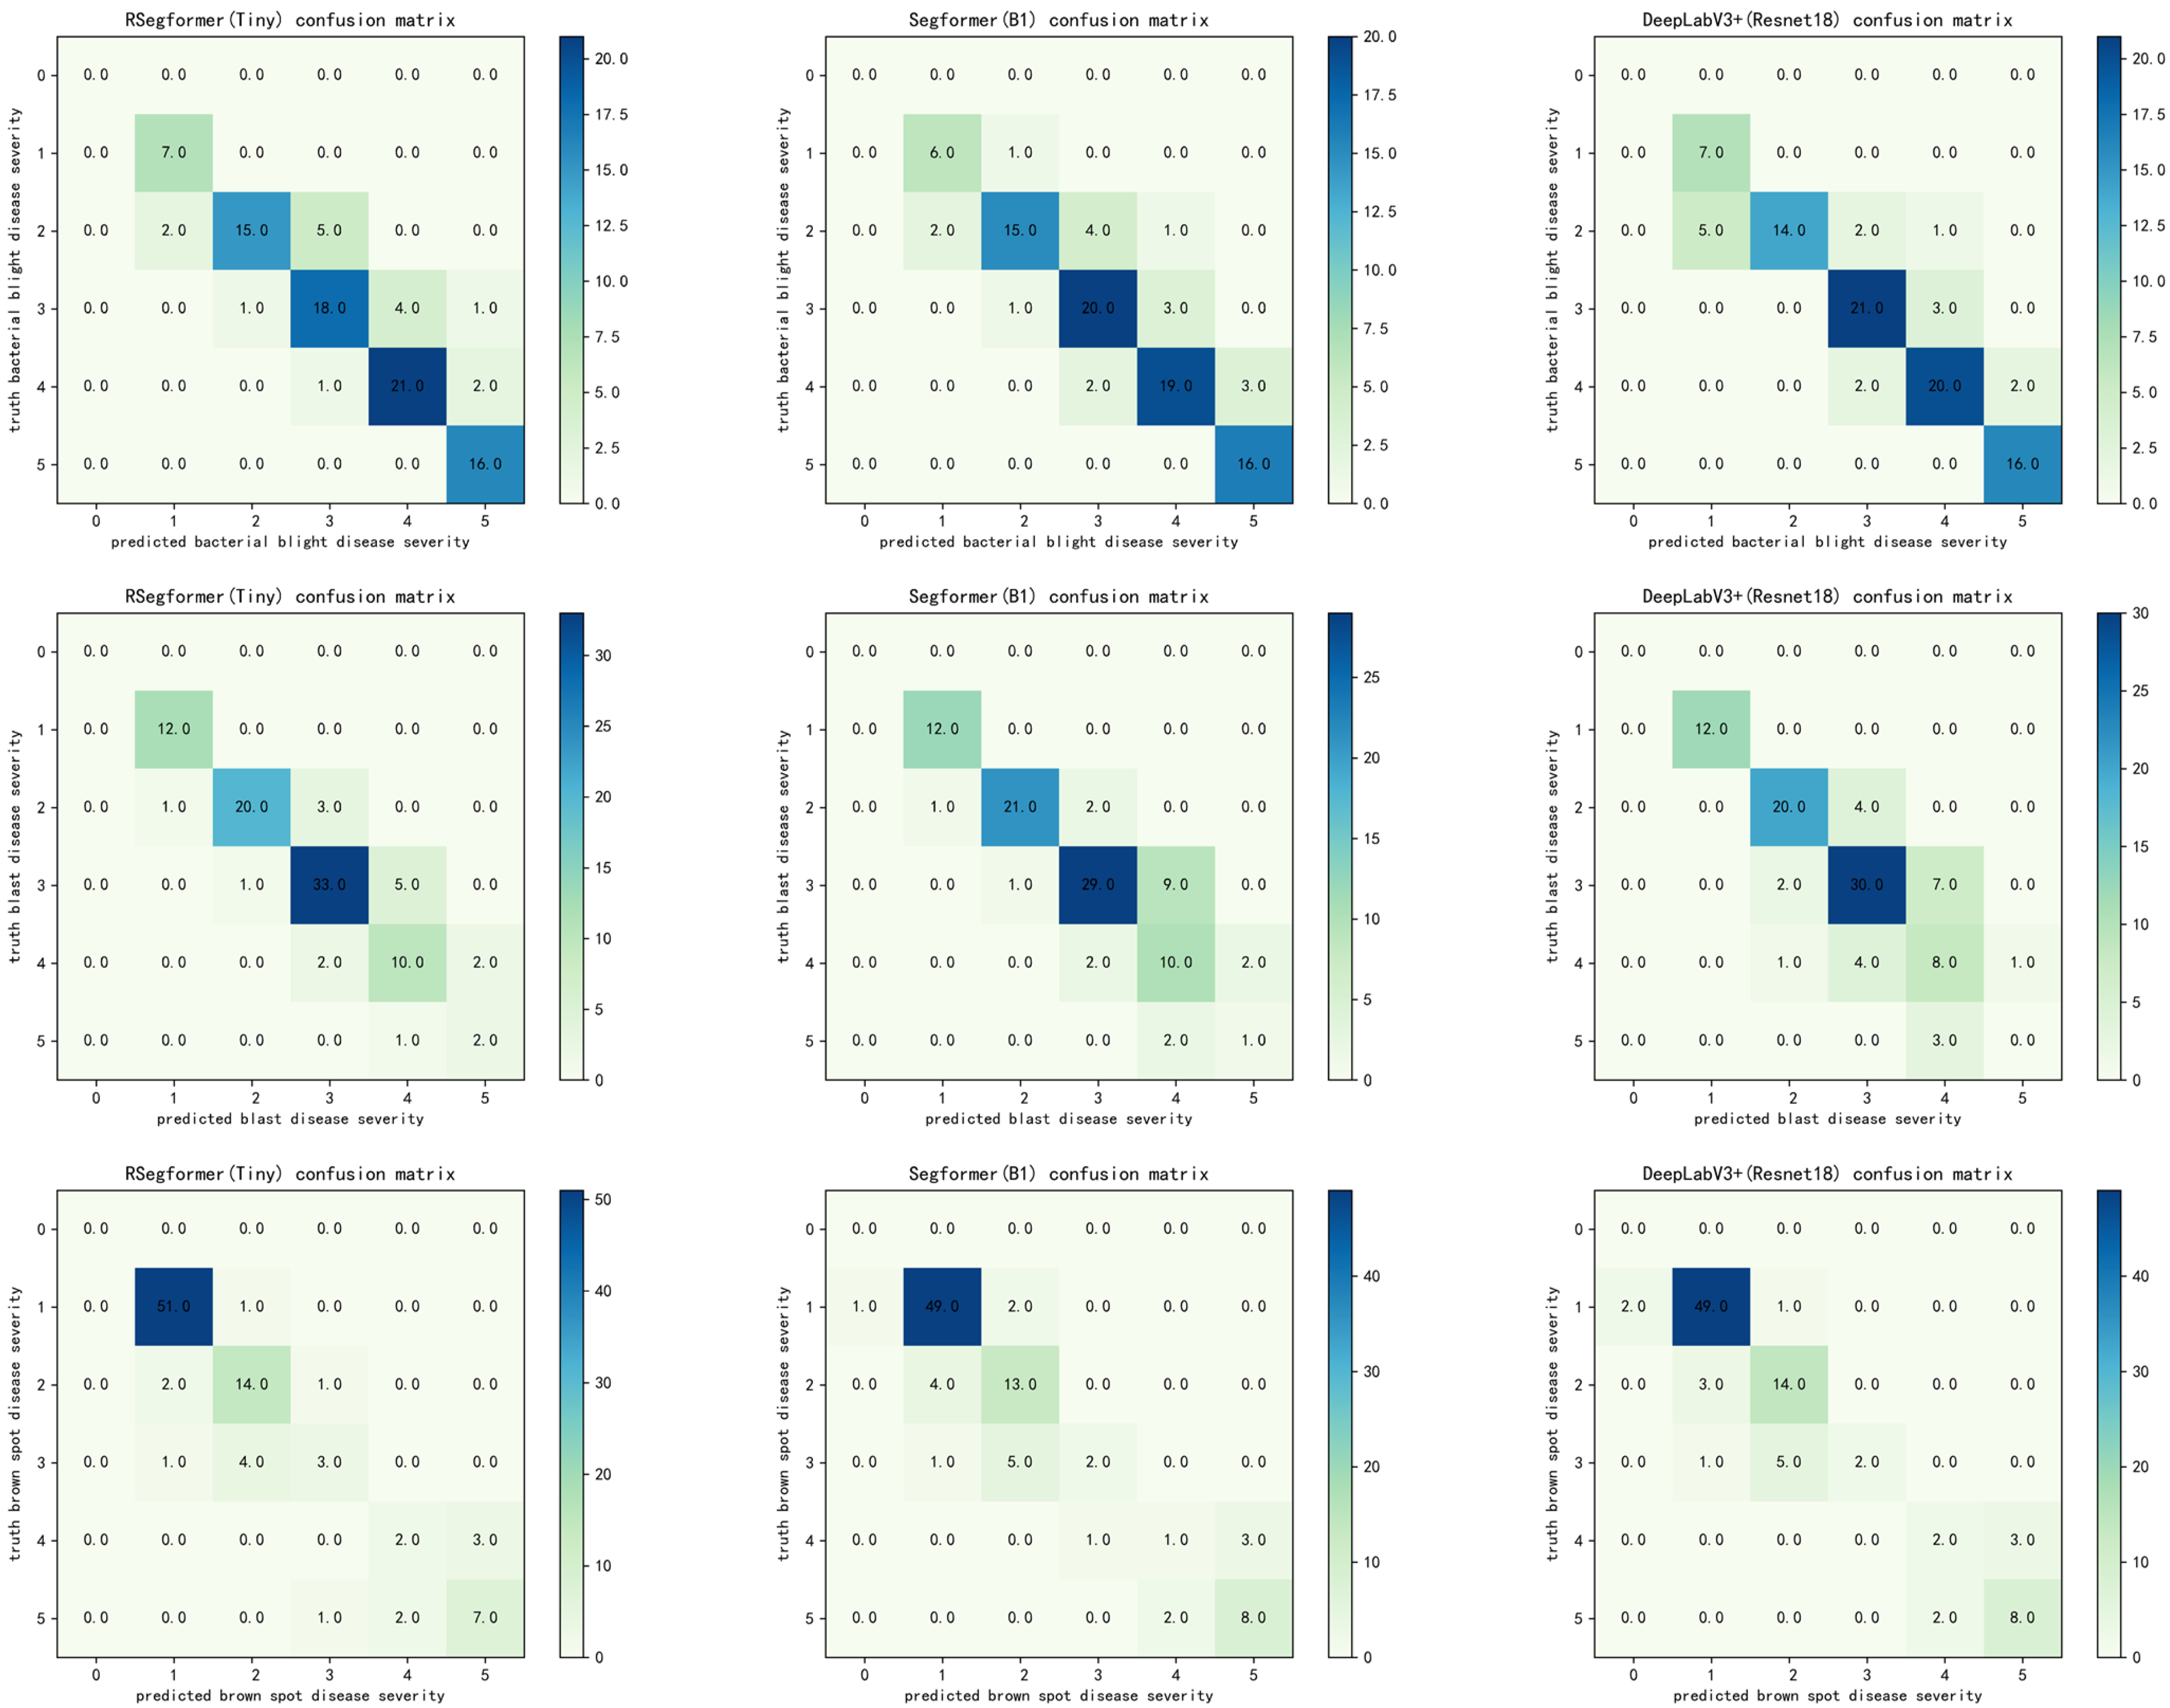
Based on the model segmentation results, rice disease areas and leaf areas can be extracted, the disease percentage of leaf area can be calculated based on the area pixel area and severity classes can be calculated based on the rice disease classification criteria in
Section 2.1.4. In this experiment, the confusion matrices of DeepLabv3+, Segformer and RSegformer for determining the severity of rice bacterial blight, rice blast and brown spot, respectively, were compared, as shown in
Figure 9. In the confusion matrix, each row represents the correct category, and each column represents the predicted category. RSegformer performs better in rice disease severity estimation.
To improve our understanding of the causes of this phenomenon, we further analysed the misclassification problem. Analysis of the confusion matrix showed that our model was more accurate than other models in grading the severity estimates for the two diseases other than rice bacterial blight. For rice bacterial blight, rice blight and brown spot, 16, 15 and 15 samples were misclassified by RSegformer, respectively, with disease severity overestimated in 12, 10 and 5 of these samples. Possible reasons for this misclassification were blurred leaf edges and similarity of leaf colour to the background, resulting in the segmented leaf area being smaller than the actual area.
RSegformer was below average for accuracy at level 3, with rice bacterial blight and rice blast mostly overestimated at level 4, which we determined was a result of the difficulty in defining the edges of the yellow halo for some diseases, resulting in the model predicting a larger lesion area than the marked area. Brown spot was mostly underestimated at level 2, probably due to the clustering of spots, which made it difficult to split the predicted spots.


 ,
, 


