Article

Genome-Wide Identification of the TIFY Gene Family in Brassiceae and Its Potential Association with Heavy Metal Stress in Rapeseed

1
Chongqing Engineering Research Center for Rapeseed, College of Agronomy and Biotechnology and Academy of Agricultural Sciences, Southwest University, Chongqing 400716, China
2
Key Laboratory of Biology and Genetic Improvement of Oil Crops, Oil Crops Research Institute of the Chinese Academy of Agricultural Sciences, Ministry of Agriculture and Rural Affairs, Wuhan 430062, China
3
Academy of Agricultural Sciences, Southwest University, Chongqing 400715, China
4
Engineering Research Center of South Upland Agriculture, Ministry of Education, Southwest University, Chongqing 400715, China
*
Authors to whom correspondence should be addressed.
These authors contributed equally to this work.
Plants 2022, 11(5), 667; https://doi.org/10.3390/plants11050667
Submission received: 8 February 2022 / Revised: 25 February 2022 / Accepted: 25 February 2022 / Published: 28 February 2022
(This article belongs to the Special Issue Development and Genetic Improvement in Brassica Crops)

Abstract

:
The TIFY gene family plays important roles in various plant biological processes and responses to stress and hormones. The chromosome-level genome of the Brassiceae species has been released, but knowledge concerning the TIFY family is lacking in the Brassiceae species. The current study performed a bioinformatics analysis on the TIFY family comparing three diploid (B. rapa, B. nigra, and B. oleracea) and two derived allotetraploid species (B. juncea, and B. napus). A total of 237 putative TIFY proteins were identified from five Brassiceae species, and classified into ten subfamilies (six JAZ types, one PPD type, two TIFY types, and one ZML type) based on their phylogenetic relationships with TIFY proteins in A. thaliana and Brassiceae species. Duplication and synteny analysis revealed that segmental and tandem duplications led to the expansion of the TIFY family genes during the process of polyploidization, and most of these TIFY family genes (TIFYs) were subjected to purifying selection after duplication based on Ka/Ks values. The spatial and temporal expression patterns indicated that different groups of BnaTIFYs have distinct spatiotemporal expression patterns under normal conditions and heavy metal stresses. Most of the JAZIII subfamily members were highest in all tissues, but JAZ subfamily members were strongly induced by heavy metal stresses. BnaTIFY34, BnaTIFY59, BnaTIFY21 and BnaTIFY68 were significantly upregulated mostly under As3+ and Cd2+ treatment, indicating that they could be actively induced by heavy metal stress. Our results may contribute to further exploration of TIFYs, and provided valuable information for further studies of TIFYs in plant tolerance to heavy metal stress.

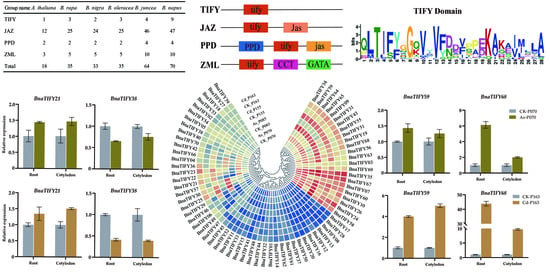
Graphical Abstract

1. Introduction

The TIFY gene family contains a conserved TIFY domain originally known as the Zinc-finger (ZIM) [1]. The TIFY domain of approximately 36 amino acids recognizes as the core motif TIF[F/Y]XG (where X represents any amino acid) [2]. Previous reports showed that members of the TIFY family could be divided into four subfamilies, namely ZML (ZIM/ZIM-like), PPD (PEAPOD), JAZ (jasmonate-ZIM-domain) and TIFY, based on their conserved protein domains [2,3]. The ZIM and ZIM-like (ZML) proteins, together forming the ZML subfamily, contain both a C2C2-GATA zinc-finger DNA-binding domain and a CCT domain (CONSTANS, CO-like, TOC1). The PPD subfamily contains a PPD domain at the N-terminus and a modified Jas domain at the PY motif is missing. The Jasmonate ZIM-domain (JAZ) subfamily contains a conserved Jas motif of approximately 27 amino acids near the C-terminus in addition to the TIFY domain [3,4].
The Jas domain has a similarity to the N-terminal portion of the CCT domain, with the characteristic motif SLX2FX2KRX2-RX5PY, which is necessary for interaction with other proteins, including the CORONATINE INSENSITIVE 1 (COI1) [5], the basic helix-loop helix (bHLH) transcription factors (e.g., MYC2, MYC3, MYC4, and MYC5), and MYB transcription factors (MYB21, MYB24, MYB75, and GLABRA1), through to the JA signaling pathway [5,6,7]. Among them, the COI1 is the primary JA receptor [8,9], and MYC2, is an important transcriptional activator of responses to JA [10], as the link between COI1 and MYC2, JAZ proteins plays a key role in JA-mediated responses [11]. In Taxus spp., TcMYC2a can regulate taxon biosynthesis through binding with TcJAZ3 [10], while MYC3 and MYC4 could interact with the majority of JAZ proteins [12,13]. In Arabidopsis thaliana, the IIIe basic helix-loop-helix (bHLH) transcription factor MYC5 also acted as a target of JAZ repressors, functioning redundantly along with other IIIe bHLH factors, such as MYC2, MYC3, and MYC4 in the regulation of stamen development and seed production, and these IIIe bHLH factors interact with the MYB transcription factors (MYB21 and MYB24) to form a bHLH-MYB transcription complex, and cooperatively regulate stamen development [14]. In addition, the R2R3-MYB transcription factors, MYB21 and MYB24, were functional as direct targets of JAZs in regulating male fertility specifically [15]. However, JAZ proteins interacted with bHLH (e.g., Transparent Testa8, Glabra3, and Enhancer of Glabra3) and R2R3 MYB transcription factors (MYB75 and Glabra1) to repress JA-regulated anthocyanin accumulation and trichome initiation [16]; while both DELLA and JAZs could mediate the synergism between GA and JA signaling by interacting with the WD-repeat/bHLH/MYB complex [17]. To date, the roles of JA signaling in response to different environmental stimuli need to be further elucidated.
In plants, TIFY family genes play significant roles in the regulation of diverse aspects of plant development, abiotic stresses and phytohormone treatments. For instance, ZIM/TIFY1, TIFY8, AtTIFY4a (PPD1) and AtTIFY4b (PPD2) were primarily observed in the process of plant growth and development [6,18]. In mango, expression patterns of the TIFY genes during fruit development and ripening indicated that they may be involved in development and ripening [19]. TIFY11a has been intensively investigated for its roles in salt tolerance in plants [20,21]. Extensive studies showed that most TIFY genes were widely involved in abiotic stress, such as drought, salt stress and cold stress in many species [20]. In rice, most OsTIFY genes were responsive to at least one type of abiotic stress, including drought, salt stress and cold stress [20]. Both rice and chickpea JAZ genes showed a certain level of macro (NPK) and micronutrients (Zn, Fe) deficiency, and the majority of them showed induction under K deficiency [22]. In addition, more efficient activation of OsJAZ8 was accompanied by improved salt tolerance of the transgenic seedlings, and demonstrated the impact of temporal signatures of jasmonate signaling for stress tolerance [23]. In wheat (Triticum aestivum), TIFY11a was specifically induced after salt treatment. Transgenic lines overexpressing TdTIFY11a showed higher germination and growth rates under high salinity conditions, compared to wild type plants [21]. GsJAZ2, overexpressed in soybean and transgenic plants, could strongly increase their alkaline tolerance and confer JA insensitivity [24], while current basic knowledge of TIFY genes in heavy metal tolerance is still limited.
With its long history, the Brassiceae species not only provides more types of vegetables and edible vegetable oil, but is also known as an excellent evolutionary model for investigating the expansion of gene families [25]. Importantly, the Brassiceae species are considered to be heavy metal accumulators [26]. As such, we firstly performed a genome-wide identification and analysis of the TIFY family genes in Brassiceae species (B. rapa, B. nigra, and B. oleracea, B. juncea, and B. napus). We then analyzed the phylogenetic relationships, gene duplications, chromosome distribution, and motif compositions. Finally, we further investigated the expression patterns of BnaTIFYs in different tissues, and evaluated the specific roles of BnaTIFY gene family members in heavy metal induction. Our results provide valuable clues for the functional characterization of TIFY gene family, and lay a foundation for improving plant stress tolerance through the manipulation of BnaTIFY expression.

2. Results

2.1. Identification of TIFY Family Genes in Brassiceae Species

Using 18 A. thaliana TIFY family protein sequences as queries, a total of 237 TIFY family proteins were identified in Brassiceae species based on HMM profile and BLASTP analysis (Table S1), including 35 in B. rapa, 33 in B. nigra, 35 in B. oleracea, 64 in B. juncea, and 70 in B. napus (Table 1 and Table S2). We found that all identified TIFYs could be unevenly mapped across the whole chromosomes, except chromosome BjuA04, and chromosome BjuB03 contained the highest, with 10 TIFY genes (Table S2). The lengths of the TIFY protein sequences ranged from 112 (BnaTIFY08, BnaTIFY12, BnaTIFY13, BnaTIFY16, BnaTIFY49, and BolTIFY10) to 1260 (BjuTIFY35) aa (amino acids) with an average length of 270 aa. The MW (molecular weights) of the TIFY proteins varied from 11.91 (BnaTIFY08, BnaTIFY13, and BnaTIFY16) to 137.89 (BjuTIFY35) kDa. Meanwhile, the pI (isoelectric point) was predicted as ranging from 4.26 (BraTIFY31) to 11.43 (BniTIFY22), but most of these were alkaline (197), with pI > 7.5, 36 were acidic with pIs ≤ 6.5, and others were neutral with 6.5 < pI < 7.5 (Table S2). Meanwhile, the predicted instability indexes showed that most TIFY proteins were unstable (Table S2). The subcellular localization of all TIFYs were only predicted and located on the nucleus, except for four TIFYs (BjuTIFY05, BniTIFY07, BjuTIFY40, and BjuTIFY39). Information on the detailed physical and chemical properties of all TIFYs and encoded proteins is listed in the Table S2

2.2. Phylogenetic Analysis of TIFY Genes in Brassiceae Species

To reveal the evolutionary relationships among the TIFY family genes, the NJ phylogenetic tree was constructed by the MEGA7.0 program (https://www.megasoft-ware.net/) based on the TIFY protein sequence alignments between A. thaliana and five Brassiceae species. As shown in Figure 1, 255 TIFY proteins were grouped into 10 clades, named JAZ I to JAZ VI, PPD, TIFY I, TIFY II, and ZML as defined by TIFY domain type [3], and members of the ten subfamilies were gathered separately. Of these TIFY members, 179 of the predicted TIFY genes contain both the TIFY domain and the Jas motif (namely JAZ I, JAZ II, JAZ III, JAZ IV, JAZ V, and JAZ VI), indicating that there is a close phylogenetic relationship within the JAZ subfamily. We found that 16 TIFY genes containing partial Jas (lack of a conserved PY) motif and additionally possessing a PPD domain in the N-terminal region were grouped into PPD subfamily; while 38 TIFY genes belong to the ZML subfamily with GATA-Zn finger domain, except for three TIFY genes (BjuTIFY02, BjuTIFY32, and BniTIFY33) (Table S1). Significant sequence similarity outside of the GATA-Zn finger domain might explain its presence in this subfamily. In addition, proteins classified into TIFY I and TIFY II were only contained in the TIFY domain, which included 15 and 7 TIFY proteins, respectively (Table S2). In general, the similar TIFY genes were divided into the same phylogenetic groups, revealing the parallel evolutionary relationship among the A. thaliana, the allotetraploids (B. napus and B. juncea) and their diploid progenitors (B. rapa, B. oleracea, and B. nigra). However, in group JAZ III, there were 16 JAZ subfamily proteins (two in A. thaliana, two in B. rapa, two in B. oleracea, three in B. nigra, three in B. napus and four in B. juncea). In group JAZ IV, there were 28 JAZ subfamily proteins (two in A. thaliana, four in B. rapa, five in B. oleracea, three in B. nigra, seven in B. napus and seven in B. juncea). These results suggest that TIFY family genes might undergo gene loss events in Brassiceae species during the process of polyploidization [27].

2.3. Chromosome Distributions of TIFY Family Genes in Brassiceae Species

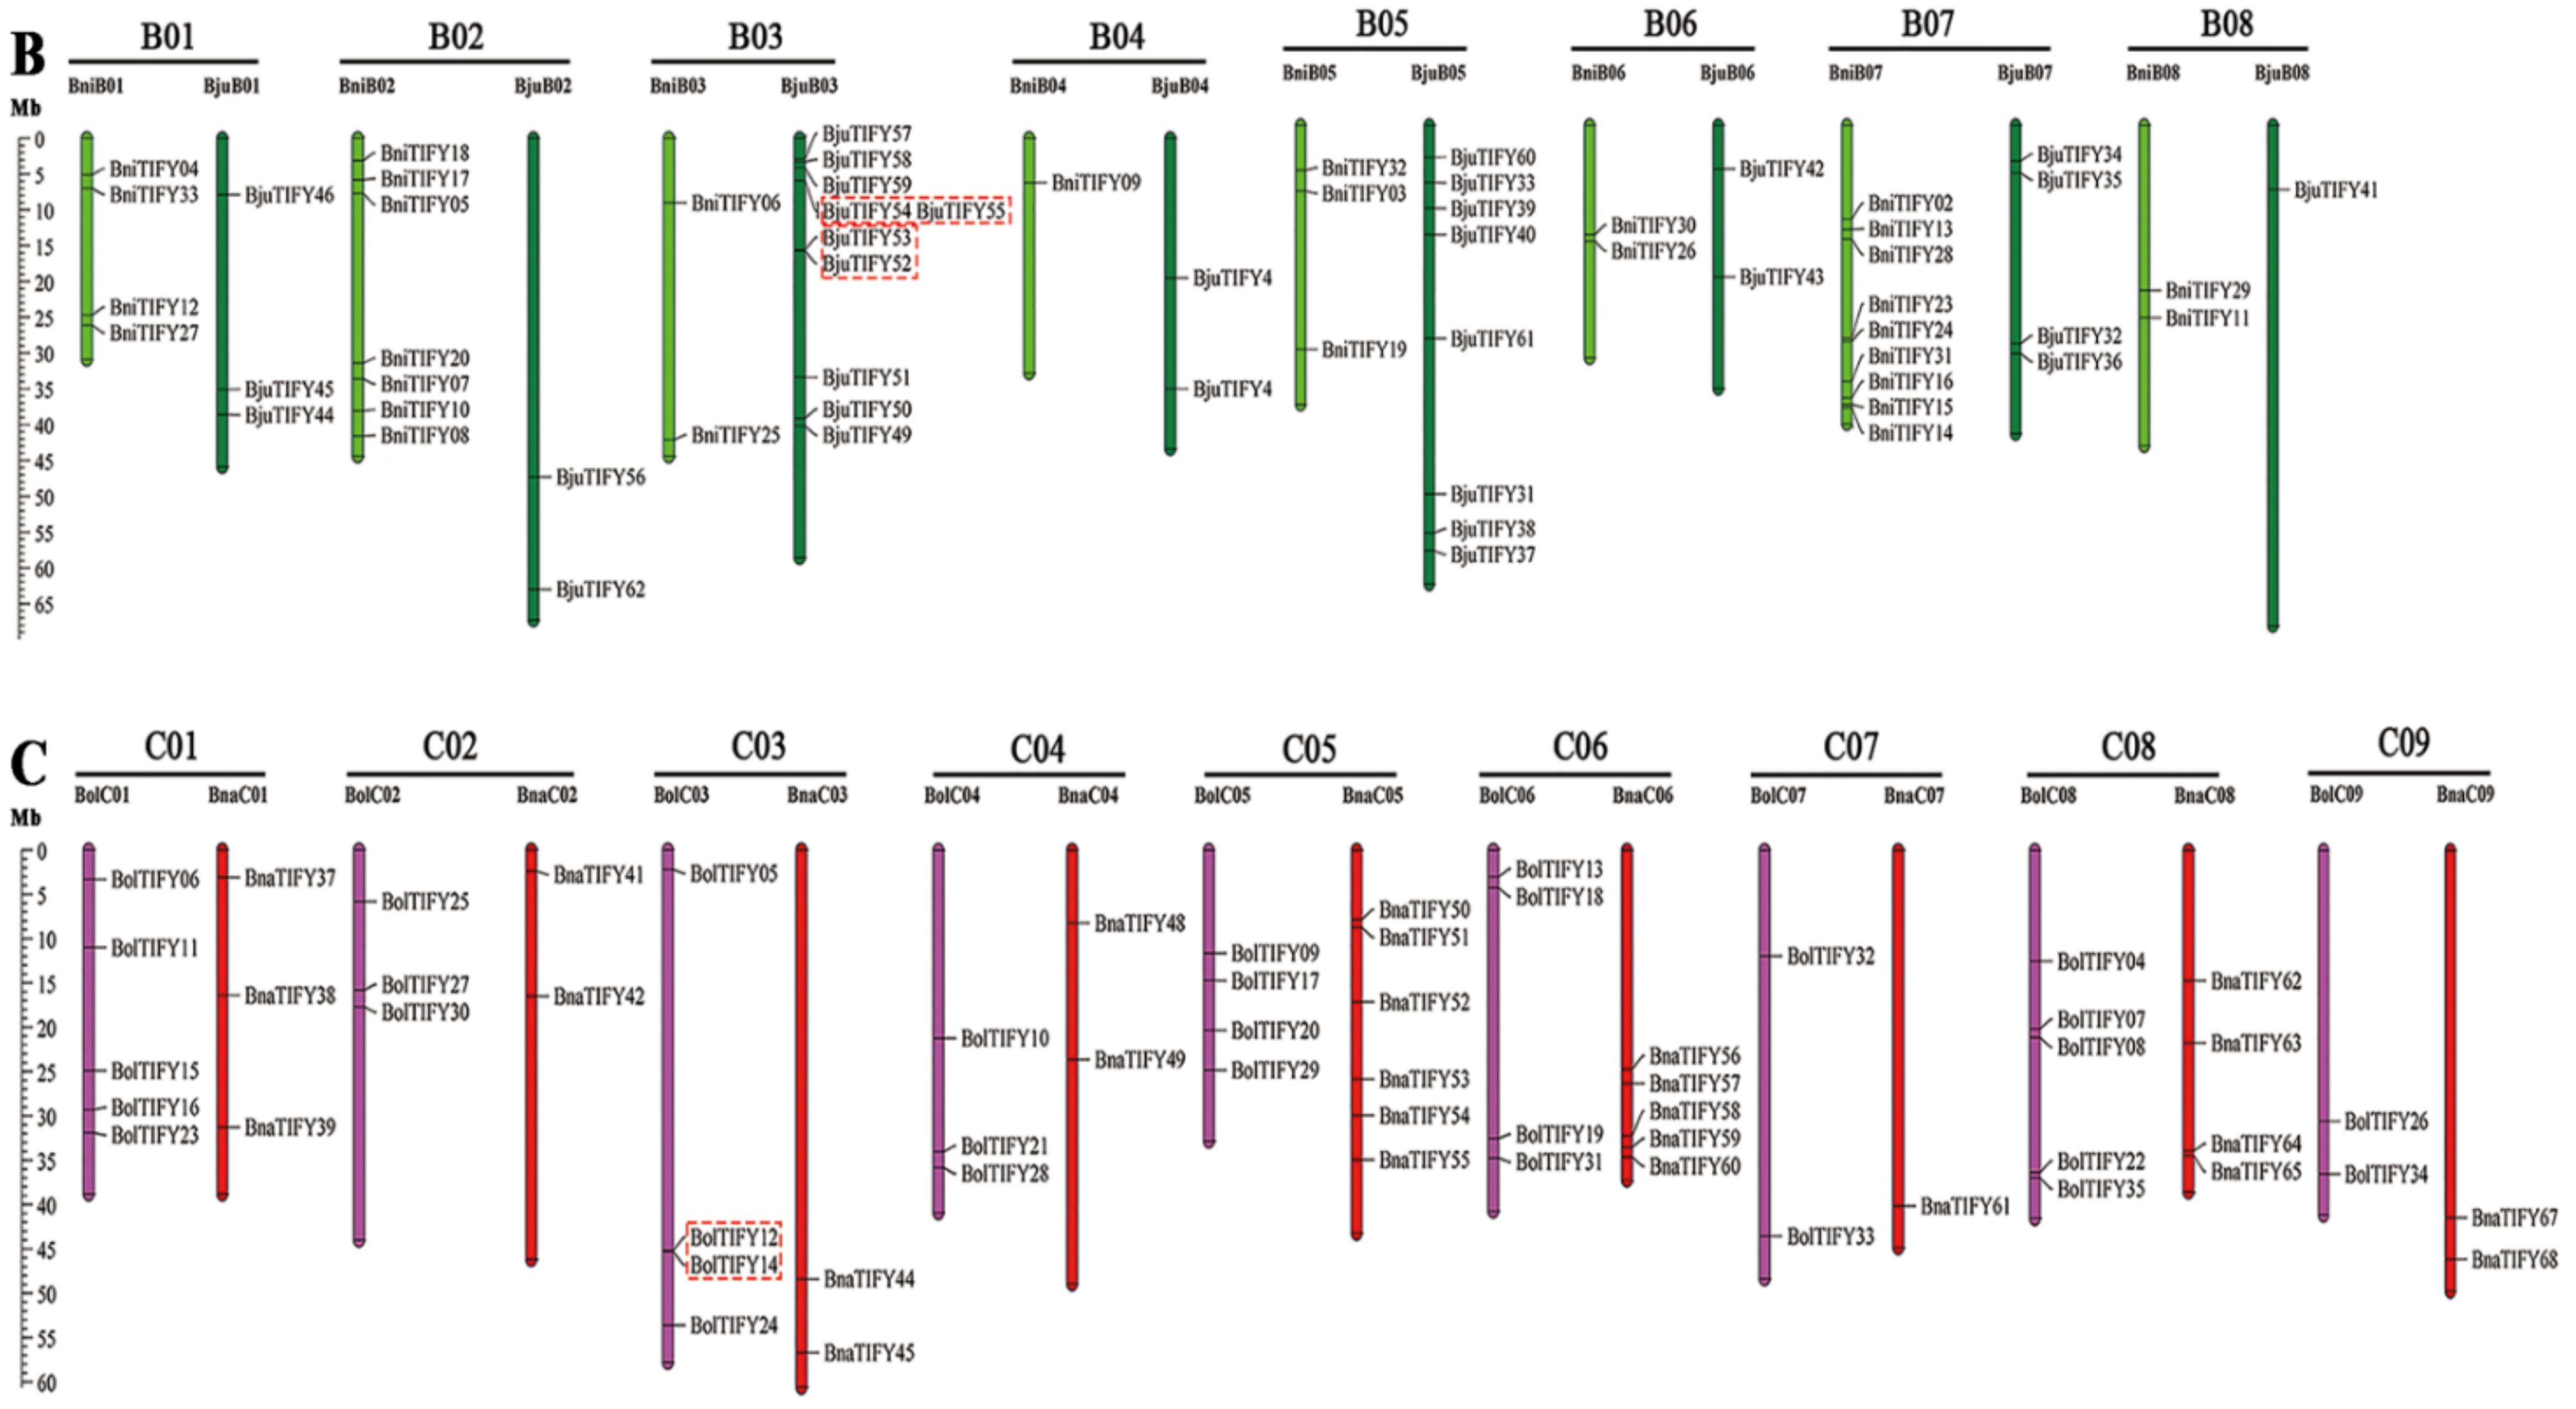
In this study, 220 TIFY genes were mapped to the corresponding chromosomes of Brassiceae species, including the A (99), B (62) and C (59) subgenomes, respectively (Figure 2), while 17 TIFY genes were mapped on the putative random chromosome (Table S2). As shown in Figure 2, all mapped TIFY genes were unevenly distributed on the chromosome, varying from 0 (BjuA04) and 1 (BraA04, BnaA04, BjuA09, BniB04, BjuB08, and BnaC07) to 10 (BjuB03). Meanwhile, five tandem duplication event regions were detected on chromosomes BnaA03 (1), BjuA08 (1), BjuB03 (2), and BolC03 (1), respectively. In addition, a hot spot of TIFY genes was generally more abundant at both ends of the chromosomes (Figure 2). Importantly, these similar TIFY genes generally were located in parallel physical positions among the same subgenome, indicating that extensive collinearity existed among the TIFY genes in Brassiceae species.

2.4. Synteny and Duplicated Gene Analysis of TIFY Genes in Brassiceae Species

Previous studies have shown that the protein-coding genes had large collinearity in Brassiceae species [28,29]. As shown in Figure 3, the retention or loss patterns of orthologous TIFY genes were displayed based on the syntenic relationships between A. thaliana and five Brassiceae species. Meanwhile, we also analyzed the comparative syntenic maps of the A. thaliana, the allotetraploids (B. napus and B. juncea) and their diploid progenitors (B. rapa, B. oleracea, and B. nigra) (Figure S1). Firstly, the number of TIFY genes in the allotetraploid B. napus (70) and B. juncea (64) is almost equal to that of the corresponding diploid B. rapa (35) and B. oleracea (35), and B. rapa (35) and B. nigra (33), indicating that these orthologous TIFY gene pairs have no divergence during polyploidization of Brassiceae species. Secondly, we performed synteny analysis of TIFY genes among A. thaliana and the five Brassiceae species. Herein, a total of 34 BraTIFY genes and 30 BolTIFY genes showed a syntenic relationship with the 17 AtTIFY genes and 59 BnaTIFY genes; 33 BraTIFY genes and 28 BniTIFY genes showed a syntenic relationship with the 17 AtTIFY genes and 61 BjuTIFY genes (Figure 3, Figure S1, Table S2). Furthermore, we identified 53, 46, 62, 109 and 97 orthologous TIFY genes between AtTIFY and BraTIFY, AtTIFY and BolTIFY, AtTIFY and BnaTIFY, BraTIFY and BnaTIFY, and BolTIFY and BnaTIFY, and 43, 78, 113, and 102 orthologous TIFYs between AtTIFY and BniTIFY, AtTIFY and BjuTIFY, BraTIFY and BjuTIFY, and BniTIFY and BjuTIFY (Table S3). These results show that the syntenic TIFY gene pairs were widely distributed on the genomes between A. thaliana and five Brassiceae species, and the TIFY genes had a high degree of retention among the five Brassiceae species during evolution.
In addition, the Ka, Ks, and Ka/Ks ratios for the TIFY gene pairs were separately calculated to predict the evolutionary constraints acting on the TIFY gene family between A. thaliana and five Brassiceae species. Results showed that Ka/Ks ratios were almost less than 1 between the orthologous TIFY gene pairs, except for Bol034224 and BnaA03g04250D, BraA09g057760.3C and BnaC08g37780D, BraA06g013190.3C and BnaA06g11690D, BraA02g020000.3C and BnaC02g20120D, BraA02g021020.3C and BnaA02g15990D, BraA07g029850.3C and BjuA027135 (Table S3). These results support that TIFY genes were subjected to purification selection during evolution.

2.5. Gene Structural and Conserved Motif Analysis of TIFY Family Genes in B. napus

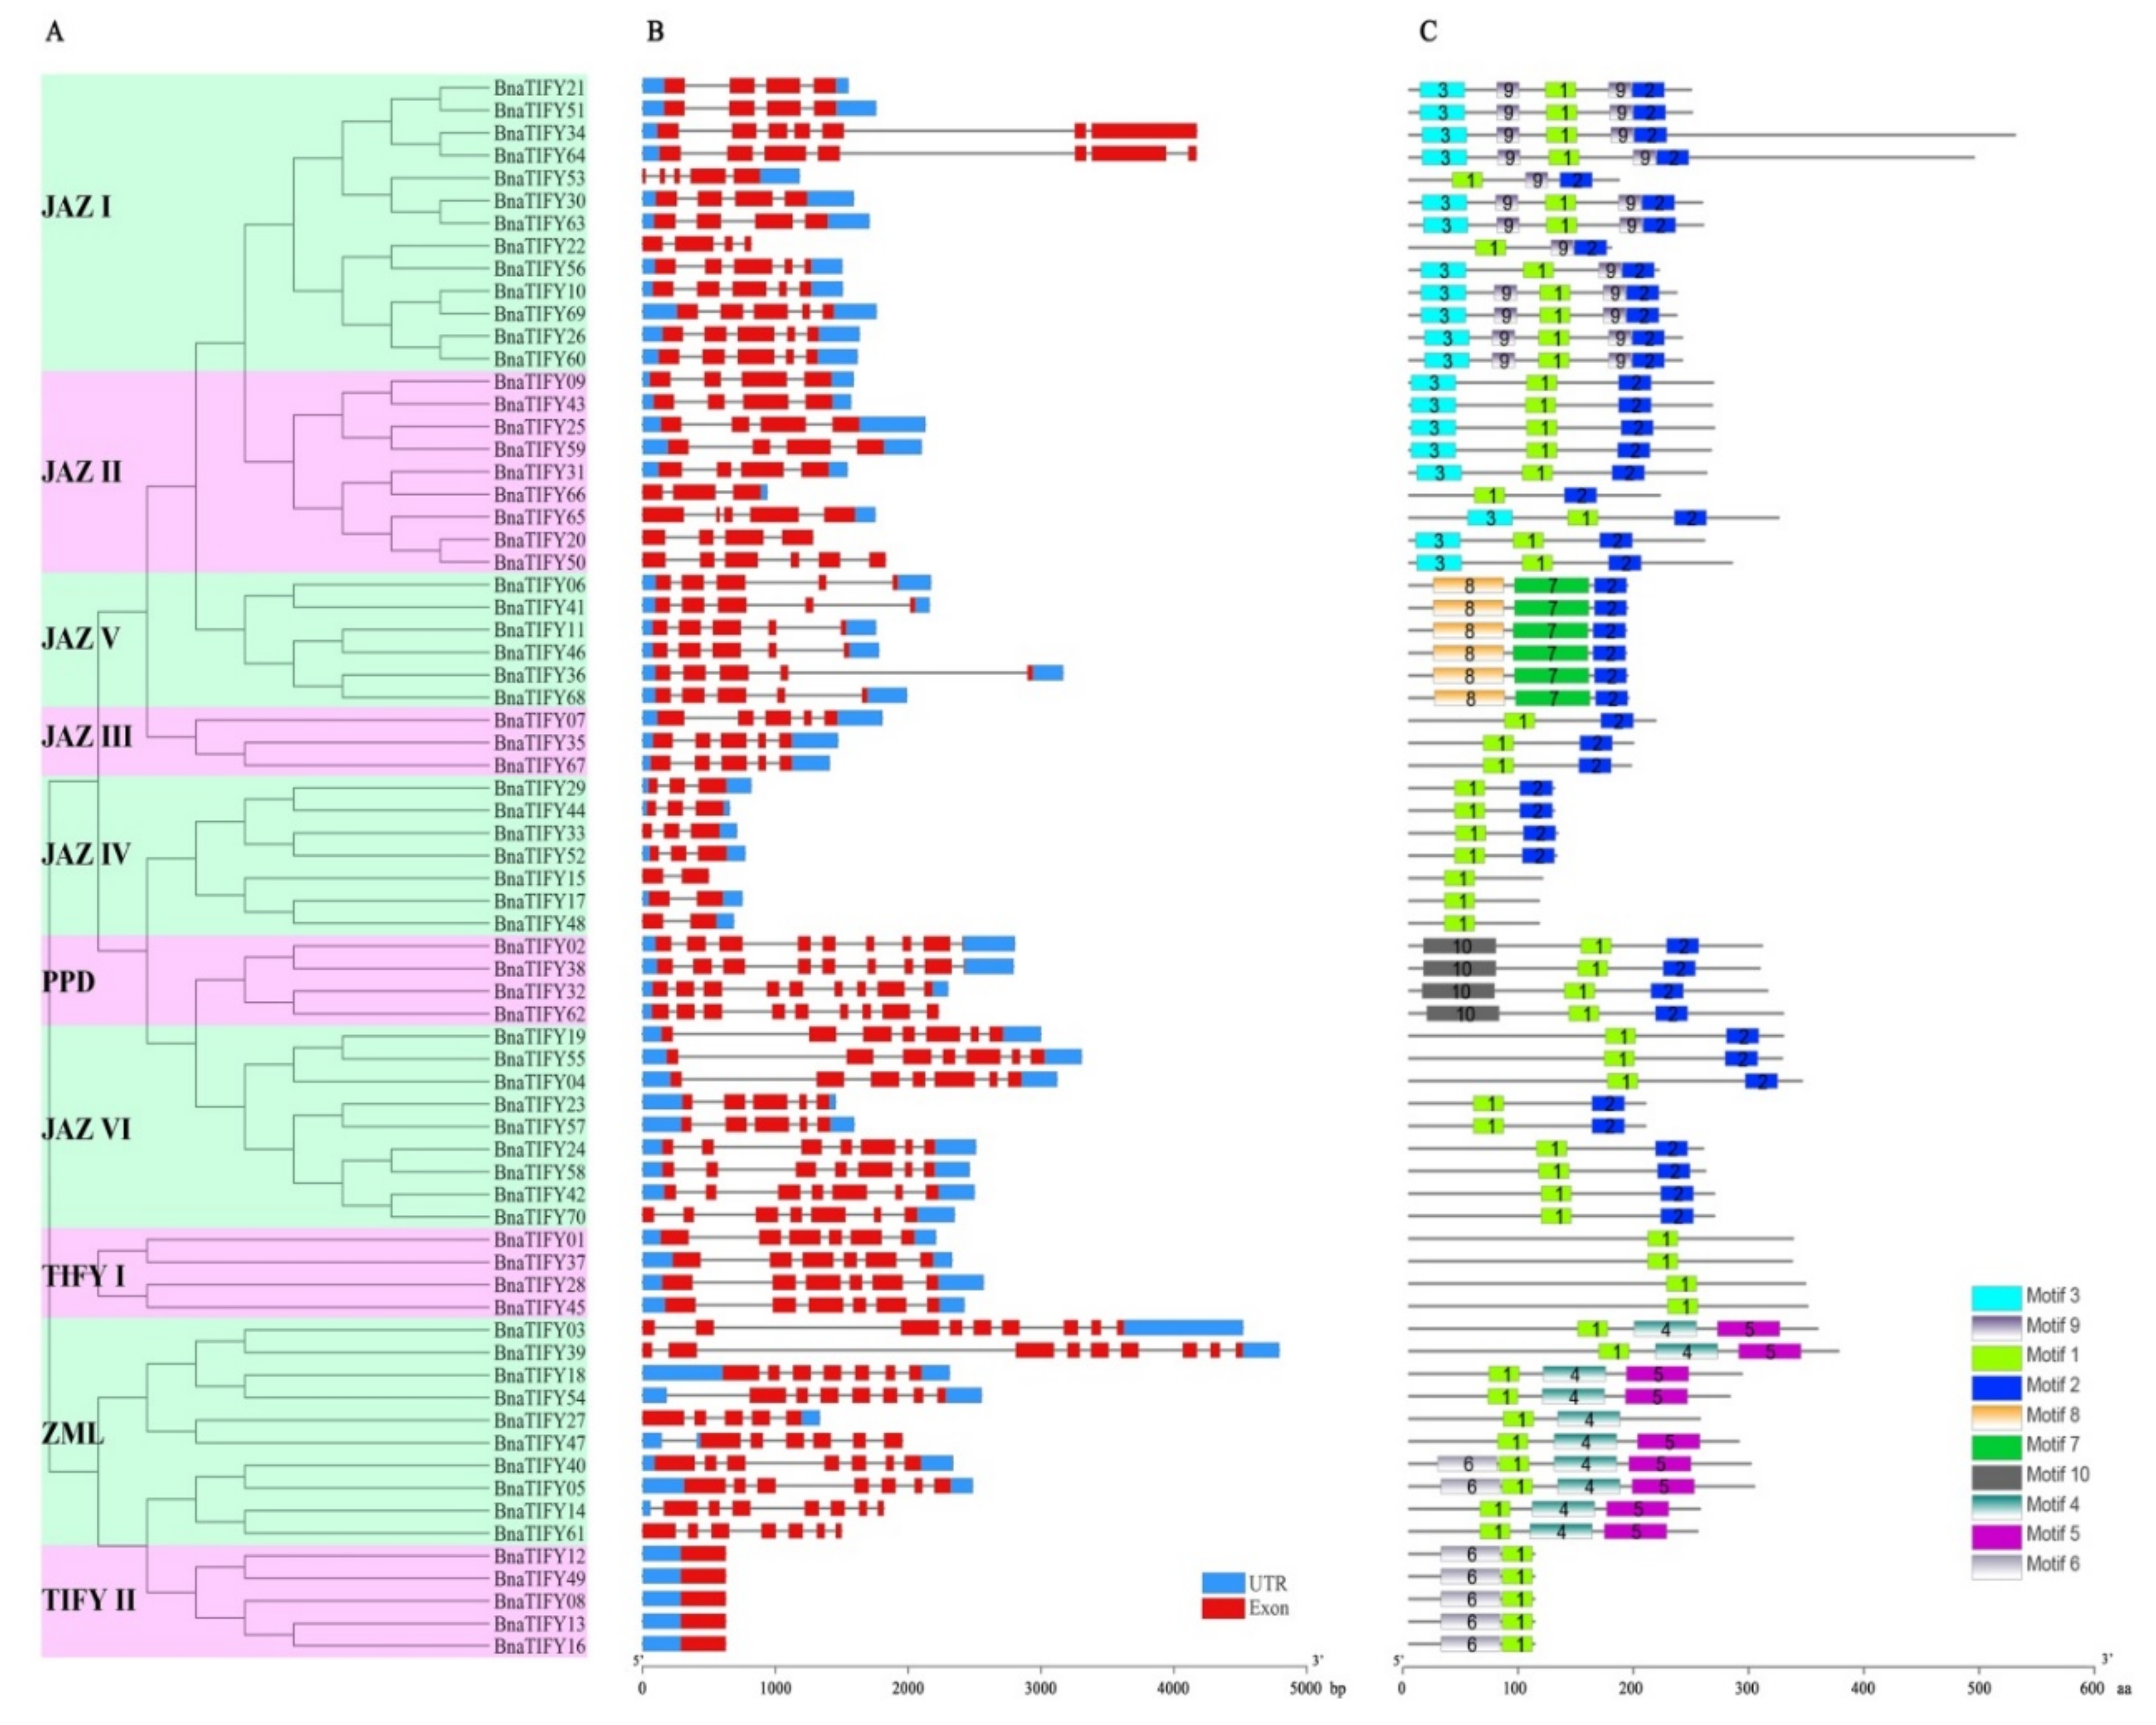
We further explored the structural components of the BnaTIFY genes better understand their evolution in rapeseed based on phylogenetic analysis (Figure 4A). The number of exons in BnaTIFY genes varied from 1 (BnaTIFY08, BnaTIFY12, BnaTIFY13, BnaTIFY16 and BnaTIFY49) to 9 (BnaTIFY03 and BnaTIFY39), showing the consistency in the members of the same subfamily (Figure 4B). However, large divergences were found among TIFY genes in the different subfamily. For example, members of the JAZ IV and TIFY II subgroups contained fewer exons (1 to 3), while the highest exon numbers were found in the PPD subgroup, each member containing nine exons (Figure 4B). The results suggest that exon/intron structure further supports the phylogenetic structures of the TIFY genes.
As expected, the compositions of conserved motifs provide further confirmation of the evolutionary relationships among the BnaTIFY proteins (Figure 4C). In total, 10 motifs were identified and named Motif 1 to Motif 10 (Figure 4C). As mentioned above, the similar patterns of conserved motifs were listed in the same subfamily. Based on the Pfam domain search, all conserved motifs were identified, namely TIFY motif (motif 1 and motif 7), motif 2 (N-terminus of the Jas/CCT domain), motif 4 (CCT domain), motif 5 (GATA zinc-finger domain) motif 9 (C-terminus of the Jas domain), and motif 10 (PPD motif), respectively (Figure 4C, Figure S2). Apparently, motif 1 was the most frequent motif and existed in 64 BnaTIFY members, but motif 7 was specifically detected in the JAZ V subfamily. In addition, motif 4 and motif 5 were usually present in the ZML subfamily, while motif 2 were detected in the largest JAZ subfamily.
Altogether, the phylogenetic groups are consistent with the exon/intron structure and conserved motif compositions, indicating that the TIFY classifications are reliable in this study.

2.6. Expression Profiles of BnaTIFY Genes in B. napus

To explore the possible functions of BnaTIFY genes in rapeseed, we investigated the previously transcriptome sequencing datasets of B. napus cultivar Zhongshuang 11 (ZS11; BioProject ID PRJNA358784). The expression patterns of BnaTIFYs in various tissues, including the root, hypocotyl, cotyledon, stem, leaf, bud, petal, pistil, stamen, seed, seed coat, and silique pericarp (Table S4), were analyzed in this study. As shown in Figure 5, the BnaTIFYs displayed various differential expression levels among these detected tissues, indicating that BnaTIFYs were involved in multiple processes during plant growth and development. Among these, members in JAZ IV, JAZ V and TIFY II had near-to-low expression levels in the detected tissues, except for BnaTIFY12 in group TIFY II, while members in JAZ III showed the highest expression profiles in all the investigated tissues. Other BnaTIFY genes exhibited different expression patterns, suggesting that the BnaTIFY genes play important roles in all stages of growth and development.

2.7. Expression Profiles of BnaTIFY Genes in Response to As3+ and Cd2+ Treatments

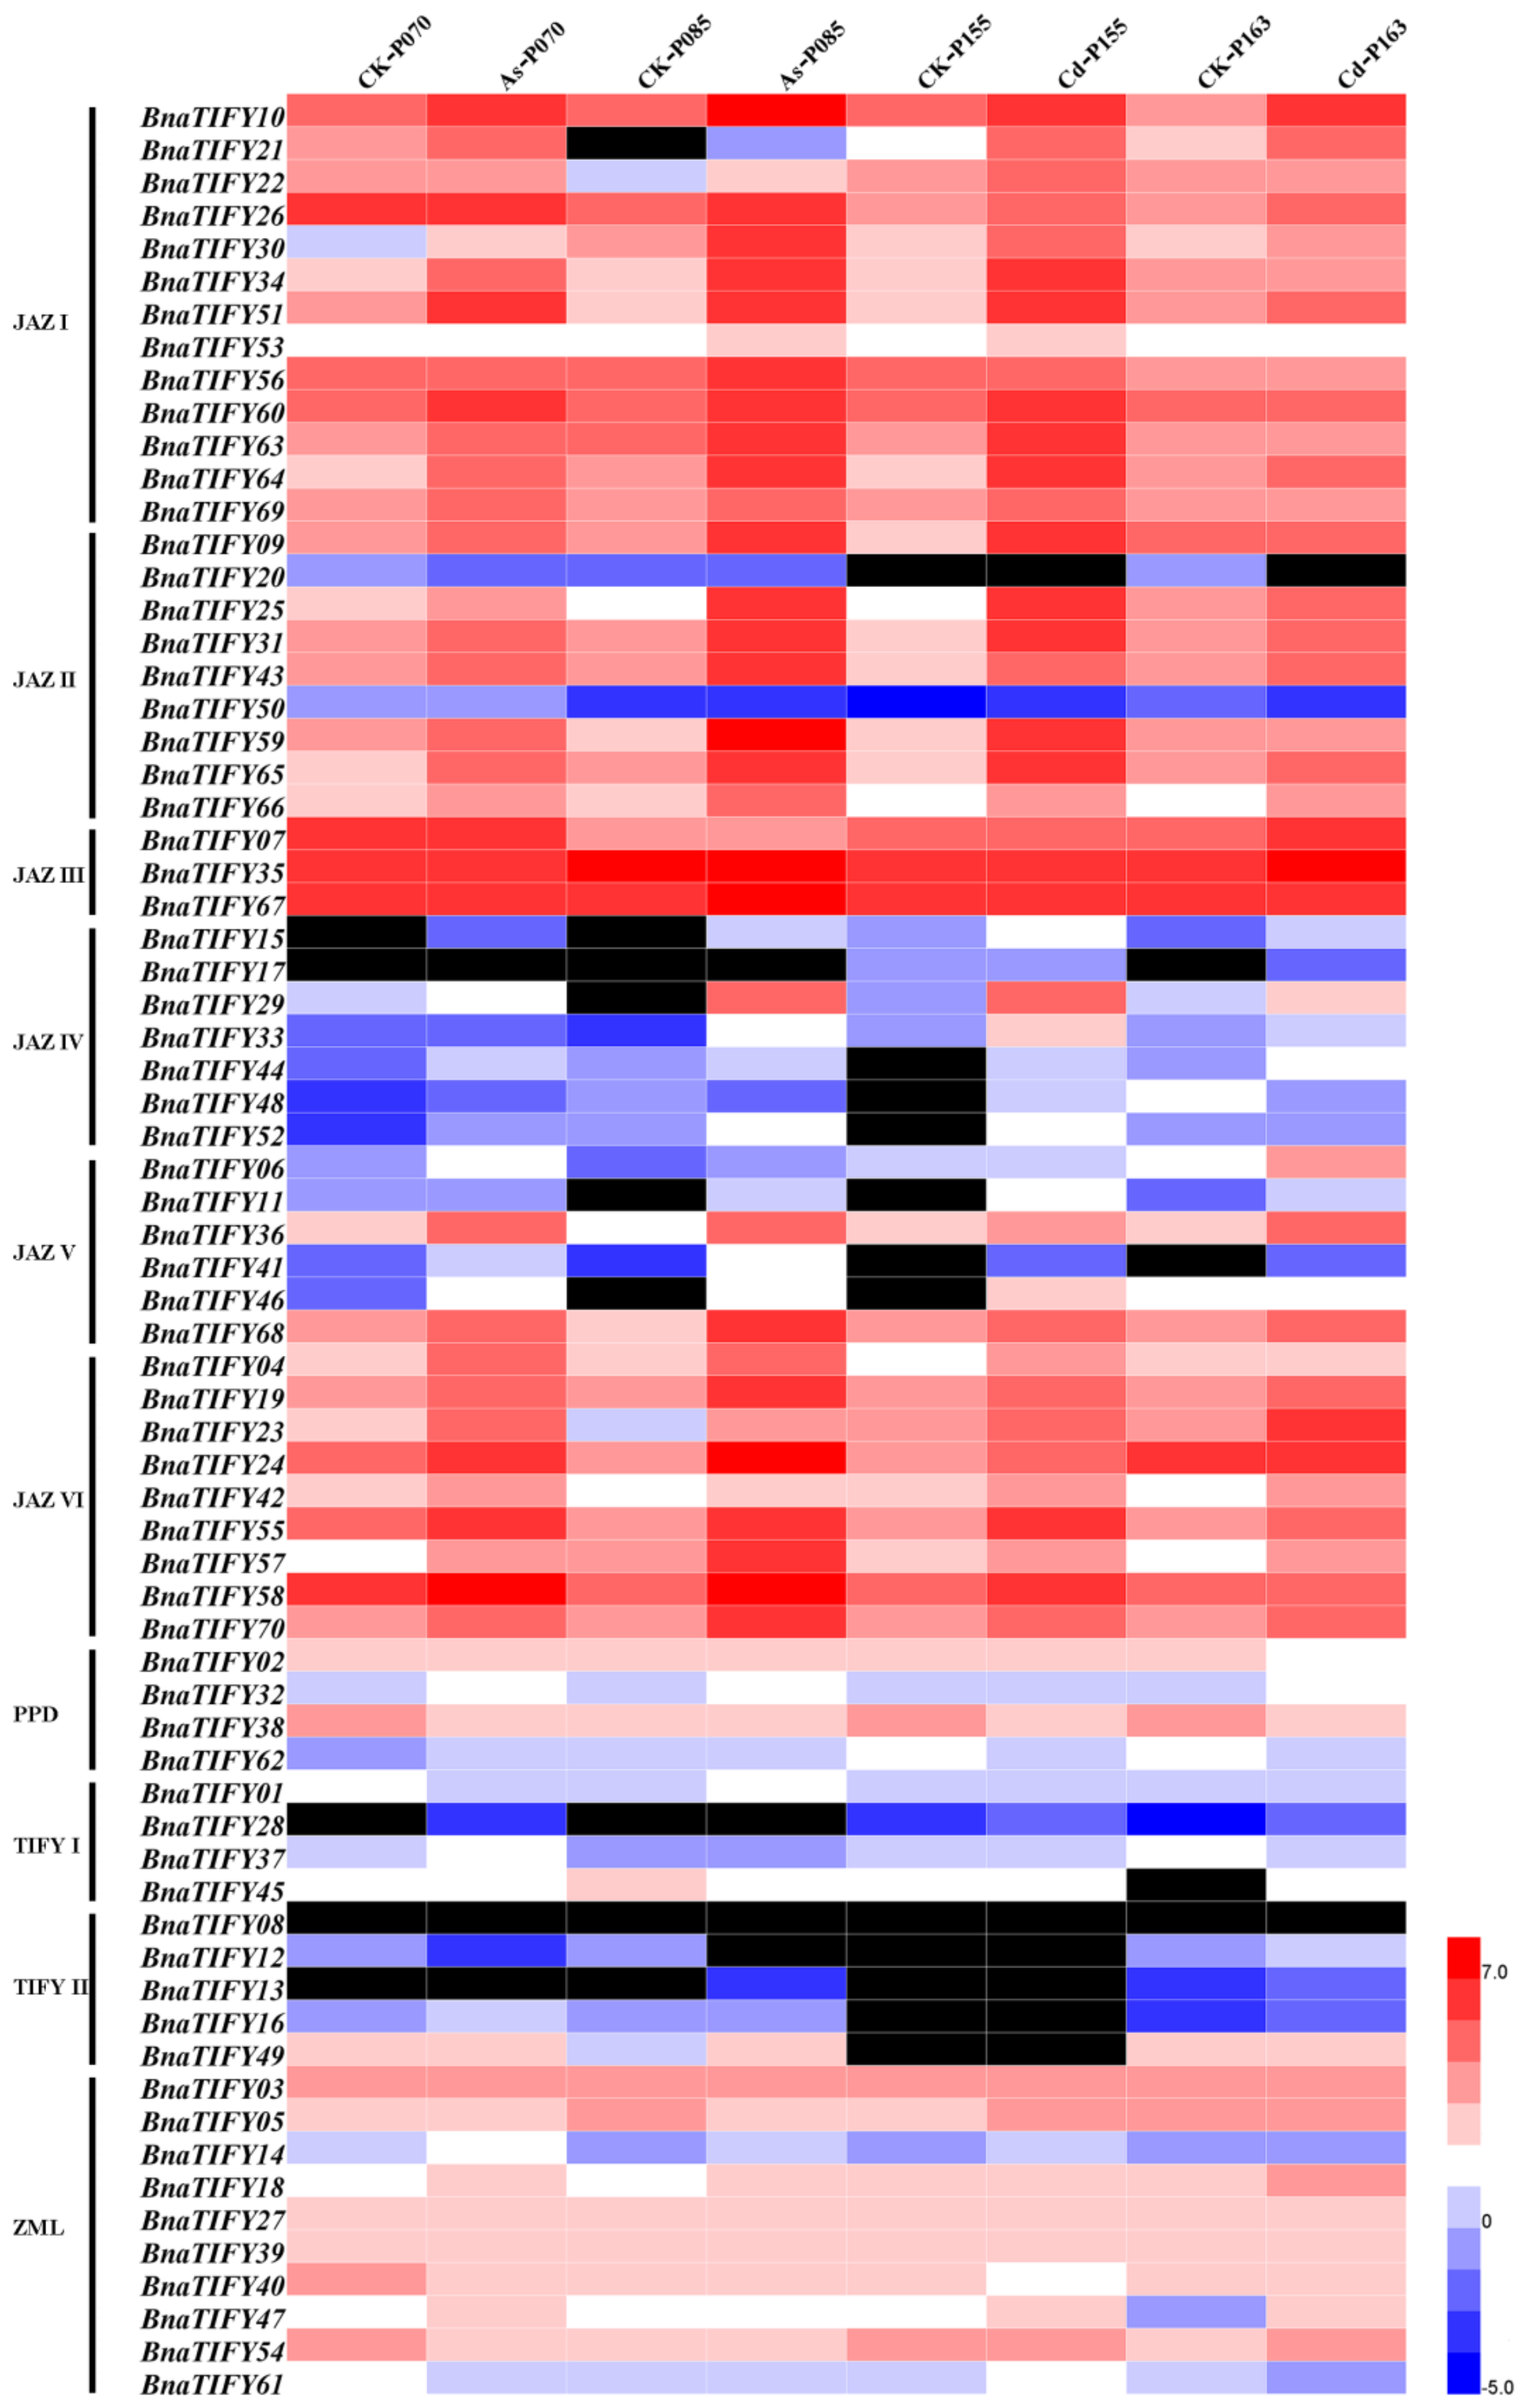
TIFY is a plant-specific protein family with a diversity of functions in plant development and responses to environmental stress [20,23,30]. To identify the response of BnaTIFYs to heavy metal stress, we investigated the expression patterns of BnaTIFY genes in rapeseed of seedling under 15 mg/L As3+ and 30 mg/L Cd2+ treatments. The expression levels of each BnaTIFY gene were determined by FPKM values (Table S5). Interestingly, the transcriptional levels of BnaTIFY genes were simultaneously induced by heavy metal treatment. As shown in Figure 6, most JAZ subfamily genes were strongly induced by heavy metal treatment, whereas others were not.
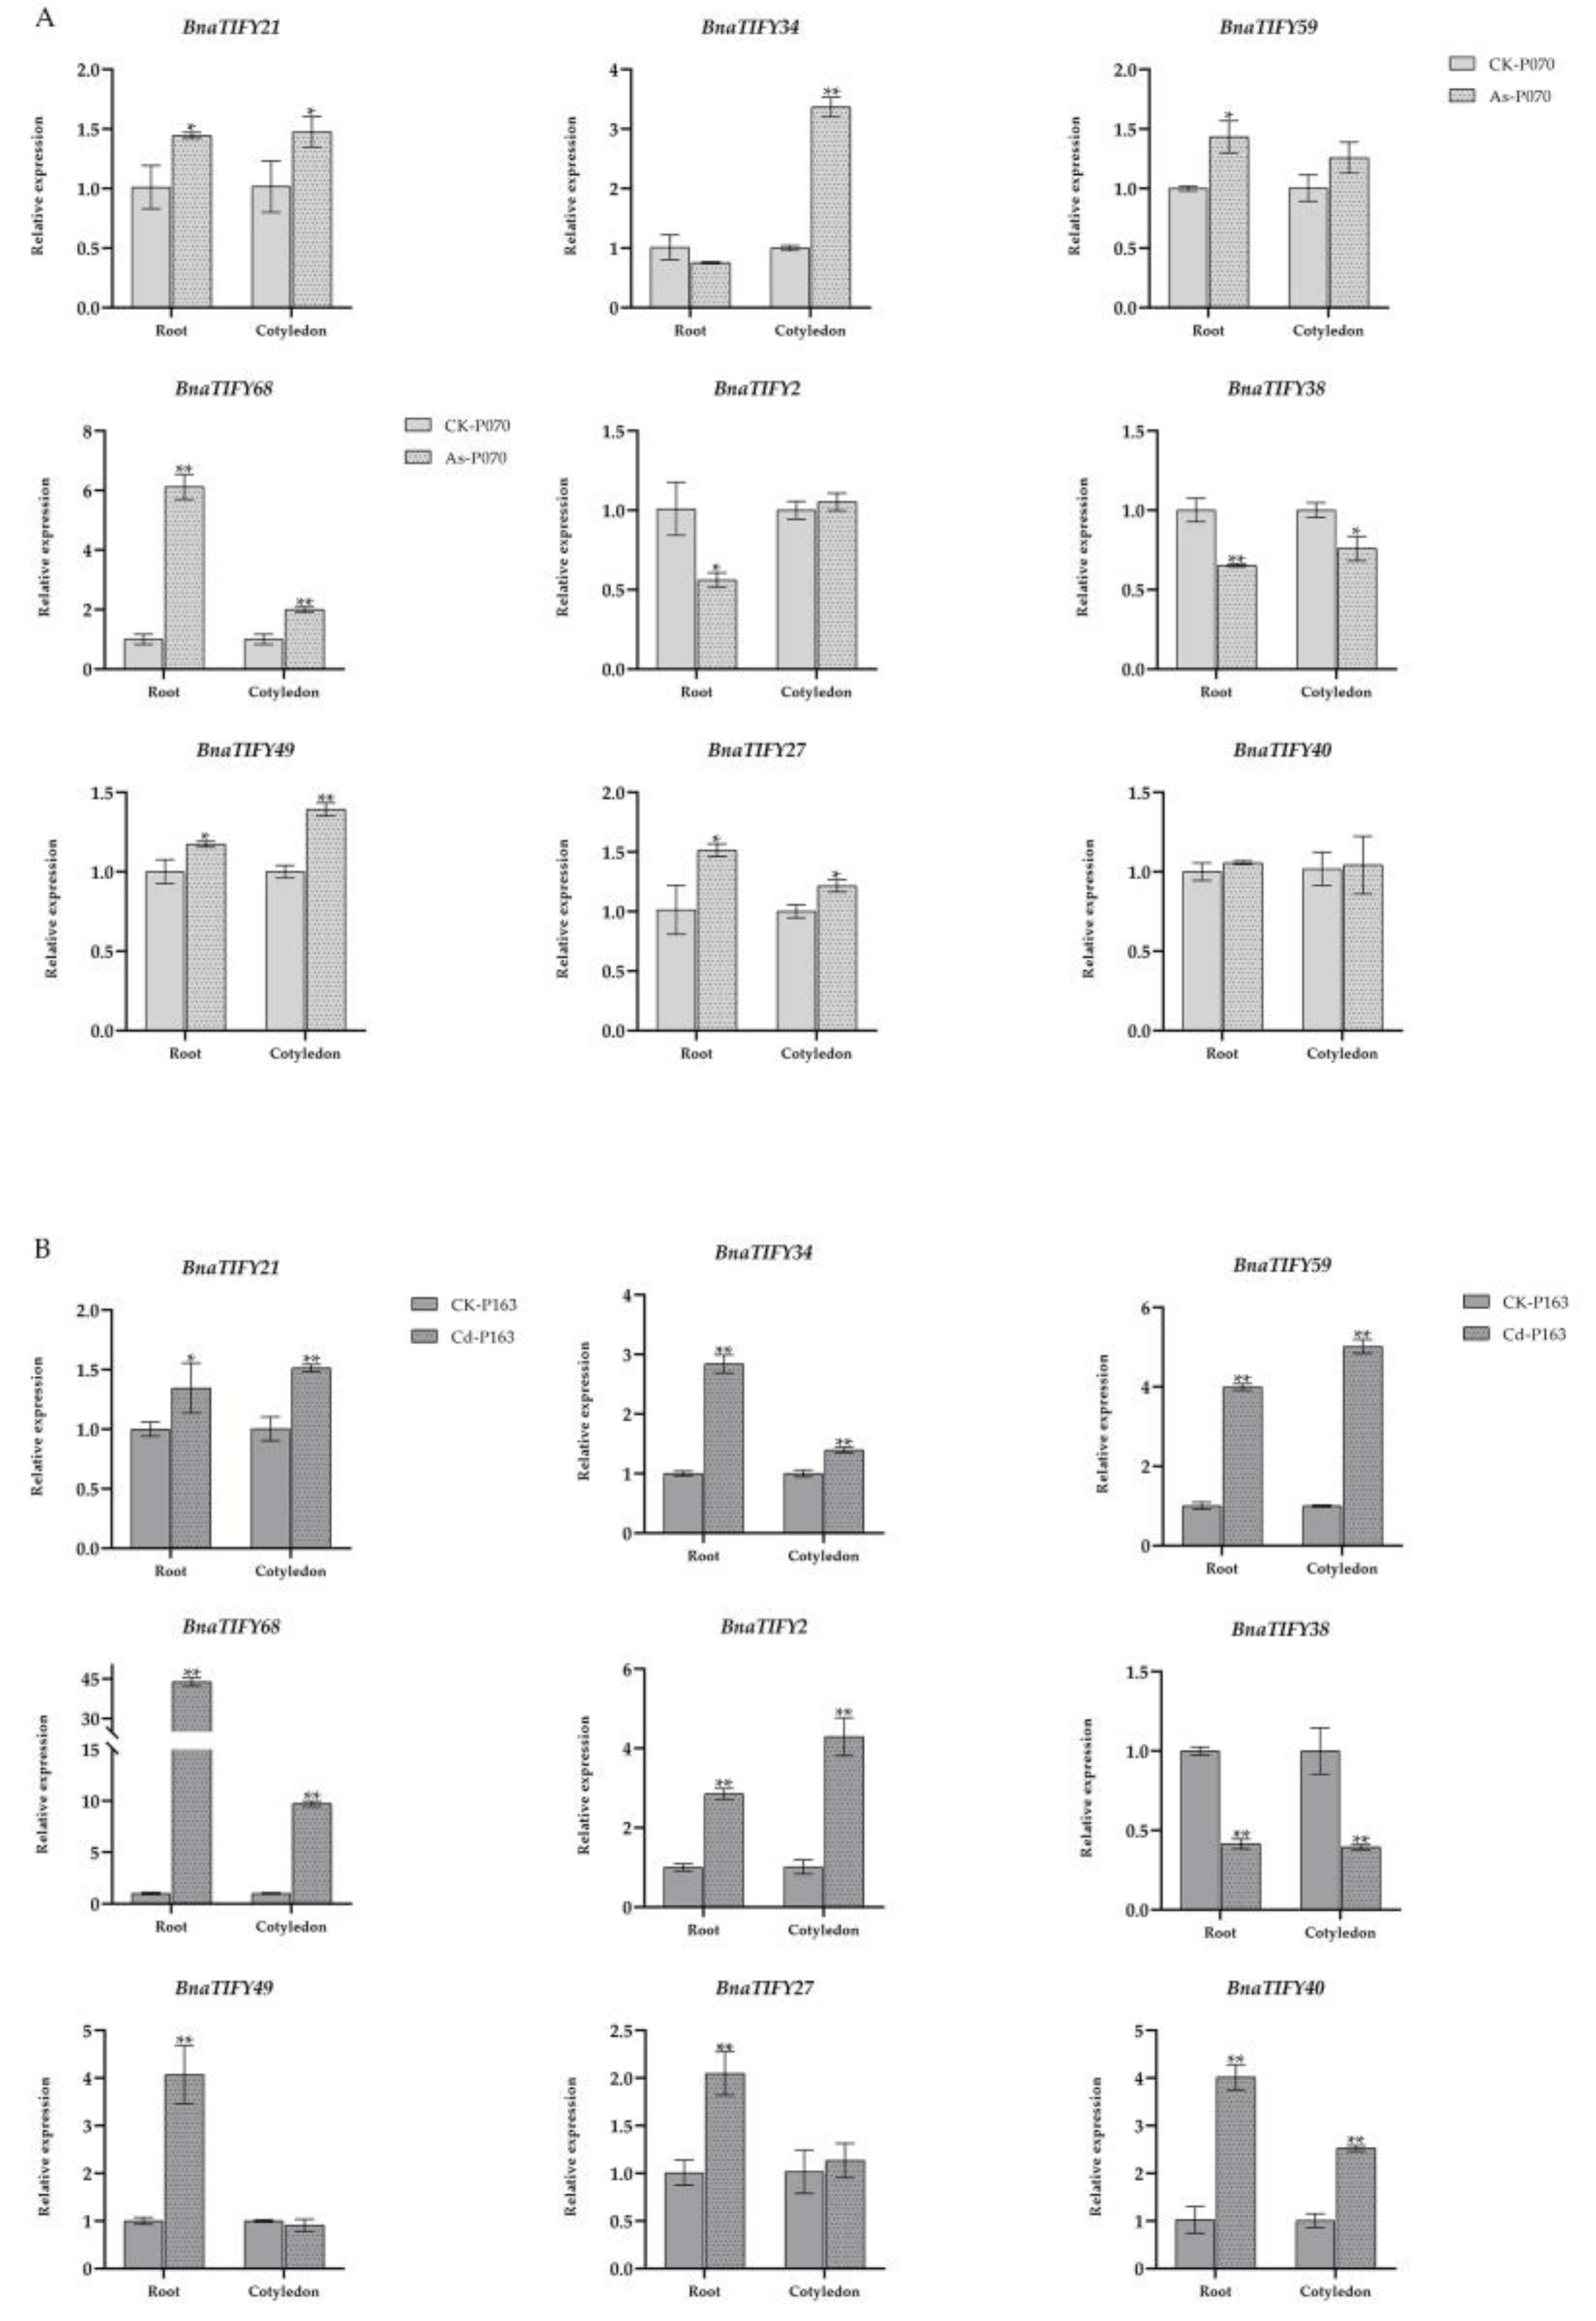
Among them, nine genes, BnaTIFY21 and BnaTIFY34 (JAZ I), BnaTIFY59 (JAZ II), BnaTIFY68 (JAZ V), BnaTIFY02 and BnaTIFY38 (PPD), BnaTIFY49 (TIFY II), BnaTIFY27 and BnaTIFY40 (ZML), were selected to further validate by qRT-PCR analysis (Table S6). Overall, the expression patterns of the BnaTIFYs identified by qRT-PCR were similar to the patterns identified by RNA-seq (Figure 6 and Figure 7). Interestingly, BnaTIFY49 were significantly upregulated under As3+ treatment (Figure 7A), BnaTIFY2, BnaTIFY34 and BnaTIFY59 were significantly upregulated under Cd2+ treatment (Figure 7B). We found that BnaTIFY21 and BnaTIFY68 were significantly highly expressed by As3+ and Cd2+ stress in cotyledons and roots; on the contrary, BnaTIFY38 was significantly repressed, indicating that they have potentially function roles in heavy metal tolerance (Figure 7). In addition, they were also preferentially induced by heavy metal stress in different tissues, e.g., BnaTIFY34 was significantly induced by As3+ in cotyledons, BnaTIFY59 was significantly induced by As3+ stress in roots; BnaTIFY27 and BnaTIFY49 was significantly induced by Cd2+ stress in roots. These results suggest that these genes might have different functions in the plant response to As3+ and Cd2+ stress. Therefore, the specific mechanism via which BnaTIFY genes respond to the heavy metal stress in rapeseed requires further investigation.
In summary, BnaTIFYs have a wide variety of expression patterns in B. napus, most of which could be obviously induced by heavy metals, especially for the JAZ subfamily members. Our results provide important clues for further elucidation of the roles of BnaTIFYs in growth and development, and responding to heavy metal stress in Brassiceae species.

2.8. Cis-Element Analysis of BnTIFY Promotors

Promoter cis-elements play pivotal roles in the transcriptional regulation of genes when plants are under biotic and abiotic conditions. As such, we carried out an analysis of transcription cis-regulatory elements in the 2000 bp regions upstream of TIFY genes transcription start sites in rapeseed, and cis-acting elements associated with abiotic and biotic stress, plant development and growth and phytohormones response were then identified (Table S6). In this study, most BnaTIFY genes possessed the ARE cis-elements (cis-acting regulatory element essential for the anaerobic induction), LTR cis-elements (cis-acting elements involved in low-temperature responsiveness) and MBS cis-elements (MYB binding sites involved in drought-inducibility). Moreover, 19 types of phytohormones responsive elements and 12 types of plant development and growth elements were predicted in the TIFY promoters (Figure S3). In addition, only BnTIFY31, BnTIFY36 and BnTIFY46 contained WUN-motif cis-elements (wound-responsive element) in their promotors (Figure S3, Table S6). These results confirm that the TIFY genes play a major role in stress resistance, plant biological processes and hormone signaling pathways.

3. Discussion

TIFY is the plant-specific family of putative transcription factors controlling a board range of developmental processes and various stress responses in plants [6,18,19,20,21,22,23,24]. Furthermore, the genome-wide analysis of TIFY family genes has been carried out extensively in different species [3,19,20,21,31,32,33,34,35]. However, information on the TIFY family gene is further investigated in Brassiceae species, which is helpful in understanding the resistance mechanisms to heavy metal. In the present study, 237 TIFY genes were identified within five Brassiceae species (B. napus and B. juncea, B. rapa, B. oleracea, and B. nigra). Moreover, the number of TIFY genes in the allotetraploid B. napus (70) and B. juncea (64) is almost equal to the sum of their diploid B. rapa (35) and B. oleracea (35), and B. rapa (35) and B. nigra (33) (Table S2). The results indicate that the number of TIFY genes showed variations among Brassiceae species. In addition, the results support the fact that TIFY genes varies in the complexity genome [34], with 18 in Arabidopsis [3], 20 in rice [20], 24 in poplar [33], 30 in maize [35], 34 in soybean [31] and 49 in wheat [21], and so on. Furthermore, these results also suppose that TIFY genes had greatly expanded in Brassiceae species, as well as that most family genes had undergone the numbers of the duplicated genes among them since their divergence from the common ancestor [36,37,38]. Correspondingly, we found that the highly strong purifying selection were predominately in most TIFY gene pairs based on the Ka/Ks values (Table S3).
Previously results showed that the TIFY family was divided into four major groups (ZML, TIFY, PPD and JAZ subfamilies) [3]. As anticipated, 255 identified TIFY proteins could be also classified into four major groups (ZML, TIFY, PPD and JAZ group) with ten subgroups (JAZ I to JAZ VI, PPD, TIFY I, TIFY II, and ZML) (Figure 1), indicating that TIFY genes had the functional conservation in the same group. In addition, the numbers in each subgroup varied from seven in TIFY II subgroup and 44 in JAZ I subgroup (Figure 1, Table S2), but further analysis of intron/exon patterns, motif structures showed the special subfamily characteristics with phylogenetic tree results in Brassiceae species (Figure 3). The results led us hypothesize that they may be highly conservative in their potential functions within the same groups. Accordingly, we could systematically predict the distinct function of the TIFY family members based on other syntenic orthologs in different species.
Numerous studies have revealed that TIFY family genes were widely responsible for plant growth and developmental processes in different tissues [18,19,22,32,39]. In the present study, we constructed a heatmap based on the relative expression levels of TIFYs in different B. napus ZS11 tissues. Our data revealed that the expression patterns of TIFY family genes showed obvious differences in the detected tissues (Figure 5), indicating that they may have differential functional roles across the whole of the development stages in rapeseed, of which the TIFY family genes in JAZ III subfamily had the highly expression levels in all tissues (Figure 5), indicating that they may be indispensability in rapeseed growth and development. Whereas JAZ VI subgroup members were specifically expressed in leaves (Figure 5), suggesting that these TIFY genes may play positive roles in leaves. Additionally, extensive evidence has reported the functional role of TIFY genes that are mainly responsible for various stress environments. For example, OsJAZ could be evidently induced by various abiotic stresses, including drought, salinity and low temperature, and OsTIFY11a could increase the stress tolerance in rice [20]. Similarly, GaJAZ5 was found to improve drought resistance, and GsTIFY10a may play positive roles in plant tolerance to bicarbonate stress [40]. Recently, results showed that the BnaJAZ subfamily of genes could be predominantly induced by different abiotic/biotic stresses and hormones in rapeseed [41], which showed similar patterns in B. rapa [42] and B. oleracea [43]. In this study, our findings suppose that all TIFY family genes had a tight evolutionary and phylogenetic relationship (Figure 1 and Figure 4), and may share similar functions in the same subgroup. Therefore, the potential functional of BnaTIFY family genes that participate in plant stress tolerance can be predicted based on the previous description.
To date, heavy metal contamination has acted as one important constraint on crop productivity and quality [44]. Moreover, numerous evidence has supported that Brassiceae species have high tolerance to heavy metals [45], and are considered to be heavy metal accumulators [26]. Despite the fact that TIFY family genes are widely involved in environmental stress tolerance [20,40,41], few reports on TIFY family genes deal with heavy metal tolerance. In the current study, we analyzed the expression patterns of BnaTIFYs in response to As3+ and Cd2+ treatment. Obviously, most of the JAZ subgroup members were strongly induced by heavy metal stresses, while the PPD, TIFY and ZML subfamilies were slightly or not induced at all by infection with heavy metal stresses (Figure 6), suggesting that BnaTIFYs in the JAZ group predominantly the same ability as rapeseed in adapting to heavy metal stress. The results were further confirmed by qRT-PCR analysis, pointing to the reliability of our results. Importantly, we found that BnaTIFY21 and BnaTIFY68 were significantly more highly expressed by As3+ and Cd2+ stress in cotyledons and roots; on the contrary, BnaTIFY38 was significantly repressed, suggesting that they played vital roles in responding to the heavy metal stress. Taken together, the present study systematically investigated the characterization of TIFY family genes in Brassiceae species, and is focused on the expression profiles of BnaTIFY family genes in various tissues and when responding to heavy metal stress, laying a solid foundation for further exploration of the roles of TIFY family genes in heavy metal tolerance.

4. Materials and Methods

4.1. TIFY Family Genes Identification and Annotation

To identify TIFYs, the genome and protein sequences of A. thaliana, and Brassiceae species were downloaded from the TAIR database (https://www.arabidopsis.org/), the Brassica Database (BRAD, http://brassicadb.cn) and the Genoscope database (https://www.genoscope.cns.fr/brassicanapus/ (30 August 2014)). Two approaches were performed to identify the members of the TIFY gene family. First, previously identified 18 AtTIFY sequences from A. thaliana were used as queries to identify the candidate TIFY members in Brassica species via a BLASTp search (E value < 10−5). We then examined the conserved domain of the putative TIFY genes by the conserved domain database (CDD) of the National Center for Biotechnology Information (NCBI, https://www.ncbi.nlm.nih.gov/Structure/cdd) [46], and discarded the redundant genes without the TIFY domain. Second, the hidden Markov model (HMM) profiles of the TIFY domain (PF06200), Jas (PF09425) and CCT (PF06203) motifs were used to search putative TIFY genes in the A. thaliana and Brassiceae species using HMMER 3.0 software (http://hmmer.org/). The default parameters were adopted and the cutoff value was selected as an E value < 1e−6. In all, all of the putative TIFY genes were manually confirmed as having the TIFY domain, and used for further analysis. The number of amino acids, molecular weight (kDa), isoelectric point (pI) values, and stability index of each TIFY protein sequence were predicted using the ExPASy server (http://expasy.org). The subcellular locations were predicted using Plant-mPLoc in Cell-PLoc 2.0 (http://www.csbio.sjtu.edu.cn/bioinf/Cell-PLoc-2/ (30 May 2010)).

4.2. Sequence Analysis of TIFY Gene Family

Multiple alignments of TIFY proteins from A. thaliana and various Brassica species, including B. rapa, B. oleracea, B. napus, B. juncea, and B. nigra, were subjected to ClustalW software with default settings [47]. To illustrate the evolutionary relationships of the TIFYs in Brassiceae species, a neighbor-joining (NJ) phylogenetic tree was generated using the MEGA program (Tokyo Metropolitan University, Tokyo, Japan) with the Jones-Taylor-Thornton (JTT) + invariant sites (I) + Gamma (G) substitution model and a bootstrap test with 1000 replicates [48]. The phylogenetic trees were visualized using Figure Tree v1.4.2 (http://tree.bio.ed.ac.uk/software/figtree/ (31 July 2014)). The 2000 bp region upstream of the translation start sites of each TIFY gene was acquired from Brassica database (BRAD) as a promoter sequence, and the cis-elements were analyzed using the PlantCARE website (http://bioinformatics.psb.ugent.be/webtools/plantcare/html/ (30 September 2021)).

4.3. Conserved Motif Gene Structure Analysis of TIFY Gene Family

The conserved motifs in the TIFY family genes were analyzed using the online program Multiple Expectation Maximization for Motif Elucidation (MEME v4.12.0, http://memesuite.org/tools/meme (30 September 2021)) with the following parameters: number of repetitions any, maximum number of motifs 10; and optimum width of each motif between 6 and 300 residues [49]. The exon/intron structures of the TIFYs were analyzed using the Gene Structure Display Server 2.0 (GSDS 2.0, 30 September 2021), and which were visualized using TBtools software (https://github.com/CJ-Chen/TBtools (30 March 2020)) [50].

4.4. Chromosomal Locations, Tandem Duplication and Synteny of TIFY Gene Family

The position information of TIFYs were obtained from the Brassiceae genomic sequence annotation, and mapped to the corresponding chromosomes using MapChart v2.0 [51]. The gene duplication of TIFYs were analyzed by TBtools_JRE1.6 with default settings, and the tandemly duplicated genes of TIFY were identified according to their physical locations on individual chromosomes. Then the nonsynonymous (Ka) substitution rate and synonymous (Ks) replacement rate, and Ka/Ks ratio were used to estimate the selective pressure on the dataset. To well understand the synteny relationship of the orthologous TIFY genes, the syntenic analysis maps were generated using TBtools-Multiple Synteny Plotter with default parameters. Finally, the homologous genetic relationships of TIFY genes were displayed using TBtools-Amazing Super Circos program among different species [50].

4.5. Expression Profiles Analysis of TIFY Gene Family

Previously reported RNA-seq data (BioProject ID: PRJNA358784) were used to comprehensively investigate the spatio-temporal expression pattern of BnaTIFYs that participate in the throughout entire growth. The rapeseed cultivar “Zhongshuang 11 (ZS11)” were used as plant material. To investigate the expression pattern in response to heavy metal stress treatments, the expression profiles of BnaTIFYs were further analyzed using published RNA-seq dataset underAs3+ and Cd2+ stress [52]. The plant materials and treatments were as described previous [52]. All the relative expression levels of TIFYs were calculated and normalized as FPKM values (Fragments Per Kilobase of transcript per Million mapped reads) with TopHat and Cufflinks [53]. Finally, the heatmaps of TIFYs expression were created by TBtools [50] based on the normalized log2(FPKM).

4.6. Quantitative qRT-PCR Validation Analysis

The total RNA Extraction and qRT-PCR Analysis were performed as our described previous results [54]. In brief, total RNA was extracted from the samples using a DNAaway RNA Mini-prep Kit (Sangon Biotech, Shanghai, China), then the qualified total RNA was synthesized first-strand complementary DNA (cDNA) with an RNA PCR Kit (AMV) Ver. 3.0 (Takara, Dalian, China). We subsequently performed qRT-PCR analysis using SYBR Premix Ex Taq II (Takara, Dalian, China) on a Bio-Rad CFX96 Real Time System (Bio-Rad Laboratories, Hercules, CA, USA) as previously described [52]. Finally, TIFY gene expression levels were normalized using a reference gene BnACTIN7 (EV116054) [55] via the 2−∆∆Ct method. Three biological replicates were used in this study. The primers are listed in the Table S7.

5. Conclusions

In the present study, a total of 237 putative TIFY proteins with 10 groups were identified from five Brassiceae species based on their phylogenetic relationships with TIFY proteins in A. thaliana and Brassiceae species. Our duplication and synteny analysis revealed that segmental and tandem duplications led to the expansion of the TIFY gene family during the process of polyploidization, and most of these TIFY family genes were subjected to purifying selection after duplication. Finally, we explored the expression profiles of the BnaTIFY family genes in specific tissues, at various developmental stages, and in response to heavy metal stress via RNA-seq analysis and qRT-PCR. The spatial and temporal expression patterns indicated that JAZ III subfamily members were highest in all tissues, and JAZ subfamily members were strongly induced by heavy metal stresses. BnaTIFY34, BnaTIFY59, BnaTIFY21 and BnaTIFY68 were significantly upregulated mostly under As3+ and Cd2+ treatment, implied that they actively respond to expression under heavy mental stress. Our results may contribute to further exploration of the TIFYs, and provided valuable information for further studies of TIFYs in plant tolerance to heavy metal stress.

Supplementary Materials

The following are available online at https://www.mdpi.com/article/10.3390/plants11050667/s1, Figure S1: Collinearity analysis of TIFY family genes among A. thaliana and five Brassiceae species, Figure S2: Protein motifs identified in different B. napus TIFY proteins through MEME motif searching, Figure S3: Predicted cis-elements in BnTIFY promoters. Table S1: Pfam results of TIFY family genes identified from A. thaliana and five Brassiceae species, Table S2: Features of TIFY family genes identified from A. thaliana and five Brassiceae species, Table S3: The orthologous TIFY gene pairs among A. thaliana and five Brassiceae species, Table S4: B. napus ZS11 tissues and organs used in this study, Table S5: The relative expression values of BnaTIFYs by RNA-Seq analysis under As3+ and Cd2+ treatment, Table S6: The detailed information of cis-acting analysis among BnTIFY family gene promoters in B. napus, Table S7: Primers used to qRT-PCR analysis in this study.

Author Contributions

Conceptualization, F.S. and Z.C.; methodology, Q.Z. and R.H.; software, S.S. and N.Y.; investigation, Y.T., S.C. and Z.C.; resources, Y.W. and K.L.; data curation, Y.T. and S.C.; writing—original draft preparation, F.S. and Z.C.; writing—review and editing, C.Q., Y.L. and K.L.; supervision, J.L., W.H. All authors have read and agreed to the published version of the manuscript.

Funding

This work was funded by the National Science Foundation of China (31830067, 32072093), the China Agriculture Research System of MOF and MARA, the Innovation and Entrepreneurship Training Program for graduates of Chongqing (CYS21124), and the 111 Project (B12006).

Institutional Review Board Statement

Not applicable.

Informed Consent Statement

Not applicable.

Data Availability Statement

RNA-seq of B. napus variety Zhongshuang 11 (ZS11) in distinct tissues at different developmental stages are available in the NCBI Sequence Read Archive (SRA) database (BioProject ID: PRJNA358784). All other datasets supporting the results of this article are included within the article and its Additional files.

Conflicts of Interest

The authors declare no conflict of interest.

References

  1. Nishii, A.; Takemura, M.; Fujita, H.; Shikata, M.; Yokota, A.; Kohchi, T. Characterization of a novel gene encoding a putative single zinc-finger protein, ZIM, expressed during the reproductive phase in Arabidopsis thaliana. Biosci. Biotechnol. Biochem. 2000, 64, 1402–1409. [Google Scholar] [CrossRef] [PubMed] [Green Version]
  2. Vanholme, B.; Grunewald, W.; Bateman, A.; Kohchi, T.; Gheysen, G. The tify family previously known as ZIM. Trends Plant Sci. 2007, 12, 239–244. [Google Scholar] [CrossRef] [PubMed]
  3. Bai, Y.; Meng, Y.; Huang, D.; Qi, Y.; Chen, M. Origin and evolutionary analysis of the plant-specific TIFY transcription factor family. Genomics 2011, 98, 128–136. [Google Scholar] [CrossRef] [PubMed] [Green Version]
  4. Staswick, P. JAZing up jasmonate signaling. Trends Plant Sci. 2008, 13, 66–71. [Google Scholar] [CrossRef]
  5. Chini, A.; Boter, M.; Solano, R. Plant oxylipins: COI1/JAZs/MYC2 as the core jasmonic acid-signalling module. FEBS J. 2009, 276, 4682–4692. [Google Scholar] [CrossRef] [PubMed]
  6. Shikata, M.; Matsuda, Y.; Ando, K.; Nishii, A.; Takemura, M.; Yokota, A.; Kohchi, T. Characterization of Arabidopsis ZIM, a member of a novel plant-specific GATA factor gene family. J. Exp. Bot. 2004, 55, 631–639. [Google Scholar] [CrossRef]
  7. Chung, H.; Niu, Y.; Browse, J.; Howe, G. Top hits in contemporary JAZ: An update on jasmonate signaling. Phytochemistry 2009, 70, 1547–1559. [Google Scholar] [CrossRef] [Green Version]
  8. Lorenzo, O.; Chico, J.; Sanchez-Serrano, J.; Solano, R. Jasmonate-insensitive1 encodes a MYC transcription factor essential to discriminate between different jasmonate-regulated defense responses in Arabidopsis. Plant Cell 2004, 16, 1938–1950. [Google Scholar] [CrossRef] [Green Version]
  9. Katsir, L.; Schilmiller, A.; Staswick, P.; He, S.; Howe, G. COI1 is a critical component of a receptor for jasmonate and the bacterial virulence factor coronatine. Proc. Natl. Acad. Sci. USA 2008, 105, 7100–7105. [Google Scholar] [CrossRef] [Green Version]
  10. Zhang, M.; Jin, X.; Chen, Y.; Wei, M.; Liao, W.; Zhao, S.; Fu, C.; Yu, L. TcMYC2a, a basic helix loop helix transcription factor, transduces JA-signals and regulates taxol biosynthesis in Taxus chinensis. Front. Plant Sci. 2018, 9, 863. [Google Scholar] [CrossRef]
  11. Chini, A.; Fonseca, S.; Fernandez, G.; Adie, B.; Chico, J.; Lorenzo, O.; Garcia-Casado, G.; Lopez-Vidriero, I.; Lozano, F.; Ponce, M.; et al. The JAZ family of repressors is the missing link in jasmonate signalling. Nature 2007, 448, 666–673. [Google Scholar] [CrossRef]
  12. Oblessuc, P.; Obulareddy, N.; DeMott, L.; Matiolli, C.; Thompson, B.; Melotto, M. JAZ4 is involved in plant defense, growth, and development in Arabidopsis. Plant J. 2020, 101, 371–383. [Google Scholar] [CrossRef]
  13. Zhang, C.; Lei, Y.; Lu, C.; Wang, L.; Wu, J. MYC2, MYC3, and MYC4 function additively in wounding-induced jasmonic acid biosynthesis and catabolism. J. Integr. Plant Biol. 2020, 62, 1159–1175. [Google Scholar] [CrossRef]
  14. Qi, T.; Huang, H.; Song, S.; Xie, D. Regulation of jasmonate-mediated stamen development and seed production by a bHLH-MYB complex in Arabidopsis. Plant Cell 2015, 27, 1620–1633. [Google Scholar] [CrossRef] [Green Version]
  15. Song, S.; Qi, T.; Huang, H.; Ren, Q.; Wu, D.; Chang, C.; Peng, W.; Liu, Y.; Peng, J.; Xie, D. The Jasmonate-ZIM domain proteins interact with the R2R3-MYB transcription factors MYB21 and MYB24 to Affect Jasmonate-regulated stamen development in Arabidopsis. Plant Cell 2011, 23, 1000–1013. [Google Scholar] [CrossRef] [Green Version]
  16. Qi, T.; Song, S.; Ren, Q.; Wu, D.; Huang, H.; Chen, Y.; Fan, M.; Peng, W.; Ren, C.; Xie, D. The Jasmonate-ZIM-domain proteins interact with the WD-repeat/bHLH/MYB complexes to regulate Jasmonate-mediated anthocyanin accumulation and trichome initiation in Arabidopsis thaliana. Plant Cell 2011, 23, 1795–1814. [Google Scholar] [CrossRef] [Green Version]
  17. Qi, T.; Huang, H.; Wu, D.; Yan, J.; Qi, Y.; Song, S.; Xie, D. Arabidopsis DELLA and JAZ proteins bind the WD-repeat/bHLH/MYB complex to modulate gibberellin and Jasmonate signaling synergy. Plant Cell 2014, 26, 1118–1133. [Google Scholar] [CrossRef] [Green Version]
  18. White, D.W. PEAPOD regulates lamina size and curvature in Arabidopsis. Proc. Natl. Acad. Sci. USA 2006, 103, 13238–13243. [Google Scholar] [CrossRef] [Green Version]
  19. Ahmad, I.; Muthukumar, M.; Rajan, S. In-silico mining and characterisation of TIFY genes in mango. Res. J. Biotechnol. 2021, 16, 24–28. [Google Scholar]
  20. Ye, H.; Du, H.; Tang, N.; Li, X.; Xiong, L. Identification and expression profiling analysis of TIFY family genes involved in stress and phytohormone responses in rice. Plant Mol. Biol. 2009, 71, 291–305. [Google Scholar] [CrossRef]
  21. Ebel, C.; BenFeki, A.; Hanin, M.; Solano, R.; Chini, A. Characterization of wheat (Triticum aestivum) TIFY family and role of Triticum Durum TdTIFY11 a in salt stress tolerance. PLoS One 2018, 13, e0200566. [Google Scholar] [CrossRef] [Green Version]
  22. Singh, A.; Pandey, B.; Deveshwar, P.; Narnoliya, L.; Parida, S.; Giri, J. JAZ Repressors: Potential involvement in nutrients deficiency response in rice and chickpea. Front. Plant Sci. 2015, 6, 975. [Google Scholar] [CrossRef] [Green Version]
  23. Peethambaran, P.; Glenz, R.; Honinger, S.; Islam, S.; Hummel, S.; Harter, K.; Kolukisaoglu, U.; Meynard, D.; Guiderdoni, E.; Nick, P.; et al. Salt-inducible expression of OsJAZ8 improves resilience against salt-stress. BMC Plant Biol. 2018, 18, 311. [Google Scholar] [CrossRef]
  24. Zhao, C.; Pan, X.; Yu, Y.; Zhu, Y.; Kong, F.; Sun, X.; Wang, F. Overexpression of a TIFY family gene, GsJAZ2, exhibits enhanced tolerance to alkaline stress in soybean. Mol. Breed. 2020, 40, 33. [Google Scholar] [CrossRef]
  25. Yu, J.; Hu, F.; Dossa, K.; Wang, Z.; Ke, T. Genome-wide analysis of UDP-glycosyltransferase super family in Brassica rapa and Brassica oleracea reveals its evolutionary history and functional characterization. BMC Genom. 2017, 18, 474. [Google Scholar] [CrossRef] [Green Version]
  26. Mourato, M.; Moreira, I.; Leitao, I.; Pinto, F.; Sales, J.; Martins, L. Effect of Heavy Metals in Plants of the Genus Brassica. Int. J. Mol. Sci. 2015, 16, 17975–17998. [Google Scholar] [CrossRef] [Green Version]
  27. Li, M.; Wang, R.; Liang, Z.; Wu, X.; Wang, J. Genome-wide identification and analysis of the EIN3/EIL gene family in allotetraploid Brassica napus reveal its potential advantages during polyploidization. BMC Plant Biol. 2019, 19, 110. [Google Scholar] [CrossRef] [Green Version]
  28. He, Z.; Ji, R.; Havlickova, L.; Wang, L.; Li, Y.; Lee, H.; Song, J.; Koh, C.; Yang, J.; Zhang, M.; et al. Genome structural evolution in Brassica crops. Nat. Plants 2021, 7, 755–765. [Google Scholar] [CrossRef]
  29. Cheung, F.; Trick, M.; Drou, N.; Lim, Y.; Park, J.; Kwon, S.; Kim, J.; Scott, R.; Pires, J.; Paterson, A.; et al. Comparative analysis between homoeologous genome segments of Brassica napus and its progenitor species reveals extensive sequence-level divergence. Plant Cell 2009, 21, 1912–1928. [Google Scholar] [CrossRef] [PubMed] [Green Version]
  30. Hakata, M.; Muramatsu, M.; Nakamura, H.; Hara, N.; Kishimoto, M.; Iida-Okada, K.; Kajikawa, M.; Imai-Toki, N.; Toki, S.; Nagamura, Y.; et al. Overexpression of TIFY genes promotes plant growth in rice through jasmonate signaling. Biosci. Biotechnol. Biochem. 2017, 81, 906–913. [Google Scholar] [CrossRef] [PubMed] [Green Version]
  31. Zhu, D.; Bai, X.; Luo, X.; Chen, Q.; Cai, H.; Ji, W.; Zhu, Y. Identification of wild soybean (Glycine soja) TIFY family genes and their expression profiling analysis under bicarbonate stress. Plant Cell Rep. 2013, 32, 263–272. [Google Scholar] [CrossRef] [PubMed]
  32. Li, X.; Yin, X.; Wang, H.; Li, J.; Guo, C.; Gao, H.; Zheng, Y.; Fan, C.; Wang, X. Genome-wide identification and analysis of the apple (Malus x domestica Borkh.) TIFY gene family. Tree Genet. Genom. 2015, 11, 808. [Google Scholar] [CrossRef]
  33. Wang, Y.; Pan, F.; Chen, D.; Chu, W.; Liu, H.; Xiang, Y. Genome-wide identification and analysis of the Populus trichocarpa TIFY gene family. Plant Physiol. Biochem. 2017, 115, 360–371. [Google Scholar] [CrossRef]
  34. Ma, Y.; Shu, S.; Bai, S.; Tao, R.; Qian, M.; Teng, Y. Genome-wide survey and analysis of the TIFY gene family and its potential role in anthocyanin synthesis in Chinese sand pear (Pyrus pyrifolia). Tree Genet. Genom. 2018, 14, 25. [Google Scholar] [CrossRef]
  35. Zhang, Z.; Li, X.; Yu, R.; Han, M.; Wu, Z. Isolation, structural analysis, and expression characteristics of the maize TIFY gene family. Mol. Genet. Genom. 2015, 290, 1849–1858. [Google Scholar] [CrossRef]
  36. Chalhoub, B.; Denoeud, F.; Liu, S.; Parkin, I.; Tang, H.; Wang, X.; Chiquet, J.; Belcram, H.; Tong, C.; Samans, B.; et al. Early allopolyploid evolution in the post-Neolithic Brassica napus oilseed genome. Science 2014, 345, 950–953. [Google Scholar] [CrossRef] [Green Version]
  37. Cheng, F.; Sun, R.; Hou, X.; Zheng, H.; Zhang, F.; Zhang, Y.; Liu, B.; Liang, J.; Zhuang, M.; Liu, Y.; et al. Subgenome parallel selection is associated with morphotype diversification and convergent crop domestication in Brassica rapa and Brassica oleracea. Nat. Genet. 2016, 48, 1218–1224. [Google Scholar] [CrossRef] [PubMed]
  38. Arias, T.; Beilstein, M.; Tang, M.; McKain, M.; Pires, J. Diversification times among Brassica (Brassicaceae) crops suggest hybrid formation after 20 million years of divergence. Am. J. Bot. 2014, 101, 86–91. [Google Scholar] [CrossRef]
  39. Zhu, D.; Bai, X.; Zhu, Y.; Cai, H.; Li, Y.; Ji, W.; Chen, C.; An, L.; Zhu, Y. Isolation and functional analysis of GsTIFY11b relevant to salt and alkaline stress from Glycine soja. Yi Chuan 2012, 34, 230–239. [Google Scholar] [CrossRef]
  40. Zhu, D.; Bai, X.; Chen, C.; Chen, Q.; Cai, H.; Li, Y.; Ji, W.; Zhai, H.; Lv, D.; Luo, X.; et al. GsTIFY10, a novel positive regulator of plant tolerance to bicarbonate stress and a repressor of jasmonate signaling. Plant Mol. Biol. 2011, 77, 285–297. [Google Scholar] [CrossRef]
  41. He, X.; Kang, Y.; Li, W.; Liu, W.; Xie, P.; Liao, L.; Huang, L.; Yao, M.; Qian, L.; Liu, Z.; et al. Genome-wide identification and functional analysis of the TIFY gene family in the response to multiple stresses in Brassica napus L. BMC Genom. 2020, 21, 736. [Google Scholar] [CrossRef] [PubMed]
  42. Saha, G.; Park, J.; Kayum, M.; Nou, I. A Genome-wide analysis reveals stress and hormone responsive patterns of TIFY family genes in Brassica rapa. Front. Plant Sci. 2016, 7, 936. [Google Scholar] [CrossRef] [PubMed] [Green Version]
  43. Liu, X.; Zhao, C.; Yang, L.; Zhang, Y.; Wang, Y.; Fang, Z.; Lv, H. Genome-wide identification, expression profile of the TIFY gene family in Brassica oleracea var. capitata, and their divergent response to various pathogen infections and phytohormone treatments. Genes 2020, 11, 127. [Google Scholar] [CrossRef] [PubMed] [Green Version]
  44. Singh, S.; Parihar, P.; Singh, R.; Singh, V.; Prasad, S. Heavy metal tolerance in plants: Role of transcriptomics, proteomics, metabolomics, and ionomics. Front. Plant Sci. 2016, 6, 1143. [Google Scholar] [CrossRef] [Green Version]
  45. Kumar, V.; Mahajan, M.; Yadav, S. Toxic metals accumulation, tolerance and homeostasis in Brassicaoilseed species: Overview of physiological, biochemical and molecular mechanisms. In The Plant Family Brassicaceae; Springer: New York, NY, USA, 2012; pp. 171–211. [Google Scholar]
  46. Marchler-Bauer, A.; Bo, Y.; Han, L.; He, J.; Lanczycki, C.; Lu, S.; Chitsaz, F.; Derbyshire, M.; Geer, R.; Gonzales, N.; et al. CDD/SPARCLE: Functional classification of proteins via subfamily domain architectures. Nucleic Acids Res. 2017, 45, D200–D203. [Google Scholar] [CrossRef] [Green Version]
  47. Larkin, M.; Blackshields, G.; Brown, N.; Chenna, R.; McGettigan, P.; McWilliam, H.; Valentin, F.; Wallace, I.; Wilm, A.; Lopez, R.; et al. Clustal W and clustal X version 2.0. Bioinformatics 2007, 23, 2947–2948. [Google Scholar] [CrossRef] [Green Version]
  48. Kumar, S.; Stecher, G.; Tamura, K. MEGA7: Molecular evolutionary genetics analysis version 7.0 for bigger datasets. Mol. Biol. Evol. 2016, 33, 1870–1874. [Google Scholar] [CrossRef] [Green Version]
  49. Bailey, T.; Boden, M.; Buske, F.; Frith, M.; Grant, C.; Clementi, L.; Ren, J.; Li, W.; Noble, W. MEME SUITE: Tools for motif discovery and searching. Nucleic Acids Res. 2009, 37, W202–W208. [Google Scholar] [CrossRef]
  50. Chen, C.; Chen, H.; Zhang, Y.; Thomas, H.; Frank, M.; He, Y.; Xia, R. TBtools: An integrative toolkit developed for interactive analyses of big biological data. Mol. Plant 2020, 13, 1194–1202. [Google Scholar] [CrossRef]
  51. Voorrips, R. MapChart: Software for the graphical presentation of linkage maps and QTLs. J. Hered. 2002, 93, 77–78. [Google Scholar] [CrossRef] [Green Version]
  52. Wan, Y.; Wang, Z.; Xia, J.; Shen, S.; Guan, M.; Zhu, M.; Qiao, C.; Sun, F.; Liang, Y.; Li, J.; et al. Genome-wide analysis of phosphorus transporter genes in Brassica and their roles in heavy metal stress tolerance. Int. J. Mol. Sci. 2020, 21, 2209. [Google Scholar] [CrossRef] [Green Version]
  53. Trapnell, C.; Roberts, A.; Goff, L.; Pertea, G.; Kim, D.; Kelley, D.; Pimentel, H.; Salzberg, S.; Rinn, J.; Pachter, L. Differential gene and transcript expression analysis of RNA-seq experiments with TopHat and Cufflinks. Nat. Protoc. 2014, 9, 2513. [Google Scholar] [CrossRef] [Green Version]
  54. Shen, S.; Sun, F.; Zhu, M.; Chen, S.; Guan, M.; Chen, R.; Tang, F.; Yin, N.; Xu, X.; Tang, Z.; et al. Genome-wide identification AINTEGUMENTA-like (AIL) genes in Brassica species and expression patterns during reproductive development in Brassica napus L. PLoS One 2020, 15, e0234411. [Google Scholar] [CrossRef]
  55. Qu, C.; Fu, F.; Lu, K.; Zhang, K.; Wang, R.; Xu, X.; Wang, M.; Lu, J.; Wan, H.; Tang, Z.; et al. Differential accumulation of phenolic compounds and expression of related genes in black- and yellow-seeded Brassica napus. J. Exp. Bot. 2013, 64, 2885–2898. [Google Scholar] [CrossRef] [Green Version]
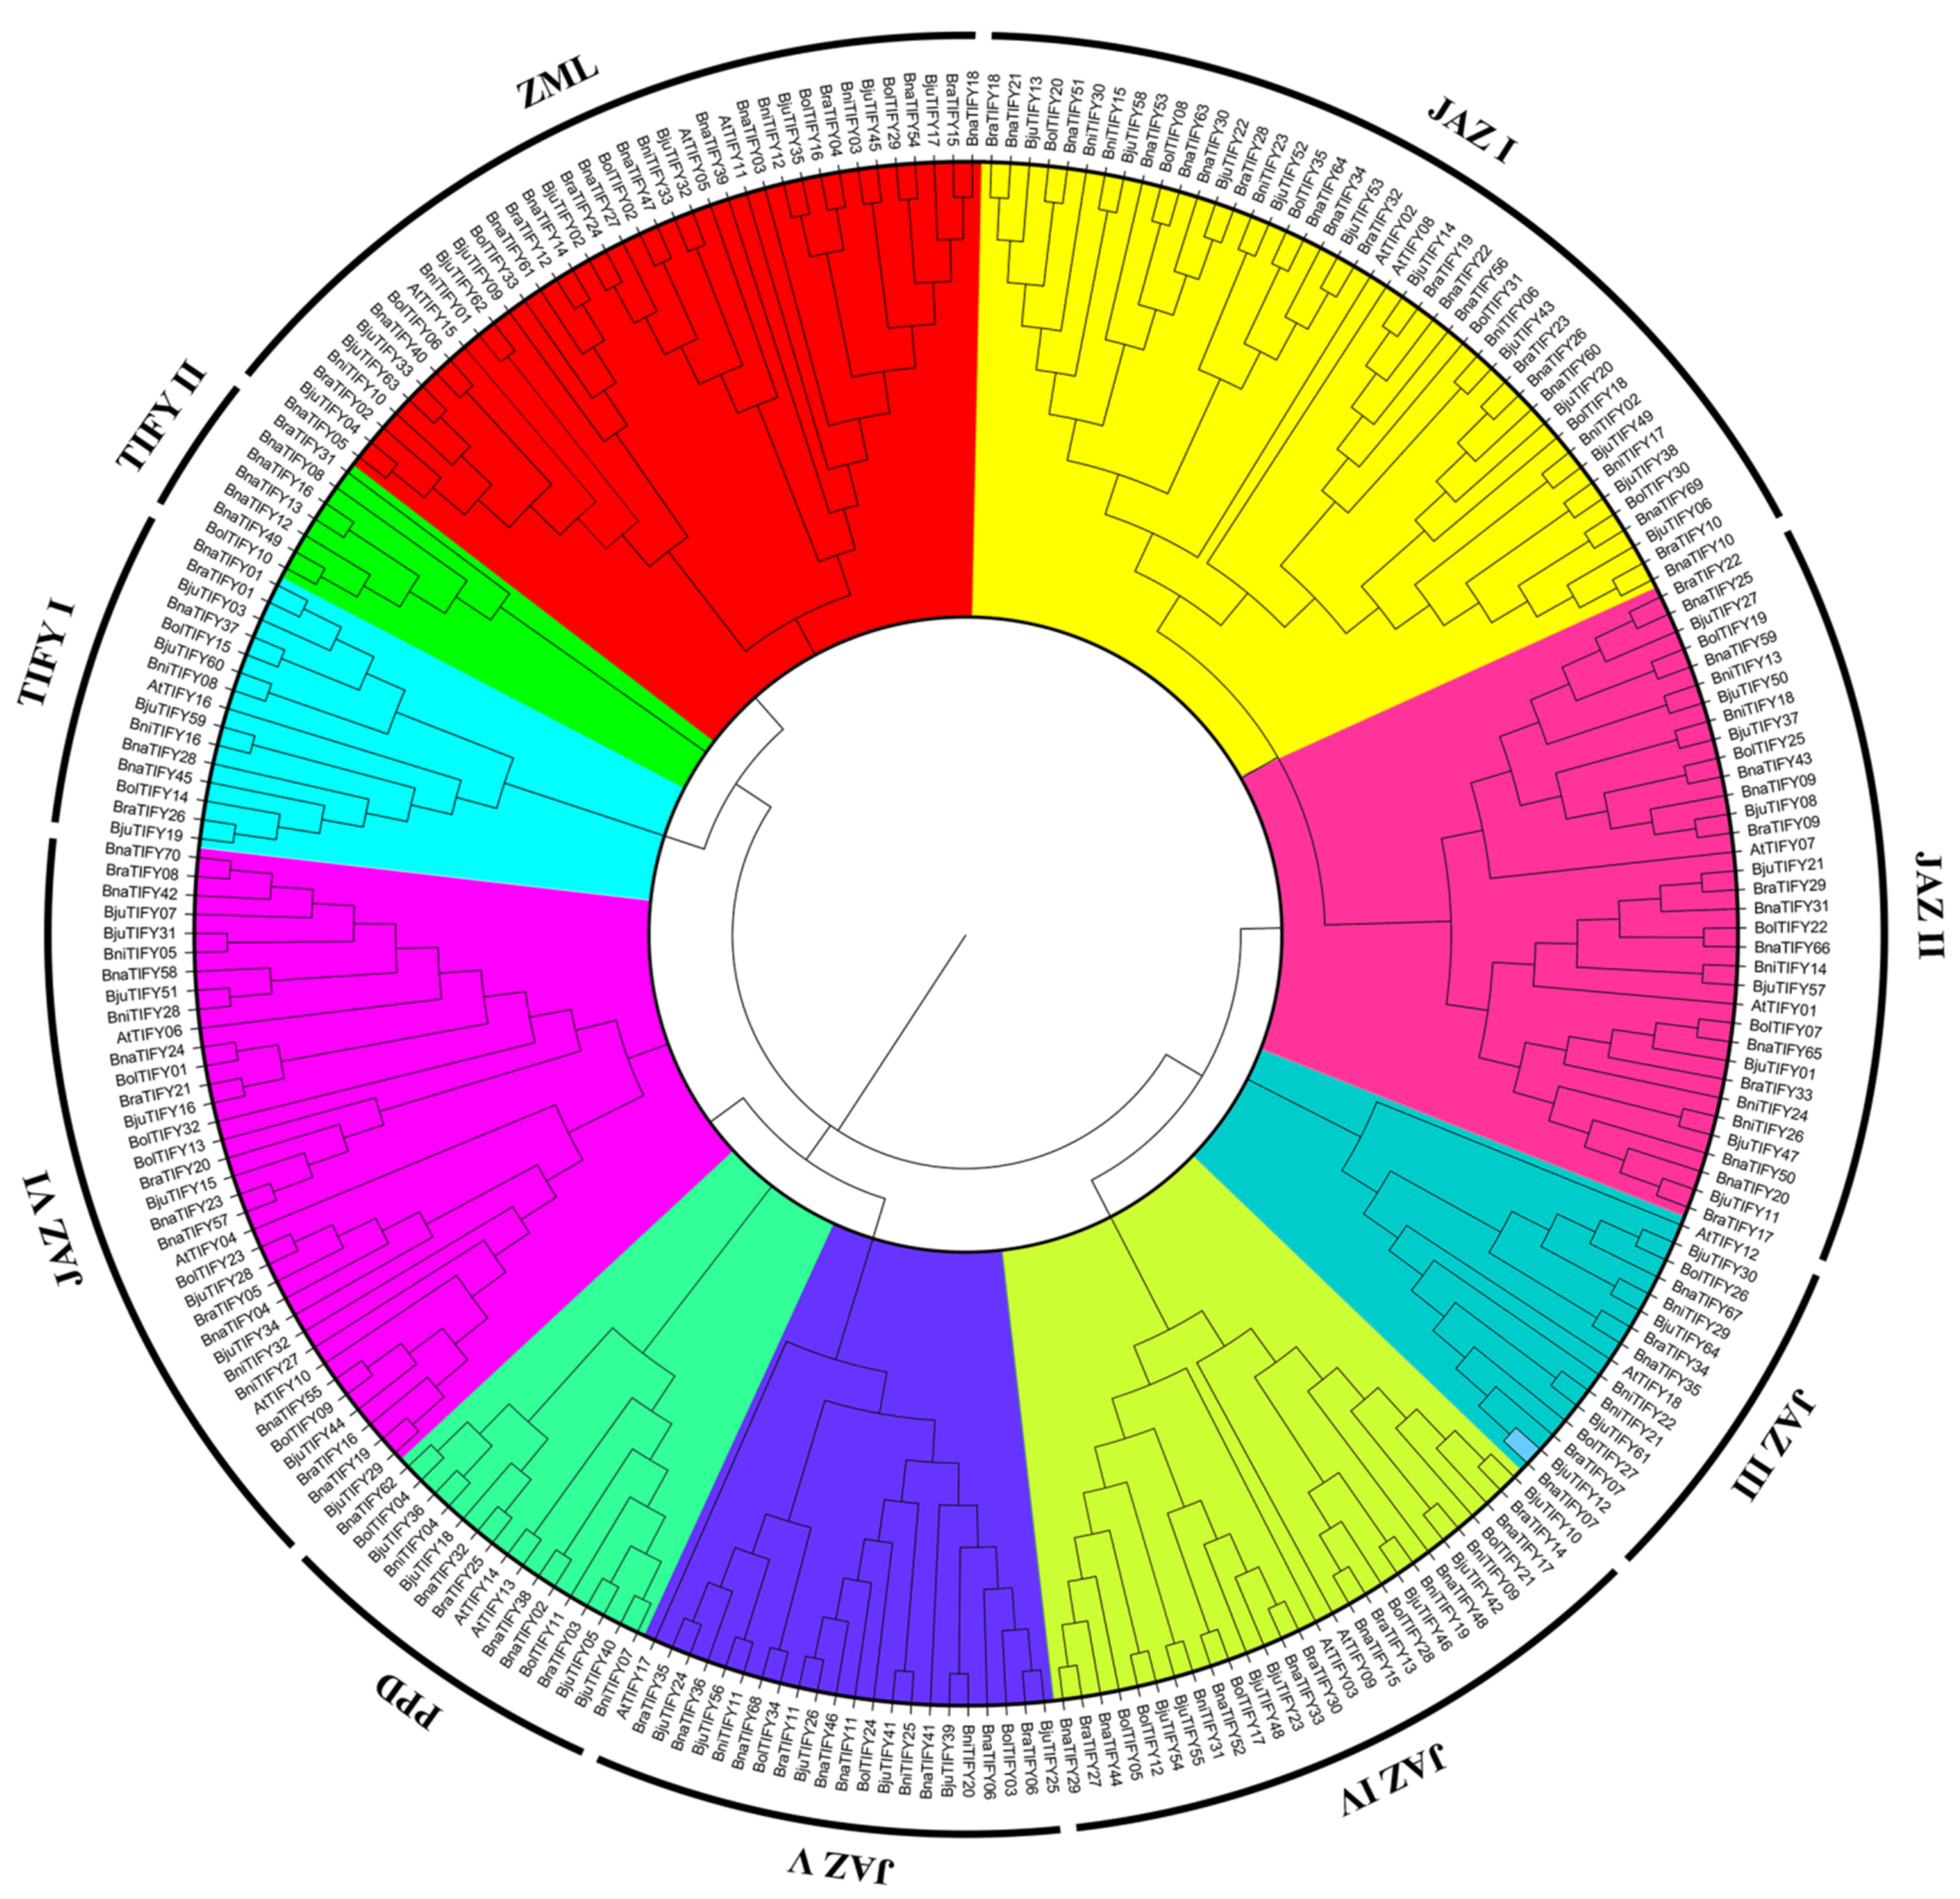
Figure 1. Phylogenetic tree of the TIFY family in A. thaliana and five Brassiceae species. The rooted neighbor-joining phylogenetic tree was constructed using MEGA7.0 and visualized using Figure Tree v1.4.2. The TIFYs were divided into ten subgroups (namely TIFY I, TIFY II, PPD, ZML and JAZ I-VI), which were indicated by different colors. Organism name and gene accession numbers are shown in Table S2.
Plants 11 00667 g001
Figure 2. Chromosome distribution of TIFYs on sub-genome of Brassiceae species. (A) TIFY genes distributed on the A sub-genome in B. rapa, B. juncea and B. napus. (B) TIFY genes distributed on the B sub-genome in B. nigra and B. juncea. (C) TIFY genes distributed on the C sub-genome in B. oleracea and B. napus. The labels on the corresponding chromosomes indicate the name of the source organism and the sub-genome. The red rectangles represent the tandem duplications genes. The scales indicate the sizes of the various Brassiceae chromosomes (Mb). Bra, B. rapa; Bni, B. nigra; Bol, B. oleracea; Bju, B. juncea and Bna, B. napus. Detailed information on the genes located on the scaffold sequences is not shown here.
Plants 11 00667 g002aPlants 11 00667 g002b
Figure 3. Synteny analysis of TIFYs between A. thaliana and five Brassiceae species. (A) Collinearity analysis of TIFYs among A. thaliana, B. rapa, B. oleracea and B. napus. (B) Collinearity analysis of TIFYs among A. thaliana, B. rapa, B. nigra and B. juncea. Different chromosomes are shown in different colors. Different gene pairs are represented by different colored lines.
Plants 11 00667 g003
Figure 4. Phylogenetic relationships, gene structure and conserved motif of BnaTIFYs in B. napus. (A) Phylogenetic tree was constructed based on the 70 BnaTIFY protein sequences using MEGA7.0. (B) Gene structures analysis of BnaTIFYs. Red boxes represent exons and gray lines represent introns. The untranslated regions (UTRs) are indicated by blue boxes. The sizes of the exons and introns can be estimated using the scale at the bottom. (C) The conserved motif compositions of BnaTIFYs. Boxes with different colors indicate conserved motifs and listed in Figure S2.
Plants 11 00667 g004
Figure 5. Expression patterns of all BnaTIFYs in different tissues and organs of cultivar ZS11. The heatmap was generated using the log2 expression levels (FPKM). The abbreviations of the different tissues of cultivar ZS11 are listed in Table S4. The bar represents the log2 expression levels (FPKM). Black boxes indicate that that FPKM values of BnaTIFYs are zero.
Plants 11 00667 g005
Figure 6. Expression profiles of the BnaTIFYs in response to As3+ and Cd2+ treatment. The expression profiles of each BnaTIFY were calculated as Log2 (FPKM values). Black boxes indicate that FPKM values of BnaTIFYs are zero (Table S5).
Plants 11 00667 g006
Figure 7. qRT-PCR analysis of 9 BnaTIFYs under As3+ (A) and Cd2+ (B) treatment. Data were normalized to BnActin7 gene and vertical bars were obtained from three biological replicates. Statistically significant differences were analyzed by Student t-test. * p < 0.05; ** p < 0.01.
Plants 11 00667 g007
Table 1. Statistics of TIFY family genes between A. thaliana and five Brassiceae species.
Group NameA. thalianaB. rapaB. nigraB. oleraceaB. junceaB. napus
JAZ I26661113
JAZ II255499
JAZ III223243
JAZ IV243577
JAZ V133366
JAZ VI354599
PPD222244
TIFY I122244
TIFY II010105
ZML35551010
Total183533356470
Publisher’s Note: MDPI stays neutral with regard to jurisdictional claims in published maps and institutional affiliations.