Abstract
Although the crossover (CO) patterns of different species have been extensively investigated, little is known about the landscape of CO patterns in Populus because of its high heterozygosity and long-time generation. A novel strategy was proposed to reveal the difference of CO rate and interference between Populus deltoides and Populus simonii using their F1 hybrid population. We chose restriction site-associated DNA (RAD) tags that contained two SNPs, one only receiving the CO information from the female P. deltoides and the other from the male P. simonii. These RAD tags allowed us to investigate the CO patterns between the two outbred species, instead of using the traditional backcross populations in inbred lines. We found that the CO rate in P. deltoides was generally greater than that in P. simonii, and that the CO interference was a common phenomenon across the two genomes. The COs landscape of the different Populus species facilitates not only to understand the evolutionary mechanism for adaptability but also to rebuild the statistical model for precisely constructing genetic linkage maps that are critical in genome assembly in Populus. Additionally, the novel strategy could be applied in other outbred species for investigating the CO patterns.
1. Introduction
Genetic recombination is a fundamental biological process during meiosis. It not only affects the adaptability of organisms to the environment [1], but also plays an important role in the biological evolution and formation of new species [2]. Because recombination rate is approximately proportional to the physical distance between molecular markers, it also provides the basis for genetic mapping [3]. Recombination is generated by double strand breaks (DSBs) in a chromosome [4]. With the repair of DSBs through the double Holliday junction or synthesis-dependent strand annealing pathways, two results are possibly produced, i.e., crossovers (COs) and non-crossovers (NCOs) [5,6]. COs are the reciprocal exchanges of DNA fragments between homologues, whereas NCOs are the recombination products where a section of genetic information is copied from one homologous chromosome to the other, without affecting the donating chromosome. Consequently, a CO affects two chromatids, but an NCO affects only one chromatid [5,6]. In most species, the number of COs occupies a small fraction of the DSBs [7,8]. However, because of the creation of physical connection between homologous chromosome pairs, COs are essential for faithful chromosome segregation in meiosis [9]. Moreover, because NCOs are very short and difficult to detect [10,11], most studies used the rate of CO events to represent the recombination rate [12,13,14].
Many studies have shown that the CO rates are quite dissimilar in different organisms, and the distribution of CO events varies greatly even in closely related taxa, populations and individuals [15,16]. Among them, the most striking is that the CO rate of microorganisms and fungi is much higher than that of animals and plants [17]. In fact, this comparison is more common in the specific taxonomic groups. For example, among mammals, marsupials have lower CO rates [18]; and among plants, conifers have very low CO rates [19]. Moreover, a large number of articles have proved that the CO rates of different organisms are related to the genome architecture and chromatin structure [20,21,22,23]. In addition, selection pressure and environmental factors may also lead to the difference of CO rates [24,25].
COs at both chromosomal and local scales are strictly controlled by a pervasive mechanism [26,27], and they do not arise as independent events. The mechanism is called CO interference [28], by which the occurrence of a CO affects the formation of other COs in its vicinity. Early studies of genetic maps showed that the existence of a CO in one chromosomal interval reduces the probability of another CO occurring nearby [29], a phenomenon called positive interference. However, subsequent studies in maize [30] and Arabidopsis thaliana [12] found the opposite phenomenon, that is, CO interference could increase the probability of occurrence of nearby COs (negative interference). CO interference is extremely different in some species. For example, in the meiosis of Caenorhabditis elegans, each bivalent produced exactly one CO, which indicated that there existed complete interference [31], whereas there was weak or no interference in Aspergillus nidulans [32]. Apart from these extreme cases, CO interference also varies greatly in different species. For example, the strength of interference across the dog genome was estimated to be much higher than that in the human genome [33]. Another noteworthy phenomenon is that there is compelling evidence that females and males also have disparate interference landscapes [33,34]. In Anser anser [35], Canis familiaris [33], Homo sapiens [36,37], and Prunus mume [28], the CO interference in females is lower than that in males. In contrast, in Bos Taurus [38,39] and A. thaliana [12,40], the CO interference is higher in females than in males. Some studies indicated that the difference of CO interference between the sexes may be the main factor leading to the sexual difference in CO rates [34].
The genus Populus was used as a model system in forest genetics and woody plant studies [41]. Although numerous linkage maps have been constructed with different types of genetic markers in the genus [42,43,44,45,46], little is known about the CO patterns in different poplar species. Wang et al. [47] compared the average CO rate over 100-kbp nonoverlapping windows of three related poplar species, but there were no reports about the genome-wide difference in CO patterns between the species. In this study, we reported the CO patterns across the genome in an F1 hybrid population derived by crossing a female P. deltoides and a male P. simonii. The F1 population was established in our previous studies and a large number of individuals were successively sequenced with the restriction site-associated DNA sequencing (RADseq) technology [43,46]. Single nucleotide polymorphism (SNP) genotypes of individuals were obtained by mapping their paired-end (PE) reads to the genome sequence of P. simonii [48]. We chose those RAD tags that contained two SNPs, one heterozygous in the female and homozygous in the male and the other vice versa, to investigate the difference of CO patterns between the two species. The result would facilitate not only understanding of the CO role in the evolution of organisms and species, but also rebuild the statistical model for precisely constructing genetic linkage maps, which are critical in mapping quantitative trait loci (QTLs) and genome assembly [49]. Meanwhile, the novel strategy of investigating the difference of CO pattern between two parents using an F1 hybrid population could be applied in other outbred species.
2. Results
2.1. SNP Genotype Data
A total of 48,938 SNPs were obtained across the two parents and 257 individuals in the F1 hybrid population of P. deltoides and P. simonii by mapping their RADseq reads to the male parent genome sequences of P. simonii [50]. The average number of RADseq reads was 18,416,890 for the parents and the progeny (Supplementary Table S1). After a stringent filtering procedure with the NGS QC toolkit [51], an average amount of 4.61 Gb HQ data per individual remained for calling SNP genotypes. As expected from previous studies in the same population [46,52], the majority of SNPs segregated in the ratio of 1:1 (p > 0.01), with 29,466 SNPs segregating in the type of ab × aa and 18,863 in aa × ab. The SNP genotype for each individual at each SNP site satisfied the requirements that the read coverage depth of an allele was ≥3 for heterozygosity and ≥5 for homozygosity, and that the Phred score was at least 30. Although the missing genotype rate was allowed to up to 20% at an SNP site, the average number of genotyped individuals was up to 239 per SNP site.
Based on the two SNP datasets of different segregation types, a total of 1157 RAD tags were selected for performing the comparison analysis of CO rate and interference between the female and male parents. These RAD tags spanned 95.34% of the reference genome. Each RAD tag contained two SNPs fulfilling the condition that one segregates in ab × aa and the other in aa × ab (Figure 1A), and that the distance between them is less than 1 Kb. Moreover, the distance between any two adjacent RAD tags was greater than 100 Kb so that the crossover events in the interval can be detected in the population. In addition, the distributions of the RAD tag number and interval length within chromosomes were outlined in Table 1. It can be seen that the average interval length was around 300 Kb in all chromosomes except chromosome 19, in which the average length was doubled up to 636 Kb.
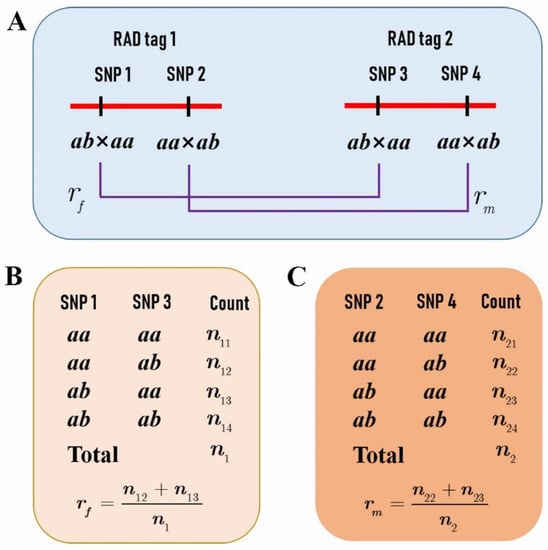
Figure 1.
The P. deltoides and P. simonii crossover (CO) rates between two restriction site-associated DNA (RAD) tags. (A) Each RAD tag contains two SNPs, one with a segregation pattern of ab × aa and the other aa × ab. (B) The counts of genotypes at single nucleotide polymorphisms (SNPs) 1 and 3 in the progeny provide the estimate of the female parental P. deltoides CO rate assuming the linkage phase in coupling. (C) The counts of genotypes at SNPs 2 and 4 provide the estimate of the male parental P. simonii CO rate assuming the linkage phase in coupling.

Table 1.
Summary of adjacent RAD tag interval lengths and CO rates within chromosomes in the female parent Populus deltoides and the male parent Populus simonii.
2.2. Difference of CO Rates between Two Parents
We calculated the CO rates in each RAD tag interval using the SNPs with segregation types of ab × aa for the female parent P. deltoides and aa × ab for the male parent P. simonii. The range and mean of CO rates within chromosomes were presented for P. deltoides and P. simonii in Table 1. It can be observed that the minimum CO rate was 0.004 and the maximum up to 0.224 over the intervals on all chromosomes. The means of CO rates on all chromosomes but three (Chr08, Chr12, and Chr14) were greater in P. deltoides than in P. simonii. The maximum mean difference was found to occur in chromosome 5 and 11. The Wilcoxon signed-rank test showed that the difference of the mean CO rate between the two species was significant with a p-value of 0.002.
We tested the difference of CO rates between the two species in each interval with the LR statistic. Consequently, of all the 1138 RAD tag intervals, there existed 307 intervals in which the CO rates between the two species were significantly different (Figure 2). The distribution of the number of these significant intervals within chromosomes was summarized in Table 2. We found that two or more significant intervals were successive and formed a region that we called a significant region. The number of the significant regions within each chromosome was also summarized in Table 2. Meanwhile, the distribution of the length of significant intervals and regions was investigated and also presented in Table 2 for each chromosome. It can be seen that the lengths of most significant intervals and regions were less than 1 Mb, but there were 27 significant intervals or regions distributed on 13 chromosomes whose lengths were greater than 1 Mb. Furthermore, the coverage of the significant intervals of each chromosome was calculated to be ranged from 6.91% (Chr18) to 33.65% (Chr04), resulting in a total coverage of 23.80% of the whole genome (Table 2). In addition, we found that the maximum significant region contained three significant intervals and spanned 2.36 Mb on Chr04 (Figure 2).
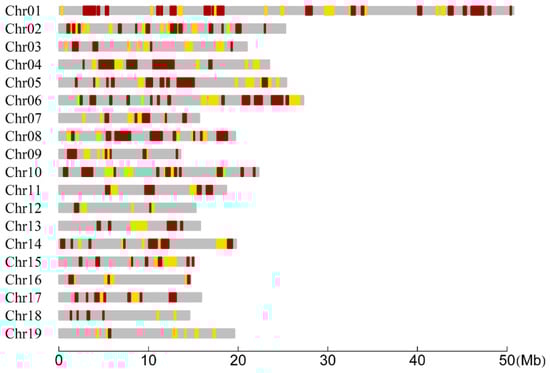
Figure 2.
Distribution of RAD tag intervals and regions within chromosomes for significantly differential CO rates between the P. deltoides and P. simonii. The yellow and red bars represent the intervals when the significances are at the 0.05 and 0.01 levels, respectively. Two or more successive significant intervals constitute a significant region.
Table 2.
Distribution of the numbers of significant SNP intervals and regions over different lengths within chromosomes. The CO rates of these intervals are significantly different in the two parents. The significant region is constituted of two or more continuous significant intervals.
2.3. Investigation of CO Interference in Both Species
Since the degree of CO interference between two adjacent marker intervals depends on the interval lengths, different scales of the SNP intervals were considered to investigate the landscape of CO interference across the genomes in the female P. deltoides and male P. simonii. We selected those SNPs such that the minimum interval length (MIL) was required to be 0.5, 1.0, 2.0, 3.0, 4.0, and 5.0 Mb separately for calculating the coefficient of coincidence (CoC). When the MIL was equal to 0.5 Mb, there were 454 pairs of adjacent SNP intervals, of which 290 and 233 showed significant CO interference in P. deltoides and P. simonii, occupying 79.86% and 69.77% of their genomes, respectively (Table 3, Figure 3). As the MIL increased, the number of adjacent interval pairs with CO interference (NPCI) decreased, covering over half of the genomes for most cases. When the MIL reached 4.0 Mb or more, the interference-occurred regions in the male P. simonii abruptly became small. If the MIL was equal to 5.0 Mb, there existed nine pairs of interference-occurred intervals, covering 22.78% of the male P. simonii genome. Similarly, when the MIL reached 5.0 Mb, the NPCI in the female P. deltoides decreased abruptly from 290 to 14, with the genome coverage from 79.86% to 35.10% (Table 3). Overall, except the case when the MIL was equal to 3.0 Mb, the NPCI was slightly larger in the female than in the male, indicating that P. deltoides has a higher level of CO interference.
Table 3.
The number of pairs of adjacent interference-occurred intervals with their coverage in bracket across different minimum interval lengths in the genomes of the female (F) P. deltoides and the male (M) P. simonii.
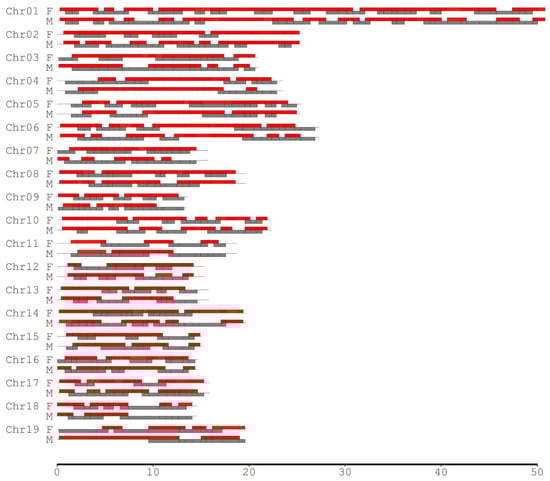
Figure 3.
Distribution of the adjacent intervals where CO interference significantly existed across chromosomes in the male (M) P. simonii and female (F) P. deltoides. The minimum interval length was set to be 0.5 Mb. The red and gray bars indicate the regions with and without CO inference, respectively.
We found that the number of the common pairs of interference-occurred intervals in both species decreased as the MIL increased (Table 3). When the MIL was set as 0.5 Mb, there were 168 common pairs of interference-occurred intervals, spanning 52.61% of the genomes. However, when the MIL increased to 5.0 Mb, only four common pairs of interference-occurred intervals existed, covering 9.20% of the genomes.
The positive and negative CO interferences were also investigated across the cases of different MILs (Table 3). It was observed that when the MIL was equal to 0.5 Mb, the number of pairs of negative interference intervals (CoC > 1) was significantly greater than that of positive interference intervals (CoC < 1), especially for the female P. deltoides (214 versus 76). For each species, we observed that the number of pairs of positive interference intervals generally decreased to 0 as the MIL increased from 0.5 to 5.0 Mb, indicating that the positive interference vanished when the interval length was equal to or greater than 5.0 Mb. Meanwhile, the number of pairs of negative interference intervals decreased to the minimum numbers for each species as the MIL increased from 0.5 to 5.0 Mb.
We further compared the difference of CO interference between the female P. deltoides and male P. simonii by calculating interference strength parameters within chromosomes. Figure 4 showed the estimated values of interference strength across the 19 chromosomes for the female and male. It was observed that the parameters were consistently less than 1, and those for the female were generally less than for the male in all chromosomes except in chromosome 4. Moreover, the result from the t test showed that the average value (0.559) of the female parameters was significantly less than that (0.611) of the male (p-value = 0.012), indicating the negative interference strength in P. deltoides was greater than that in P. simonii.
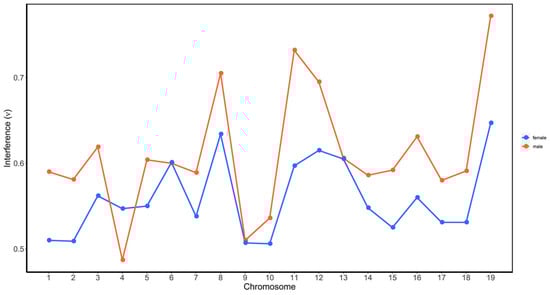
Figure 4.
CO interference parameters of the female P. deltoides (red) and male P. simonii (blue across the 19 chromosomes. The interference parameter ν was estimated from the gamma model as described in Broman and Weber [53].
3. Discussion
We took a novel strategy to successfully reveal the landscape of genome-wide CO events in an F1 hybrid population of P. deltoides and P. simonii. Such work used to be considered a tough task in forest trees. In inbred lines, reciprocal backcrosses with the same set of molecular markers were usually utilized to investigate the similarities and differences of male and female recombination in plants such as in Arabidopsis [12,54], Brassica nigra [55], and maize [56]. However, it is not so easy to establish the BC populations in forest trees because of their specific biological characteristics such as high heterozygosity and long generation times. Although the so-called ‘pseudo-testcross’ was often applied for linkage mapping in forest trees [57], there exists a barrier that the linkage phase was not fixed so that the traditional software for linkage analysis cannot be directly used [58,59]. Yet, in the current study, we obtained RAD tags in the F1 hybrid population with the RAD sequencing technology [60,61]. These RAD tags contained two types of SNPs—one that segregated in ab × aa, and the other in aa × ab (Figure 1)—constituting two datasets just like from two separate ‘pseudo-testcross’ populations and permitting the investigation of the CO patterns between two parents in the same genome regions. This strategy of combining the use of the F1 hybrid population and the RAD sequencing technology for studying COs of two parents could be applied to other forest trees or even other outbred species.
However, the analysis of such a strategy cannot be directly implemented with the traditional statistical methods applied in the populations derived from inbred lines. Since the linkage phase between two SNP markers was not fixed in the ‘pseudo-testcross’ population, we first inferred the linkage phase from coupling and repulsion cases using two-point linkage analysis before comparing the CO rates between the two parents at the same region. Meanwhile, in the analysis of CO interference, different linkage phase combinations of two adjacent marker intervals were also considered to establish the likelihood for estimating the CoC and performing the corresponding hypothesis test (Supplementary Text S1). Unlike in the previous studies [12,54,55,56], we proposed a statistical strategy for analyzing the CO patterns in the two parents, which was based on the maximum likelihood framework and simultaneously incorporated the complex linkage phases in the F1 hybrid population.
We therefore revealed the genome-wide CO patterns between the two parents in the F1 population, though the result may not be suitable for all species in Populus. First, the CO rate of the female P. deltoides is generally greater than that of the male P. simonii across the genomes, with 23.80% of the genome regions in which the two parental CO rates were significantly different. This result is opposite to many studies which showed that, in angiosperms, the CO rate in females was lower than in males [62]. Second, we revealed that the occurrence of CO interference pervaded both parental genomes at local scale when the MIL was limited to 0.5 Mb, covering ~80% of the female P. deltoides genome and ~70% of the male P. simonii genome, where the negative interference was more frequent than the positive interference (Table 3). Moreover, we found that there existed a significant difference of CO interference between the two parents in that the negative interference in the female was stronger than in the male. The phenomenon of extensive occurrences of CO interference was also observed by Wang et al. [63] in P. euphratica. The difference of interference strength between two sexes in Populus was similar to the results from studies in mice and cattle [34,39], and even in humans [64]. However, our result is limited to the female P. deltoides and the male P. simonii. Therefore, extensive studies should be performed in other intraspecific or interspecific crosses to further confirm whether such a result is a common phenomenon in Populus.
Besides helping understand its roles in the evolution of species, the assessment of CO interference has great implications in modelling multi-loci linkage analysis for precisely constructing genetic linkage maps. Up to date, the most popular genetic mapping software such as JoinMap [65] and MapMaker [66] did not incorporate the situation of CO interference either in two- and three-point linkage analysis or in multiple locus ordering. If CO interference significantly existed in meiosis, linkage maps constructed with these tools certainly had some limitations in the estimated genetic distances between markers and the marker orders within linkage groups, possibly seriously affecting the downstream analyses such as map-based QTL mapping [67,68] and genome sequence assembly [50,69]. Therefore, it is necessary to develop new algorithms by incorporating the CO inference parameters to calculate the genetic distances and the likelihood for an order of a large number of marker loci. This would substantially enhance the accuracy of genetic maps and thus facilitate the assembly of contigs or scaffolds into chromosomes, which is an important task in the era of high-throughput genomic sequencing [49]. It is worth noting that the CO interference affects QTL studies in two aspects. On the one hand, genetic linkage maps that incorporated CO interference could improve the power of detecting QTLs. On the other hand, the popular QTL statistical methods such as interval mapping [67] and composite interval mapping [68] were established under the assumption of without CO interference. Without any doubt, if CO interference was incorporated into these QTL mapping models, it would greatly improve their ability to identify QTLs.
4. Materials and Methods
4.1. Plant Material and Sequencing Data
A total of 257 individual trees were selected from the F1 hybrid population of P. deltoides and P. simonii for investigating the difference of CO patterns between the two parents. The F1 population was established by crossing the female P. deltoides and the male P. simonii from 2009 to 2011, as described in Tong et al. [46] and Mousavi et al. [43]. The selected individuals and their parents were sequenced with RADseq technology in 2013 and 2016, and each had PE reads data of > 2× genome coverage [50]. The accession number prefixed with SRR of each individual data was listed in Supplementary Table S1 and all the data reads are available in the NCBI SRA database (http://www.ncbi.nlm.nih.gov/Traces/sra, accessed on 1 January 2022).
4.2. SNP Genotyping
First of all, the PE reads of each individual were filtered to generate high-quality (HQ) data using the NGS QC toolkit with default parameters [51]. Then, we mapped the HQ reads to the improved genome sequence of the male parent P. simonii [50] to call SNP genotypes of each individual using the software BWA [70], SAMtools and BCFtools [71]. The calling procedures were as follows: (1) mapping each individual HQ reads to the reference genome to obtain a sequence alignment/map (SAM) format file using the mem command of BWA with default parameters; (2) converting each SAM file to BAM format and sorting and indexing it with SAMtools; (3) producing a BCF file with each sorted BAM file using the command bcftools mpileup -Obuzv -a AD,INFO/AD –f; (4) generating VCF files with the command bcftools call -m -v -f gq for each parent; (5) filtering SNPs from the two parental VCF files such that the allele DP (read coverage depth) ≥ 3 and the GQ (genotyping quality) > 30, and merging the two parental SNP sites into a list site file; (6) creating VCF files for all individuals with the command bcftools call -m -v -f gq using the list site file generated above; (7) extracting all SNP genotypes of each individual from its VCF file, satisfying that the allele DP ≥ 3 and GQ > 30 for a heterozygous genotype and that the allele DP ≥ 5 for a homozygous genotype; and (8) merging all individual SNP genotypes into one SNP dataset.
As indicated in the previous studies [43,46,50], the SNPs were mainly segregated in the patterns of aa × ab and ab × aa, where the first two letters represent the female parental genotype and the last two the male parental genotype. We extracted two SNP datasets, one for the segregation type of aa × ab and the other for the type of ab × aa. Meanwhile, we filtered out those SNPs that were seriously deviated from the Mendelian segregation ratio of 1:1 (p > 0.01). Moreover, those SNPs with more than 20% missing genotypes across the progeny were also removed from the dataset.
We further selected RAD tags that contained two SNPs, one with a segregation pattern of ab × aa and the other aa × ab (Figure 1A), to investigate the difference of CO patterns between the two parents. The genotypes of the adjacent RAD tags in the F1 progeny allowed us to estimate the female and male parental CO rates (Figure 1B,C), and even to compare the CO interference between the two species (Figure 5).
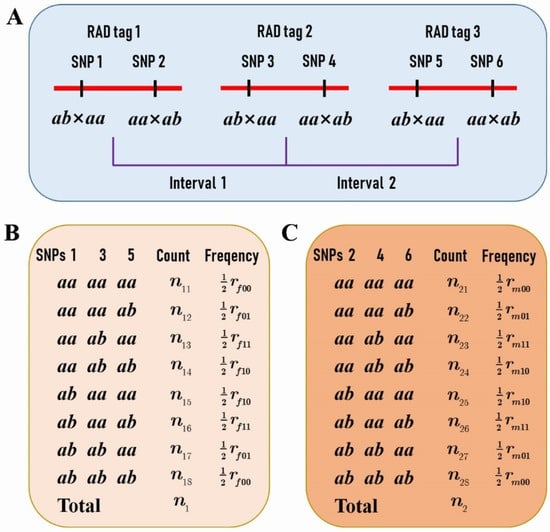
Figure 5.
Three RAD tags provide information on CO interference for the female P. deltoides and male P. simonii. (A) Three RAD tags constitute two adjacent marker intervals. Each RAD tag contains two SNPs, one with a segregation pattern of ab × aa and the other aa × ab. (B) The counts and frequencies of genotypes at SNPs 1, 3, and 5 in the progeny provide the estimate of the CoC of the female P. deltoides between the two intervals, assuming the linkage phases in coupling. (C) The counts and frequencies of genotypes at SNPs 2, 4, and 6 in the progeny provide the estimate of the CoC of the male P. simonii between the two intervals assuming the linkage phases in coupling.
4.3. Comparison of CO Rates between Two Parents
For any two adjacent RAD tags as described above (Figure 1A), assume the female P. deltoides and the male P. simonii CO rates to be and , respectively. In the F1 hybrid population, if we denote the counts of the four genotypes as ,,, and at the two SNPs that are contained in the two RAD tags and segregate in ab × aa (Figure 1B), and the counts of the four genotypes as ,,, and at the two SNPs segregating in aa × ab (Figure 1C), then the likelihood of and can be expressed, under the assumption of coupling linkage phase, as
where and . The maximum likelihood estimates (MLEs) of and can be easily obtained as
To test if the CO rates of the two sexes are equal or not, the null hypothesis is defined as , under which the likelihood can be written as
and the ML estimate is derived as
Therefore, the log-likelihood ratio (LR) of the full model over the null model is expressed as
which is asymptotically distributed as a chi-square distribution with 1 degree of freedom.
4.4. Analysis of CO Interference in Both Parents
Suppose that three adjacent RAD tags 1, 2 and 3 are located in such an order on thw chromosome, each containing two SNPs with different segregation types (Figure 5A). For the SNPs of 1, 3, and 5 that segregate in ab × aa on the three RAD tags (Figure 5B), let denote the CoC between the two adjacent SNP intervals for the female parent and the frequencies of crossovers occurred () or not () in the first interval, and occurred () or not () in the second interval. Then, we have the relationships between the CoC and the CO rates under the assumption of coupling linkage phases, as the following:
where and are the CO rates of the first and second intervals, respectively. Therefore, the likelihood of the CO rates and the CoC can be written as
from which the MLEs of the parameters , , and can be obtained as the following (Supplementary Text S1):
where . To test if the crossover interference exists between the two adjacent SNP intervals, we applied the LR statistic as
where and denote the counts and frequencies of crossovers similar to Equation (6) containing the CO rates of the first and second SNP intervals and the parameter . Meanwhile, the LR statistic for testing the existence of the CO interference can be applied and has the same form as Equation (9).
The above analyses of CO interference are under the assumption of the coupling linkage phase, i.e., the Case 1 of linkage phases as described in Supplementary Text S1. For the other cases of linkage phases, the corresponding likelihoods and LR statistics largely have the same forms as above, but with different forms of exponents in Equations (7) and (10), which lead to the MLEs of the parameters as modified versions of Equation (8).
To compare the difference of CO interference between the two parents, we used the R package xoi to estimate the strength of interference by fitting a gamma model to the distribution of observed crossover [53]. The parameter of the fitted gamma distribution is a measure of the strength of CO interference, corresponding to no, positive, and negative interference for , , and , respectively. The comparison of interference strength between two sexes was performed using a student’s t test on the values estimated from each chromosome.
Supplementary Materials
The following supporting information can be downloaded at: https://www.mdpi.com/article/10.3390/plants11081046/s1. Table S1: (SuppFileS1.xlsx) The RADseq data information for the two parents and 257 progenies in the F1 hybrid population of Populus deltoides and Populus simonii. Text S1: (SuppFileS2.pdf) Calculation of the coefficient of coincidence between the two adjacent SNP intervals for the female parent in an F1 population of Populus deltoides and Populus simonii.
Author Contributions
C.T. conceived and designed the research. Z.L., W.Z., J.Z., Z.P. and S.B. performed experiments. Z.L. and C.T. analysed data and wrote the manuscript. All authors have read and agreed to the published version of the manuscript.
Funding
This research was funded by the National Natural Science Foundation of China (Grant No. 31870654 and 31270706) awarded to C.T., and the Priority Academic Program Development of Jiangsu Higher Education Institutions. The funding bodies were not involved in the design of the study, collection, analysis, and interpretation of data, and in writing the manuscript.
Data Availability Statement
The RADseq data for all individuals are available in the NCBI SRA database (http://www.ncbi.nlm.nih.gov/Traces/sra, accessed on 1 January 2022) with accession numbers listed in Supplementary Table S1.
Conflicts of Interest
The authors declare no conflict of interest.
References
- Rice, W.R. Experimental tests of the adaptive significance of sexual recombination. Nat. Rev. Genet. 2002, 3, 241–251. [Google Scholar] [CrossRef] [PubMed]
- Ortiz-Barrientos, D.; Engelstädter, J.; Rieseberg, L.H. Recombination rate evolution and the origin of species. Trends Ecol. Evol. 2016, 31, 226–236. [Google Scholar] [CrossRef] [PubMed]
- Carroll, D. Genetic Recombination. In Brenner’s Encyclopedia of Genetics, 2nd ed.; Maloy, S., Hughes, K., Eds.; Academic Press: San Diego, CA, USA, 2013; pp. 277–280. [Google Scholar]
- Keeney, S.; Giroux, C.N.; Kleckner, N. Meiosis-specific DNA double-strand breaks are catalyzed by Spo11, a member of a widely conserved protein family. Cell 1997, 88, 375–384. [Google Scholar] [CrossRef]
- Mercier, R.; Mézard, C.; Jenczewski, E.; Macaisne, N.; Grelon, M. The molecular biology of meiosis in plants. Annu. Rev. Plant Biol. 2015, 66, 297–327. [Google Scholar] [CrossRef] [PubMed]
- Gray, S.; Cohen, P.E. Control of meiotic crossovers: From double-stand break formation to designation. Annu. Rev. Genet. 2016, 50, 175–210. [Google Scholar] [CrossRef]
- Jones, G.H.; Franklin, F.C. Meiotic crossing-over: Obligation and interference. Cell 2006, 126, 246–248. [Google Scholar] [CrossRef]
- Mézard, C.; Tagliaro Jahns, M.; Grelon, M. Where to cross? New insights into the location of meiotic crossovers. Trends Genet. 2015, 31, 393–401. [Google Scholar] [CrossRef]
- do Vale Martins, L.; Yu, F.; Zhao, H.; Dennison, T.; Lauter, N.; Wang, H.; Deng, Z.; Thompson, A.; Semrau, K.; Rouillard, J.-M.; et al. Meiotic crossovers characterized by haplotype-specific chromosome painting in maize. Nat. Commun. 2019, 10, 4604. [Google Scholar] [CrossRef]
- Cole, F.; Baudat, F.; Grey, C.; Keeney, S.; De Massy, B.; Jasin, M. Mouse tetrad analysis provides insights into recombination mechanisms and hotspot evolutionary dynamics. Nat. Genet. 2014, 46, 1072–1080. [Google Scholar] [CrossRef]
- Li, R.; Bitoun, E.; Altemose, N.; Davies, R.W.; Davies, B.; Myers, S.R. A high-resolution map of non-crossover events reveals impacts of genetic diversity on mammalian meiotic recombination. Nat. Commun. 2019, 10, 3900. [Google Scholar] [CrossRef]
- Drouaud, J.; Mercier, R.; Chelysheva, L.; Berard, A.; Falque, M.; Martin, O.; Zanni, V.; Brunel, D.; Mezard, C. Sex-specific crossover distributions and variations in interference level along Arabidopsis thaliana chromosome 4. PLoS Genet. 2007, 3, 1096–1107. [Google Scholar] [CrossRef] [PubMed]
- Sardell, J.M.; Cheng, C.D.; Dagilis, A.J.; Ishikawa, A.; Kitano, J.; Peichel, C.L.; Kirkpatrick, M. Sex differences in recombination in Sticklebacks. G3-Genes Genomes Genet. 2018, 8, 1971–1983. [Google Scholar] [CrossRef] [PubMed]
- Apuli, R.P.; Bernhardsson, C.; Schiffthaler, B.; Robinson, K.M.; Jansson, S.; Street, N.R.; Ingvarsson, P.K. Inferring the genomic landscape of recombination rate variation in European Aspen (Populus tremula). G3-Genes Genomes Genet. 2020, 10, 299–309. [Google Scholar] [CrossRef] [PubMed]
- Nachman, M.W. Variation in recombination rate across the genome: Evidence and implications. Curr. Opin. Genet. Dev. 2003, 12, 657–663. [Google Scholar] [CrossRef]
- Stapley, J.; Feulner, P.G.D.; Johnston, S.E.; Santure, A.W.; Smadja, C.M. Variation in recombination frequency and distribution across eukaryotes: Patterns and processes. Philos. Trans. R. Soc. B Biol. Sci. 2017, 372, 20160455. [Google Scholar] [CrossRef]
- Wilfert, L.; Gadau, J.; Schmid-Hempel, P. Variation in genomic recombination rates among animal taxa and the case of social insects. Heredity 2007, 98, 189–197. [Google Scholar] [CrossRef]
- Dumont, B.L.; Payseur, B.A. Evolution of the genomic rate of recombination in mammals. Evolution 2008, 62, 276–294. [Google Scholar] [CrossRef]
- Jaramillo-Correa, J.P.; Verdú, M.; González-Martínez, S.C. The contribution of recombination to heterozygosity differs among plant evolutionary lineages and life-forms. BMC Evol. Biol. 2010, 10, 22. [Google Scholar] [CrossRef]
- Jensen-Seaman, M.I.; Furey, T.S.; Payseur, B.A.; Lu, Y.T.; Roskin, K.M.; Chen, C.F.; Thomas, M.A.; Haussler, D.; Jacob, H.J. Comparative recombination rates in the rat, mouse, and human genomes. Genome Res. 2004, 14, 528–538. [Google Scholar] [CrossRef]
- Fang, L.; Ye, J.; Li, N.; Zhang, Y.; Li, S.; Wong, G.K.-S.; Wang, J. Positive correlation between recombination rate and nucleotide diversity is shown under domestication selection in the chicken genome. Chin. Sci. Bull. 2008, 53, 746–750. [Google Scholar] [CrossRef]
- Tiley, G.P.; Burleigh, J.G. The relationship of recombination rate, genome structure, and patterns of molecular evolution across angiosperms. BMC Evol. Biol. 2015, 15, 194. [Google Scholar] [CrossRef]
- Jabbari, K.; Wirtz, J.; Rauscher, M.; Wiehe, T. A common genomic code for chromatin architecture and recombination landscape. PLoS ONE 2019, 14, e0213278. [Google Scholar] [CrossRef] [PubMed]
- Dreissig, S.; Mascher, M.; Heckmann, S. Variation in recombination rate is shaped by domestication and environmental conditions in barley. Mol. Biol. Evol. 2019, 36, 2029–2039. [Google Scholar] [CrossRef]
- Kawakami, T.; Wallberg, A.; Olsson, A.; Wintermantel, D.; De Miranda, J.R.; Allsopp, M.; Rundlöf, M.; Webster, M.T. Substantial heritable variation in recombination rate on multiple scales in honeybees and bumblebees. Genetics 2019, 212, 1101–1119. [Google Scholar] [CrossRef] [PubMed]
- de Massy, B. Distribution of meiotic recombination sites. Trends Genet. 2003, 19, 514–522. [Google Scholar] [CrossRef]
- Mézard, C.; Vignard, J.; Drouaud, J.; Mercier, R. The road to crossovers: Plants have their say. Trends Genet. 2007, 23, 91–99. [Google Scholar] [CrossRef] [PubMed]
- Sun, L.; Wang, J.; Sang, M.; Jiang, L.; Zhao, B.; Cheng, T.; Zhang, Q.; Wu, R. Landscaping crossover interference across a genome. Trends Plant Sci. 2017, 22, 894–907. [Google Scholar] [CrossRef]
- Sturtevant, A.H. The linear arrangement of six sex-linked factors in Drosophila, as shown by their mode of association. J. Exp. Zool. 1913, 14, 43–59. [Google Scholar] [CrossRef]
- Auger, D.L.; Sheridan, W.F. Negative crossover interference in maize translocation heterozygotes. Genetics 2001, 159, 1717–1726. [Google Scholar] [CrossRef]
- Berchowitz, L.; Copenhaver, G. Genetic Interference: Dont Stand So Close to Me. Curr. Genom. 2010, 11, 91–102. [Google Scholar] [CrossRef]
- Strickland, W.N. An analysis of interference in Aspergillus nidulans. Proc. R. Soc. Lond. Ser. B-Biol. Sci. 1958, 149, 82–101. [Google Scholar] [CrossRef]
- Campbell, C.L.; Bhérer, C.; Morrow, B.E.; Boyko, A.R.; Auton, A. A pedigree-based map of recombination in the domestic dog genome. G3 Genesgenetics 2016, 6, 3517–3524. [Google Scholar] [CrossRef] [PubMed]
- Petkov, P.M.; Broman, K.W.; Szatkiewicz, J.P.; Paigen, K. Crossover interference underlies sex differences in recombination rates. Trends Genet. 2007, 23, 539–542. [Google Scholar] [CrossRef] [PubMed]
- Torgasheva, A.A.; Borodin, P.M. Immunocytological analysis of meiotic recombination in the Gray Goose (Anser anser). Cytogenet. Genome Res. 2017, 151, 27–35. [Google Scholar] [CrossRef]
- Hou, Y.; Fan, W.; Yan, L.; Li, R.; Lian, Y.; Huang, J.; Li, J.; Xu, L.; Tang, F.; Xie, X.S.; et al. Genome analyses of single human oocytes. Cell 2013, 155, 1492–1506. [Google Scholar] [CrossRef]
- Campbell, C.L.; Furlotte, N.A.; Eriksson, N.; Hinds, D.; Auton, A. Escape from crossover interference increases with maternal age. Nat. Commun. 2015, 6, 6260. [Google Scholar] [CrossRef]
- Ma, L.; O’Connell, J.R.; Vanraden, P.M.; Shen, B.; Padhi, A.; Sun, C.; Bickhart, D.M.; Cole, J.B.; Null, D.J.; Liu, G.E. Cattle sex-specific recombination and genetic control from a large pedigree analysis. PLoS Genet. 2015, 11, e1005387. [Google Scholar] [CrossRef]
- Wang, Z.; Shen, B.; Jiang, J.; Li, J.; Ma, L. Effect of sex, age and genetics on crossover interference in cattle. Sci. Rep. 2016, 6, 37698. [Google Scholar] [CrossRef]
- Basu-Roy, S.; Gauthier, F.; Giraut, L.; Mezard, C.; Falque, M.; Martin, O.C. Hot regions of noninterfering crossovers coexist with a nonuniformly interfering pathway in Arabidopsis thaliana. Genetics 2013, 195, 769–779. [Google Scholar] [CrossRef]
- Cronk, Q.C. Plant eco-devo: The potential of poplar as a model organism. New Phytol. 2005, 166, 39–48. [Google Scholar] [CrossRef]
- Gaudet, M.; Jorge, V.; Paolucci, I.; Beritognolo, I.; Mugnozza, G.S.; Sabatti, M. Genetic linkage maps of Populus nigra L. including AFLPs, SSRs, SNPs, and sex trait. Tree Genet. Genomes 2008, 4, 25–36. [Google Scholar] [CrossRef]
- Mousavi, M.; Tong, C.; Liu, F.; Tao, S.; Shi, J. De novo SNP discovery and genetic linkage mapping in Poplar using restriction site associated DNA and whole-genome sequencing technologies. BMC Genom. 2016, 17, 656. [Google Scholar] [CrossRef] [PubMed]
- Pakull, B.; Groppe, K.; Meyer, M.; Markussen, T.; Fladung, M. Genetic linkage mapping in aspen (Populus tremula L. and Populus tremuloides Michx.). Tree Genet. Genomes 2009, 5, 505–515. [Google Scholar] [CrossRef]
- Paolucci, I.; Gaudet, M.; Jorge, V.; Beritognolo, I.; Terzol, S.; Kuzminsky, E.; Muleo, R.; Mugnozza, G.S.; Sabatti, M. Genetic linkage maps of Populus alba L. and comparative mapping analysis of sex determination across Populus species. Tree Genet. Genomes 2010, 6, 863–875. [Google Scholar] [CrossRef]
- Tong, C.; Li, H.; Wang, Y.; Li, X.; Shi, J. Construction of high-density linkage maps of Populus deltoides × P. simonii using restriction-site associated DNA sequencing. PLoS ONE 2016, 11, e0150692. [Google Scholar] [CrossRef] [PubMed]
- Wang, J.; Street, N.R.; Scofield, D.G.; Ingvarsson, P.K. Natural selection and recombination rate variation shape nucleotide polymorphism across the genomes of three related Populus species. Genetics 2016, 202, 1185–1200. [Google Scholar] [CrossRef]
- Wu, H.N.; Yao, D.; Chen, Y.H.; Yang, W.G.; Zhao, W.; Gao, H.; Tong, C.F. De novo genome assembly of Populus simonii further supports that Populus simonii and Populus trichocarpa belong to different sections. G3-Genes Genomes Genet. 2020, 10, 455–466. [Google Scholar] [CrossRef]
- Fierst, J.L. Using linkage maps to correct and scaffold de novo genome assemblies: Methods, challenges, and computational tools. Front. Genet. 2015, 6, 220. [Google Scholar] [CrossRef]
- Tong, C.; Yao, D.; Wu, H.; Chen, Y.; Yang, W.; Zhao, W. High-quality SNP linkage maps improved QTL mapping and genome assembly in Populus. J. Hered. 2020, 111, 515–530. [Google Scholar] [CrossRef]
- Patel, R.K.; Jain, M. NGS QC Toolkit: A toolkit for quality control of next generation sequencing data. PLoS ONE 2012, 7, e30619. [Google Scholar] [CrossRef]
- Yao, D.; Wu, H.; Chen, Y.; Yang, W.; Gao, H.; Tong, C. gmRAD: An integrated SNP calling pipeline for genetic mapping with RADseq across a hybrid population. Brief. Bioinform. 2020, 21, 329–337. [Google Scholar] [CrossRef] [PubMed]
- Broman, K.W.; Weber, J.L. Characterization of human crossover interference. Am. J. Hum. Genet. 2000, 66, 1911–1926. [Google Scholar] [CrossRef] [PubMed]
- Giraut, L.; Falque, M.; Drouaud, J.; Pereira, L.; Martin, O.C.; Mézard, C. Genome-wide crossover distribution in Arabidopsis thaliana meiosis reveals sex-specific patterns along chromosomes. PLoS Genet. 2011, 7, e1002354. [Google Scholar] [CrossRef] [PubMed]
- Lagercrantz, U.; Lydiate, D.J. RFLP mapping in Brassica nigra indicates differing recombination rates in male and female meioses. Genome 1995, 38, 255–264. [Google Scholar] [CrossRef]
- Kianian, P.M.A.; Wang, M.H.; Simons, K.; Ghavami, F.; He, Y.; Dukowic-Schulze, S.; Sundararajan, A.; Sun, Q.; Pillardy, J.; Mudge, J.; et al. High-resolution crossover mapping reveals similarities and differences of male and female recombination in Maize. Nat. Commun. 2018, 9, 10. [Google Scholar] [CrossRef] [PubMed]
- Grattapaglia, D.; Sederoff, R. Genetic linkage maps of Eucalyptus grandis and Eucalyptus urophylla using a pseudo-testcross: Mapping strategy and RAPD markers. Genetics 1994, 137, 1121–1137. [Google Scholar] [CrossRef]
- Maliepaard, C.; Jansen, J.; Van Ooijen, J.W. Linkage analysis in a full-sib family of an outbreeding plant species: Overview and consequences for applications. Genet. Res. 1997, 70, 237–250. [Google Scholar] [CrossRef]
- Tong, C.; Zhang, B.; Shi, J. A hidden Markov model approach to multilocus linkage analysis in a full-sib family. Tree Genet. Genomes 2010, 6, 651–662. [Google Scholar] [CrossRef]
- Davey, J.W.; Hohenlohe, P.A.; Etter, P.D.; Boone, J.Q.; Catchen, J.M.; Blaxter, M.L. Genome-wide genetic marker discovery and genotyping using next-generation sequencing. Nat. Rev. Genet. 2011, 12, 499–510. [Google Scholar] [CrossRef]
- Baird, N.A.; Etter, P.D.; Atwood, T.S.; Currey, M.C.; Shiver, A.L.; Lewis, Z.A.; Selker, E.U.; Cresko, W.A.; Johnson, E.A. Rapid SNP discovery and genetic mapping using sequenced RAD markers. PLoS ONE 2008, 3, e3376. [Google Scholar] [CrossRef]
- Lenormand, T.; Dutheil, J. Recombination difference between sexes: A role for haploid selection. PLoS Biol. 2005, 3, 396–403. [Google Scholar] [CrossRef] [PubMed]
- Wang, P.; Jiang, L.; Ye, M.; Zhu, X.; Wu, R. The genomic landscape of crossover interference in the desert tree Populus euphratica. Front. Genet. 2019, 10, 440. [Google Scholar] [CrossRef] [PubMed]
- Housworth, E.A.; Stahl, F.W. Crossover interference in humans. Am. J. Hum. Genet. 2003, 73, 188–197. [Google Scholar] [CrossRef] [PubMed]
- Van Ooijen, J.W. JoinMap 4, Software for the Calculation of Genetic Linkage Maps in Experimental Populations; Kyazma B. V.: Wageningen, The Netherlands, 2006. [Google Scholar]
- Lander, E.S.; Green, P.; Abrahamson, J.; Barlow, A.; Daly, M.J.; Lincoln, S.E.; Newburg, L. MAPMAKER: An interactive computer package for constructing primary genetic linkage maps of experimental and natural populations. Genomics 1987, 1, 174–181. [Google Scholar] [CrossRef]
- Lander, E.S.; Botstein, D. Mapping Mendelian factors underlying quantitative traits using RFLP linkage maps. Genetics 1989, 121, 185–199. [Google Scholar] [CrossRef]
- Zeng, Z.-B. Precision mapping of quantitative trait loci. Genetics 1994, 136, 1457–1468. [Google Scholar] [CrossRef]
- Bartholomé, J.; Mandrou, E.; Mabiala, A.; Jenkins, J.; Nabihoudine, I.; Klopp, C.; Schmutz, J.; Plomion, C.; Gion, J.M. High-resolution genetic maps of Eucalyptus improve Eucalyptus grandis genome assembly. New Phytol. 2015, 206, 1283–1296. [Google Scholar] [CrossRef]
- Li, H.; Durbin, R. Fast and accurate short read alignment with Burrows-Wheeler transform. Bioinformatics 2009, 25, 1754–1760. [Google Scholar] [CrossRef]
- Li, H.; Handsaker, B.; Wysoker, A.; Fennell, T.; Ruan, J.; Homer, N.; Marth, G.; Abecasis, G.; Durbin, R. The Sequence Alignment/Map format and SAMtools. Bioinformatics 2009, 25, 2078–2079. [Google Scholar] [CrossRef]


Publisher’s Note: MDPI stays neutral with regard to jurisdictional claims in published maps and institutional affiliations. |
© 2022 by the authors. Licensee MDPI, Basel, Switzerland. This article is an open access article distributed under the terms and conditions of the Creative Commons Attribution (CC BY) license (https://creativecommons.org/licenses/by/4.0/).