Abstract
Chitinase (EC 3.2.1.14) is a kind of chitin-degrading glycosidase, which plays important roles in the abiotic and biotic defense of plants. In this study, we conducted whole-genome annotation, molecular evolution, and gene expression analyses on the chitinase-like (CTL) gene family members of Petunia axillaris. Thirty-three Petunia axillaris chitinase-like genes (PaCTLs) were identified from the latest Petunia genome database. According to the phylogenetic analyses, these genes were divided into GH18 and GH19 subgroups and further subdivided into five classes (Class I to Class V). Conserved motif arrangements indicated their functional relevance within each group. The expansion and homeology analyses showed that gene replication events played an important role in the evolution of PaCTLs and the increase of the GH18 subgroup members was the main reason for the expansion of the PaCTL gene family in the evolution progress. By qRT-PCR analysis, we found that most of the PaCTLs showed a very low expression level in the normal growing plants. But lots of PaCTLs showed upregulated expression profiles when the plants suffered different abiotic stress conditions. Among them, five PaCTLs responded to high temperature and exhibited significantly upregulate expression level. Correspondingly, many hormone responses, as well as biotic and abiotic stress elements were found in the promoters of PaCTLs by using cis-acting element analysis. These results provide a foundation for the exploration of PaCTLs’ function and enrich the evolutionary process of the CTL gene family.
1. Introduction
Chitinase is a glycoside hydrolase capable of hydrolyzing chitin. In plants, it is one of the pathogenesis-related genes (PRs) [1]. Although plants do not contain chitin, the expression activity of many chitinases was enhanced under the influence of abiotic and biotic stresses and exogenous hormones [2,3,4]. Experiments in recent years have proved that it also plays an important regulatory role in the growth and development of plants.
Based on previous research, chitinase-like proteins (CTLs) can be induced to product while the plant suffering with the pathogens, salt, drought, intracellular Ca2+, and freeze damage ect [5,6,7]. The chitinase-like genes (CTLs) cloned in Mulberry badnavirus, Oryza sativa, and Arabidopsis thaliana played important roles in the pest, disease, and environmental stress defense [8,9,10]. Furthermore, some plant species could grow better when introduced with exogenous chitinase during the vegetative growth process. The expression of a rice chitinase gene in transgenic banana enhances the resistance to black leaf streak disease [5]. The expression of rice chitinase gene in genetically engineered tomato confers enhanced resistance to Fusarium wilt and Early blight [6]. In addition, lots of CTLs have been characterized in plants in regulating their growth and developmental processes. Robinson et al. [11] showed that some chitinase were closely related to the maturation of grapes and had tissue or organ expression specificity. In carrots, the chitinase gene can participate in the control of the development of early embryos [12]. Jiao et al. [13] proved that the overexpression of ZmCTL1 in maize enhanced mechanical stalk strength without affecting plant stature, senescence, or fertility. The AtCTL1 in A. thaliana negatively regulated ACO (1-aminocyclopropane-1-carboxylic acid oxidase) activity and ethylene response [14]. When one CTL in Capsicum annuum, CaChiIV1, is silenced, plants suffered weakened defense because root activity is reduced to 60% and susceptibility to salt stress is increased [1]. Transgenic tea could grow better and has enhanced resistance to blister blight through the overexpression of the Class I chitinase gene from potato [7]. Moreover, CTLs also have been proven to participate in the photosynthesis process [15].
In plants, CTLs are encoded by a multi-gene family. Recently, 16 and 43 CTLs were identified from C. annuum and Solanum lycopersicum, respectively [1,10]. Based on the amino acid sequence similarity and the presence or absence of a domain, they were divided into two glycosyl hydrolase subgroups (GH18 and GH19 subgroups). Kesari et al. [9] subdivided chitinase into six categories (Class I–VI), in which Class III and Class V belong to the GH18 subgroup, and the rest belong to the GH19 subgroup. Their research point is that the homology between Classes III and V is very low, and both classes have no similarity with the chitinase sequences of the GH19 subgroup. Besides, chitinase were divided into five categories (Class I–V) in some other reports based on amino acid sequence homology, 3D protein structure, substrate specificity, catalytic reaction mechanism, sensitivity to inhibitors, and other properties [1,8,10,16,17,18,19]. Among them, Class I and Class IV members have chitin-binding domain (CBD) and GH19 domain (the difference between them is that Class I also has a C-terminal conserved domain). The CBD structure is essential for chitinase because it can enhance resistance to abiotic and biotic stresses and promote plant growth and development. According to the research of Yamagami and Funatsu [20], the chitinase with CBD were three times more active against colloidal chitin than the other without CBD. Furthermore, the chitinase will have little change in the hydrolysis of ethylene glycol chitin if CBD was removed, but its activity on colloidal chitin will only be equivalent to 50% before removal. Moreover, the chitinase with CBD is more resistant to pathogens than the chitinase without CBD [21]. These results indicated that identifying chitinase and analyzing their structures are very important in exploring their function in growth regulation and stress response.
Petunia is an important model plant in the Solanaceae family. It is widely used in the study of flower molecular biology. The growth of petunia is affected by many biotic and abiotic stress factors, which led to a decline in their growth, quality, and ornamental nature. As a plant is unable to escape attacking biotic and abiotic factors by moving to a more favorable environment, it is necessary to possess efficient defense mechanisms to protect itself from disease [22]. However, at present, only a small amount of literature has been published on the genetic verification of petunia’s chitinase [23,24]. Moreover, no systematic investigation has been conducted on the CTLs family in petunia. In the current study, we identified 33 Petunia axillaris chitinase-like genes (PaCTLs) and performed an integrated analysis of their phylogeny, gene structures, motifs, and cis-acting elements of promoters to further understand their mechanisms. Subsequently, we characterized their expression profiles in different tissues under normal growth conditions and in seedlings under abiotic stress conditions. Our research provides a foundation for the further characterization of PaCTLs and enriches the evolutionary process of the CTL gene family.
2. Results
2.1. Identification of Putative CTLs in P. axillaris Genome
According to sequence alignment and functional domain analysis, we identified 33 PaCTLs in the petunia genome, which were distributed in 23 scaffolds (Table S1). The predicted results showed that their amino acid lengths vary greatly, ranging from 95 AA (Pa00167g00056.1) to 503 AA (Pa00180g00126.1). Among them, 26 PaCTLs, which comprised 24 secretory proteins and two mitochondrial proteins contained a signal peptide respectively. The remaining seven members (Pa00111g00047.1, Pa00836g00311.1, Pa00589g00225.1, Pa00585g00083.1, Pa00045g00450.1, Pa00347g00041.1, and Pa00347g00043.1) did not contain signal peptide. Furthermore, according to the predictions of three different sites, CELL02G0, BUSCA and WoLF PSORT (Table S2), all the GH19 proteins were located extracellular. However, the location of GH18 proteins were more complex, which could be found in the nucleus, chloroplasts, mitochondria, etc.
We constructed a phylogenetic tree using the chitinase sequences of A. thaliana, H. sapiens, P. abies, and Z. mays to better understand the similarity, difference, and classification of PaCTL gene family members (Figure 1a). The result showed that all the 65 CTLs were classified into two subgroups, the GH18 and GH19. There were twenty-two (66.7%) and eleven (33.3%) numbers belonged to GH18 and GH19, respectively. According to the sequence similarity and previous research [1,10,19], the CTL numbers were further subdivided them into five classes (Class I–V). Among them, class III and class V belonged to the GH18 subgroup including seventeen and five numbers, respectively. Class I, II, and IV belonged to the GH19 subgroup and comprised of two, seven, and two numbers, respectively.
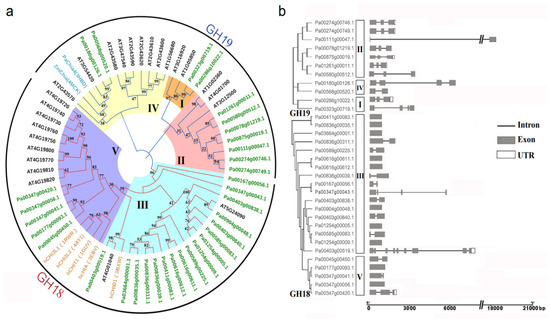
Figure 1.
Classification and gene structure analyses of predicted PaCTLs. (a) Phylogenetic tree of the CTLs from P. axillaris, A. thaliana, Z. mays, P. abies, and H. sapiens (the names marked in green, black, dark cyan and orange respectively). The five classes (I–V) were assigned according to the ortholog structure and function published in other research report. (b) Schematic depictions of the exon-intron organizations of the PaCTLs.
2.2. Analysis of the Gene Structure and Conserved Motifs of the PaCTLs
Intron–exon structure analysis was performed to further study the structural diversity of PaCTLs (Figure 1b). The result showed that all of the PaCTLs in GH19 subgroup contained introns. In contrast, only twelve members (54.5%) in GH18 subgroup contained introns, and the member Pa00403g00519.1 contained the most introns (8 introns). Among them, Pa00111g00047.1 had the longest intron sequence. Ten members of the 33 PaCTLs (30.3%) did not contain introns, 11 members (33.3%) contained one intron, eight members (24.2%) contained two introns, and three members (9%) contained three introns.
The conserved motifs were investigated to analyze the diversification of PaCTL proteins (Figure 2, Figures S1 and S2). We analyzed 16 putative motif sequences that could correspond to the different conservative structures of the GH group by Pfam search in NCBI. The members of a certain class exhibited higher identity. All the members of Classes I, II, and IV belonged to the GH19 subgroup contained the GH19_2 signal motif. Four members of Class II and both members of Class IV contained the chitin recognition or binding domain signal motif. Almost all of the PaCTLs in GH18 subgroup contained the Glyco_hydro_18 motif except two members (Pa00167g00056.1 and Pa00347g00043.1), and all the five members belonged to Class V contained chitinase GH18 signal motif. Though the GH18 conserved domain of two members (Pa00403g00519.1 and Pa00347g00043.1) did not detect by MEME online service website, it could be searched through the CD-search function in the NCBI website.
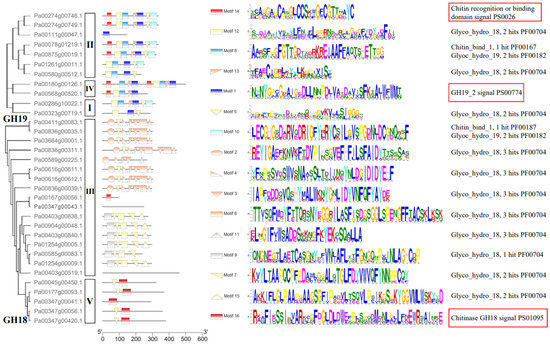
Figure 2.
Domain architecture of predicted PaCTLs. The motifs indicated by red boxes were the typical motifs of the GH18 and GH19 subgroups.
2.3. The Evolution Events of the CTL Gene Family in P. axillaris
As shown in Figure 3a, 33 PaCTLs and 25 Arabidopsis CTLs members were grouped into two major groups, GH18 and GH19 subfamilies. According to the phylogenetic relationships, we identified the nodes that lead to A. thaliana–specific and P. axillaris–specific branches, which represented the most recent common ancestral genes before they split. The results showed that there were at least 19 CTLs ancestor genes between the two species. There are 6 branches contained only PaCTLs (red arrow) and 7 branches contained only Arabidopsis CTLs (black arrow), indicating that these branches may have occurred gene losses during the evolutionary process. Meanwhile, we calculated the obtained or lost of CTLs in A. thaliana and P. axillaris during the evolution progress. In the GH18 subfamily, there were at least 11 common CTLs ancestor genes between petunia and Arabidopsis (Figure 4). After split, petunia gained 14 and lost 3 members, and Arabidopsis gained 5 and lost 5 members, resulting in 22 and 11 GH18 subfamily members, respectively. Apparently, petunias gained much more new members than Arabidopsis, which has led to the rapid expansion of the GH18 subfamily in petunia. In the GH19 subfamily, there were at least 8 common CTLs ancestor genes between petunia and Arabidopsis (Figure 4). During the evolution process, petunia gained 7 and lost 4 CTLs members, Arabidopsis gained 7 and lost 1 CTLs members, which resulted in more GH19 subfamily CTLs members in Arabidopsis than that in petunia.
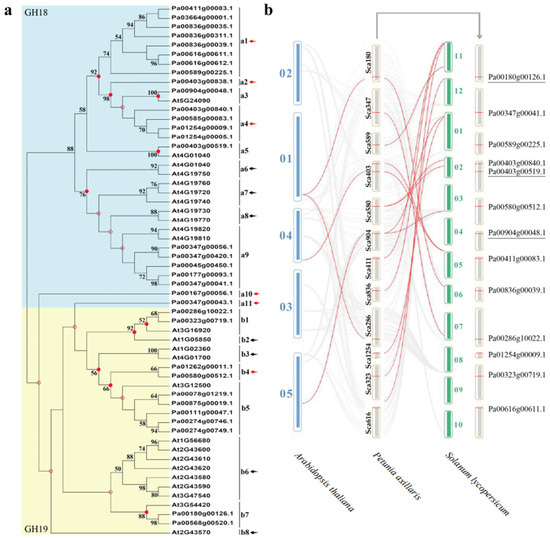
Figure 3.
Phylogenetic tree construction and homeology analysis. (a) The phylogenetic tree of CTLs from P. axillaris and A. thaliana. Numbers on branches indicate the bootstrap percentage values calculated from 1000 replicates, and only values higher than 50% are shown. The nodes that represent the most recent common ancestral genes before the P. axillaris and A. thaliana split are indicated by red dots (bootstrap support > 50%) and hollow dots (bootstrap support < 50%). Clades that contain only P. axillaris and A. thaliana CTLs are indicated by red and black arrows, respectively. (b) The homeology analysis of CTLs from petunia, Arabidopsis and tomato genomes. The gray lines in the background indicate the homologous relationship within P. axillaris and the other two plant genomes, while the red lines highlight the members of the CTL gene family that have a homologous relationship between two genomes.
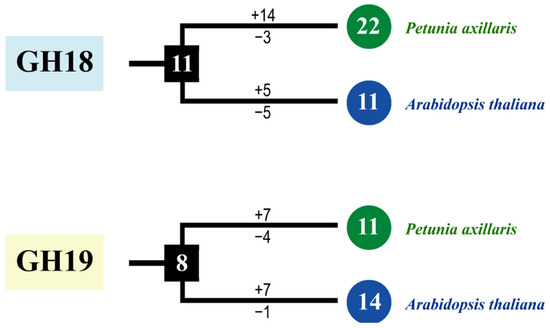
Figure 4.
The copy number changes of P. axillaris and A. thaliana CTLs. Numbers in ellipses and rectangles represent the numbers of CTLs in extant and ancestral species, respectively. Numbers on branches with plus and minus symbols represent the numbers of gene gains and losses, respectively.
Homology analysis of CTL gene family members in A. thaliana, P. axillaris and S. lycopersicum indicated that there were homologous relationships among them. As shown in Figure 3b, lots of CTLs in the A. thaliana and S. lycopersicum genomes had homologous relationship with PaCTLs. Furthermore, among the 33 PaCTLs, four members (Pa00180g00126.1, Pa00904g00048.1, Pa00403g00519.1 and Pa00286g10022.1) were homologous with three CTLs in A. thaliana genomes. There were 12 PaCTLs members (Pa00904g00048.1, Pa00589g00225.1, Pa00580g00512.1, Pa00180g00126.1, Pa00836g00039.1, Pa00403g00519.1, Pa00403g00840.1, Pa00411g00083.1, Pa00323g00719.1, Pa00347g00041.1, Pa01254g00009.1, Pa00616g00611.1) were homologous with 10 members in S. lycopersicum genome. Three PaCTLs members (Pa00180g00126.1, Pa00904g00048.1 and Pa00403g00519.1) were homologous with CTLs both in A. thaliana and in S. lycopersicum genomes.
To explore the relationship of the orthologous gene pairs of CTLs between S. lycopersicum and P. axillaris, the nonsynonymous substitution rates (Ka), synonymous substitution rates (Ks) and Ka/Ks were calculated. According to the result, all the Ka/Ks ratios were less than 0.5, which indicated that purifying selection was the dominant force driving the evolution of CTLs between the two species (Table S3). Furthermore, we constructed the phylogenetic tree using the CTLs of five Solanaceous species (P. axillaris, N. tabacum, S. lycopersicum, S. tuberosum, and C. annuum) and A. thaliana (Figure S3). The statistics on the member numbers of the different classes (I–V) of the six species (Table S4) showed that the CTLs in Solanaceous plants belong to Class III increased remarkably compared with those in A. thaliana. Moreover, the CTLs of S. lycopersicum and S. tuberosum in Class II increased rapidly and were all 11 more than in the Class II of A. thaliana. These finding indicated that the increase of the GH18 subgroup members might be the main cause for the expansion of CTL gene family in P. axillaris, N. tabacum, and C. annuum, while the increase of CTLs in Class III and Class II might be the main cause for the expansion of CTL gene family in S. lycopersicum and S. tuberosum.
2.4. Profiling of PaCTLs Expression in Different Tissues
We detected the relative expression of PaCTL gene family members in seven tissues (roots, stems, leaves, 2–3 cm flower buds, 4–5 cm flower buds, open flowers, and tender capsule) by using qRT-PCR to further elucidate their expression characteristics in various vegetative and reproductive tissues of the normal growing plants (Figure 5). The results presented that the expression divergence between the PaCTLs of GH18 and GH19 sub group was quite obvious. Among the 11 PaCTLs in the GH19 subgroup, two genes (Pa00111g00047.1 and Pa00180g00126.1) were not expressed in all the seven tissues, and other nine genes (81.8%) could express in at least one tissue of the plant. It is worth mentioning that one gene, Pa00286g10022.1, had a higher expression level in reproduction tissue, and its expression level showed a gradual increase along with the reproductive development process. Among the PaCTLs in the GH18 subgroup, 14 members (66.7%) did not express in any of the seven tissues. One gene (Pa00403g00840.1) had a higher expression level in leaves. Taken together, most of the PaCTLs showed a very low expression level in normal growing plants.
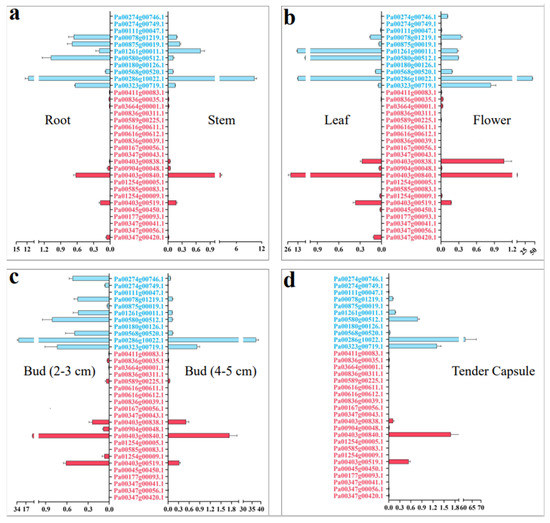
Figure 5.
Relative expression of the CTLs family members in the different tissues of P. axillaris. (a) Expression pattern in root and stem. (b) Expression pattern in leaf and open flower. (c) Expression pattern in 2–3 cm and 4–5 cm flower. (d) Expression pattern in tender capsule tissues. The genes marked in blue were the members of the GH19 subgroup, and the genes marked in red were the members of the GH18 subgroup.
The Ka, Ks, and Ka/Ks of eight PaCTLs paralog pairs were calculated to explore the relationship among the Ka, Ks, and the expression pattern of PaCTLs (Table S5). The result showed that the Ka/Ks value of one pair (Pa00274g00749.1/Pa00274g00746.1) was greater than 1, which indicated that they suffered a positive selection in the evolution process. The Ka/Ks values of the remaining seven pairs were all less than 1, which indicated that these pairs suffered purifying selection during the evolution progress. Genes with a higher degree of similarity tend to have similar expression characteristics. We verified whether the same event could be observed in PaCTLs by investigating the expression characteristics of the eight paralog pairs. Combined with the qRT-PCR analysis of the PaCTLs in different tissues (Figure 5), we found that these paralog genes could be divided into two kinds of expression patterns. In the first mode (mode I in Table S5), the paralog genes showed selective expression in different tissues. For example, one gene was expressed in the flower, and the other was not. A pair of paralog genes (Pa00274g00749.1/Pa00274g00746.1), which suffered a positive selection, falls into this category. In the second mode (mode II in Table S5), both of the paralog genes showed very low expression levels. Seven paralog pairs (Pa00836g00035.1/Pa00411g00083.1, Pa00836g00035.1/Pa00836g00311.1, Pa00411g00083.1/Pa03664g00001.1, Pa00411g00083.1/Pa00836g00311.1, Pa00616g00611.1/Pa00616g00612.1 Pa00836g00035.1/Pa03664g00001.1, and Pa03664g00001.1/Pa00836g00311.1) showed this expression pattern.
2.5. Expression Patterns of PaCTLs under Abiotic Stress and Hormone Treatment
We detected the expression of the 33 PaCTLs under low-temperature (4 °C), high-temperature (42 °C), drought, and salt stress environments in the seedlings to investigate their response to the stress environment (Figure 6 and Table S6). The result showed that, when the seedlings were subjected to a low-temperature environment, the expression levels of two members (Pa00347g00041.1 and Pa01254g00009.1) were remarkably increased compared with the control, and two other members (Pa00180g00126.1 and Pa01254g00005.1) also showed slightly up-regulated expression. When the seedlings were subjected to high-temperature environment, six members (Pa00323g00719.1, Pa00274g00746.1, Pa00274g00749.1, Pa00836g00039.1, Pa00347g00041.1, and Pa01254g00005.1) were expressed much higher than those in the control and 13 members (Pa00111g00047.1, Pa00875g00019.1, Pa00580g00512.1, Pa00180g00126.1, Pa00568g00520.1, Pa03664g00001.1, Pa00836g00035.1, Pa00411g00083.1, Pa00616g00612.1, Pa00589g00225.1, Pa00403g00840.1, Pa00347g00056.1, and Pa00045g00450.1) were remarkably downregulated. In the drought environment, the relative expression levels of three members (Pa00167g00056.1, Pa00347g00041.1, and Pa00904g00048.1) were upregulated. Thirteen members (Pa00875g00019.1, Pa00323g00719.1, Pa03664g00001.1, Pa00836g00035.1, Pa00411g00083.1, Pa00836g00311.1, Pa00616g00611.1, Pa00616g00612.1, Pa00589g00225.1, Pa00585g00083.1, Pa00347g00420.1, Pa00045g00450.1, and Pa00177g00093.1) had more than three times lower expression level than those in control. In addition, six members (Pa00078g01219.1, Pa00347g00041.1, Pa00347g00056.1, Pa00836g00039.1, Pa00904g00048.1, and Pa00347g00056.1) could respond to salt stress, and their expression level showed a certain increase. Nine members (Pa00111g00047.1, Pa01261g00011.1, Pa00286g10022.1, Pa00323g00719.1, Pa00403g00840.1, Pa01254g00005.1, Pa00403g00519.1, Pa00347g00420.1, and Pa00045g00450.1) were downregulated during salt stress. Taken together, the results showed that low temperature had the least effect on the expression of PaCTLs. The member Pa00347g00041.1 was upregulated in all of the four stress treatments. The upregulation of Pa00167g00056.1, Pa00836g00039.1, Pa01254g00005.1, and Pa00904g00048.1 could be observed in two different stress treatments. Furthermore, the expression level of most of the GH19 subgroup members was slightly changed except for two members (Pa00274g00749.1 and Pa00323g00719.1) which were considerably upregulated in response to high-temperature stress. The expression characteristics of GH18 subgroup members were quite divergent, but an obvious upregulation can be found in all the four stress treatments.
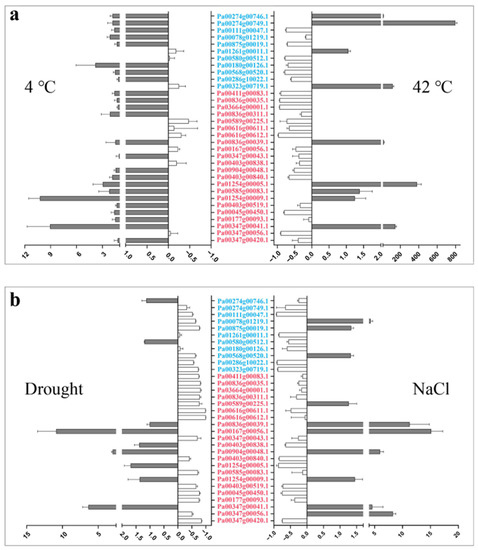
Figure 6.
Relative expression patterns of PaCTLs under abiotic stress conditions. (a) Relative expression patterns of the PaCTLs under low and high temperature stress. (b) Relative expression patterns of members of the PaCTLs under drought and salt stress. The abscissa value greater than 0 indicated the expression of PaCTL was up-regulated; The abscissa value less than 0 indicated the expression of PaCTL was down-regulated. The genes marked in blue were the members of the GH19 subgroup, and the genes marked in red were the members of the GH18 subgroup.
The expression patterns of PaCTLs were detected by qRT-PCR in the plants treated with Me-JA solution and SA solution after 0, 4, 8, 12, 16, 20, and 24 h respectively. As shown in Figure 7, the expression level could be classified into three kinds of response types, Including volatility recovery, volatility up, and volatility down. In the first type (Figure 7a), after being stimulated by exogenous Me-JA (methyl jasmonate) or SA (salicylic acid), PaCTLs formed a small peak of expression level, and then return to the expression level before treatment. There were 10 members (Pa00616g00612.1, Pa00286g10022.1, Pa00589g00225.1, Pa00585g00083.1, Pa00323g00719.1, Pa00111g00047.1, Pa00403g00838.1, Pa00347g00056.1, Pa00904g00048.1 and Pa00836g00039.1) belonged to this type. In the second type (Figure 7b), PaCTLs showed a fluctuating upward trend after being stimulated by exogenous hormones, and their relative expression level after 24 h were still higher than that before treatment. There were 15 members in total (Pa00568g00520.1, Pa03664g00001.1, Pa00180g00126.1, Pa01261g00011.1, Pa00580h00512.1, Pa01254g00009.1, Pa00347g00420.1, Pa00403g00840.1, Pa00078g01219.1, Pa00274g00746.1, Pa00616g00611.1, Pa00274g00749.1, Pa00875g00019.1, Pa00411g00083.1 and Pa00836g00035.1) falls into this category. In the third type (Figure 7c), the stimulation of exogenous hormones caused a decrease of the relative expression levels of PaCTLs members, but they basically returned to the pre-treatment levels after 24 h. Three members (Pa00347g00041.1, Pa01254g00005.1 and Pa00403g00519.1) belonged to this type. Five other members (Pa00836g00311.1, Pa00167g00056.1, Pa00347g00043.1, Pa00045g00450.1 and Pa00177g00093.1) had little change in their relative expression level after being stimulated by Me-JA and SA.
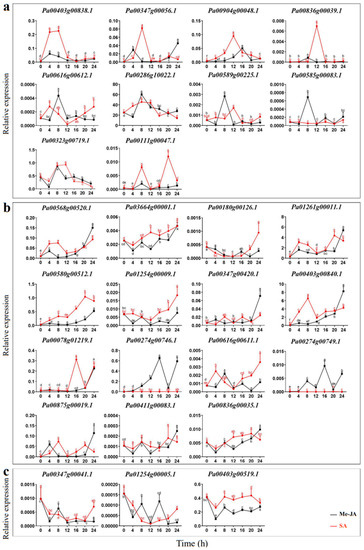
Figure 7.
Relative expression patterns of PaCTLs under the treatment of exogenous hormones. (a) The expression of PaCTLs showed a fluctuating recovery under the influence of exogenous hormones. (b) The expression of PaCTLs showed a fluctuating up-regulated under the influence of exogenous hormones. (c) The expression of PaCTLs showed a fluctuating down-regulated under the influence of exogenous hormones. Significant difference between group with variable letters above the line or bar are verified using two-way ANOVA and multiple t-test (p < 0.05) implemented in the Prism software version 8.
2.6. Cis-Acting Element Analysis of Promoter Region
The 2-kb upstream regions of the translation start site of the PaCTLs were analyzed to further investigate the possible involvement of cis-acting elements in the stimulation of defense-related genes. Statistical analysis revealed that multiple cis-acting elements conferring responsiveness to biotic and abiotic stresses and plant hormones were found in the promoters (Figure 8). The promoters of 15 PaCTLs contained defense and stress response elements (TC-rich repeats). Twenty promoters contained drought-inducing response elements (MBS), and 14 promoters included cryo-responsive elements (LTR). Anaerobic inducing element (ARE) widely existed and was missing in only three promoters (the promoters of Pa00286g10022.1, Pa00347g00041.1, and Pa00836g00039.1). Moreover, more than 5 AREs existed in the promoters of Pa00580g00512.1, Pa00836g00311.1, and Pa01254g00005.1. Nine promoters contained circadian response elements. A total of 26, 23, 25, 14, and 14 promoters contained abscisic acid response element (ABRE), jasmonic acid response element (CGTCA-motif), salicylic acid response element (TCA-element), gibberellin response element (TATC-box), and auxin response element (AuxRR-core), respectively. Many promoters contained multiple cis-acting elements. In addition, one promoter (the promoter of Pa00167g00056.1) contained the root-specific cis-element (motif I), two promoters (the promoters of Pa00403g00838.1 and Pa00374g0043.1) contained the wound response element (WUN-motif), one promoter (the promoter of Pa00323g00719.1) contained the flavonoid biosynthesis gene regulatory element (MBSI), and two promoters (the promoters of Pa00836g00311.1 and Pa00374g0043.1) contained cell cycle regulatory element (MSA-like).
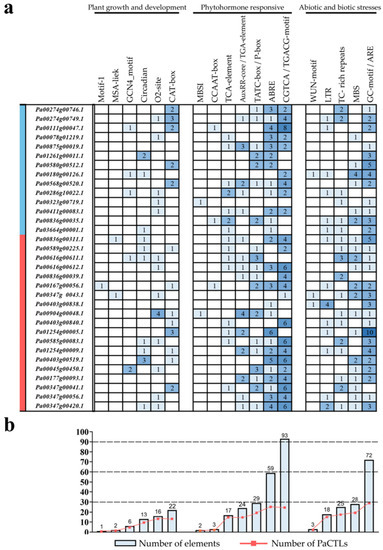
Figure 8.
Cis-acting elements analysis in the promoter of PaCTL gene family members. (a) Number of each cis-acting element in the promoter region (2 kb upstream of the translation start site) of PaCTLs. The genes marked in blue region were the members of the GH19 subgroup, and the genes marked in red region were the members of the GH18 subgroup. (b) Statistics for the total number of PaCTLs, including the corresponding cis-acting elements (red dot) and the total number of cis-acting elements in PaCTL gene family (blue box). Based on the functional annotation, the cis-acting elements were classified into three major classes: plant growth and development-, phytohormone responsive-, or abiotic and biotic stresses-related cis-acting elements.
2.7. Subcellular Localization of PaCTL Proteins
In this study, the three programs (CELL02G0, BUSCA and WoLF PSORT) were used to predict the subcellular location of eukaryotic proteins (Table S2). The result showed that these proteins were mainly located in extracellular, which indicated that these proteins might be secreted proteins. In order to examine the accuracy of the prediction results, we selected four PaCTL proteins (Pa00286g10022.1, Pa00347g00041.1, Pa01254g00005.1 and Pa01254g00009.1), which had a higher expression level in flower organ and stress environment to construct subcellular localization fusion expression vectors. After transient expression of the fusions in onion epidermis cells, the yellow fluorescent protein (YFP) signal were observed by confocal microscopy. Observations indicated that the fluorescent signals of the four proteins were ubiquitously distributed in the onion epidermal cells. To determine if these proteins could be localized on the cell wall, we performed a plasmolysis experiment by treatment with 0.3 g·mL−1 sucrose. After plasmolysis, the fluorescent signals could be observed in the cell wall (Figure 9). The results above indicated that the four PaCTL proteins were secreted proteins and could localize on the cell wall.
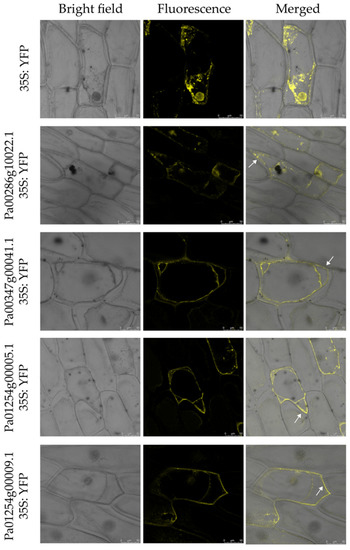
Figure 9.
Subcellular localization of four PaCTLs-yellow fluorescent protein (YFP) fusion proteins in onion epidermal cells. The middle row show fluorescence images of plasmolyzed transgenic cells. The fluorescence signal can be observed in the cell wall (white arrows). The left column are bright-field images of the corresponding onion epidermal cells. Scale bars = 50 µm.
3. Discussion
3.1. Evolution Analysis of the PaCTLs
Carbohydrate-active enzymes often exhibit a modular structure containing non-catalytic carbohydrate-binding modules, which enhance enzymatic activity by positioning the substrate closer to the catalytic domain [21]. Similarly, One CTL protein has multiple CBD domains, which may be closely related to the efficiency of protein binding to chitin [25,26]. Yamagami and Funatsu [20] demonstrated that the CTLs that possessed a CBD domain had stronger hydrolytic activity in rye plants than those without a CBD domain. According to this study, six PaCTLs (Pa00274g00746.1, Pa00274g00749.1, Pa00180g00126.1, Pa00568g00520.1, Pa00078g01219.1, and Pa00875g00019.1) in the GH19 subgroup and one member (Pa00167g00056.1) in the GH18 subgroup have one or two CBD structures (Figure 2, Figures S1 and S2), which may be able to recognize and respond to chitin quickly. Here, we hypothesized that these seven PaCTLs might have stronger hydrolase activity, but further experiments are needed to verify these inferences.
Gene duplication and loss play an important role in the evolution of novel functions and for shaping an organism’s gene content [2]. In this study, we found that four pairs of CTLs in the genomes of P. axillaris and A. thaliana had a homology relationship (Figure 3b). Eleven additional pairs of CTLs collinearly occurred in the P. axillaris and S. lycopersicum genomes with the continuous evolution of the species. These findings might prove that the CTLs will continue to evolve into new genes while still functional for various reasons, such as individual needs or environmental factors, and playing a corresponding role in adapting to growth. The catalytic domain of the GH18 subgroup members has an (α/β) eight-barrel folded structure, which has been demonstrated by the structural analysis of melamine [27]. The catalytic domain of the GH19 subgroup members has a high α-helix component [28,29]. Moreover, GH18 and GH19 subgroup chitinases use two different hydrolysis mechanisms in plants. The chitinase of the GH18 subgroup uses a retention mechanism, whereas the chitinase of the GH19 subgroup catalyzes the overall transformation of the hetero-oligosaccharide configuration [30]. Therefore, GH18 and GH19 chitinases may have different evolutionary origins and functions [31]. According to the result in this research, the CTLs of the GH18 subgroup in Solanaceae plants increased much faster than those in A. thaliana after splitting (Table S4). Thus, the increase of GH18 subgroup members was the important reason for the expansion of the CTL gene family in Solanaceae plants. For P. axillaris, the PaCTLs of the GH18 subgroup increased rapidly after splitting with A. thaliana (Figure 4), while the PaCTLs of the GH19 decreased slightly. Thus, the increase in GH18 subgroup members was the main reason for the expansion of the PaCTLs. Furthermore, when investigated the expression characterization, we found that 81.8% PaCTLs of the GH19 subgroup can express in the plant, while 66.7% PaCTLs of the GH18 subgroup did not express in any of the seven tissues. This means that the PaCTLs of GH18 and GH19 subgroup may have functional differentiation during evolution. We hypothesized that the faster expansion of genes in the GH18 subgroup may provide new raw materials for the new functionalization or sub-functionalization of CTLs. If this conjecture is true, then the evolutionary selection of GH18 subgroup members in the Solanaceae plants may lead the repeat genes to form new specific expression patterns or functions.
3.2. Functional Diversity of PaCTL Gene Family Members
Chitinases are widely found in various organisms, such as plants, bacteria, fungi, viruses, arthropods and humans [32,33]. Although plants do not contain chitin, several CTLs have been shown to play important roles in their growth and development processes [13,14,15]. In our study, 11 PaCTLs had higher expression levels in one or more tissues of normally grown plants. For example, the expression of Pa01261g00011.1, Pa00580g00512.1, Pa00286g10022.1, and Pa00403g00840.1 were localized in the leaves, and Pa00286g10022.1 obviously increased during the progress of flower organ development ect. These findings might suggest that the presence of PaCTLs facilitated the growth or function of different organs. According to the previous research results of other scholars, plant chitinase played important roles in resisting fungi and bacteria and could also play a certain role in abiotic stress [34,35]. We detected the expression of the PaCTLs in low temperature (4 °C), high temperature (42 °C), drought, and salt conditions (Figure 6). We found that some genes could participate in different stress treatments. This result is similar to the previous studies in populus and soybean [36,37]. The Pa00347g00041.1 gene was highly expressed in all four stress treatments conditions, while its relative expression under normal growth conditions was extremely low (Figure 5 and Figure 6; Table S6). This difference may indicate that this gene could be activated in respond to multiple abiotic stresses. Furthermore, others also could function when plants were subjected to abiotic stress, different genes selectively respond to one or several kinds of stresses. Such as Pa00167g00056.1, Pa00836g00039.1, Pa01254g00005.1, and Pa00904g00048.1 were highly expressed in two to three stress treatment conditions. In addition, the divergent expression characteristics between GH18 and GH19 subgroup members were very obvious. Expression divergence is generally believed as the first step in functional divergence. Thus, we speculated that they may conduct divergent function in the growth of the P. axillaris plant. As a signaling molecule, Me-JA and SA are widely involved in plant stress resistance in biological and abiotic stresses, such as pests, UV-B, drought, high temperature and other stresses [38]. Under the condition of adversity stress, the content of endogenous JA (jasmonic acid) and Me-JA increases, which activates the self-defense system, induces the expression of related defense genes, synthesizes defense substances, and enhances the stress resistance of plants. In here, we found that nearly half of PaCTLs (45.4%) could up-regulated (Figure 7) when the plants suffered Me-JA and SA treatment, which further indicated that PaCTLs played an important role in the process of plants being subjected to environmental stress. It is worth mentioning that among the 33 PaCTLs members, Pa00347g00043.1 was neither expressed under normal growth conditions nor under stress conditions (Figure 4 and Figure 5 and Table S6). Although this gene share similar chitinase conserved domains, it may not have biological functions, or may be pseudogene. Many chitinases have been reported to be localized on the plant cell wall, so it is speculated that the cell wall may be an important location for its action [39]. The subcellular localization results in this study (Figure 9) also validated this inference. However, our data is still limited. Further studies are urgently needed to determine whether the PaCTLs can play roles in responding to other abiotic and biotic stresses and how they function in petunia growth and development.
Cis-regulatory modules in promoters lead to specific shifts in the expression patterns and functions of genes. In our analysis, many hormone responses, as well as biotic and abiotic stress elements, were detected in the promoter of PaCTLs (Figure 8). For example, the expression levels of five genes (Pa00347g00041.1, Pa01254g00009.1, Pa00180g00126.1, and Pa01254g00005.1) were upregulated after low-temperature stress (4 °C). Among them, three genes had low-temperature response cis-elements in their promoter regions. Three promoters of PaCTLs (Pa00347g00041.1, Pa01254g00005.1, and Pa00904g00048.1) contained drought-induced cis-elements. Consistent with this, these three genes showed upregulated expression when the plants suffered drought stress. In addition, two genes also had increased expression under stress conditions, while their promoters did not contain corresponding cis-elements. The reason may be that the cis-element does not exist within the length of the detected 2-kb. Plant hormones and signal substances, such as Me-JA, SA, and abscisic acid, are involved in the operation of various stress signaling pathways [40,41,42,43]. A total of 26, 23, 25, 14, and 14 promoters of PaCTLs contained ABRE, CGTCA-motif, TCA-element, TATC-box, and AuxRR-core elements, respectively. Under the influence of exogenous Me-JA and SA hormones, PaCTLs showed three response types (Figure 7). Among the members of GH19 subfamily, 7 members could be affected by Me-JA hormones and 5 members were up-regulated when suffered SA hormones treatment. Among the members of GH18 subfamily, 4 members could be affected by Me-JA hormone and 5 members were up-regulated when suffered SA hormones treatment. These cases also have been found in the CTL genes of S. lycopersicum and C. annuum [1,10], possibly because of the functional consistency, enhancement, or weakening among homologous genes between species. According to the result, we speculated that the PaCTLs may also play important roles in various plant hormone signaling pathways. The specific response mode and triggering process need further research.
4. Materials and Methods
4.1. Plant Materials and Treatment
P. axillaris were provided by Dr. Hajirezaeiwere of the Leibniz Institute for Plant Genetics and Crop Research in Germany and cultivated in the experimental greenhouse of Fujian Agriculture & Forestry University. The growth conditions were 14 h light/10 h dark, 24 °C, and 70% humidity.
The tissue samples under abiotic stress environment were obtained as follows: P. axillaris seeds were sterilized with 70% alcohol for 30 s in a clean bench. Then, the seeds were rinsed with sterile water thrice, sterilized with 2% sodium hypochlorite for 5 min, and rinsed with sterile water again for three times. Afterward, we sowed the seeds in Murashige and Skoog liquid medium. The seeds grew in 23 ± 1 °C under 14 h light/10 h dark environment until two leaves grow. Subsequently, the P. axillaris seedlings were subjected to low-temperature and high-temperature stress experiments in 4 ± 1 °C and 42 ± 1 °C, respectively. The seedlings were also placed in 150 mM NaCl for 24 h for the salt stress test. Furthermore, the seedlings were placed on folds of tissue paper at 23 ± 1 °C in 14 h light/10 h dark environment for drought stress experiments. The control was placed in a normal growth environment without treatment.
The tissue samples with hormone treatment were obtained as follows: The 50 µM Me-JA solution and 50 µM SA solution were prepared with 1 L volume, and then put them into the watering pot for using respectively. Petunia seedlings growing for 4 weeks (undifferentiated reproductive organs) were divided into two groups with 15 plants in each. One group was sprayed using the 1 L Me-JA solution, the other group were sprayed using the 1 L SA solution. The leaf materials before spraying were collected and recorded as 0 h, and then the leaf materials after spraying Me-JA and SA solution were collected at 4 h, 8 h, 12 h, 16 h, 20 h and 24 h, respectively.
4.2. Database Search and Sequence Analysis
The CTL amino acid sequences of A. thaliana (GCA_000001735.2, TAIR10.1), S. lycopersicum (GCA_000188115.3, SL3.0) and O. sativa (GCA_001433935.1, IRGSP-1.0) were collected from the National Center for Biotechnology Information (NCBI) database (https://www.ncbi.nlm.nih.gov/, accessed on 1 July 2020) and published literature [2,44]. Then used the above three species respectively, the information of petunia amino acid sequence were searched and collected by using the Basic Local Alignment Search Tool in the Solanaceae Genomic Database (https://solgenomics.net/, accessed on 3 July 2020). Meanwhile, the amino acid sequence information were also searched and collected using the word “chitinase” in the Petunia genome database (Petunia axillaris genome sequence v1.6.2). Subsequently, these sequence results obtained above were integrated and de-redundancy. And the conserved domains of the non-redundant sequences were retrieved using the CD-search function in NCBI to ensure the correctness.
4.3. Phylogenetic Analysis
The phylogenetic tree of five species (P. axillaris, A. thaliana, Z. mays, P. abies, and H. sapiens) was constructed by using the neighbor-joining (NJ) phylogenetic tree function of the MEGAX software (1000 bootstrap replicates) [45]. Then, we used EvolView online to beautify the phylogenetic tree (https://www.evolgenius.info, accessed on 8 July 2020) [46]. The phylogenetic relationships of CTLs in five Solanaceae species (P. axillaris, N. tabacum, S. lycopersicum, S. tuberosum, and C. annuum) and A. thaliana were constructed using the MUSCLE software online (http://www.drive5.com/muscle/, accessed on 8 July 2020) [47]. Phylogenetic groups were assigned according to the ortholog structure and functional domain published in previous research [2,12,26,27,28,29,30,31,32,48].
The phylogenetic relationship between P. axillaris and A. thaliana alone was also analyzed by using a NJ function in the MEGAX software (1000 bootstrap replicates). Using the method of Kim et al. [49] and lyu et al. [50], the extent of lineage-specific expansion of the CTL genes between the two species was investigated. The branches were defined by identifying nodes representing speciation events (dots). For those branches, a bootstrap value higher than 50% indicated the criteria for the least number of common ancestral CTLs between P. axillaris and A. thaliana. The branches containing only sequences for one of the two plants indicated that gene loss had occurred during evolution.
The homeology analysis map of CTLs among P. axillaris, A. thaliana, and S. lycopersicum genome was analyzed by TBtools software [51]. The genome sequence and annotation files of A. thaliana, P. axillaris and S. lycopersicum were downloaded from the NCBI database and the Solanaceae Genomics Network respectively. We selected the PaCTLs paralog pairs and homolog CTL genes between S. lycopersicum and P. axillaris with a similarity of over 80% to calculate the nonsynonymous rate (Ka), synonymous rate (Ks), and the Ka/Ks ratio using the TBtools software.
4.4. Gene Structure, Conserved Motifs, and Cis-Acting Element Analyses
Signal peptide sequence prediction of the PaCTLs was performed using the SignalP-5.0 Server (http://www.cbs.dtu.dk/services/SignalP/, accessed on 9 July 2020) [52]. The exon-intron structure was obtained by aligning the coding sequence and corresponding genomic sequence using the TBtools software. The conserved motifs were recognized using the MEME tool version 5.1.1 (http://meme-suite.org/tools/meme, accessed on 12 July 2020) [53] with the maximum number of motifs set at 16. Pfam search were used online in the NCBI database.
We obtained the petunia genome model sequence in the Solanaceae genome network to analyze the cis-acting elements of PaCTLs. The 2-kb sequences upstream of the “ATG” were extracted and obtained using the TBtools software. Then, the obtained sequences were submitted to the PlantCare website (http://bioinformatics.psb.ugent.be/webtools/plantcare/html/, accessed on 15 July 2020) for the prediction of cis-acting elements [54]. The informations of the predicted cis-acting elements were visualized using the TBtools software.
4.5. Expression Analysis by qRT-PCR
Roots, stems, leaves, 2–3 cm flower buds, 4–5 cm flower buds, open flowers, and tender capsules collected from robust P. axillaris plants, and the seedlings treated with abiotic stress and the leaf material treated with hormones were collected for RNA extraction. The total RNA of the tender capsules were extracted using the RNAprep Pure Plant Kit (Polysaccharide and Polyphenol-rich, Tiangen Biotech, Beijing). Total RNA of other tissues were extracted by using the Trizol kit (TransGen Biotech, Beijing). The extraction procedure was performed according to the kit’s instructions. Then, the extracted total RNAs were detected using a 1.5% agarose gel to ensure their quality. First-strand cDNA was synthesized by using the PrimeScript RT Reagent Kit (TransGen Biotech, Beijing) in accordance with the manufacturer’s instruction.
qRT-PCR was used to examine the transcript levels of PaCTLs. Specific primers were designed using the primer design tool on the NCBI website (https://www.ncbi.nlm.nih.gov, accessed on 25 July 2020) based on multiple sequence alignment (Table S7). The constitutively expressed gene PaUBQ (F: 5′-GTGAATTATAGAATCGAGCATC-3′, R: 5′-AAATCAGAAACAATCCCAAC-3′) was selected as an internal control. qRT-PCR was performed using the CFX96 Real Time System (Bio-Rad, USA) machine. The PCR conditions were as follows: 30 s at 94 °C and followed by 42 cycles each of 5 s at 94 °C, 15 s at 60 °C, and 10 s at 72 °C. Each sample was run in triplicates with 15 μL of the reaction volume by using the TransStart Top Green qPCR SuperMix Kit (Transgen Biotech, Beijing, China). The 2−ΔΔCt method was used to calculate the relative expression levels. The histograms were generated using GraphPad Prism 8 software.
4.6. Subcellular Localization
We selected four PaCTLs which had a higher expression level in flower organ development and stress environment, to investigate their subcellular localizations by generating C-terminal yellow fluorescent protein (YFP) fusions. Based on their CDS provided by the petunia database, we designed four specific primers (Table S8) for nucleotide fragment amplification. The PCR amplification reaction was carried out by using the high-fidelity enzyme 2×TransStart® FastPfu PCR SuperMiX, in accordance with the manufacturer’s instruction. The resulting fragment was cloned into the fusion expression vector pB7YWG2–YFP under the control of the constitutive CaMV35S promoter, to create the fusion vector. Colonies containing the appropriate insert were identified by sequencing. The fusion vector was then transiently transformed into onion epidermal cells by particle bombardment. The fluorescence signal was analyzed after 16 h of incubation with the confocal laser microscope. The onion epidermal cells were plasmolyzed by infiltrating 0.3 g·mL−1 sucrose.
5. Conclusions
We identified 33 PaCTL gene family members from the genome of P. axillaris. The increase of GH18 subgroup members might be the primary driving force for their expansion. The PaCTLs were differentially expressed in vegetative and reproductive organs of petunia. Meanwhile, they showed varying degrees of response to abiotic stress (low temperature, high temperature, drought, and salinity stress) and hormone treatment (exogenous SA and Me-JA treatment), which meant that PaCTLs may have potential stress resistance functions. Furthermore, the subcellular localization result indicated that PaCTLs could localize on the cell wall to function. The present results provided a foundation for the exploration of PaCTLs’ function and for the functional identification of stress-resistance genes in petunia.
Supplementary Materials
The following supporting information can be downloaded at: https://www.mdpi.com/article/10.3390/plants11091269/s1, Figure S1. Multiple sequence alignment of the GH18 sub-group PaCTLs. Figure S2. Multiple sequence alignment of the GH19 sub-group PaCTLs. Figure S3. A Neighbor-joining phylogenetic tree of CTL orthologs from five Solanaceae species (P. axillaris, N. tabacum, S. lycopersicum, S. tuberosum, C. annuum) and A. thaliana. Table S1. The Chitinase-like gene family members identified in P. axillaris. Table S2. Prediction of subcellular localization of the PaCTL proteins. Table S3. Calculation of substitution rates of homologues CTLs between S. lycopersicum and P. axillaris. Table S4. Number of CTLs in the five Solanaceae species and A. thaliana genomes. Table S5. The Ka/Ks analysis of PaCTLs gene pairs. Table S6. Statistical information of the gene expression of PaCTLs under normal and stress environment conditions. Table S7. The qRT-PCR primer for PaCTLs. Table S8. The amplification primer for PaCTLs.
Author Contributions
Z.L. and W.Y. conceptualized and designed the experiment; Z.L., W.Y., X.Z., W.W. and M.M. collected the samples and extracted total RNAs for qRT-PCR; J.H., L.H. and C.W. involved in data analysis; Y.Y. involved in the data discussion; Z.L., W.Y. and M.L. conceived and wrote the manuscript; M.L. and B.W. participated in the revision of the manuscript. All authors have read and agreed to the published version of the manuscript.
Funding
This research was funded by the Fujian Natural Science Foundation (No. 2017J01431) and School-level innovation training project of Fujian Agriculture and Forestry University (No. 202010389154). The APC was funded by the College of Horticulture at Fujian Agriculture & Forestry University.
Institutional Review Board Statement
Not applicable.
Informed Consent Statement
Informed consent was obtained from all subjects involved in the study.
Data Availability Statement
All data in the present study are available in the public database as referred in the Section 4.
Acknowledgments
The authors would like to thank anonymous reviewers for comments on this manuscript.
Conflicts of Interest
The authors declare no conflict of interest.
References
- Ali, M.; Luo, D.X.; Khan, A.; Haq, S.U.; Gai, W.X.; Zhang, H.X.; Cheng, G.X.; Muhammad, I.; Gong, Z.H. Classification and genome-wide analysis of chitin-binding proteins gene family in pepper (Capsicum annuum L.) and transcriptional regulation to phytophthora capsici, abiotic stresses and hormonal applications. Int. J. Mol. Sci. 2018, 19, 2216. [Google Scholar] [CrossRef] [PubMed]
- Karlsson, M.; Stenlid, J. Comparative evolutionary histories of the fungal chitinase gene family reveal non-random size expansions and contractions due to adaptive natural selection. Evol. Bioinform. Online 2008, 4, 47–60. [Google Scholar] [CrossRef] [PubMed]
- Xin, Y.; Wang, D.; Han, S.; Li, S.; Gong, N.; Fan, Y.; Ji, X. Characterization of the Chitinase Gene Family in Mulberry (Morus notabilis) and MnChi18 Involved in Resistance to Botrytis cinerea. Genes 2022, 13, 98. [Google Scholar] [CrossRef] [PubMed]
- Zhang, Y.; Ren, L.; Lin, X.; Han, X.; Wang, W.; Yang, Z. Molecular evolution and functional characterization of chitinase gene family in Populus trichocarpa. Gene 2022, 822, 146329. [Google Scholar] [CrossRef] [PubMed]
- Kovacs, G.; Sagi, L.; Jacon, G.; Arinaitwe, G.; Busogoro, J.P.; Thiry, E.; Strosse, H.; Swennen, R.; Remy, S. Expression of a rice chitinase gene in transgenic banana (‘Gros Michel’, AAA genome group) confers resistance to black leaf streak disease. Transgenic Res. 2013, 22, 117–130. [Google Scholar] [CrossRef]
- Jabeen, N.; Chaudhary, Z.; Gulfraz, M.; Rashid, H.; Mirza, B. Expression of rice chitinase gene in genetically engineered tomato confers enhanced resistance to fusarium wilt and early blight. J. Plant Pathol. 2015, 31, 252–258. [Google Scholar] [CrossRef]
- Singh, H.R.; Deka, M.; Das, S. Enhanced resistance to blister blight in transgenic tea (Camellia sinensis [L.] O. Kuntze) by overexpression of class I chitinase gene from potato (Solanum tuberosum). Funct. Integr. Genom. 2015, 15, 461–480. [Google Scholar] [CrossRef]
- Collinge, D.B.; Kragh, K.M.; Mikkelsen, J.D.; Nielsen, K.K.; Rasmussen, U.; Vad, K. Plant chitinases. Plant J. 1993, 3, 31–40. [Google Scholar] [CrossRef]
- Kesari, P.; Patil, D.N.; Kumar, P.; Tomar, S.; Sharma, A.K.; Kumar, P. Structural and functional evolution of chitinase-like proteins from plants. Proteomics 2015, 15, 1693–1705. [Google Scholar] [CrossRef]
- Cao, J.; Tan, X. Comprehensive analysis of the chitinase family genes in tomato (Solanum lycopersicum). Plants 2019, 8, 52. [Google Scholar] [CrossRef]
- Robinson, S.P.; Jacobs, A.K.; Dry, I.B. A class IV chitinase is highly expressed in grape berries during ripening. Plant Physiol. 1997, 114, 771–778. [Google Scholar] [CrossRef] [PubMed]
- Kragh, K.M.; Jacobsen, S.; Mikkelsen, J.D. Induction, purification and characterization of barley leaf chitinase. Plant Sci. 1990, 71, 55–68. [Google Scholar] [CrossRef]
- Jiao, S.; Hazebroek, J.P.; Chamberlin, M.A.; Perkins, M.; Sandhu, A.S.; Gupta, R.; Simcox, K.D.; Yinghong, L.; Prall, A.; Heetland, L.; et al. Chitinase-like1 plays a role in stalk tensile strength in maize. Plant Physiol. 2019, 181, 1127–1147. [Google Scholar] [CrossRef] [PubMed]
- Gu, S.Y.; Wang, L.C.; Cheuh, C.M.; Lo, W.S. Chitinase like1 regulates root development of dark-grown seedlings by modulating ethylene biosynthesis in Arabidopsis thaliana. Front. Plant Sci. 2019, 10, 600. [Google Scholar] [CrossRef] [PubMed]
- Wang, H.; Zhou, Q.; Mao, P. Ultrastructural and photosynthetic responses of pod walls in alfalfa to drought stress. Int. J. Mol. Sci. 2020, 21, 4457. [Google Scholar] [CrossRef] [PubMed]
- Beintema, J.J. Structural features of plant chitinases and chitin-binding proteins. FEBS Lett. 1994, 350, 159–163. [Google Scholar] [CrossRef]
- Melchers, L.S.; de Groot, M.A.; van der Knaap, J.A.; Ponstein, A.S.; Sela-Buurlage, M.B.; Bol, J.F.; Cornelissen, B.J.; van den Elzen, P.J.; Linthorst, H.J. A new class of tobacco chitinases homologous to bacterial exo-chitinases displays antifungal activity. Plant J. 1994, 5, 469–480. [Google Scholar] [CrossRef]
- Hamel, F.; Boivin, R.; Tremblay, C.; Bellemare, G. Structural and evolutionary relationships among chitinases of flowering plants. J. Mol. Evol. 1997, 44, 614–624. [Google Scholar] [CrossRef]
- Passarinho, P.A.; de Vries, S.C.D. Arabidopsis chitinases: A genomic survey. Arab. Book/Am. Soc. Plant Biol. 2002, 1, e0023. [Google Scholar] [CrossRef]
- Yamagami, T.; Funatsu, G. Identification of the aspartic acid residue located at or near substrate-binding site of rye seed chitinase-c. Biosci. Biotech. Bioch. 1998, 62, 383–385. [Google Scholar] [CrossRef]
- Armenta, S.; Moreno-Mendieta, S.; Sánchez-Cuapio, Z.; Sánchez, S.; Rodriguez-Sanoja, R. Advances in molecular engineering of carbohydrate-binding modules. Proteins 2017, 85, 1602–1617. [Google Scholar] [CrossRef] [PubMed]
- Thomma, B.P.; Penninckx, I.A.; Broekaert, W.F.; Cammue, B.P. The complexity of disease signaling in Arabidopsis. Curr. Opin. Immunol. 2001, 13, 63–68. [Google Scholar] [CrossRef]
- Linthorst, H.J.; van Loon, L.C.; van Rossum, C.M.; Mayer, A.; Bol, J.F.; van Roekel, J.S.; Meulenhoff, E.J.; Cornelissen, B.J. Analysis of acidic and basic chitinases from tobacco and petunia and their constitutive expression in transgenic tobacco. Mol. Plant Microbe In. 1990, 3, 252–258. [Google Scholar] [CrossRef]
- Khan, R.S.K.N.; Mii, M.; Nakamura, I. Transgenic Petunia hybrida expressing a synthetic fungal chitinase gene confers disease tolerance to Botrytis cinerea. Plant Biotechnol. J. 2012, 29, 285–291. [Google Scholar] [CrossRef]
- Qu, M.; Ren, Y.; Liu, Y.; Yang, Q. Studies on the chitin/chitosan binding properties of six cuticular proteins analogous to peritrophin 3 from Bombyx mori. Insect Mol. Biol. 2017, 26, 432–439. [Google Scholar] [CrossRef] [PubMed]
- Rawat, S.; Ali, S.; Mittra, B.; Grover, A. Expression analysis of chitinase upon challenge inoculation to Alternaria wounding and defense inducers in Brassica juncea. Biotechnol. Rep. 2017, 13, 72–79. [Google Scholar] [CrossRef]
- Van Scheltinga, A.C.T.; Hennig, M.; Dijkstra, B.W. The 1.8 a resolution structure of hevamine, a plant chitinase/lysozyme, and analysis of the conserved sequence and structure motifs of glycosyl hydrolase family 18. J. Mol. Biol. 1996, 262, 243–257. [Google Scholar] [CrossRef]
- Hart, P.J.; Pfluger, H.; Monzingo, A.F.; Hollis, T.; Robertus, J.D. The refined crystal structure of an endochitinase from Hordeum vulgare L. seeds at 1.8 A resolution. J. Mol. Biol. 1995, 248, 402–413. [Google Scholar] [CrossRef]
- Hahn, M.; Hennig, M.; Schlesier, B.; Höhne, W. Structure of jack bean chitinase. Acta Crystallographica. Sect. D Biol. Crystallogr. 2000, 56 Pt 9, 1096–1099. [Google Scholar] [CrossRef]
- Iseli, B.; Armand, S.; Boller, T.; Neuhaus, J.M.; Henrissat, B. Plant chitinases use two different hydrolytic mechanisms. FEBS Lett. 1996, 382, 186–188. [Google Scholar] [CrossRef]
- Huet, J.; Wyckmans, J.; Wintjens, R.; Boussard, P.; Raussens, V.; Vandenbussche, G.; Ruysschaert, J.M.; Azarkan, M.; Looze, Y. Structural characterization of two papaya chitinases, a family GH19 of glycosyl hydrolases. Cell. Mol. Life Sci. 2006, 63, 3042–3054. [Google Scholar] [CrossRef] [PubMed]
- Ding, X.; Gopalakrishnan, B.; Johnson, L.B.; White, F.F.; Wang, X.; Morgan, T.D.; Kramer, K.J.; Muthukrishnan, S. Insect resistance of transgenic tobacco expressing an insect chitinase gene. Transgenic Res. 1998, 7, 77–84. [Google Scholar] [CrossRef] [PubMed]
- Li, H.; Greene, L.H. Sequence and structural analysis of the chitinase insertion domain reveals two conserved motifs involved in chitin-binding. PLoS ONE 2010, 5, e8654. [Google Scholar] [CrossRef] [PubMed]
- Zheng, Y.; Yang, Q.; Zhang, C.; Luo, J.; Shen, Y.; Wang, M. Characterization of antifungal chitinase from Bacillus iicheniformis TCCC10016. Lect. Notes Electr. Eng. 2014, 249, 597–607. [Google Scholar] [CrossRef]
- Sytwala, S.; Günther, F.; Melzig, M.F. Lysozyme- and chitinase activity in latex bearing plants of genus Euphorbia-A contribution to plant defense mechanism. Plant Physiol. Biochem. 2015, 95, 35–40. [Google Scholar] [CrossRef] [PubMed]
- Jiang, C.; Jia, L.; Huang, R.; Huang, M.; Xu, L. Molecular cloning and expression analysis of a Class V chitinase gene from populus. Mol. Plant Breed. 2013, 11, 225–231. [Google Scholar] [CrossRef]
- Gálusová, T.; Rybanský, L.; Mészáros, P.; Spieß, N.; Piršelová, B.; Kuna, R.; Libantová, J.; Moravčíková, J.; Hauptvogel, P.; Matušíková, I. Variable responses of soybean chitinases to arsenic and cadmium stress at the whole plant level. Plant Growth Regul. 2015, 76, 147–155. [Google Scholar] [CrossRef]
- Fedina, I.; Nedeva, D.; Georgieva, K.; Velitchkova, M. Methyl jasmonate counter act UV-B stress in barley seedlings. J. Agron. Crop Sci. 2009, 195, 204–212. [Google Scholar] [CrossRef]
- Bai, Z.; Pu, L.; Tang, B.; Wang, Q.; Cui, X.; Liu, D. Functional analysis of a chitinase gene PnCHI1 from Panax notoginseng. Chin. J. Chin. Mater. Med. 2018, 43, 1832–1837. [Google Scholar] [CrossRef]
- Fujita, M.; Fujita, Y.; Noutoshi, Y.; Takahashi, F.; Narusaka, Y.; Yamaguchi-Shinozaki, K.; Shinozaki, K. Crosstalk between abiotic and biotic stress responses: A current view from the points of convergence in the stress signaling networks. Curr. Opin. Plant Biol. 2006, 9, 436–442. [Google Scholar] [CrossRef]
- Ma, X.; Ma, F.; Mi, Y.; Ma, Y.; Shu, H. Morphological and physiological responses of two contrasting Malus species to exogenous abscisic acid application. Plant Growth Regul. 2008, 56, 77–87. [Google Scholar] [CrossRef]
- Liu, Y.; Jiang, H.; Zhao, Z.; An, L. Abscisic acid is involved in brassinosteroids-induced chilling tolerance in the suspension cultured cells from Chorispora bungeana. J. Plant Physiol. 2011, 168, 853–862. [Google Scholar] [CrossRef] [PubMed]
- Guo, M.; Zhai, Y.F.; Lu, J.P.; Chai, L.; Chai, W.G.; Gong, Z.H.; Lu, M.H. Characterization of CaHsp70-1, a pepper heat-shock protein gene in response to heat stress and some regulation exogenous substances in Capsicum annuum L. Int. J. Mol. Sci. 2014, 15, 19741–19759. [Google Scholar] [CrossRef] [PubMed]
- Grover, A. Plant chitinases: Genetic diversity and physiological roles. Plant Sci. 2012, 31, 57–73. [Google Scholar] [CrossRef]
- Tamura, K.; Stecher, G.; Peterson, D.; Filipski, A.; Kumar, S. MEGA6: Molecular evolutionary genetics analysis version 6.0. Mol. Bio. Evol. 2013, 30, 2725–2729. [Google Scholar] [CrossRef]
- Zhang, H.; Gao, S.; Lercher, M.; Hu, S.; Chen, W. Evolview, an online tool for visualizing, annotating and managing phylogenetic trees. Nucleic Acids Res. 2012, 1, 569–572. [Google Scholar] [CrossRef]
- Edgar, R. Muscle: Multiple sequence alignment with high accuracy and high throughput. Nucleic Acids Res. 2004, 5, 1792–1797. [Google Scholar] [CrossRef]
- Shinshi, H.; Neuhas, J.M.; Ryals, J., Jr.; Meins, F. Structure of a tobacco endochitinase gene: Evidence that different chitinase genes can arise by transposition of sequences encoding a cysteine-rich domain. Plant Mol. Biol. 1990, 14, 357–368. [Google Scholar] [CrossRef]
- Kim, J.; Shiu, S.H.; Thoma, S.; Li, W.; Patterson, S. Patterns of expansion and expression divergence in the plant polygalacturonase gene family. Genome Biol. 2006, 7, R87. [Google Scholar] [CrossRef]
- Lyu, M.; Iftikhar, J.; Guo, R.; Wu, B.; Cao, J. Patterns of expansion and expression divergence of the polygalacturonase gene family in Brassica oleracea. Int. J. Mol. Sci. 2020, 21, 5706. [Google Scholar] [CrossRef]
- Chen, C.; Chen, H.; Zhang, Y.; Thomas, H.; Frank, M.; He, Y.; Xia, R. TBtools: An integrative toolkit developed for interactive analyses of big biological data. Mol. Plant 2020, 13, 1194–1202. [Google Scholar] [CrossRef] [PubMed]
- Nielsen, H.; Tsirigos, K.; Brunak, S.; Heijne, G. A brief history of protein sorting prediction. Protein J. 2019, 38, 200–216. [Google Scholar] [CrossRef] [PubMed]
- Bailey, T.; Williams, N.; Misleh, C.; Li, W. MEME: Discovering and analyzing DNA and protein sequence motifs. Nucleic Acids Res. 2006, 34, 369–373. [Google Scholar] [CrossRef] [PubMed]
- Lescot, M.; Dehais, P.; Thijs, G.; Marchal, K.; Moreau, Y.; Van de Peer, Y.; Rouze, P.; Rombauts, S. PlantCARE, a database of plant cis-acting regulatory elements and a portal to tools for in silico analysis of promoter sequences. Nucleic Acids Res. 2002, 30, 325–327. [Google Scholar] [CrossRef]


Publisher’s Note: MDPI stays neutral with regard to jurisdictional claims in published maps and institutional affiliations. |
© 2022 by the authors. Licensee MDPI, Basel, Switzerland. This article is an open access article distributed under the terms and conditions of the Creative Commons Attribution (CC BY) license (https://creativecommons.org/licenses/by/4.0/).