Article

The Molecular Mechanism of GhbHLH121 in Response to Iron Deficiency in Cotton Seedlings

1
State Key Laboratory of Crop Genetics and Germplasm Enhancement, Hybrid Cotton R & D Engineering Research Center (the Ministry of Education), College of Agriculture, Nanjing Agricultural University, Nanjing 210095, China
2
Zhejiang Provincial Key Laboratory of Crop Genetic Resources, Institute of Crop Science, Plant Precision Breeding Academy, College of Agriculture and Biotechnology, Zhejiang University, Hangzhou 300058, China
3
Hainan Institute, Zhejiang University, Yongyou Industry Park, Yazhou Bay Sci-Tech City, Sanya 572000, China
4
Hainan Yazhou Bay Seed Lab, Yazhou Bay Science and Technology City, Yazhou District, Sanya 572025, China
*
Authors to whom correspondence should be addressed.
Plants 2023, 12(10), 1955; https://doi.org/10.3390/plants12101955
Submission received: 6 April 2023 / Revised: 4 May 2023 / Accepted: 8 May 2023 / Published: 11 May 2023
(This article belongs to the Special Issue Molecular Breeding and Genetic Improvement of Cotton)

Abstract

:
Iron deficiency caused by high pH of saline–alkali soil is a major source of abiotic stress affecting plant growth. However, the molecular mechanism underlying the iron deficiency response in cotton (Gossypium hirsutum) is poorly understood. In this study, we investigated the impacts of iron deficiency at the cotton seedling stage and elucidated the corresponding molecular regulation network, which centered on a hub gene GhbHLH121. Iron deficiency induced the expression of genes with roles in the response to iron deficiency, especially GhbHLH121. The suppression of GhbHLH121 with virus-induced gene silence technology reduced seedlings’ tolerance to iron deficiency, with low photosynthetic efficiency and severe damage to the structure of the chloroplast. Contrarily, ectopic expression of GhbHLH121 in Arabidopsis enhanced tolerance to iron deficiency. Further analysis of protein/protein interactions revealed that GhbHLH121 can interact with GhbHLH IVc and GhPYE. In addition, GhbHLH121 can directly activate the expression of GhbHLH38, GhFIT, and GhPYE independent of GhbHLH IVc. All told, GhbHLH121 is a positive regulator of the response to iron deficiency in cotton, directly regulating iron uptake as the upstream gene of GhFIT. Our results provide insight into the complex network of the iron deficiency response in cotton.

1. Introduction

With the worldwide decrease in available arable land, the efficient use of soil has become an important research direction. About 30% of the world’s arable land is saline–alkali soil with pH above 8.2 [1,2,3]. Saline soil refers to sodium salt soil mainly containing NaCl, while alkaline soil mainly refers to that containing Na2CO3 and NaHCO3 [4,5]. Alkaline soil means soil with a high pH value. When soil pH is above 7.4, the solubility of iron hydroxide is decreased to 10−18 M, at which level it cannot be effectively absorbed and utilized by plants [6]. Iron is an essential microelement for plant growth and development, playing important roles in the electron transport chain (ETC) and in enzymatic reactions that contribute to many physiological metabolic processes such as photosynthesis, respiration, nitrogen fixation, and protein as well as nucleic acid synthesis [7,8,9]. Iron deficiency inhibits plant growth and development, evidenced in leaf chlorosis with decreased chlorophyll content, plant biomass, iron content, and increased iron reductase activity [10,11,12]. Cotton is a global cash crop with higher saline–alkali tolerance than other food crops [1,13]. However, when the alkaline level in the soil is too high, the cotton seedling will still be contaminated by the alkaline levels, characterized by low seedling germination rate, slow growing development, and high death rate [14,15]. In addition, iron-deficient cotton presents with chlorosis, thicker roots, and undeveloped root hairs [16,17]. Therefore, it is essential to improve the utilization rate of iron and enhance tolerance to iron deficiency at the cotton seedling stage. However, at present, the molecular regulation of iron deficiency in the cotton genome is barely understood.
About 60% of the iron in plant leaves is fixed in the thylakoid membrane and matrix of chloroplasts [9,18], where its ability to donate and accept electrons plays a significant role in electron transfer reactions. Iron is present in all electron transfer complexes, PSI, PSII, cytochrome b6f complexes, and ferredoxins, and is also indispensable for the biogenesis of cofactors such as hemes and iron sulfur clusters [19]. Iron deficiency can impede photosynthesis and introduce chaos into the chloroplast ultrastructure [20], as has been observed in maize [21] and rice [22], with decreased starch grains and an accumulation of lipid in plastid globules.
To improve iron absorption and utilization, plants have evolved two main strategies for iron uptake: the reduction strategy (strategy I) for dicotyledons and non-gramineous monocotyledons, and the chelation strategy (strategy II) for gramineous monocotyledons [8,9,23,24,25]. Arabidopsis, which utilizes strategy I, employs H+-ATPase 2 (AHA2) to release protons into the soil, thereby reducing soil pH and improving Fe solubility [26]. Then, the Fe chelate reductase FERRIC REDUCTION OXIDASE 2 (FRO2) on the root surface catalyzes the reduction in Fe3+ to Fe2+, which is a key step in iron absorption [27]. Iron-regulated Transporter 1 (IRT1) then transports the Fe2+ into root cells [28,29,30,31,32]. The chelation strategy of gramineous plants (strategy II) involves the secretion of phytosiderophores (PS) such as mugineic acid (MAS) into the rhizosphere to form Fe3+-Ps chelates, which are then transported into the plant by Yellow stripe1/Yellow Stripe1-like (YSL) family transporters [33,34].
Unsurprisingly, plants have developed a series of complex regulatory systems to maintain iron homeostasis at both the transcriptional and post-transcriptional levels. Three regulatory pathways have been described, with respective hub genes fer-like iron deficiency-induced transcription factor (FIT) [35,36], POPEYE (PYE) [37,38], and BRUTUS (BTS) [39,40,41]. In Arabidopsis, FIT can form a complex with bHLH Ib to directly regulate the iron uptake genes AHA2, FRO2, and IRT1, which directly participate in the iron uptake process as part of the reduction mechanism [42]. PYE ensures iron redistribution in plants by regulating YSL1, NAS4, and FRD3 [37]. PYE, bHLH11 [43,44], and bHLH121 [45,46,47] all belong to the same subgroup, bHLH IVb. PYE and bHLH11 have been reported as negative regulators of iron homeostasis [43,44,48]. However, bHLH121 is a positive regulator with a controversial expression pattern under iron deficiency in various studies [45,46,47]. Iron deficiency also promotes the accumulation of phosphorylated bHLH121, which activates the transcription of downstream target genes including bHLH Ib TFs and FIT, but only when bHLH121 binds to bHLH IVc transcription factors (TFs) [46,47]. These results indicate that bHLH121 functions as an upstream regulator of iron homeostasis [23,49,50,51].
Cotton is an important source of renewable fiber for the textile industry, and the cotton seedling stage suffers from iron deficiency on saline–alkali land. Most studies of saline–alkali land in cotton have focused on salt stress. In recent years, more studies have begun to focus on the alkali stress in saline–alkali land; an in vitro culture assay demonstrated that iron deficiency prevented cotton fiber development and was associated with decreased ferric reduction activity as well as increased activation of GhFRO2, GhIRT1, GhFIT1, and GhILR3 [52], which suggested cotton may adapt strategy I in its response to iron deficiency. Nonetheless, the specific regulatory mechanism was still not clear. This study investigated the regulation of iron homeostasis in cotton. This study provides new genetic resources and a theoretical basis for developing new cotton germplasms with improved tolerance to iron deficiency.

2. Results

2.1. Iron Deficiency Induces Differential Expression of Genes Related to Iron Deficiency with Consequent Low Photosynthetic Efficiency in Cotton

Fe has a very low solubility in saline–alkali soil with high HCO3- concentrations, resulting in limited uptake by plant roots [4]. Iron deficiency caused cotton leaf chlorosis, thicker roots, and fewer root hairs (Figure 1A) [16,17]. In order to study the regulation mechanism governing the cotton seedling stage response to iron deficiency, we first irrigated the laboratory-grown cotton seedlings with 1/2 Hoagland nutrient solution either with (+Fe) or without Fe2+ (−Fe). Under −Fe conditions, for two weeks, cotton seedlings appeared stunted and had chlorotic leaves (Figure 1B). Leaf chlorophyll content (Figure 1C), leaf biomass (Figure 1D), Fe content (Figure 1E), and net photosynthesis rate (Figure 1G, Supplemental Figure S1) were significantly lower in the −Fe group than those in the control group, while ferric chelate reductase activity (FCR) was increased (Figure 1F). The photosynthetic electron transport machinery is composed of two light energy-driven photosystems (PSs), PSI and PSII, along with the cytochrome (Cyt) b6f and ATP synthase. In linear electron transport (LET), electrons extracted from water by PSII were transported to PSI through Cytb6f and eventually produced NADPH [53,54]. The iron deficiency treatment suppressed expression of genes encoding proteins involved with PSI, PSII, Cytb6f, and Ferredoxin (Fd) (Supplemental Figure S2). Iron deficiency also affected the accumulation of reactive oxygen species (ROS) in cotton leaves (Supplemental Figure S3). Staining with nitroblue tetrazolium (NBT) (Supplemental Figure S3A) and diaminobenzidine tetrahydrochloride (DAB) (Supplemental Figure S3B) alike was darker on leaves of −Fe plants than those from +Fe control plants. These results indicate that the content of O2- and H2O2 on cotton leaves is increased under −Fe conditions. Examination of superoxide dismutase (SOD), catalase (CAT), and peroxidase (POD) revealed the −Fe group exhibiting higher activities of SOD (Supplemental Figure S3C) and POD (Supplemental Figure S3D) in cotton leaves compared with the control group. CAT content did not differ significantly (Supplemental Figure S3E). All told, cotton grown under iron deficiency conditions showed low photosynthetic efficiency.
In order to study transcriptional regulation in iron-deficient cotton, a preliminary analysis was carried out of the expression of genes that may be involved in the response to iron deficiency. Firstly, the amino acid sequences of genes known to be involved in iron transport and iron signal regulation in Arabidopsis were extracted, and homologous genes in the cotton genome were identified by construction of a phylogenetic tree (Supplemental Figure S4). Cotton seedlings were then grown for two weeks with +Fe or −Fe treatment and the leaves harvested for reverse transcription qRT-PCR analysis. Expression of GhbHLH121, GhPYE (bHLH IVb), and GhbHLH104 (bHLH IVc) was found to be increased in the −Fe group, while GhbHLH115 (bHLH IVc) did not show a difference. Members of the bHLH Ib subfamily which functioned in a FIT-dependent transcriptional regulatory pathway were differentially impacted, GhbHLH38 was elevated significantly in the −Fe group, but another subfamily member, GhbHLH101, did not show a significant difference. GhFIT (bHLH IIIa) and GhBTS, which encoded a member of the protease degradation pathway, were both increased under −Fe conditions. The FIT-dependent iron-uptake genes GhIRT1, GhFRO2, and GhAHA2 also showed significantly higher expression in the −Fe group (Figure 1H). These results indicate that iron deficiency is a substantial stressor for cotton seedlings and has direct impacts on the transcription of iron uptake- and homeostasis-related genes.

2.2. GhbHLH121 Encodes a Transcription Factor Involved in Responding to Iron Deficiency in Root and Shoot Tissues

Iron deficiency induces the expression of GhbHLH121, which encodes a homolog of AtbHLH121 (86.62% amino acid similarity), an upstream regulatory TF for iron homeostasis in Arabidopsis (Supplemental Figure S5). The specific function of GhbHLH121 in the cotton has not been characterized. GhbHLH121 encodes a protein of the bHLH IVb subfamily that features a canonical bHLH domain (Supplemental Figures S4 and S5). The TM-1 reference genome for allotetraploid upland cotton features two copies of GhbHLH121 from the A and D subgenomes which have 97.44% similarity in their DNA sequences (Supplemental Figure S5). Transcriptome data show that GhbHLH121-AT and GhbHLH121-DT are highly expressed in roots and stems, followed by leaves, but expressed at lower levels in petals and sepals of floral organs. The expression patterns of GhbHLH121-AT and GhbHLH121-DT were not significantly different because they were more expressed in roots and leaves than in floral organs (Figure 2A). qRT-PCR further showed that GhbHLH121 expression predominantly occurred in roots and leaves at the seedling stage and continued to increase as leaves grew (Figure 2B), with minimal levels in floral organs. In addition, the expression of GhbHLH121 in roots and leaves after −Fe treatment was significantly higher than that in the control (Figure 2C,D). The subcellular localization signals of GhbHLH121-AT and GhbHLH121-DT were distributed in the nucleus and cytoplasm (Figure 2E). Taken together, these findings indicate that GhbHLH121 is an iron deficiency-induced gene expressed in both roots and leaves. The homeologs of GhbHLH121-AT and GhbHLH121-DT are not different in terms of coding sequence, transcriptional activity, or protein localization. Therefore, the gene name will not be distinguished in subsequent experiments and is written as GhbHLH121 hereafter.

2.3. Suppression of GhbHLH121 in Cotton Seedlings Reduced Tolerance to Iron Deficiency

In order to analyze the role of GhbHLH121 in regulating iron deficiency in cotton, we performed an Agrobacterium-mediated VIGS assay (virus-induced gene silence) to suppress GhbHLH121 expression in cotton seedlings. The VIGS-treated seedlings were incubated in hydroponic culture with 1/2 Hoagland nutrient solution either with (+Fe) or without Fe2+ (−Fe) for three weeks. Under −Fe conditions, TRV2:00 plants showed the obvious corresponding phenotype, that is, leaf chlorosis (Figure 3A, Supplemental Figure S6). The expression of GhbHLH121 was confirmed to be suppressed in TRV2:GhbHLH121 plants relative to TRV2:00 plants (Figure 3B) under both +Fe and −Fe conditions. Overall, under the −Fe conditions, TRV2:00 and TRV2:GhbHLH121 both showed decreased chlorophyll and Fe content, and this resulted in less leaf biomass (Figure 3C,F,G). Under the +Fe conditions, suppression of GhbHLH121 led to slightly but significantly less biomass and Fe content than the control (Figure 3C,G). In the −Fe conditions, suppression of GhbHLH121 greatly decreased chlorophyll and Fe content, leaf biomass, and FCR relative to TRV2:00 plants (Figure 3C–G). The concomitant suppression of GhbHLH121 further decreased the net photosynthetic rate (Figure 3E, Supplemental Figure S7) and also the expression of genes encoding proteins involved with PSI, PSII, Cytb6f, and Fd (Supplemental Figure S8). In contrast, SOD activity in TRV2:GhbHLH121 plants was significantly higher than that in TRV2:00 under the −Fe conditions, though there was no significant difference in POD and CAT activities (Supplemental Figure S9). Suppression of GhbHLH121 thus reinforced the damage from iron deficiency, indicating that GhbHLH121 should be a positive regulator of the response to iron deficiency.
A further transcriptional examination of genes involved in iron uptake and iron signaling was conducted by using the material of the TRV2:GhbHLH121 and TRV2:00 (Table 1). qRT-PCR further showed that suppression of GhbHLH121 did not affect the expression of GhbHLH101 and GhbHLH38 (bHLH Ib), nor that of GhIRT1 and GhFRO2 under the +Fe conditions. However, under −Fe conditions, GhbHLH38, GhIRT1, and GhFRO2 all were significantly lower in TRV2:GhbHLH121 than in TRV2:00 controls, while GhbHLH101 was not differentially expressed. In addition, GhFIT was significantly lower in TRV2:GhbHLH121 than in TRV2:00 under both +Fe and −Fe conditions. Meanwhile, expression of the iron transport gene GhYSL1 decreased under −Fe, but that of GhNAS4, GhZIF1, and GhFRD3 was increased. However, there was no significant difference in the expression of GhZIF1 and GhFRD3 between TRV2:GhbHLH121 and TRV2:00 plants. GhYSL1 and GhNAS4 were decreased in TRV2:GhbHLH121 under −Fe conditions. It has been reported that PYE regulates YSL1, NAS4, and FRD3 to facilitate iron redistribution in plants, while BTS regulates iron homeostasis by affecting the stability of bHLH IVc proteins [40,55]. This study found both GhPYE and GhBTS to be induced under −Fe conditions. Furthermore, in +Fe conditions, GhPYE showed similar expression in TRV2:GhbHLH121 and TRV2:00 plants, but GhBTS was decreased with TRV2:GhbHLH121. Meanwhile, in −Fe conditions, GhPYE and GhBTS exhibited significantly lower expression in TRV2:GhbHLH121 than in TRV2:00. These findings support that GhbHLH121 is actively involved in responding to iron deficiency in cotton through regulating iron uptake and iron signaling under iron deficiency.
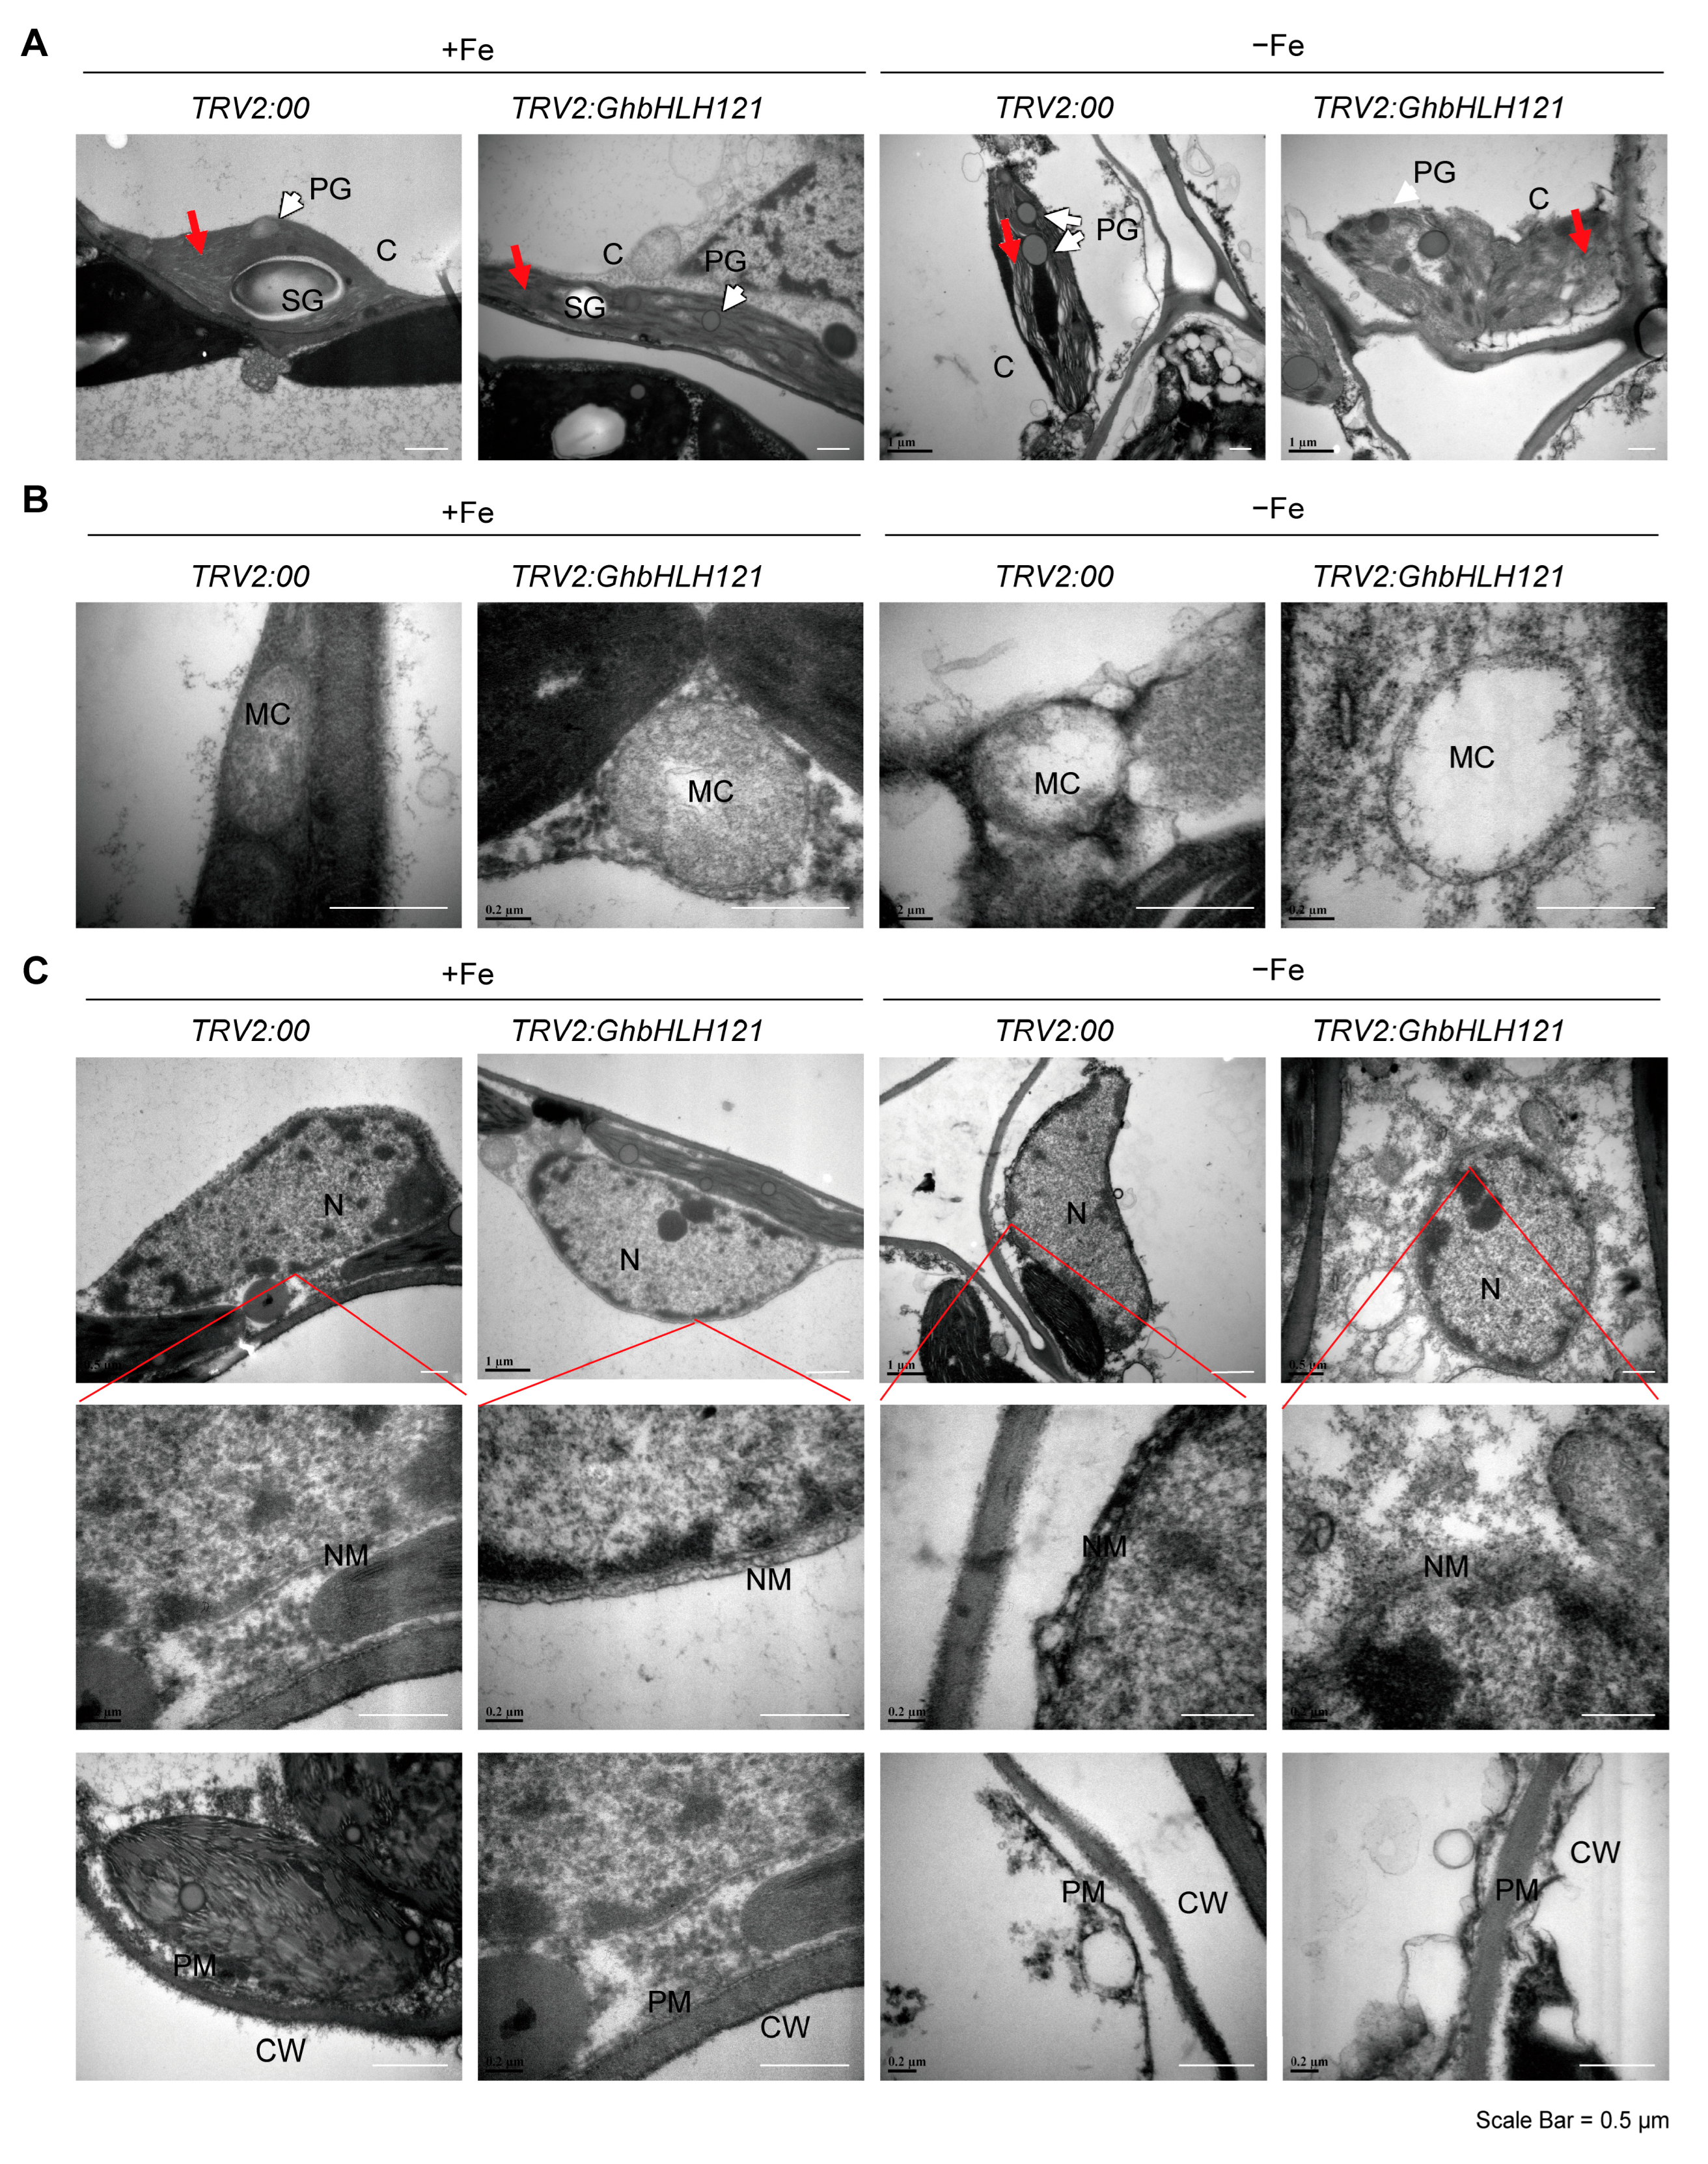
In order to study the effects of iron deficiency stress on the submicroscopic structure of cotton leaves, we observed the leaves of TRV2:GhbHLH121 and TRV2:00 plants treated with +Fe or −Fe by transmission electron microscopy (TEM). In +Fe conditions, both TRV2:GhbHLH121 and TRV2:00 exhibited normal chloroplast morphology with the thylakoids well piled up (Figure 4A). The chloroplasts contained oval starch granules and a few plastid globules (PGs). The mitochondrial was also in a round shape with the inner ridges arranged in an orderly manner (Figure 4B). The nuclear double membrane and the cytoplasmic membrane structure were clearly observed (Figure 4C). Under −Fe conditions, however, submicroscopic observation of TRV2:00 leaf cells revealed obvious damage to the morphology of organelles. The internal structure of chloroplasts was disordered with loose arrangements of thylakoids (Figure 4A). Chloroplast sizes were significantly different with the width decreased (Figure 4A; Supplemental Figure S10B), aspect ratio increased (Supplemental Figure S10C), and PG number increased (Supplemental Figure S9D). Mitochondrial structure was likewise damaged with the loss of inner ridges (Figure 4B) and increased aspect ratio (Supplemental Figure S10E). The nucleus overall remained a normal shape (Figure 4C), but the cell membrane was also damaged or broken (Figure 4C). Thus, iron deficiency leads to chloroplast thylakoid structural disorder in cotton leaves, and the suppression of GhbHLH121 increases the damages associated with iron deficiency, which confirms it as playing a positive role in iron homeostasis. With suppression of GhbHLH121, the chloroplast structure was damaged, the membrane lipid peroxidation was aggravated, and ROS accumulated; the photosynthetic electron transport system was destroyed, which resulted in the decrease in the photosynthetic rate.

2.4. Ectopic Expression of GhbHLH121 in Arabidopsis Confers Enhanced Tolerance to Iron Deficiency

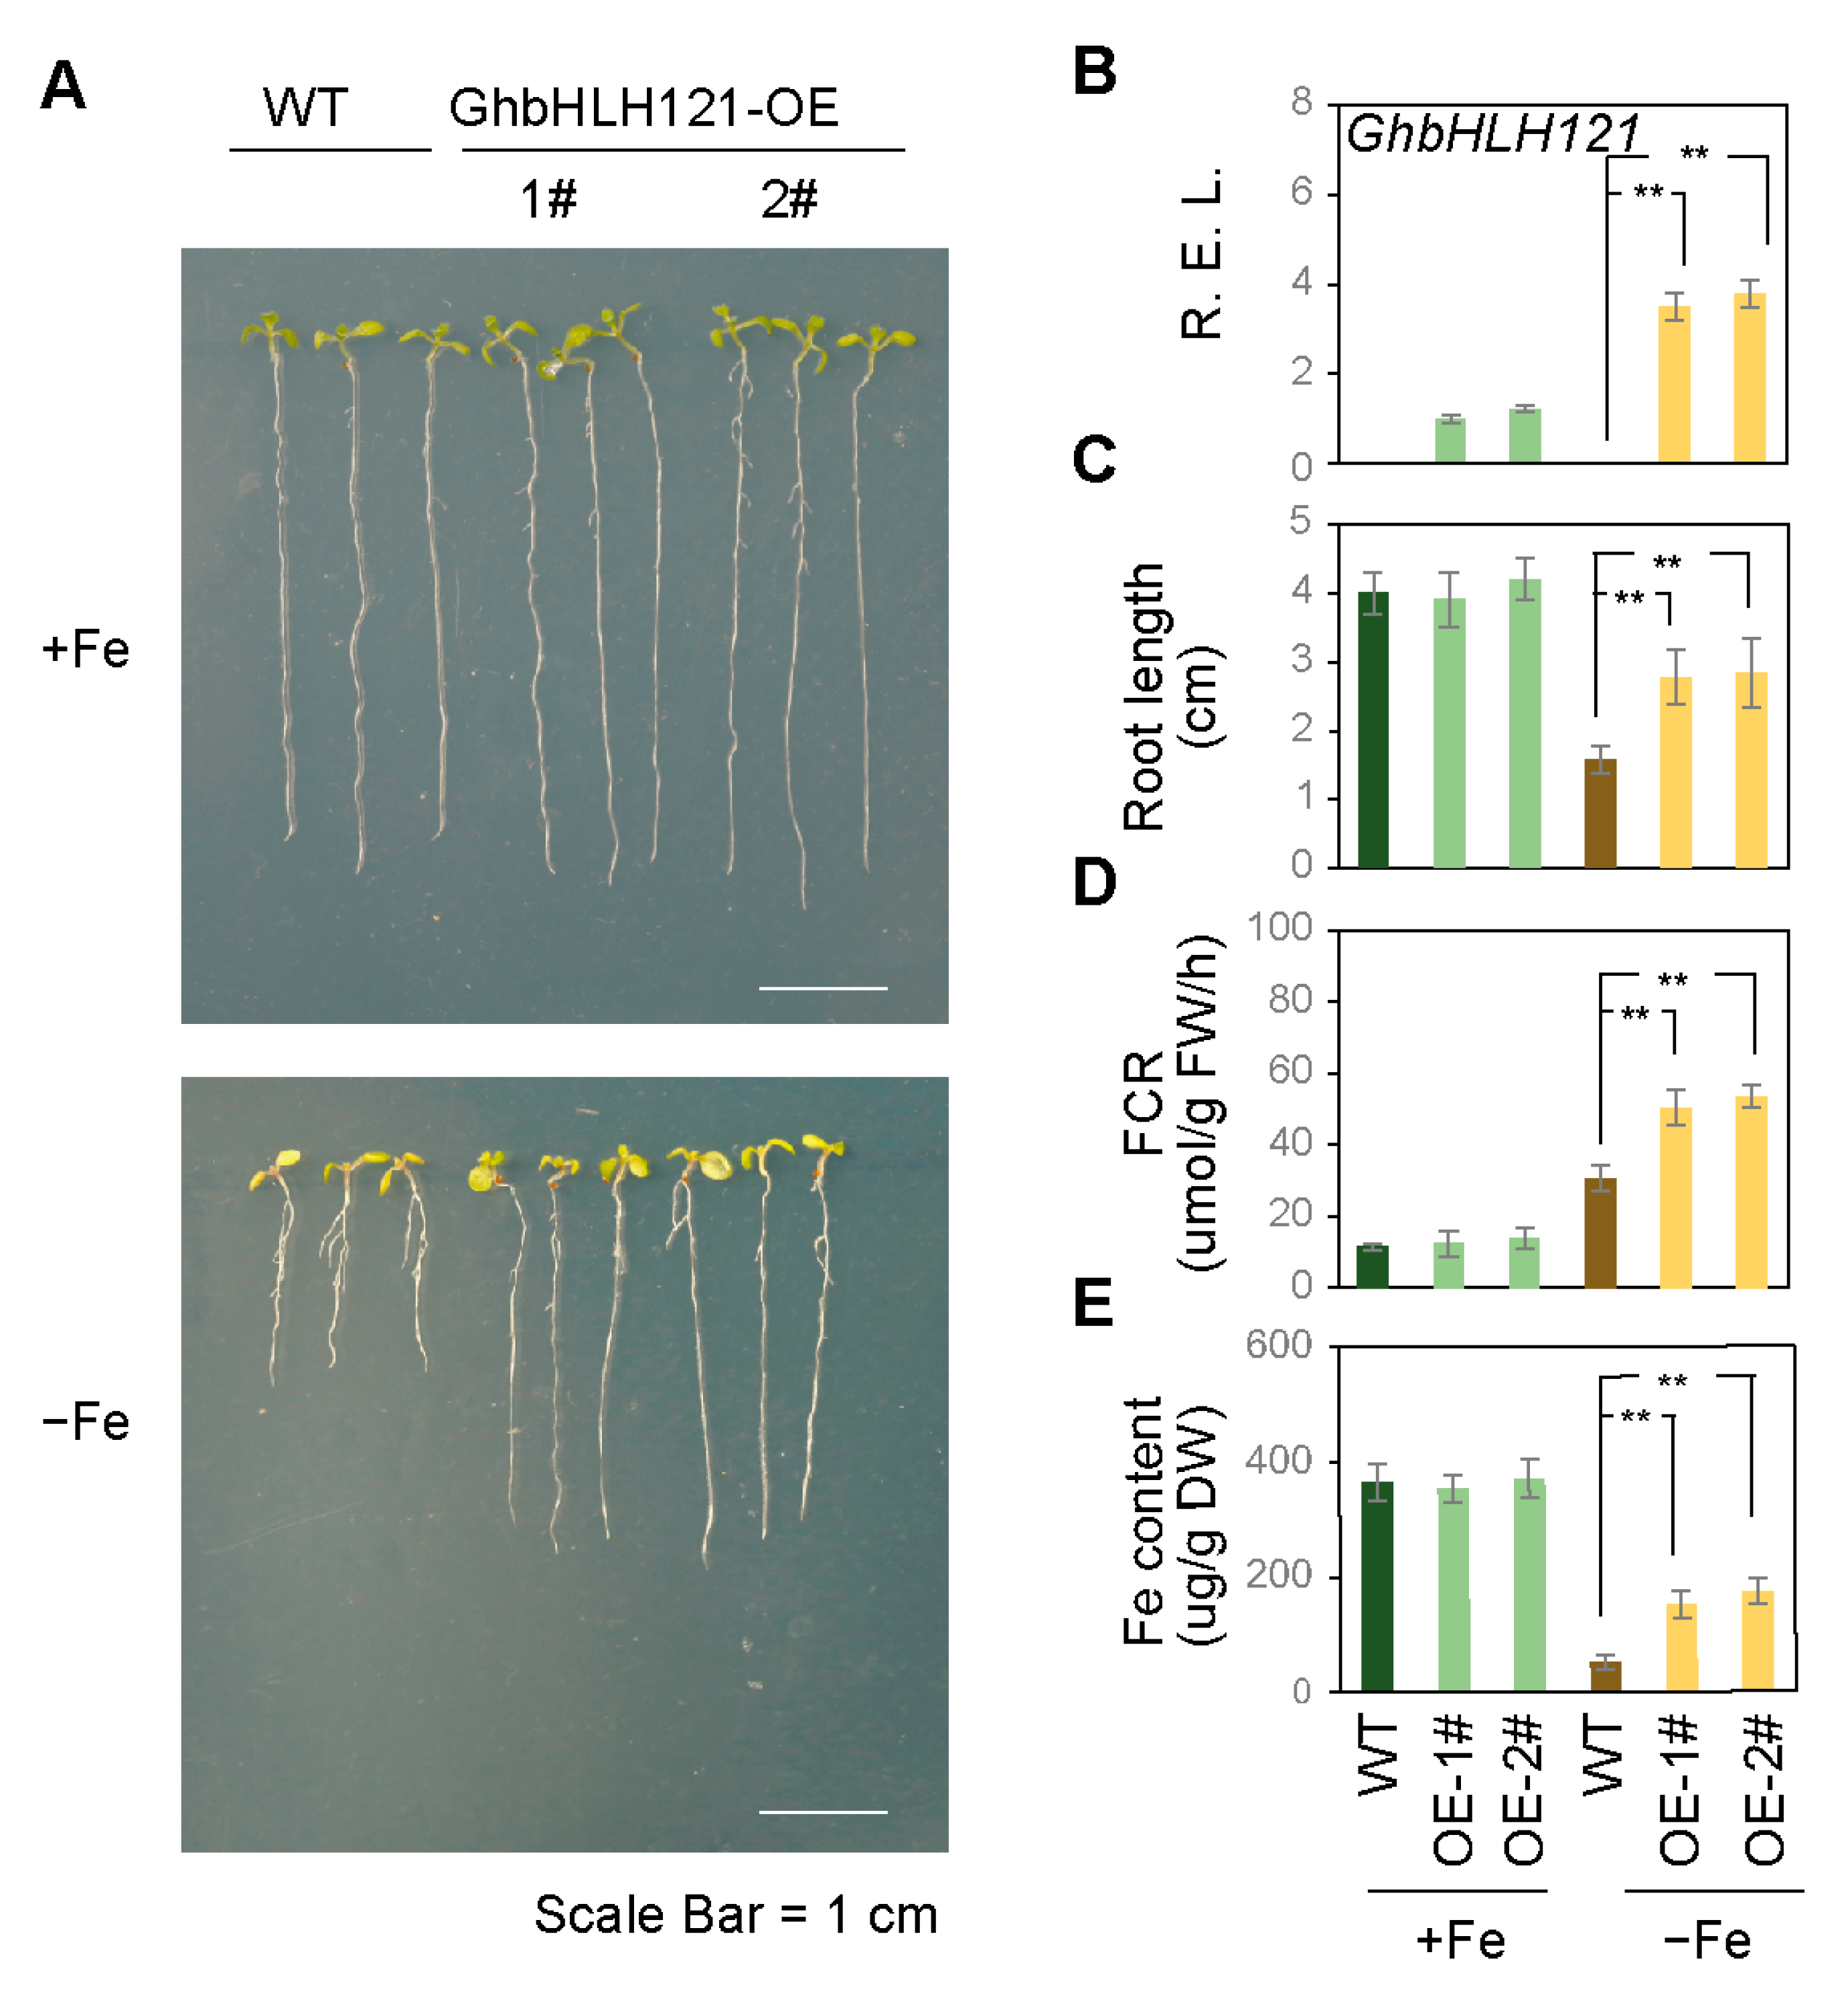
To investigate the role of GhbHLH121 in the regulation of iron homeostasis, transgenic Arabidopsis lines were generated through ectopically expressed GhbHLH121 (GhbHLH121-OE) fused to the cauliflower mosaic virus (CaMV) 35S promoter. Under +Fe conditions, there was no significant difference between the Arabidopsis seedlings of GhbHLH121-OE and WT in terms of growth state, including root length, chlorophyll content, FCR, and Fe content. Under −Fe conditions, WT seedlings exhibited a pronounced iron deficiency phenotype, including inhibited root growth, reduced FCR, and Fe content (Figure 5A–E). Compared with WT, GhbHLH121-OE seedlings showed amelioration of iron deficiency symptoms, that is, the root lengths were twice that of WT (Figure 5A,C) and FCR and Fe contents were higher (Figure 5D,E). These results suggest that the ectopic expression of GhbHLH121 can reduce iron deficiency damages to Arabidopsis.
Furthermore, we analyzed whether the tolerance of GhbHLH121-OE plants to iron deficiency is related to the expression of iron-related genes by qRT-PCR (Table 2, Supplemental Figure S11). In the transgenic lines evaluated here, expression of GhbHLH121 (Figure 5B, Supplemental Figure S12) was increased under −Fe. In addition, the iron uptake genes IRT1 and FRO2 were upregulated together with FIT and bHLHIb (Table 2). Under +Fe conditions, ectopic expression of GhbHLH121 did not affect the expression of FIT, bHLHIb, IRT1, and FRO2. In addition, expression of PYE was significantly higher in GhbHLH121-OE than in WT under −Fe conditions, but the expression of YSL1, NAS4, and FRD3 did not differ significantly. Expression of BTS was higher in GbhHLH121-OE than in WT under −Fe conditions. While bHLH IVc itself is not activated by iron deficiency and is not affected by GhbHLH121 under either −Fe or +Fe conditions, the observed expression patterns suggest that GhbHLH121 may effectively alleviate the symptoms of iron deficiency in Arabidopsis by regulating genes related to iron homeostasis.

2.5. GhbHLH121 Interacts with GhbHLH IVc Genes and GhPYE

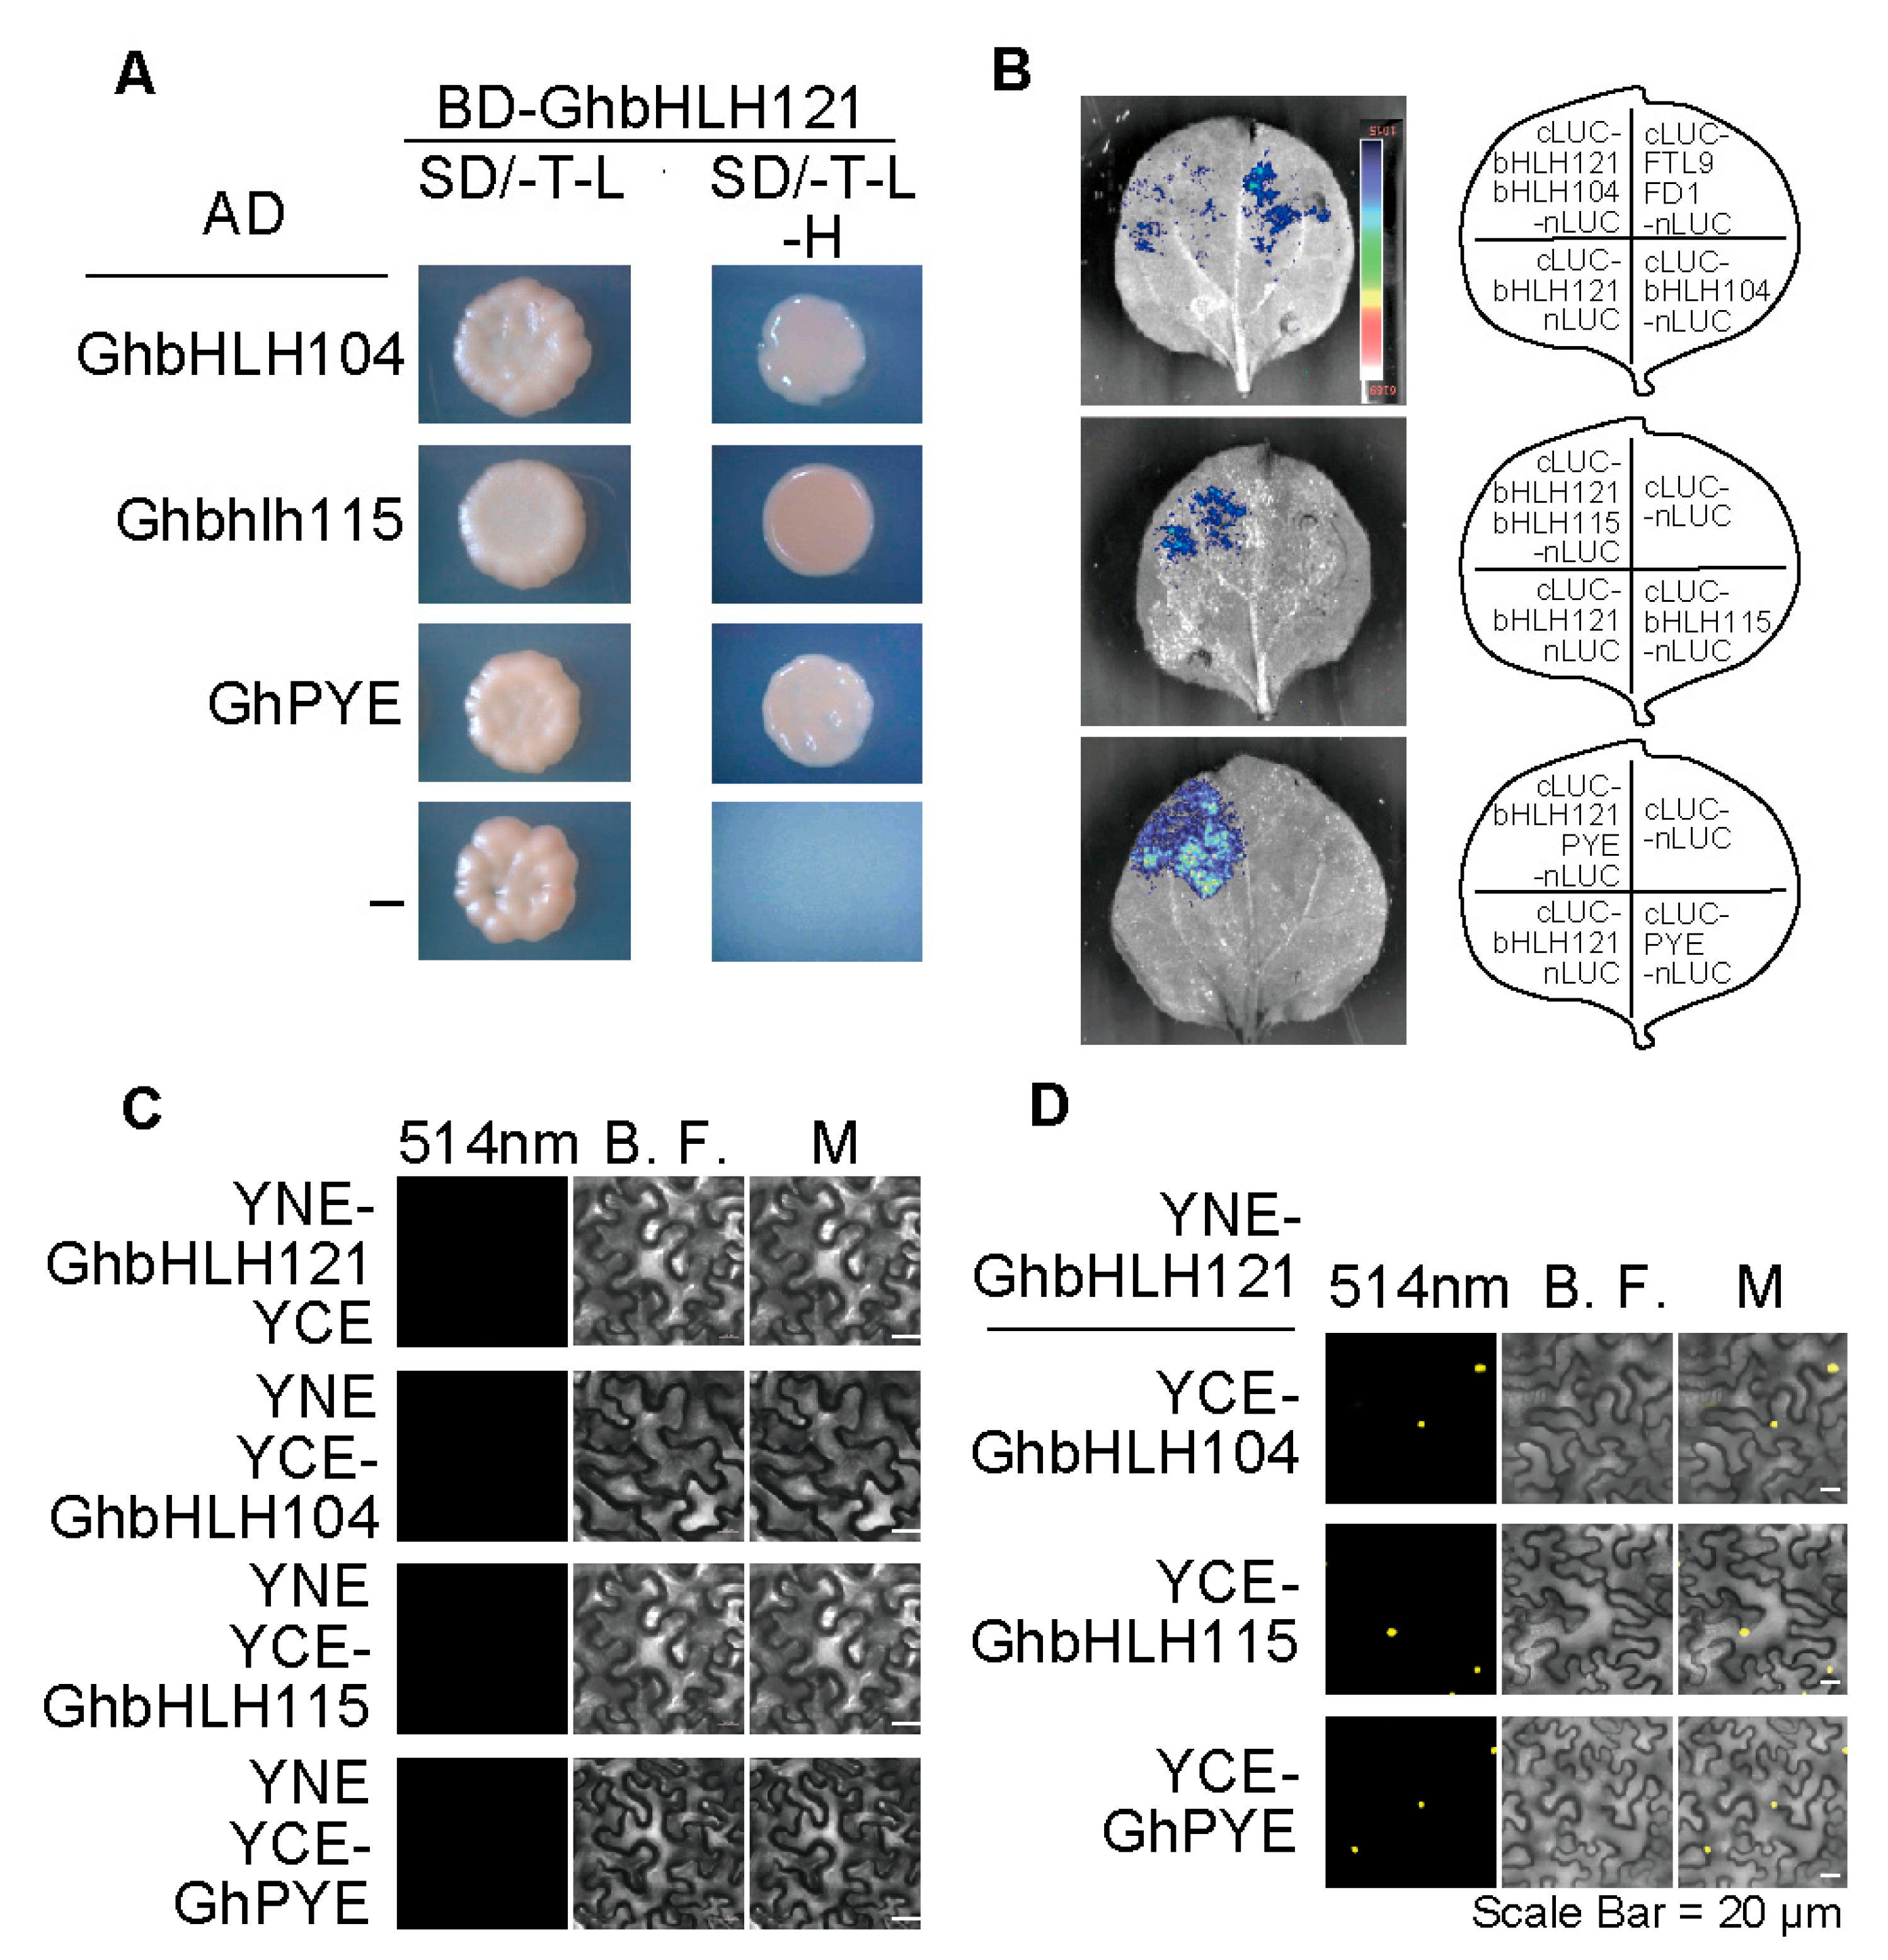
In order to study the molecular regulatory network of GhbHLH121 in cotton, GhbHLH121 was inserted into pGBKT7 to construct a bait vector, which was used to screen a library of cotton proteins via the yeast two-hybrid system. A total of 85 genes whose products potentially interact with GhbHLH121 were screened from the yeast library (Supplemental Table S1), including GhbHLH104, GhbHLH115 (bHLH IVc TF), and PYE (bHLH IVb TFs). Yeast two-hybrid assay and Luciferase complementation assays confirmed that GhbHLH121 can interact with GhbHLH104, GhbHLH115, and PYE (Figure 6A,B). The bimolecular fluorescence complementation technology (BIFC) further confirmed these interactions (Figure 6D). In addition, YFP fluorescence signals were observed to be localized in the nucleus for three fusion proteins (Figure 6C). However, Figure 2E shows that the subcellular localization signals of GhbHLH121 were distributed in the nucleus and cytoplasm. Figure 6D shows that heterodimer of GhbHLH121 and GhbHLH104, GhbHLH115, PYE resides in the nucleus.

2.6. GhbHLH121 Directly Activates Transcription of GhbHLH38, GhFIT, and GhPYE Independent of GhbHLH104 and GhbHLH115

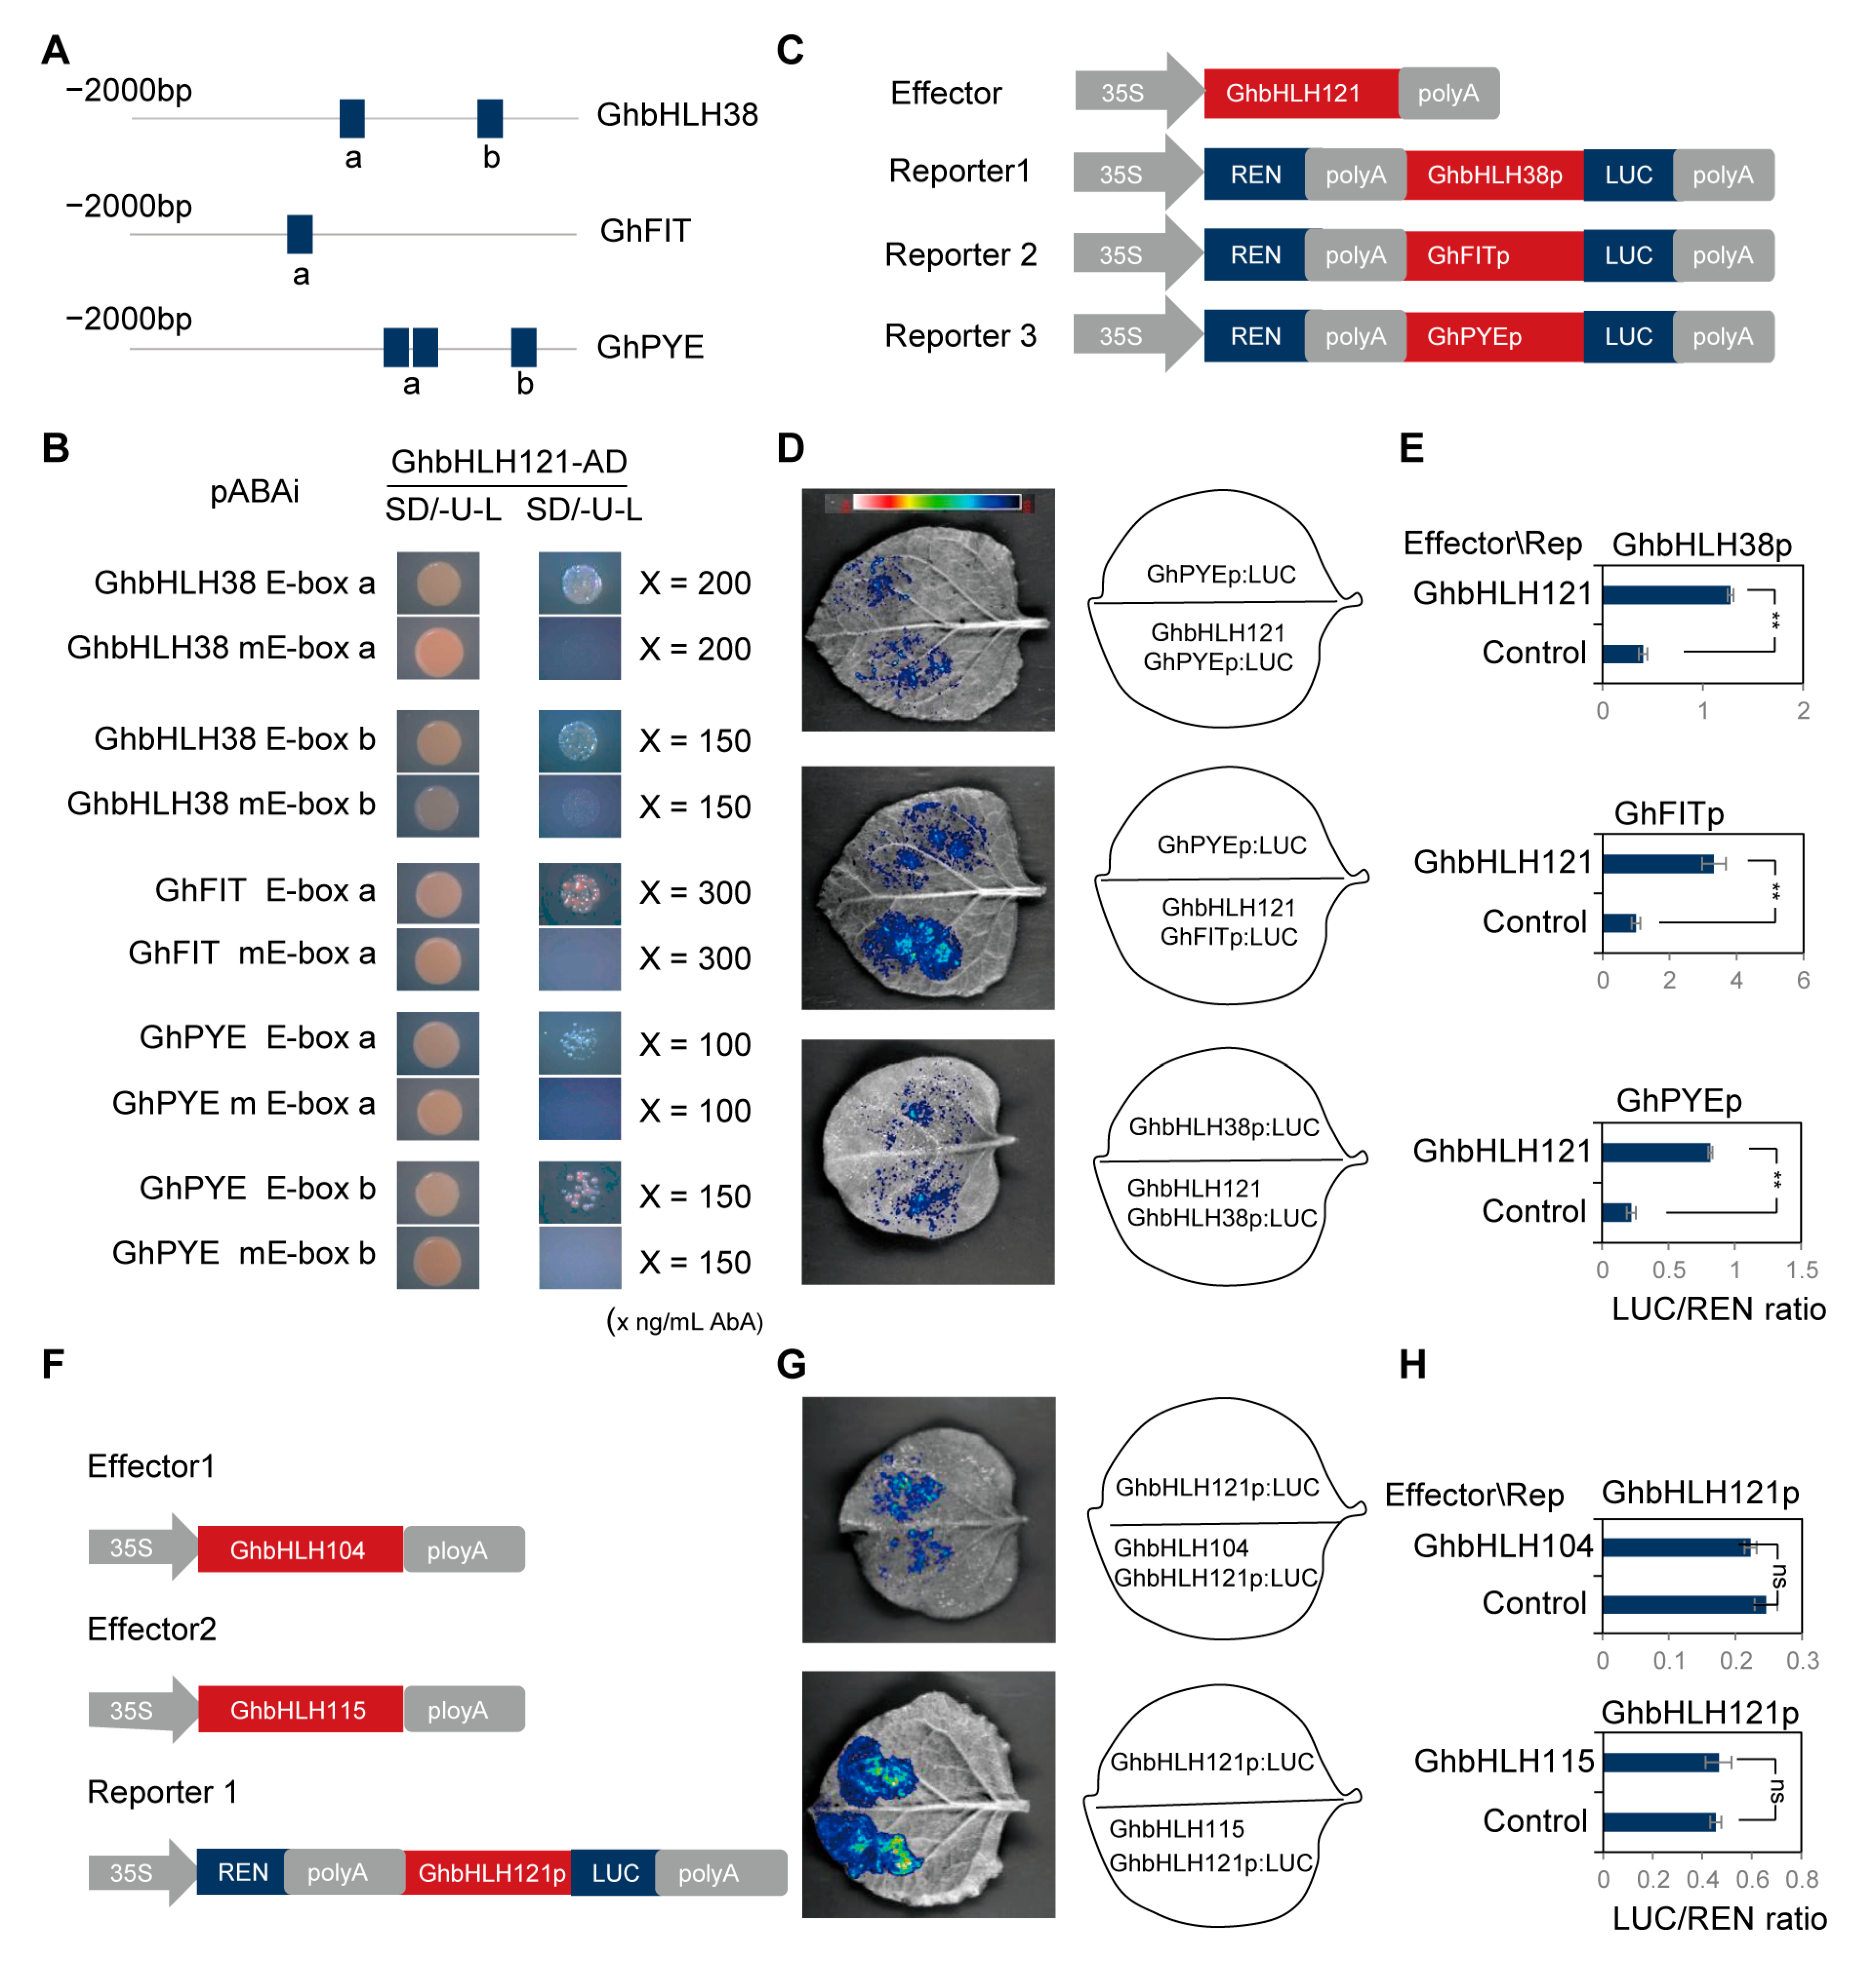
bHLH transcription factors regulate the expression of target genes by recognizing and binding E-box DNA motifs [56,57]. Multiple E-boxes are present in the promoters of GhbHLH38, GhFIT, and GhPYE (Figure 7A; Supplemental Table S2). In order to explore whether GhbHLH121 can bind to these E-box motifs, we generated constructs with the E-box sites mutated with CA to TC (mE-box) [58]. Yeast one-hybrid assay confirmed GhbHLH121 could bind to E-box motifs on the promoters of GhbHLH38, GhFIT, and GhPYE (Figure 7B). Mutation of the E-boxes in each promoter decreased this binding efficiency (Figure 7D).
To further verify whether GhbHLH121 has transcriptional activation effects on GhbHLH38, GhFIT, and GhPYE, the promoters of GhbHLH38, GhFIT, and GhPYE were fused into the LUC vector as reporter genes, for which GhbHLH121 was used as the effector (Figure 7C). Co-injection of constructs into tobacco leaves revealed that GhbHLH121 can activate the transcription of GhbHLH38, GhFIT, and GhPYE (Figure 7D,E).
Lei et al. reported AtbHLH121 alone had no notable effect on FIT and bHLH38 promoter activity, while AtbHLH104 and AtbHLH115 each induced significant activation [46]. In addition, bHLH IVc TFs were reported to directly bind the bHLH121 promoter [46]. Therefore, we designed the experiment to explore whether the regulatory networks of cotton and Arabidopsis thaliana are consistent. GhbHLH104 and GhbHLH115 were used as effectors and the GhbHLH121 promoter in the reporter (Figure 7F). GhbHLH104 and GhbHLH115 are unable to activate the transcription of GhbHLH121 (Figure 7G,H). Thus, GhbHLH121 can activate transcription of GhbHLH38, GhFIT, and GhPYE, and this activation was independent of GhbHLH104 and GhbHLH115.

3. Discussion

3.1. Effects of Iron Deficiency Stress on Cotton Seedling Development

Soil salinization is a major environmental threat to the agriculture industry worldwide and affects approximately 20% of the world’s cultivated land and nearly half of all irrigated land, and the impact is becoming increasingly severe [59]. For example, the high pH in saline–alkali soil causes a lack of absorbable iron, which is harmful to the growth and development of seedling-stage cotton. Iron is required for a wide variety of plant metabolic processes but is particularly crucial for photosynthesis, as it acts as a cofactor in both photosystems [60,61]; consequently, Fe deficiency severely limits photosynthetic efficiency [62]. This study is the first to conduct a comprehensive and in-depth analysis of the photosynthetic efficiency of cotton seedlings under iron deficiency. Iron-deficient cotton seedlings exhibited leaf chlorosis due to reduced leaf Fe content and chlorophyll content, which in turn led to decreased leaf photosynthetic rate (Figure 1). There are two main mechanisms for the reduction in plant photosynthesis caused by abiotic stress: stomatal limitation and non-stomatal limitation [63,64]. Stomatal limitation refers to the decrease in stomatal conductance, which directly affects the photosynthesis [65]. Iron deficiency did not affect transpiration rate stomatal conductance and intercellular CO2 concentration (Supplemental Figure S1). The non-stomatal limitations mainly include the destruction of chloroplast structure, the decrease in chlorophyll content, the inhibition of Ru-BP carboxylase activity, the decrease in glycolate oxidase activity, the decrease in photosynthetic phosphorylation activity, and the change in reactive oxygen species metabolism [62]. This reduction in photosynthetic rate in iron-deficient cotton leaves might be mainly attributable to the following two causes. First, with regard to the overall impact on transcriptional regulation, iron deficiency conditions inhibited the expression of genes involved in photosystem elements, including PSI, PSII, Cytb6f, and Fd (Supplemental Figure S2), with consequent weakening of the electron transfer efficiency of the photosynthetic chain. This pattern has previously been reported in Arabidopsis [38], phytoplankton [66,67], and sugar beet (Beta vulgaris L. cv. F58-554H1) [68]. Second, we observed the ultracellular structure of cotton leaf cells to be damaged under iron deficiency, predominantly on chloroplast and mitochondrial (Figure 4). Therefore, the decrease in photosynthetic rate under iron deficiency stress in cotton seedlings may be mainly caused by non-stomatal limiting factors.

3.2. GhbHLH121 Is a Positive Regulator for the Response to Iron Deficiency in Cotton

The response of AtbHLH121 to iron deficiency is a subject of debate (Figure 8) [45,46,47], but here we observed the expression of GhbHLH121 to increase under iron deficiency (Figure 2). AtbHLH121 was a transcription factor and positive regulator of iron homeostasis in Arabidopsis [45,46,47]. Under −Fe conditions, Atbhlh121 mutants have decreased tolerance to iron deficiency, exhibiting strong inhibition of primary root growth and FCR activity along with low fresh weight and chlorophyll content [45,46,47].
We found that ectopic expression of GhbHLH121 in Arabidopsis can increase the iron content of transgenic Arabidopsis GhbHLH121-OE and improve their tolerance to iron deficiency (Figure 5). Conversely, suppressing its expression in cotton resulted in the leaves becoming chlorotic, chlorophyll and leaf iron contents being reduced, and the photosynthetic rate decreasing (Figure 3). In addition, iron deficiency in cotton caused the ultracellular structure of leaves to be severely damaged, chloroplast thylakoids more loosely arranged, and mitochondria almost completely hollowed (Figure 4). These results suggest that inhibiting expression of GhbHLH121 decreases cotton tolerance to iron deficiency.
In cotton, GhbHLH121 is an iron deficiency response gene, which activates the ex-pression of downstream genes only when cotton faces iron deficiency. Guerinot et al. propose a model in which phosphorylated AtbHLH121 is allowed to accumulate when plants become Fe-deficient and interacts with subgroup IVc bHLH transcription factors. These heterodimers bind to the promoters of subgroup Ib genes and induce their expression. Subgroup Ib transcription factors then form heterodimers with FIT to activate the transcription of FRO2, IRT1, and other FIT-regulated genes. The induction of Fe uptake genes enhances Fe uptake and alleviates iron deficiency [45]. However, whether iron deficiency affects phosphorylation of GhbHLH121 in cotton remains to be seen.

3.3. The Transcriptional Regulatory Network of Cotton GhbHLH121

Due to whole-genome duplication and allopolyploidization, the cotton genome contains many more members of the bHLH transcription factor family than does Arabidopsis (Supplemental Figure S4; Supplemental Table S3), and they also exhibit specific transcriptional patterns. In Arabidopsis, the bHLH Ib subgroup has four members whose expression is induced by iron deficiency [69]. In contrast, the cotton genome features seven members and only GhbHLH38 is induced by iron deficiency (Table 1). Moreover, GhbHLH101 is barely expressed in leaves (Supplemental Figure S13). Among iron homeostasis genes, the core gene FIT (bHLH29, bHLH IIIe) has four homologs in the cotton genome, of which only a pair of duplicated homeologs are stably expressed in leaves (Supplemental Figures S4 and S13; Supplemental Table S3). Of the bHLH IVc subgroup [70] in Arabidopsis, only AtbHLH115 is induced by iron deficiency [71]. Meanwhile, cotton members of this subgroup comprise two homologs of GhbHLH104 and ten homologs of GhbHLH115 (Supplemental Figure S4), with expression of GhbHLH104 being significantly induced by iron deficiency in cotton seedlings (Table 1). There are conflicting reports regarding the transcriptional activity of bHLH12 under iron deficiency in Arabidopsis [45,46,47]. Our study confirmed that GhbHLH121 is induced under iron deficiency in cotton seedlings (Figure 2C). In general, bHLH transcription factors have been reported to play important roles in the regulation of plant iron homeostasis [50,51], and our results confirmed that cotton also uses members of this family to regulate iron homeostasis. However, the observed transcriptional differences indicate that cotton has formed an iron deficiency regulation network with its own distinct characteristics.
Few studies have reported on the regulation of response to iron deficiency in cotton [52]. In the present work, it was found that GhbHLH121, as an upstream iron deficiency-responsive protein, forms heterodimers with GhbHLH104, GhbHLH115, and GhPYE (Figure 5) that act to increase the expression of iron-responsive genes involved in regulation of cotton iron homeostasis (Table 1). The 35SPro:GhbHLH121:GFP signal was initially detected in both nucleus and cytoplasm (Figure 2E), but the presence of GhbHLH104, GhbHLH115, or GhPYE caused it to localize only to the nucleus (Figure 5C). GhbHLH121 does not have a transmembrane signal peptide, but does co-localize with GhGCN5 and GhNRT in the cytoplasm (Supplemental Figure S14). The post-transcriptional regulation of GhbHLH121 remains to be further explored. All told, this and prior evidence indicate that bHLH121 is a positive iron regulator in both Arabidopsis [45,46,47] and cotton.
While both cotton and Arabidopsis are dicotyledonous plants, we observed some notable differences in their respective iron regulatory networks (Figure 8, Supplemental Figure S15). Under +Fe conditions, inhibiting the expression of GhbHLH121 decreased expression of GhbHLH38, GhFIT, GhPYE, and GhBTS. Meanwhile, under −Fe conditions, the genes GhbHLH38, GhFIT, GhPYE, GhBTS, GhIRT3, GhFRO2, GhAHA2, GhNAS4, and GhYSL1 all exhibited significantly lower expression than in controls, but no significant difference was observed in the expression of GhbHLH101 (Table 1). This suggests that in cotton, GhbHLH101 is not involved in the regulation of iron homeostasis by GhbHLH121, which is different from prior reports in Arabidopsis [45,46,47]. We also found GhbHLH121 to activate transcription of GhFIT, GhbHLH38, and GhPYE (Figure 7A–E), which is not consistently attested in Arabidopsis [45,46,47]. Gao et al. and Kim et al. found that bHLH121 did not bind the promoter of FIT, but Lei et al. reported bHLH121 to bind the FIT promoter and interact with bHLH IVc TFs, which may activate the binding on the FIT promoter [45,46,47]. However, bHLH121 alone had no notable effect on FIT and bHLH38 promoter activity, while bHLH104 and bHLH115 each induced significant activation [46]. In addition, bHLH IVc TFs were reported to directly bind the bHLH121 promoter [46], which is different to our results. Here we found that GhbHLH121 directly binds to the promoters of GhbHLH38, GhFIT, and GhPYE and activates their transcription independent of GhbHLH104 and GhbHLH115 (Figure 7A–E). GhbHLH104 and GhbHLH115 were both induced by iron deficiency, but their expression was not associated with GhbHLH121 (Figure 7F–H and Figure 8).
Ultimately, our work revealed that GhbHLH121 has a positive regulatory role in the iron homeostasis network (Figure 8). As an upstream iron deficiency-responsive protein, GhbHLH121 forms a heterodimer with GhbHLH104, GhbHLH115, and GhPYE. It also activates the expression of GhbHLH38, GhFIT, and GhPYE independent of GhbHLH104 and GhbHLH115 and regulates the expression of Fe uptake genes (such as GhIRT3, GhAHA2, and GhFRO2) and Fe transport genes (such as GhYSL1 and GhNAS4).

4. Materials and Methods

4.1. Plant Materials and Growth Conditions

Cotton plants (Gossypium hirsutum, accession Texas Marker-1 [TM-1]) were grown in a growth chamber with a 16/8 h light/dark cycle at 28 °C/25 °C and 70% relative humidity. Cotton seeds were sterilized and germinated by the paper towel method. In brief, cotton seeds were sterilized with 3% H2O2 for 30 min, rinsed 4–5 times with ddH2O, and then laid flat on soaked germinating paper. The germinating paper was rolled into a tube and placed in a germinating bag, which was then placed vertically in an incubator for four days. Afterwards, the seedlings were transferred to a hydroponic bucket filled with water for three days and then incubated with 1/2 Hoagland nutrient solution with 75 µM Fe2+-EDTA (+Fe) or without it (−Fe) for two weeks.
Arabidopsis thaliana ecotype Columbia (Col-0) seedlings were grown in a growth chamber with a 16/8 h light/dark cycle at 22 °C and 70% relative humidity. Briefly, seeds were sterilized and transferred to plates with half-strength Murashige and Skoog (MS) medium. After stratification at 4 °C for two days, the plates were transferred to the growth chamber. Fe-sufficient medium (+Fe) consisted of 1/2 MS medium with 1% (w/v) sucrose, 0.8% (w/v) agar, and 75 µM Fe2+-EDTA, while Fe-deficient medium (−Fe) consisted of the same ingredients without Fe2+-EDTA.

4.2. Construction of Materials for Virus-Induced Gene Silencing (VIGS-GhbHLH121) in TM-1

VIGS was performed following a previously described protocol [72]. The 1–300 bp nucleotide sequence of GhbHLH121 was amplified by specific primers (Supplemental Table S4) from TM-1 cDNA and cloned into a pTRV2 vector digested with EcoRI and BamHI. The resulting construct was transformed into Agrobacterium tumefaciens GV3101 to obtain the TRV2:GhbHLH121 bacterial solution. Cotton seeds were sterilized and germinated by the paper towel method, transferred to a hydroponic bucket filled with water for three days, and finally inoculated with TRV2:GhbHLH121, TRV2:CLA (positive control), or TRV2:00 (negative control) bacterial solution.

4.3. Generation of Transgenic Arabidopsis

The full-length coding sequence of GhbHLH121 was amplified by specific primers (Supplemental Table S4) from TM-1 cDNA and fused with GUS to generate 35S:GhbHLH121:GUS vectors (GhbHLH121-OE). The promoter of GhbHLH121 was amplified by specific primers (Supplemental Table S4) from TM-1 DNA and inserted into the pBI121 vector digested with HindIII and XbaI to generate GhbHLH121pro:GUS vectors. The constructs were then transformed into Agrobacterium tumefaciens strain GV3101 and injected into Col-0 Arabidopsis by the floral dip method. Positive transgenic plants were selected on 1/2 MS medium containing 50 mg/mL kanamycin. T3 plants were used for phenotype analysis. Primers used for the vector construction are listed in Supplemental Table S4.

4.4. Real-Time Quantitative Reverse Transcription PCR (qRT-PCR)

Total RNA was extracted by means of the Biospin Plant Total RNA Extraction Kit (BioFlux, Cluj, Romania). The RNA was then used for the synthesis of first-strand cDNA with the SuperScript III reverse transcriptase kit (Invitrogen, Waltham, MA, USA). Afterwards, qRT-PCR was performed using the Light Cycler FastStart DNA Master SYBR Green I Kit (Roche, Basel, Switzerland) according to the manufacturer’s instructions (Bio-Rad, Hercules, CA, USA). Means and standard deviations were calculated from three biological replicates. Primers used for the qRT-PCR are listed in Supplemental Table S5.

4.5. Phylogenetic Analysis

For phylogenetic analysis, protein sequences were retrieved from TAIR and COTTONOMICS. Sequences of bHLH transcription factors involved in Fe homeostasis were aligned using ClustalX 1.5. The phylogenetic tree included multiple plant species and was constructed using MEGA 5 with the NJ method, and the selected model was the Poisson model with 1000 bootstrap replications [73]. We used the ITOL9 web server to beautify the resulting phylogenetic tree.

4.6. Measurement of Iron Deficiency-Associated Physiological Parameters

4.6.1. Photosynthetic Measurements

After growing cotton seedlings in +Fe or −Fe solution, the penultimate leaf was placed in the 3 cm leaf chamber of an LI-6400 portable photosynthesizer (LI-6400XT; Li-Cor, Darmstadt, Germany) for evaluation of photosynthetic parameters. Photosynthesis rate, stomatal conductance, transpiration rate, and intercellular CO2 concentration were determined simultaneously. Conditions in the measurement chamber consisted of a flow rate of 400 mol/s, CO2 concentration in the sample chamber of 400 mmol/mol, and relative humidity of 60%. Means and standard deviations were calculated from three biological replicates.

4.6.2. Fe Concentration Measurement

To determine Fe concentration, samples (Arabidopsis seedlings or cotton leaves) were harvested and dried at 65 °C for three days. About 100 mg dry weight was mixed with 5 mL of 1 M HNO3 and 1 mL of H2O2 for 20 min at 220 °C. Each sample was then diluted to 16 mL with ultrapure water and the Fe concentration determined using a Thermo SCIENTIFIC ICP-MS (iCAP6300, Waltham, MA, USA). Means and standard deviations were calculated from three biological replicates.

4.6.3. Ferric Chelate Reductase Assays

To determine ferric chelate reductase activity (FCR), cotton leaves were harvested and placed in assay solution containing 0.1 mM Fe3+-EDTA and 0.3 mM ferrozine in the dark for 20 min. An identical assay solution without the addition of plant tissue was used as a blank. After incubation, the absorbance of the purple-colored Fe(II)−ferrozine complex was measured at 562 nm and concentration calculated using a molar extinction coefficient of 28.6 mM−1 cm−1 [74]. Means and standard deviations were determined from three biological replicates.

4.6.4. Chlorophyll Measurement

To determine chlorophyll content, 0.1 g samples of cotton penultimate leaves were harvested and placed in 80% acetone solution for 30 min. The absorbance (A) was measured at 663 and 646 nm. Total chlorophyll content (expressed as μg/g FW) was then calculated using the following equations: Chl a = 12.25 × A663 − 2.79 × A646, Chl b = 21.50 × A646 − 5.10 × A663, and Chl a + Chl b = 7.05 × A663 + 18.09 × A646 [75]. Means and standard deviations were determined from three biological replicates.

4.6.5. NBT Staining and DAB Staining

Cotton leaves were put into a tube with NET staining solution (G1023, 100 mL, Solarbio, Beijing, China) or DAB staining solution (G1022, 100 mL, Solarbio, Beijing, China), with the leaves being completely immersed in the solution. Leaves were subjected to 15 min of vacuumization and then incubated overnight at room temperature. The next day, the leaves were decolorized with absolute ethanol for 10 min, 95% for 10 min, and then 70% until completely decolorized.

4.6.6. Measurements of SOD, POD, and CAT Activity

To determine physiological parameters of oxidative defense, 0.1 g cotton penultimate leaf was used in the SOD Quantification Assay Kit (BC0170, Solarbio, Beijing, China), POD Quantification Assay Kit (BC0095, Solarbio, Beijing, China), and CAT Quantification Assay Kit (BC0205, Solarbio, Beijing, China) as described by the manufacturer. Means and standard deviations were calculated from three biological replicates.

4.7. Microscopic Observation

4.7.1. Subcellular Localization

To produce the constructs 35SPro:GhbHLH121:GFP, 35SPro:GhNRT:GFP, and 35SPro:GhGCN5:GFP, full-length coding sequences of GhbHLH121, GhNRT, and GhGCN5 were inserted into the pBINGFP4 vector. The constructs were transformed into Agrobacterium tumefaciens strain GV3101 and subsequently injected into three-week-old Nicotiana benthamiana leaves. After cultivation in the dark for two days, fluorescence in the epidermal cells was visualized on a confocal microscope (Zeiss LSM780, Oberkochen, Germany) with the excitation laser at 488 nm. The primers used for vector construction are listed in Supplemental Table S4. For each combination, three biological replicates were performed.

4.7.2. Transmission Electron Microscopy

For TEM analysis of treated plants, cotton penultimate leaves were immersed in a solution containing 2.5% glutaraldehyde. The leaves were fixed with osmic acid for two hours, rinsed with phosphate buffer solution, and then subjected to ethanol gradient dehydration. After embedding with an embedding agent overnight, thin sections were prepared with an ultrathin microtome, stained with uranyl acetate and lead citrate, and examined using a Hitachi H-7650 transmission electron microscope at 80 kV.

4.8. Validation of Protein–Protein Interactions

4.8.1. Yeast Two-Hybrid Screening and Assays

For the yeast two-hybrid screening, the full-length coding sequence of GhbHLH121 was inserted into pGBKT7 as the bait vector and transformed into yeast strain Y2H to produce the bait strain. Cotton leaf and root cDNA libraries cloned into the pGADT7-Rec vector were used to produce the bait strain with the Make Your Own “Mate & Plate” Library System (Cat. No. 630490, TaKaRa, Dalian, China). The library strain was then mated with the bait strain, and the mating mixture was spread onto SD/-Trp/-Leu/-His medium and incubated at 30 °C for 8–10 days. Positive clones were amplified by Matchmaker Insert Check PCR Mix 2 (Cat. No. 630497, TaKaRa, Dalian, China).
For the yeast two-hybrid assay, the full-length coding sequence of GhbHLH121 was inserted into pGBKT7 as the bait vector, and the full-length coding sequences of GhbHLH104, GhbHLH115, and GhPYE were inserted into pGADT7 to produce the prey vectors. The bait vector and each prey vector were introduced together into Y2HGlod, and the transformed cells were spread onto SD/-Trp/-Leu/-His medium and incubated at 30°C for 2–3 days. The combination of pGBKT7-53 and pGADT7-T was used as a positive control and the combination of pGBKT7-Lam and pGADT7-T as a negative control (Matchmaker Gold Yeast Two-Hybrid System, Cat. No. 630489, TaKaRa, Dalian, China). Primers used for the vector construction are listed in Supplemental Table S4. For each combination, three biological replicates were performed.

4.8.2. Bimolecular Fluorescence Complementation

The full-length coding sequence of GhbHLH121 was inserted adjacent to the sequence for the N-terminal fragment of YFP, denoted as YNE-GhbHLH121. The full-length coding sequences of GhbHLH104, GhbHLH115, and GhPYE were similarly inserted alongside the sequence for the C-terminal fragment of YFP, and the resulting constructs were denoted 35SPro:GhbHLH104:YCE, 35SPro:GhbHLH115:YCE, 35SPro:GhPYE:YCE, respectively. The constructs were transformed into A. tumefaciens strain GV3101 and bacteria harboring the effectors and reporters were mixed in a 1:1 volume ratio. The obtained mixtures were then injected into the abaxial sides of three-week-old N. benthamiana leaves. After two days of cultivation in the dark, epidermal cells were imaged on a confocal microscope (Zeiss LSM780, Oberkochen, Germany), with the YFP signal elicited by a 514 nm excitation laser and recorded. Primers used for the vector construction are listed in Supplemental Table S4. For each combination, three biological replicates were evaluated.

4.8.3. Luciferase Complementation Imaging Assay

The full-length coding sequence of GhbHLH121 was inserted alongside the sequence encoding the C-terminal fragment of luciferase, producing the construct cLUC-GhbHLH121. The full-length coding sequences of GhbHLH104, GhbHLH115, and GhPYE were likewise inserted alongside that encoding the N-terminal fragment of luciferase, which constructs were denoted as GhbHLH104-nLUC, GhbHLH115-nLUC, and GhPYE-nLUC, respectively. The constructs were transformed into A. tumefaciens strain GV3101 and bacteria harboring the effectors and reporters were mixed in a 1:1 volume ratio. The resulting mixtures were then injected into the abaxial sides of three-week-old N. benthamiana leaves. After two days of cultivation in the dark, Luciferin (100 μM) spray (Sigma, 103404-75-7, St. Louis, MO, USA) was smeared on the backs of the leaves and luciferase signals were obtained by a low-light cooled charge-coupled device imaging apparatus (Tanon 5200, Shanghai, China). The positive controls were FTL9 and FD1 [76]. Primers used for the vector construction are listed in Supplemental Table S4. For each combination, three biological replicates were assessed.

4.9. Validation of DNA–Protein Interactions

4.9.1. Yeast One-Hybrid Assay

E-box-containing fragments of the promoters for GhbHLH38, GhFIT, and GhPYE were inserted into vectors to produce bait vectors and an mE-box containing a mutation of CA to TC [58], which were then digested by BstBI and the linearized plasmids transferred into yeast strain Y1H gold to yield the pBait-AbAi bait strain. Yeasts were screened according to the concentration of AbAi. The full-length coding sequence of GhbHLH121 was inserted into the pGBKT7 vector to construct the prey vector, which was then introduced into the pBait-pAbAi strain and the bacteria spread on SD/-Leu/AbA and incubated at 30°C for two to three days. The yeast one-hybrid assay was then conducted using the Matchmaker Gold Yeast One-Hybrid Library Screening System kit (Cat. No. 630491, TaKaRa, Dalian, China). For each combination, three biological replicates were performed.

4.9.2. Luciferase Assay

The promoters of GhbHLH38, GhFIT, and GhPYE were inserted into the pGreen II 0800-LUC vector to create reporter constructs. The full-length coding sequence of GhbHLH121 was inserted into the pGreen II 62SK vector as the effector. The constructs were transformed into A. tumefaciens strain GV3101 and bacteria harboring the effectors and reporters were mixed in a 1:1 volume ratio. The resulting mixtures were then injected into the abaxial sides of three-week-old N. benthamiana leaves. After two days of cultivation in the dark, luciferase signals were obtained by observing leaves coated with Luciferin (100 μM) spray (Sigma, 103404-75-7, St. Louis, MO, USA) under a low-light cooled charge-coupled device imaging apparatus (Tanon 5200, Shanghai, China). The LUC/REN ratio was then determined using a dual-luciferase reporter gene analysis system (E2490, Promega, Madison, WI, USA). For each combination, three biological replicates were evaluated. Primers used for the vector construction are listed in Supplemental Table S4. Means and standard deviations were calculated from three biological replicates.

Supplementary Materials

The following supporting information can be downloaded at: https://www.mdpi.com/article/10.3390/plants12101955/s1, Figure S1: Iron deficiency reduces photosynthetic rate in the cotton leaves. Figure S2: Iron deficiency reduces the expression of photosynthesis genes in cotton leaves. Figure S3: Iron deficiency affects the accumulation of reactive oxygen species (ROS) in cotton leaves. Figure S4: 53 bHLH transcription factors involved in iron deficiency response in cotton. Figure S5: Alignment of the amino acid sequences of GhbHLH121-AT, GhbHLH121-DT, and AtbHLH121. Figure S6: TRV2:00 and the TRV2:GhbHLH121 seedlings grown for three weeks on +Fe or −Fe solution. Figure S7: TRV2:GhbHLH121 seedlings exhibit reduced photosynthetic rate under iron deficiency. Figure S8: Suppression of GhbHLH121 reduces the expression of photosynthesis genes under iron deficiency. Figure S9: Suppression of GhbHLH121 affects the accumulation of ROS under iron deficiency. Figure S10: Iron deficiency causes changes in chloroplast shape. Figure S11: Expression of GhbHLH121 in GhbHLH121-OE transgenic and wild-type Arabidopsis. Figure S12 Histogram to show that GUS reporter expression in the WT and Ghbhlh121-OE Arabidopsis seedlings grown for 1 weeks on +Fe or −Fe media Figure S13: Expression of GhbHLH TFs involved in the iron deficiency response in cotton. Figure S14: GhbHLH121 co-localizes with GhGCN5 and GhNRT in the cytoplasm. Figure S15: A working model illustrating the roles of AtbHLH121 in response to iron deficiency in Arabidopsis. Table S1: Interaction genes obtained from yeast library. Table S2: Promoter sequence of GhbHLH38, GhFIT and GhPYE. Table S3: Differences in bHLH expression and transcriptional regulation between Cotton and Arabidopsis. Table S4: Oligonucleotides used for vector construction in this study [77,78]. Table S5: Oligonucleotides used for qRT-PCR in this study. Table S6: Accession of genes used in this study.

Author Contributions

Conceptualization, X.G.; methodology, J.L.; validation, J.L., M.Q., and D.Y.; formal analysis, K.N., L.W. and Y.Z.; investigation, J.L. and K.N.; writing—original draft preparation, J.L. and X.G.; writing—review and editing, M.Q. and X.G.; supervision, M.Q., D.Y., and X.G.; project administration, X.G.; funding acquisition, X.G. All authors have read and agreed to the published version of the manuscript.

Funding

This work was financially supported in part by grants from the National Key Research and Development Program (2022YFF1001400), Hainan Yazhou Bay Seed Lab, JBGS (B21HJ0403), National Natural Science Foundation of China (NSFC, 31971985, 31900395, 3200379), and Fundamental Research Funds for the Central Universities.

Data Availability Statement

Accession numbers: Sequence data for the genes described in this study can be found in the GenBank database under the following accession numbers: XP_016714640.1(GhbHLH121), XP_016753020.1 (GhbHLH38), XP_016699442.2 (GhbHLH104), XP_016702823.1 (GhbHLH115), XP_016689171.2 (GhFIT), XP_040936509.1 (GhPYE). All accession numbers listed in Supplemental Table S6.

Conflicts of Interest

The authors declare that they have no known competing financial interests or personal relationships that could have appeared to influence the work reported in this paper.

References

  1. Chen, Y.; Barak, P. Iron Nutrition of Plants in Calcareous Soils. Adv. Agron. 1982, 35, 217–240. [Google Scholar]
  2. Vose, P.B. Iron nutrition in plants: A world overview. J. Plant Nutr. 2008, 5, 233–249. [Google Scholar] [CrossRef]
  3. Murata, Y.; Itoh, Y.; Iwashita, T.; Namba, K. Transgenic petunia with the iron(III)-phytosiderophore transporter gene acquires tolerance to iron deficiency in alkaline environments. PLoS ONE 2015, 10, e0120227. [Google Scholar] [CrossRef] [PubMed]
  4. Zuo, Y.; Zhang, F. Soil and crop management strategies to prevent iron deficiency in crops. Plant Soil 2010, 339, 83–95. [Google Scholar] [CrossRef]
  5. Ye, X.; Wang, H.; Cao, X.; Jin, X.; Cui, F.; Bu, Y.; Liu, H.; Wu, W.; Takano, T.; Liu, S. Transcriptome profiling of Puccinellia tenuiflora during seed germination under a long-term saline-alkali stress. BMC Genom. 2019, 20, 589. [Google Scholar] [CrossRef] [PubMed]
  6. Cesare, F.; Pietrini, F.; Zacchini, M.; Mugnozza, G.S.; Macagnano, A. Catechol-Loading Nanofibrous Membranes for Eco-Friendly Iron Nutrition of Plants. Nanomaterials 2019, 9, 1315–1337. [Google Scholar] [CrossRef]
  7. Crichton, R.R.; Ward, R.J. Iron species in iron homeostasis and toxicity. Analyst 1995, 120, 693–702. [Google Scholar] [CrossRef]
  8. Connorton, J.M.; Balk, J.; Rodriguez-Celma, J. Iron homeostasis in plants—A brief overview. Metallomics 2017, 9, 813–823. [Google Scholar] [CrossRef] [PubMed]
  9. Zheng, S.J. Iron homeostasis and iron acquisition in plants: Maintenance, functions and consequences. Ann. Bot. 2010, 105, 799–800. [Google Scholar] [CrossRef] [PubMed]
  10. Nishio, J.N.; Terry, N. Iron nutrition-mediated chloroplast development. Plant Physiol. 1983, 71, 688–691. [Google Scholar] [CrossRef]
  11. Kobayashi, T.; Nishizawa, N.K. Iron uptake, translocation, and regulation in higher plants. Annu. Rev. Plant Biol. 2012, 63, 131–152. [Google Scholar] [CrossRef] [PubMed]
  12. Briat, J.F.; Dubos, C.; Gaymard, F. Iron nutrition, biomass production, and plant product quality. Trends Plant Sci. 2015, 20, 33–40. [Google Scholar] [CrossRef]
  13. Power, F.B.; Chesnut, V.K. Alkaline Reaction of the Cotton Plant. Science 1924, 60, 405–409. [Google Scholar] [CrossRef] [PubMed]
  14. Saghir, A.; Khan, N.-u.-I.; Iqbal, M.Z.; Hussain, A.; Hassan, M. Salt Tolerance of Cotton (Gossypium hirsutum L.). Asian J. Plant Sci. 2002, 1, 715–719. [Google Scholar]
  15. Sharif, I.; Aleem, S.; Farooq, J.; Rizwan, M.; Younas, A.; Sarwar, G.; Chohan, S.M. Salinity stress in cotton: Effects, mechanism of tolerance and its management strategies. Physiol. Mol. Biol. Plants 2019, 25, 807–820. [Google Scholar] [CrossRef]
  16. Vrettako, H.; Kallinis, T.L. Iron Deficiency in Cotton in Relation to Growth and Nutrient Balance. Soil Sci. Soc. Am. J. 1968, 32, 253–258. [Google Scholar]
  17. Brown, J.C.; Foy, C.D.; Bennett, J.H.; Christiansen, M.N. Light-Sources Differentially Affected Ferric Iron Reduction and Growth of Cotton. Plant Physiol. 1979, 63, 692–695. [Google Scholar] [CrossRef]
  18. Guerinot, M.L.; Yi, Y. Iron: Nutritious, Noxious, and Not Readily Available. Plant Physiol. 1994, 104, 815–820. [Google Scholar] [CrossRef]
  19. Nam, H.-I.; Shahzad, Z.; Dorone, Y.; Clowez, S.; Zhao, K.; Bouain, N.; Lay-Pruitt, K.S.; Cho, H.; Rhee, S.Y.; Rouached, H. Interdependent iron and phosphorus availability controls photosynthesis through retrograde signaling. Nat. Commun. 2021, 12, 7211. [Google Scholar] [CrossRef]
  20. Lucena, J.J.; Hernandez-Apaolaza, L. Iron nutrition in plants: An overview. Plant Soil. 2017, 418, 1–4. [Google Scholar] [CrossRef]
  21. Chen, J.; Wu, F.H.; Shang, Y.T.; Wang, W.H.; Hu, W.J.; Simon, M.; Liu, X.; Shangguan, Z.-P.; Zheng, H.-L. Hydrogen sulphide improves adaptation of Zea mays seedlings to iron deficiency. J. Exp. Bot. 2015, 66, 6605–6622. [Google Scholar] [CrossRef] [PubMed]
  22. Chen, L.; Wang, G.; Chen, P.; Zhu, H.; Wang, S.; Ding, Y. Shoot-Root Communication Plays a Key Role in Physiological Alterations of Rice (Oryza sativa) Under Iron Deficiency. Front. Plant Sci. 2018, 9, 757. [Google Scholar] [CrossRef] [PubMed]
  23. Liang, G. Iron uptake, signaling, and sensing in plants. Plant Commun. 2022, 3, 100349. [Google Scholar] [CrossRef] [PubMed]
  24. Mori, S. Iron acquisition by plants. Curr. Opin. Plant Biol. 1999, 2, 250–253. [Google Scholar] [CrossRef] [PubMed]
  25. Gao, F.; Robe, K.; Gaymard, F.; Izquierdo, E.; Dubos, C. The Transcriptional Control of Iron Homeostasis in Plants: A Tale of bHLH Transcription Factors? Front. Plant Sci. 2019, 10, 6. [Google Scholar] [CrossRef]
  26. Santi, S.; Schmidt, W. Dissecting iron deficiency-induced proton extrusion in Arabidopsis roots. New Phytol. 2009, 183, 1072–1084. [Google Scholar] [CrossRef]
  27. Connolly, E.L.; Campbell, N.H.; Grotz, N.; Prichard, C.L.; Guerinot, M.L. Overexpression of the FRO2 ferric chelate reductase confers tolerance to growth on low iron and uncovers posttranscriptional control. Plant Physiol. 2003, 133, 1102–1110. [Google Scholar] [CrossRef]
  28. Varotto, C.; Maiwald, D.; Pesaresi, P.; Jahns, P.; Salamini, F.; Leister, D. The metal ion transporter IRT1 is necessary for iron homeostasis and efficient photosynthesis in Arabidopsis thaliana. Plant J. 2002, 31, 589–599. [Google Scholar] [CrossRef]
  29. Shin, L.J.; Lo, J.C.; Chen, G.H.; Callis, J.; Fu, H.Y.; Yeh, K.C. IRT1 DEGRADATION FACTOR1, a RING E3 Ubiquitin Ligase, Regulates the Degradation of IRON-REGULATED TRANSPORTER1 in Arabidopsis. Plant Cell 2013, 25, 3039–3051. [Google Scholar] [CrossRef]
  30. Barberon, M.; Dubeaux, G.; Kolb, C.; Isono, E.; Zelazny, E.; Vert, G. Polarization of IRON-REGULATED TRANSPORTER 1 (IRT1) to the plant-soil interface plays crucial role in metal homeostasis. Proc. Natl. Acad. Sci. USA 2014, 111, 8293–8298. [Google Scholar] [CrossRef]
  31. Zelazny, E.; Vert, G. Regulation of Iron Uptake by IRT1: Endocytosis Pulls the Trigger. Mol. Plant 2015, 8, 977–979. [Google Scholar] [CrossRef]
  32. Vert, G.; Grotz, N.; Dédaldéchamp, F.; Gaymard, F.; Guerinot, M.L.; Briat, J.F.; Curie, C. IRT1, an Arabidopsis transporter essential for iron uptake from the soil and for plant growth. Plant Cell 2021, 33, 439–440. [Google Scholar] [CrossRef] [PubMed]
  33. Senoura, T.; Sakashita, E.; Kobayashi, T.; Takahashi, M.; Aung, M.S.; Masuda, H.; Nakanishi, H.; Nishizawa, N.K. The iron-chelate transporter OsYSL9 plays a role in iron distribution in developing rice grains. Plant Mol. Biol. 2017, 95, 375–387. [Google Scholar] [CrossRef]
  34. Ishimaru, Y.; Masuda, H.; Bashir, K.; Inoue, H.; Tsukamoto, T.; Takahashi, M.; Nakanishi, H.; Aoki, N.; Hirose, T.; Ohsugi, R.; et al. Rice metal-nicotianamine transporter, OsYSL2, is required for the long-distance transport of iron and manganese. Plant J. 2010, 62, 379–390. [Google Scholar] [CrossRef] [PubMed]
  35. Cai, Y.; Li, Y.; Liang, G. FIT and bHLH Ib transcription factors modulate iron and copper crosstalk in Arabidopsis. Plant Cell Environ. 2021, 44, 1679–1691. [Google Scholar] [CrossRef] [PubMed]
  36. Bauer, P.; Ling, H.Q.; Guerinot, M.L. FIT, the FER-LIKE IRON DEFICIENCY INDUCED TRANSCRIPTION FACTOR in Arabidopsis. Plant Physiol. Biochem. 2007, 45, 260–261. [Google Scholar] [CrossRef]
  37. Long, T.A.; Tsukagoshi, H.; Busch, W.; Lahner, B.; Salt, D.E.; Benfey, P.N. The bHLH transcription factor POPEYE regulates response to iron deficiency in Arabidopsis roots. Plant Cell 2010, 22, 2219–2236. [Google Scholar] [CrossRef]
  38. Akmakjian, G.Z.; Riaz, N.; Guerinot, M.L. Photoprotection during iron deficiency is mediated by the bHLH transcription factors PYE and ILR3. Proc. Natl. Acad. Sci. USA 2021, 118, e2024918118. [Google Scholar] [CrossRef]
  39. Li, Y.; Lu, C.K.; Li, C.Y.; Lei, R.H.; Pu, M.N.; Zhao, J.H.; Peng, F.; Ping, H.Q.; Wang, D.; Liang, G. IRON MAN interacts with BRUTUS to maintain iron homeostasis in Arabidopsis. Proc. Natl. Acad. Sci. USA 2021, 118, e2109063118. [Google Scholar] [CrossRef]
  40. Hindt, M.N.; Akmakjian, G.Z.; Pivarski, K.L.; Punshon, T.; Baxter, I.; Salt, D.E.; Guerinot, M.L. BRUTUS and its paralogs, BTS LIKE1 and BTS LIKE2, encode important negative regulators of the iron deficiency response in Arabidopsis thaliana. Metallomics 2017, 9, 876–890. [Google Scholar] [CrossRef]
  41. Rodriguez-Celma, J.; Chou, H.; Kobayashi, T.; Long, T.A.; Balk, J. Hemerythrin E3 Ubiquitin Ligases as Negative Regulators of Iron Homeostasis in Plants. Front. Plant Sci. 2019, 10, 98–105. [Google Scholar] [CrossRef] [PubMed]
  42. Yuan, Y.; Wu, H.; Wang, N.; Li, J.; Zhao, W.; Du, J.; Wang, D.; Ling, H.-Q. FIT interacts with AtbHLH38 and AtbHLH39 in regulating iron uptake gene expression for iron homeostasis in Arabidopsis. Cell Res. 2008, 18, 385–397. [Google Scholar] [CrossRef] [PubMed]
  43. Tanabe, N.; Noshi, M.; Mori, D.; Nozawa, K.; Tamoi, M.; Shigeoka, S. The basic helix-loop-helix transcription factor, bHLH11 functions in the iron-uptake system in Arabidopsis thaliana. J. Plant Res. 2019, 132, 93–105. [Google Scholar] [CrossRef] [PubMed]
  44. Li, Y.; Lei, R.; Pu, M.; Cai, Y.; Lu, C.; Li, Z.; Liang, G. bHLH11 inhibits bHLH IVc proteins by recruiting the TOPLESS/TOPLESS-RELATED corepressors. Plant Physiol. 2021, 188, 1335–1349. [Google Scholar] [CrossRef] [PubMed]
  45. Kim, S.A.; LaCroix, I.S.; Gerber, S.A.; Guerinot, M.L. The iron deficiency response in Arabidopsis thaliana requires the phosphorylated transcription factor URI. Proc. Natl. Acad. Sci. USA 2019, 116, 24933–24942. [Google Scholar] [CrossRef] [PubMed]
  46. Lei, R.; Li, Y.; Cai, Y.; Li, C.; Pu, M.; Lu, C.; Yang, Y.; Liang, G. bHLH121 Functions as a Direct Link that Facilitates the Activation of FIT by bHLH IVc Transcription Factors for Maintaining Fe Homeostasis in Arabidopsis. Mol. Plant 2020, 13, 634–649. [Google Scholar] [CrossRef] [PubMed]
  47. Gao, F.; Robe, K.; Bettembourg, M.; Navarro, N.; Rofidal, V.; Santoni, V.; Gaymard, F.; Vignols, F.; Roschzttardtz, H.; Izquierdo, E.; et al. The Transcription Factor bHLH121 Interacts with bHLH105 (ILR3) and Its Closest Homologs to Regulate Iron Homeostasis in Arabidopsis. Plant Cell 2020, 32, 508–524. [Google Scholar] [CrossRef]
  48. Sivitz, A.B.; Hermand, V.; Curie, C.; Vert, G. Arabidopsis bHLH100 and bHLH101 Control Iron Homeostasis via a FIT-Independent Pathway. PLoS ONE 2012, 7, e44843. [Google Scholar] [CrossRef]
  49. Gao, F.; Robe, K.; Dubos, C. Further insights into the role of bHLH121 in the regulation of iron homeostasis in Arabidopsis thaliana. Plant Signal. Behav. 2020, 15, 1795582. [Google Scholar] [CrossRef]
  50. Gao, F.; Dubos, C. Transcriptional integration of plant responses to iron availability. J. Exp. Bot. 2021, 72, 2056–2070. [Google Scholar] [CrossRef]
  51. Riaz, N.; Guerinot, M.L. All together now: Regulation of the iron deficiency response. J. Exp. Bot. 2021, 72, 2045–2055. [Google Scholar] [CrossRef] [PubMed]
  52. Guo, K.; Tu, L.; Wang, P.; Du, X.; Ye, S.; Luo, M.; Zhang, X. Ascorbate Alleviates Fe Deficiency-Induced Stress in Cotton (Gossypium hirsutum) by Modulating ABA Levels. Front. Plant Sci. 2016, 7, 1997. [Google Scholar] [CrossRef] [PubMed]
  53. Hamdani, S.; Wang, H.; Zheng, G.; Perveen, S.; Qu, M.; Khan, N.; Khan, N.; Khan, W.; Jiang, J.; Li, M.; et al. Genome-wide association study identifies variation of glucosidase being linked to natural variation of the maximal quantum yield of photosystem II. Plant Physiol. 2019, 166, 105–119. [Google Scholar] [CrossRef] [PubMed]
  54. Khan, N.; Essemine, J.; Hamdani, S.; Qu, M.N.; Lyu, M.J.A.; Perveen, S.; Stirbet, A.; Govindjee, G.; Zhu, X.G. Natural variation in the fast phase of chlorophyll a fluorescence induction curve (OJIP) in a global rice minicore panel. Photosynth Res. 2020, 150, 137–158. [Google Scholar] [CrossRef]
  55. Rodríguez-Celma, J.; Connorton, J.M.; Kruse, I.; Green, R.T.; Franceschetti, M.; Chen, Y.-T.; Cui, Y.; Ling, H.-Q.; Yeh, K.-C.; Balk, J. Arabidopsis BRUTUS-LIKE E3 ligases negatively regulate iron uptake by targeting transcription factor FIT for recycling. Proc. Natl. Acad. Sci. USA 2019, 116, 17584–17591. [Google Scholar] [CrossRef]
  56. Toledo-Ortiz, G.; Huq, E.; Quail, P.H. The Arabidopsis basic/helix-loop-helix transcription factor family. Plant Cell 2003, 15, 1749–1770. [Google Scholar] [CrossRef]
  57. Pires, N.; Dolan, L. Origin and diversification of basic-helix-loop-helix proteins in plants. Mol. Biol. Evol. 2010, 27, 862–874. [Google Scholar] [CrossRef]
  58. Irrcher, I.; Ljubicic, V.; Kirwan, A.F.; Hood, D.A. AMP-activated protein kinase-regulated activation of the PGC-1alpha promoter in skeletal muscle cells. PLoS ONE 2008, 3, e3614. [Google Scholar] [CrossRef]
  59. Nan, L.; Guo, Q.; Cao, S. Archaeal community diversity in different types of saline-alkali soil in arid regions of Northwest China. J. Biosci. Bioeng. 2020, 130, 382–389. [Google Scholar] [CrossRef]
  60. Ben-Shem, A.; Frolow, F.; Nelson, N. Crystal structure of plant photosystem I. Nature 2003, 426, 630–635. [Google Scholar] [CrossRef]
  61. Umena, Y.; Kawakami, K.; Shen, J.R.; Kamiya, N. Crystal structure of oxygen-evolving photosystem II at a resolution of 1.9 A. Nature 2011, 473, 55–60. [Google Scholar] [CrossRef] [PubMed]
  62. Terry, N. Limiting Factors in Photosynthesis: IV. Iron Stress-Mediated Changes in Light-Harvesting and Electron Transport Capacity and its Effects on Photosynthesis in Vivo. Plant Physiol. 1983, 71, 855–860. [Google Scholar] [CrossRef] [PubMed]
  63. Zhou, S.X.; Prentice, I.C.; Medlyn, B.E. Bridging Drought Experiment and Modeling: Representing the Differential Sensitivities of Leaf Gas Exchange to Drought. Front. Plant Sci. 2018, 9, 1965. [Google Scholar] [CrossRef] [PubMed]
  64. Bjorn, M.; Ruiz-Torres, N.A. Effects of Water-Deficit Stresson Photosynthesis, Its Components and Component Limitations, and on Water Use Efficiency in Wheat (Triticum aestivum L.). Plant Physiol. 1992, 100, 733–739. [Google Scholar]
  65. Blatt, M.R.; Jezek, M.; Lew, V.L.; Hills, A. What can mechanistic models tell us about guard cells, photosynthesis, and water use efficiency? Trends Plant Sci. 2022, 27, 166–179. [Google Scholar] [CrossRef]
  66. Singh, A.K.; McIntyre, L.M.; Sherman, L.A. Microarray analysis of the genome-wide response to iron deficiency and iron reconstitution in the cyanobacterium Synechocystis sp. PCC 6803. Plant Physiol. 2003, 132, 1825–1839. [Google Scholar] [CrossRef]
  67. Strzepek, R.F.; Boyd, P.W.; Sunda, W.G. Photosynthetic adaptation to low iron, light, and temperature in Southern Ocean phytoplankton. Proc. Natl. Acad. Sci. USA 2019, 116, 4388–4393. [Google Scholar] [CrossRef]
  68. Larbi, A.; Abadia, A.; Morales, F.; Abadia, J. Fe Resupply to Fe-deficient Sugar Beet Plants Leads to Rapid Changes in the Violaxanthin Cycle and other Photosynthetic Characteristics without Significant de novo Chlorophyll Synthesis. Photosynth. Res. 2004, 79, 59–69. [Google Scholar] [CrossRef]
  69. Chen, W.; Zhao, L.; Liu, L.; Li, X.; Li, Y.; Liang, G.; Wang, H.; Yu, D. Iron deficiency-induced transcription factors bHLH38/100/101 negatively modulate flowering time in Arabidopsis thaliana. Plant Sci. 2021, 308, 110929. [Google Scholar] [CrossRef]
  70. Li, X.; Zhang, H.; Ai, Q.; Liang, G.; Yu, D. Two bHLH Transcription Factors, bHLH34 and bHLH104, Regulate Iron Homeostasis in Arabidopsis thaliana. Plant Physiol. 2016, 170, 2478–2493. [Google Scholar] [CrossRef]
  71. Liang, G.; Zhang, H.; Li, X.; Ai, Q.; Yu, D. bHLH transcription factor bHLH115 regulates iron homeostasis in Arabidopsis thaliana. J. Exp. Bot. 2017, 68, 1743–1755. [Google Scholar] [CrossRef] [PubMed]
  72. Gao, X.; Wheeler, T.; Li, Z.; Kenerley, C.M.; He, P.; Shan, L. Silencing GhNDR1 and GhMKK2 compromises cotton resistance to Verticillium wilt. Plant J. 2011, 66, 293–305. [Google Scholar] [CrossRef] [PubMed]
  73. Tamura, K.; Peterson, D.; Peterson, N.; Stecher, G.; Nei, M.; Kumar, S. MEGA5: Molecular evolutionary genetics analysis using maximum likelihood, evolutionary distance, and maximum parsimony methods. Mol. Biol. Evol. 2011, 28, 2731–2739. [Google Scholar] [CrossRef] [PubMed]
  74. Yi, Y.; Guerinot, M.L. Genetic evidence that induction of root Fe(III) chelate reductase activity is necessary for iron uptake under iron deficiency. Plant J. 1996, 10, 835–844. [Google Scholar] [CrossRef]
  75. Lichtenthaler, H.K. Chlorophylls and carotenoids, the pigments of photosynthetic biomembranes. Methods Enzymol. 1987, 148, 350–382. [Google Scholar]
  76. Qin, Z.; Bai, Y.; Muhammad, S.; Wu, X.; Deng, P.; Wu, J.; An, H.; Wu, L. Divergent roles of FT-like 9 in flowering transition under different day lengths in Brachypodium distachyon. Nat. Commun. 2019, 10, 812. [Google Scholar] [CrossRef]
  77. Cui, Y.; Chen, C.; Cui, M.; Zhou, W.; Wu, H.; Ling, H. Four IVa bHLH Transcription Factors Are Novel Interactors of FIT and Mediate JA Inhibition of Iron Uptake in Arabidopsis. Molecular Plant. 2018, 11, 1166–1183. [Google Scholar] [CrossRef]
  78. Tissot, N.; Robe, K.; Gao, F.; Grant-Grant, S.; Boucherez, J.; Bellegarde, F.; Maghiaoui, A.; Marcelin, R.; Izquierdo, E.; Benhamed, M.; et al. Transcriptional integration of the responses to iron availability in Arabidopsis by the bHLH factor ILR3. New Phytol. 2019, 223, 1433–1446. [Google Scholar] [CrossRef]
Figure 1. Iron deficiency induces differential expression of cotton iron deficiency regulatory genes, resulting in iron deficiency phenotypes. (A) Schematic diagram of cotton seedling growing on normal (left) and saline–alkali (pH > 8.2, right) soil. Iron exists in form of soluble iron under normal soil conditions, which can be absorbed by plants, while in saline–alkali soil, iron mainly exists as insoluble iron, which leads to cotton suffering from iron deficiency stress, noted as chlorosis of cotton leaves. (B) Representative images of the phenotypes of cotton seedlings grown for two weeks under +Fe (1/2 Hoagland nutrient solution) or −Fe (1/2 Hoagland nutrient solution without Fe) conditions. Statistics were determined from three biological replicates, and each experiment contained ten seedlings. Scale bar = 5 cm. (CG) Histograms of chlorophyll content (C), leaf biomass (D), Fe content (E), ferric chelate reductase activity (FCR) (F), and net photosynthesis rate (G) in cotton seedling leaves. Seedlings were grown for two weeks in +Fe or −Fe conditions. (H) Expression of marker genes of the cotton iron deficiency regulatory genes. Relative expression was determined by qRT-PCR of genes in cotton seedling leaves. Seedlings were the same plants as in (CG). The regulatory relationship between genes refers to the regulatory network of Arabidopsis and does not mean its presence in cotton. Values represent means ± SD of three biological replicates. Significant differences were determined by Student’s t-test, ** p < 0.01.
Plants 12 01955 g001
Figure 2. GhbHLH121 encodes a transcription factor involved in the regulation of response of iron deficiency that is expressed in cotton root and shoot tissues. (A) Heat map of GhbHLH121 expression in different cotton tissues. The tissues used for expression profiling are indicate at the bottom and the genes on the left. The heatmap was constructed using TBtools. The color of each box represents the transcription level of the gene. The values are presented using the relative expression change after row normalization. (B) Histogram of GhbHLH121 expression as determined by qPCR in different cotton seedling tissues. (C,D) Histogram of GhbHLH121 expression as determined by qPCR in the leaf (C) and root (D) of cotton seedlings grown for two weeks in +Fe or −Fe solution. (E) Subcellular localization of GhbHLH121-AT and GhbHLH121-DT. Each experiment utilized three biological replicates. Scale bar = 20 µm. Values represent means ± SD of three biological replicates. Significant differences were determined by Student’s t-test, ** p < 0.01.
Plants 12 01955 g002
Figure 3. TRV2:GhbHLH121 seedlings exhibit reduced tolerance to iron deficiency. (A) Representative images showing the phenotypes of TRV2:00 and the TRV2:GhbHLH121 seedlings grown for three weeks in +Fe or −Fe solution. (A) The last leaves of seedlings from TRV2:00 and the TRV2:GhbHLH121 seedlings. Statistics were determined from three biological replicates, and each experiment contained ten seedlings. Scale bar = 5 cm. (B) Expression of GhbHLH121 in TRV2:00 and the TRV2:GhbHLH121 seedlings in +Fe or −Fe solution. Expression was determined by qPCR using RNA from leaf of (A). (CG) Histograms of chlorophyll content (C), FCR activity (D), net photosynthesis rate (E), leaf biomass (F), and Fe content (G) in seedlings from (A). Photo: net photosynthesis rate. Relative expression was determined by qRT-PCR in cotton leaves. Values represent means ± SD of three biological replicates. Significant differences were determined by Student’s t-test, * p < 0.05, ** p < 0.01.
Plants 12 01955 g003
Figure 4. Suppression of GhbHLH121 increases cell ultrastructure damage due to iron deficiency in the leaves of cotton seedlings. Representative images of cell ultrastructures such as chloroplast (A), mitochondrial (B), and nucleus (C) examined with TEM in leaf cell cross-sections from the VIGS cotton seedlings assay of Figure 3. C: chloroplasts; SG: starch grains; PG: plastoglobules; MC: mitochondria; CW: cell wall; PM: plasma membrane; NM: cell nuclear membrane. Red arrows = stacked thylakoids in grana. White arrows = plastoglobules. Red line = the position of the enlarged cell membrane on the nucleus. Scale bar = 0.5 µm.
Plants 12 01955 g004
Figure 5. Ectopic expression of GhbHLH121 in Arabidopsis seedlings conferred enhanced tolerance to iron deficiency. (A) Representative images of Arabidopsis thaliana wild type (WT) and GhbHLH121-OE seedlings grown for 7 days under +Fe (1/2 MS with Fe2+) or −Fe (1/2 MS without Fe2+) conditions. Statistics were determined from three biological replicates, and each experiment contained 15 seedlings. Scale bar = 1 cm. (BE) Histogram of GhbHLH121 expression (B), root length (C), FCR (D), and Fe content (E) in seedlings from (A). Relative expression was determined by qRT-PCR. Values represent means ± SD of three biological replicates. Significant differences were determined by Student’s t-test, ** p < 0.01.
Plants 12 01955 g005
Figure 6. GhbHLH121 can interact with GhbHLH IVc family proteins and GhPYE. (A) Yeast two-hybrid assays. GhbHLH104, GhbHLH115, and GhPYE were fused with the GAL4 activation domain (AD) as prey, and GhbHLH121 with the GAL4 DNA binding domain (BD) as bait. Interaction was indicated by the ability of cells to grow on synthetic dropout (SD) medium lacking T/L/H. T, tryptophan; L, leucine; H, histidine. (B) Luciferase Complementation Imaging Assay (LCI) assays. GhbHLH104, GhbHLH115, and GhPYE were fused with the N-terminus of LUC (LUC-N) and GhbHLH121 with the C-terminus (LUC-C), then transferred into N. benthamiana leaves. The positive controls were FTL9 and FD1. (C,D) Bimolecular fluorescence complementation (BiFC) assays. GhbHLH104, GhbHLH115, and GhPYE were fused with the N-terminus of YFP (YNE) and GhbHLH121 with the C-terminus of YFP (YCE), then transferred into N. benthamiana leaves and visualized by confocal microscopy. B. F.: bright field. M: merge. Scale bar = 20 µm.
Plants 12 01955 g006
Figure 7. GhbHLH121 directly activates the transcription of GhbHLH38, GhFIT, and GhPYE independent of GhbHLH104 and GhbHLH115. (A) Schematic diagrams showing the promoter structures of GhbHLH38, GhFIT, and GhPYE. Blue boxes indicate E-box motifs. (B) Image of yeast one-hybrid assays. Each experiment utilized three biological replicates. (C) Schematic diagram of the constructs used in the transient expression assay in (D). GhbHLH38, GhFIT, and GhPYE promoters were fused with pGreen 0800LUC as reporters, and GhbHLH121 with pGreen II 62SK as the effector. (D) Photo of luciferase imaging in N. benthamiana leaves with different combinations of the effector and reporters. Each experiment utilized three biological replicates. (E) Histogram of relative reporter activity (LUC/REN) in N. benthamiana leaves expressing the indicated reporters and effectors, detailed in (D). The LUC/REN ratio represents LUC activity relative to that of the internal control (REN driven by the 35S promoter). (F) Schematic diagram of the constructs used in the transient expression assay in (G). The GhbHLH121 promoter was fused with pGreen0800LUC as the reporter, and GhbHLH104 and GhbHLH115 with pGreen II 62SK as effectors. (G) Photo of luciferase imaging in N. benthamiana leaves with different combinations of effectors and the reporter. Each experiment utilized three biological replicates. (H) Histogram of relative reporter activity (LUC/REN) in N. benthamiana leaves expressing the indicated reporters and effectors, detailed in (G). Values represent means ± SD of three biological replicates. Significant differences were determined by Student’s t-test, ** p < 0.01, ns = no significance.
Plants 12 01955 g007
Figure 8. A working model illustrating the roles of GhbHLH121 in response to iron deficiency in cotton. When cotton is subjected to iron deficiency, expression of GhbHLH121 is increased, though GhbHLH104 and GhbHLH115 do not activate its transcription. GhbHLH121 forms a heterodimer with GhbHLH104 or GhbHLH115, but can activate the expression of GhbHLH38, GhFIT, and GhPYE independent of them.
Plants 12 01955 g008
Table 1. Differential expression of Fe deficiency-responsive genes in TRV2:00 and the TRV2:GhbHLH121 seedlings in +Fe or −Fe solution. The relative gene expression levels measured by qPCR in leaves of the TRV2:00 and the TRV2:GhbHLH121 seedlings in +Fe or −Fe solution. The expression of GhHistone3 was used to normalize mRNA levels, and the gene expression level in the TRV2:00 under Fe-sufficient conditions was set to 1. Values represent means ± SD of three biological replicates. Significant differences from the corresponding wild type are indicated by an asterisk (* p < 0.05, ** p < 0.01), as determined by Student’s t-test.
Genes TRV2:GhbHLH121 +FeTRV2:00 -FeTRV2:GhbHLH121 -Fe
Subgroup bHLH IVc genes
GhbHLH104-A101.07 ± 0.24 2.46 ± 0.342.54 ± 0.32
GhbHLH104-D100.84 ± 0.192.29 ± 0.51 2.18 ± 0.30
GhbHLH115 A011.01 ± 0.21 2.36 ± 0.33 2.34 ± 0.31
GhbHLH115 D010.95 ± 0.15 1.25 ± 0.12 1.12 ± 0.16
GhbHLH115 A01-20.82 ± 0.110.78 ± 0.110.83 ± 0.10
GhbHLH115 D01-20.97 ± 0.11 0.90 ± 0.130.85 ± 0.12
GhbHLH115 A051.18 ± 0.17 1.28 ± 0.151.33 ± 0.17
GhbHLH115 D050.93 ± 0.14 1.10 ± 0.121.06 ± 0.14
GhbHLH115 A110.87 ± 0.12 0.84 ± 0.110.94 ± 0.11
GhbHLH115 D110.99 ± 0.13 0.94 ± 0.130.98 ± 0.12
GhbHLH115 A131.14 ± 0.12 1.01 ± 0.150.94 ± 0.13
GhbHLH115 D130.93 ± 0.12 0.97 ± 0.120.95 ± 0.13
Subgroup bHLH Ib genes
GhbHLH101 A110.94 ± 0.12 1.01 ± 0.120.92 ± 0.13
GhbHLH101 D110.91 ± 0.13 1.07 ± 0.121.01 ± 0.14
GhbHLH101 D11-20.90 ± 0.16 1.15 ± 0.121.23 ± 0.15
GhbHLH38 A050.89 ± 0.23 58.80 ± 9.1133.86 ± 7.88 **
GhbHLH38 D050.80 ± 0.07 **133.96 ± 17.1053.94 ± 11.95 **
GhbHLH38 A090.85 ± 0.20 57.27 ± 6.1132.40 ± 5.67 **
GhbHLH38 D090.92 ± 0.14 72.90 ± 8.1265.44 ± 5.76 *
Fe uptake genes
GhFIT A050.48 ± 0.03 **5.61 ± 0.060.87 ± 0.15 **
GhFIT D050.31 ± 0.01 **15.61 ± 0.147.58 ± 1.09 **
GhFIT A090.63 ± 0.03 **1.75 ± 0.181.03 ± 0.13 **
GhFIT D090.71 ± 0.10 **1.97 ± 0.151.11 ± 0.20 *
GhFRO20.95 ± 0.14 8.68 ± 1.224.08 ± 0.56 **
GhIRT31.07 ± 0.01 5.60 ± 1.142.34 ± 0.35 **
GhAHA21.03 ± 0.04 4.69 ± 1.133.06 ± 0.62 **
Fe translocation genes
GhPYE1.05 ± 0.02 102.42 ± 12.07 73.34 ± 13.72 *
GhYSL11.14 ± 0.09 0.42 ± 0.11 0.31 ± 0.05 *
GhNAS40.88 ± 0.17 15.80 ± 0.21 5.00 ± 1.11 **
GhAtZIF10.93 ± 0.08 4.15 ± 0.17 4.34 ± 0.55
GhFRD31.00 ± 0.292.14 ± 0.43 2.22 ± 0.28
Fe homeostasis regulation genes
GhBTS A040.55 ± 0.12 **2.62 ± 0.27 0.91 ± 0.15 **
GhBTS A110.39 ± 0.04 **1.81 ± 0.35 1.09 ± 0.14 **
GhMYB72 A010.89 ± 0.13 3.52 ± 0.42 3.24 ± 0.47
GhMYB72 A080.99 ± 0.187.34 ± 0.33 5.84 ± 0.98 *
Table 2. Differential expression of Fe deficiency-responsive genes in WT and GhbHLH121-OE seedlings in +Fe or −Fe solution. The relative gene expression levels measured by qPCR in WT and GhbHLH121-OE seedlings grown for 7 days under +Fe or −Fe conditions. The expression of TUB2 was used to normalize mRNA levels, and the gene expression level in the wild type under Fe-sufficient conditions was set to 1. Values represent means ± SD of three biological replicates. Significant differences from the corresponding wild type are indicated by an asterisk (* p < 0.05, ** p < 0.01), as determined by Student’s t-test.
Genes GhbHLH121OE +FeWT -FeGhbHLH121OE -Fe
Subgroup bHLH IVc genes
AtbHLH341.34 ± 0.13 1.23 ± 0.17 1.53 ± 0.15
AtbHLH1040.87 ± 0.12 0.89 ± 0.11 1.01 ± 0.11
AtbHLH1051.02 ± 0.06 0.88 ± 0.12 1.29 ± 0.11
AtbHLH1151.08 ± 0.15 2.03 ± 0.13 2.01 ± 0.25
Subgroup bHLH Ib genes
AtbHLH384.46 ± 0.76 **490.66 ± 36.56 1980.02 ± 62.31 **
AtbHLH390.80 ± 0.13 15.13 ± 3.10 40.96 ± 3.92 **
AtbHLH1004.40 ± 0.52 **295.60 ± 34.55 2234.81 ± 37.54 **
AtbHLH1012.81 ± 0.32 **19.59 ± 2.35 57.68 ± 8.48 **
Fe uptake genes
AtFIT2.01 ± 0.37 **5.62 ± 0.25 10.84 ± 0.71 **
AtFRO22.70 ± 0.05 **27.32 ± 0.34 39.78 ± 3.47 **
AtIRTl4.44 ± 0.30 **133.25 ± 11.56 230.75 ± 16.92 **
AtIAHA21.03 ± 0.17 2.68 ± 0.13 6.08 ± 0.34 **
Fe translocation genes
AtPYE1.64 ± 0.23 3.02 ± 0.20 9.69 ± 0.38 **
AtYSL10.96 ± 0.04 0.37 ± 0.12 0.37 ± 0.04
AtNAS42.34 ± 0.04 **7.72 ± 0.29 14.56 ± 0.98 **
AtZIF11.53 ± 0.17 *1.82 ± 0.19 2.92 ± 0.23 **
AtFRD30.81 ± 0.13 0.62 ± 0.10 1.05 ± 0.07**
Fe homeostasis regulation genes
AtBTS1.72 ± 0.15 **1.54 ± 0.21 5.96 ± 0.19 **
AtMYB100.98 ± 0.19 6.73 ± 0.12 36.19 ± 0.85 **
Disclaimer/Publisher’s Note: The statements, opinions and data contained in all publications are solely those of the individual author(s) and contributor(s) and not of MDPI and/or the editor(s). MDPI and/or the editor(s) disclaim responsibility for any injury to people or property resulting from any ideas, methods, instructions or products referred to in the content.