Article

Application of SVR-Mediated GWAS for Identification of Durable Genetic Regions Associated with Soybean Seed Quality Traits

1
Department of Plant Agriculture, University of Guelph, Guelph, ON N1G 2W1, Canada
2
Department of Animal Biosciences, University of Guelph, Guelph, ON N1G 2W1, Canada
*
Author to whom correspondence should be addressed.
Plants 2023, 12(14), 2659; https://doi.org/10.3390/plants12142659
Submission received: 12 May 2023 / Revised: 12 July 2023 / Accepted: 14 July 2023 / Published: 16 July 2023

Abstract

:
Soybean (Glycine max L.) is an important food-grade strategic crop worldwide because of its high seed protein and oil contents. Due to the negative correlation between seed protein and oil percentage, there is a dire need to detect reliable quantitative trait loci (QTL) underlying these traits in order to be used in marker-assisted selection (MAS) programs. Genome-wide association study (GWAS) is one of the most common genetic approaches that is regularly used for detecting QTL associated with quantitative traits. However, the current approaches are mainly focused on estimating the main effects of QTL, and, therefore, a substantial statistical improvement in GWAS is required to detect associated QTL considering their interactions with other QTL as well. This study aimed to compare the support vector regression (SVR) algorithm as a common machine learning method to fixed and random model circulating probability unification (FarmCPU), a common conventional GWAS method in detecting relevant QTL associated with soybean seed quality traits such as protein, oil, and 100-seed weight using 227 soybean genotypes. The results showed a significant negative correlation between soybean seed protein and oil concentrations, with heritability values of 0.69 and 0.67, respectively. In addition, SVR-mediated GWAS was able to identify more relevant QTL underlying the target traits than the FarmCPU method. Our findings demonstrate the potential use of machine learning algorithms in GWAS to detect durable QTL associated with soybean seed quality traits suitable for genomic-based breeding approaches. This study provides new insights into improving the accuracy and efficiency of GWAS and highlights the significance of using advanced computational methods in crop breeding research.

1. Introduction

Soybean is one of the most important dual-use leguminous crops and is the main source of protein (~40%) and oil (~20%) for food [1]. Soybean is also an important source of healthy plant-based food products in the human diet due mainly to its nutritional and pharmaceutical properties [2]. Developing soybean cultivars with high oil and protein concentrations has always been one of the major goals of soybean breeding programs [3]. However, these two traits are quantitative traits that are controlled by many minor and major genes and are highly affected by environments [4,5]. Previous studies verified the strong negative correlation between soybean oil and protein and recommended identifying quantitative trait loci (QTL) that might inversely affect those traits [6,7]. Therefore, a deep understanding of the genetic structure of soybean oil and protein concentration would be pivotal in designing efficient molecular breeding approaches [8,9].
Current remarkable progress in high throughput genotyping techniques has provided breeders and geneticists with a unique opportunity to have access to thousands of single nucleotide polymorphisms (SNPs) in a time and cost-effective manner [10,11]. One of the most recommended genetic tools that has been frequently used by breeders and geneticists to detect marker-trait associations (MTAs) for the trait of interest is the genome-wide association study (GWAS) [12,13]. In the last ten years, a variety of statistical methods have been created and applied to speed up computational analyses, enhance the accuracy and statistical powers in GWAS by testing multiple hypotheses across an entire genome [14]. Two of the commonly used GWAS methods are the mixed linear model (MLM) and fixed and random model circulating probability unification (FarmCPU) [14,15]. In addition, several techniques have been suggested to determine genome-wide significance levels and thresholds, such as the Bonferroni correction and false discovery rate (FDR), in order to decrease the occurrence of erroneous discoveries [15,16]. The application of GWAS was widely studied in different plant species, such as wheat [17], maize [18], soybean [19], and sorghum [20], and the primary objective of all these studies was to accelerate the breeding processes through using GWAS-derived molecular markers for the indirect selection of superior genotypes with improved phenotypic values. However, these studies demonstrated that the effectiveness of GWAS in identifying genetic markers linked to quantitative traits depended on the careful selection of GWAS methods and precise experimental conditions [21].
With the availability of affordable next-generation technologies, researchers are now able to capture much of the genetic variation in a given genome and generate large numbers of genomic sequences and genetic properties even in large plant populations [22,23]. The abundance of plant genetic sequences can be categorized as big data due to their compliance with the three Vs, which are volume, velocity, and variety [24,25]. Efficient analysis of large datasets significantly depends upon multiple processes involved in data collection, data processing, and different management challenges identified in the context of big data [26,27]. Therefore, dealing with big datasets, such as high-density SNPs in GWAS, requires intensive computation and the use of modern statistical approaches, such as artificial intelligence (AI) algorithms [28]. Machine learning (ML) is a subset of AI that can be defined as the development of mathematical models that can learn, educate, and make decisions using available datasets [29,30]. The application of ML algorithms can be considered as an alternative approach to current conventional statistical procedures for analyzing SNP markers in a data-driven manner. One of the important ML algorithms is support vector machines (SVM), developed by Vapnik [31], which is based on finding the optimum hyperplane in the number of variables that classify data points within a dataset [32]. Support vector regression (SVR) as a subset of SVM is widely used to solve regression problems [32]. The successful use of the SVR method was reported in phenomics [33], genomics [34], plant tissue culture [35,36], and metabolomics [37]. The use of SVR in GWAS was introduced by de Oliveira et al. [38] in animal science. They tested the efficiency of SVR-mediated GWAS for selecting the most relevant MTAs using the Pearson universal kernel as a fitness function [38]. However, the use of the SVR-mediated GWAS is less studied in plant areas and requires more investigations.
This study aimed to (1) investigate the genetic structure of soybean seed composition traits; (2) conduct a comparative analysis between FarmCPU, a well-known conventional GWAS method, and SVR-mediated GWAS for detecting genomic regions associated with soybean seed composition traits; and (3) identify genes and QTL co-localized with the detected MTAs for soybean seed composition traits. The identified MTAs in this study can be used in different soybean breeding programs for selecting value-added genotypes through the simultaneous selection of all the target seed quality traits at early growth stages.

2. Results

2.1. Phenotyping Evaluation
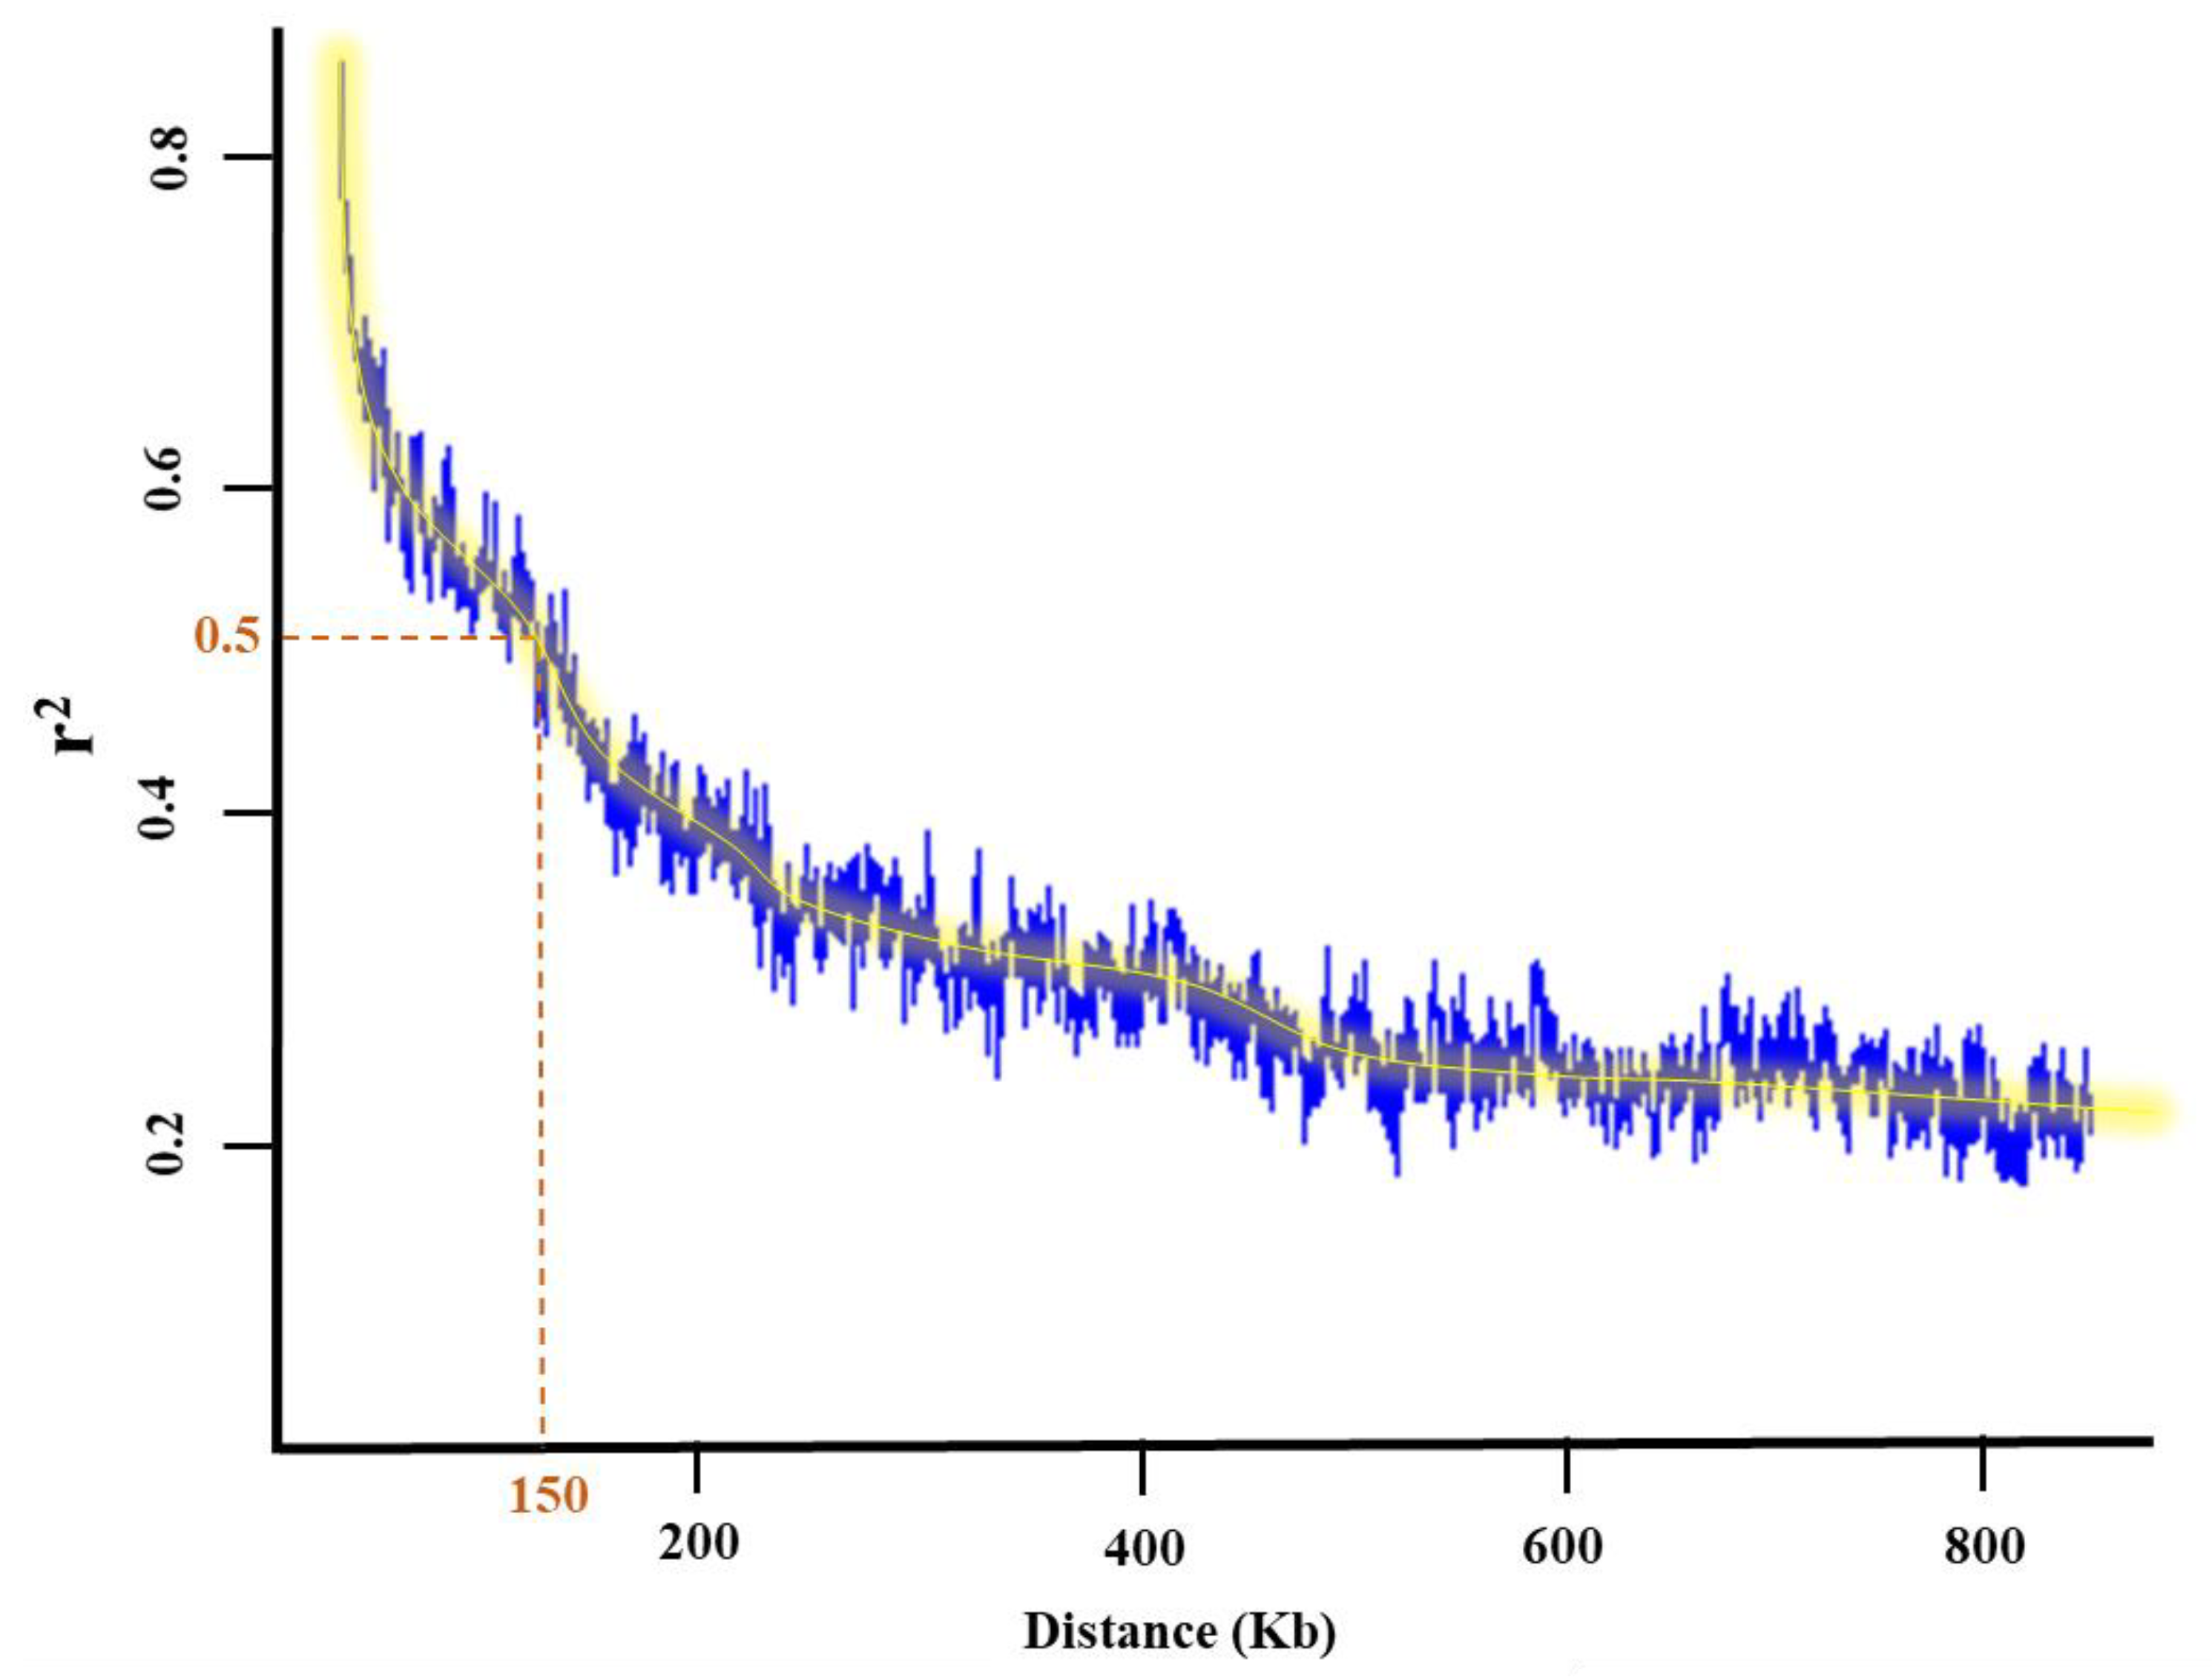
The phenotypic evaluations and collecting process of the soybean yield for the tested panel are explained in detail in [21]. After adjusting the phenotypic plots for each genotype based on spatial analysis, the tested GWAS panel showed significant variations for seed protein, oil, and 100-seed weight across four tested environments (Figure 1A–C). The 100-seed weight had the highest spatial variation in the field, followed by seed protein and seed oil (Figure 1C). The maximum and minimum values for 100-seed weight were 36.49 g and 7.61 g, respectively, with an average of 18.68 g. Seed protein had an average of 39.90% in the tested GWAS panel with maximum and minimum values of 48.77% and 14.51%, respectively. Soybean seed oil also had the maximum and minimum values of 23.37% and 16.61% in the tested GWAS panel, respectively, with an average of 20.03%. Among all the tested traits, seed protein had the highest heritability, with an estimated value of 0.69, followed by seed oil and 100-seed weight with values of 0.67 and 0.60, respectively.
The linear correlation coefficients (r) estimated among yield and the target seed traits revealed a significant negative correlation (−0.67) between seed protein and oil concentrations (Figure 2). In addition, 100-seed weight was negatively correlated with seed oil, with a value of r = −0.33 (Figure 2). While seed yield had positive correlations with 100-seed weight (r = 0.69) and protein concentration (r = 0.15), it showed a negative correlation with oil concentration (r = −0.10). However, the correlations between seed yield and protein as well as seed yield and oil concentration were not significant (α = 0.05).

2.1.1. Genotyping

Out of 250 soybean genotypes, 23 of them were eliminated because of the high level of missing data, and a total of 17,958 high-quality SNPs were archived from a total of 40,712 SNPs from 227 soybean genotypes and mapped on 20 soybean chromosomes. For the tested association panel, pairwise linkage disequilibrium (LD) between SNPs was calculated based on the correlation coefficient (R2) of alleles using 17,958 high-quality SNPs. The minimum number of SNPs (403) was found on chromosome 11, and the maximum number of SNPs (1780) was found on chromosome 18. The average number of SNPs across all the 20 soybean chromosomes was 898, with a mean density of 0.12 cM for every single SNP across the genome.

2.1.2. Population Structure and Kinship

The genotypic evaluations conducted on the tested GWAS panel provided insights into the population structure, revealing the presence of multiple subpopulations. The results indicated the existence of four to seven distinct subpopulations within the panel. In order to further analyze and consider the population structure as one of the potential cofactors in GWAS analyses, a value of K = 7 was selected as the most appropriate parameter. The population structure analysis, represented in Figure 3, allows for a visual representation of the subpopulations and their distribution within the GWAS panel.

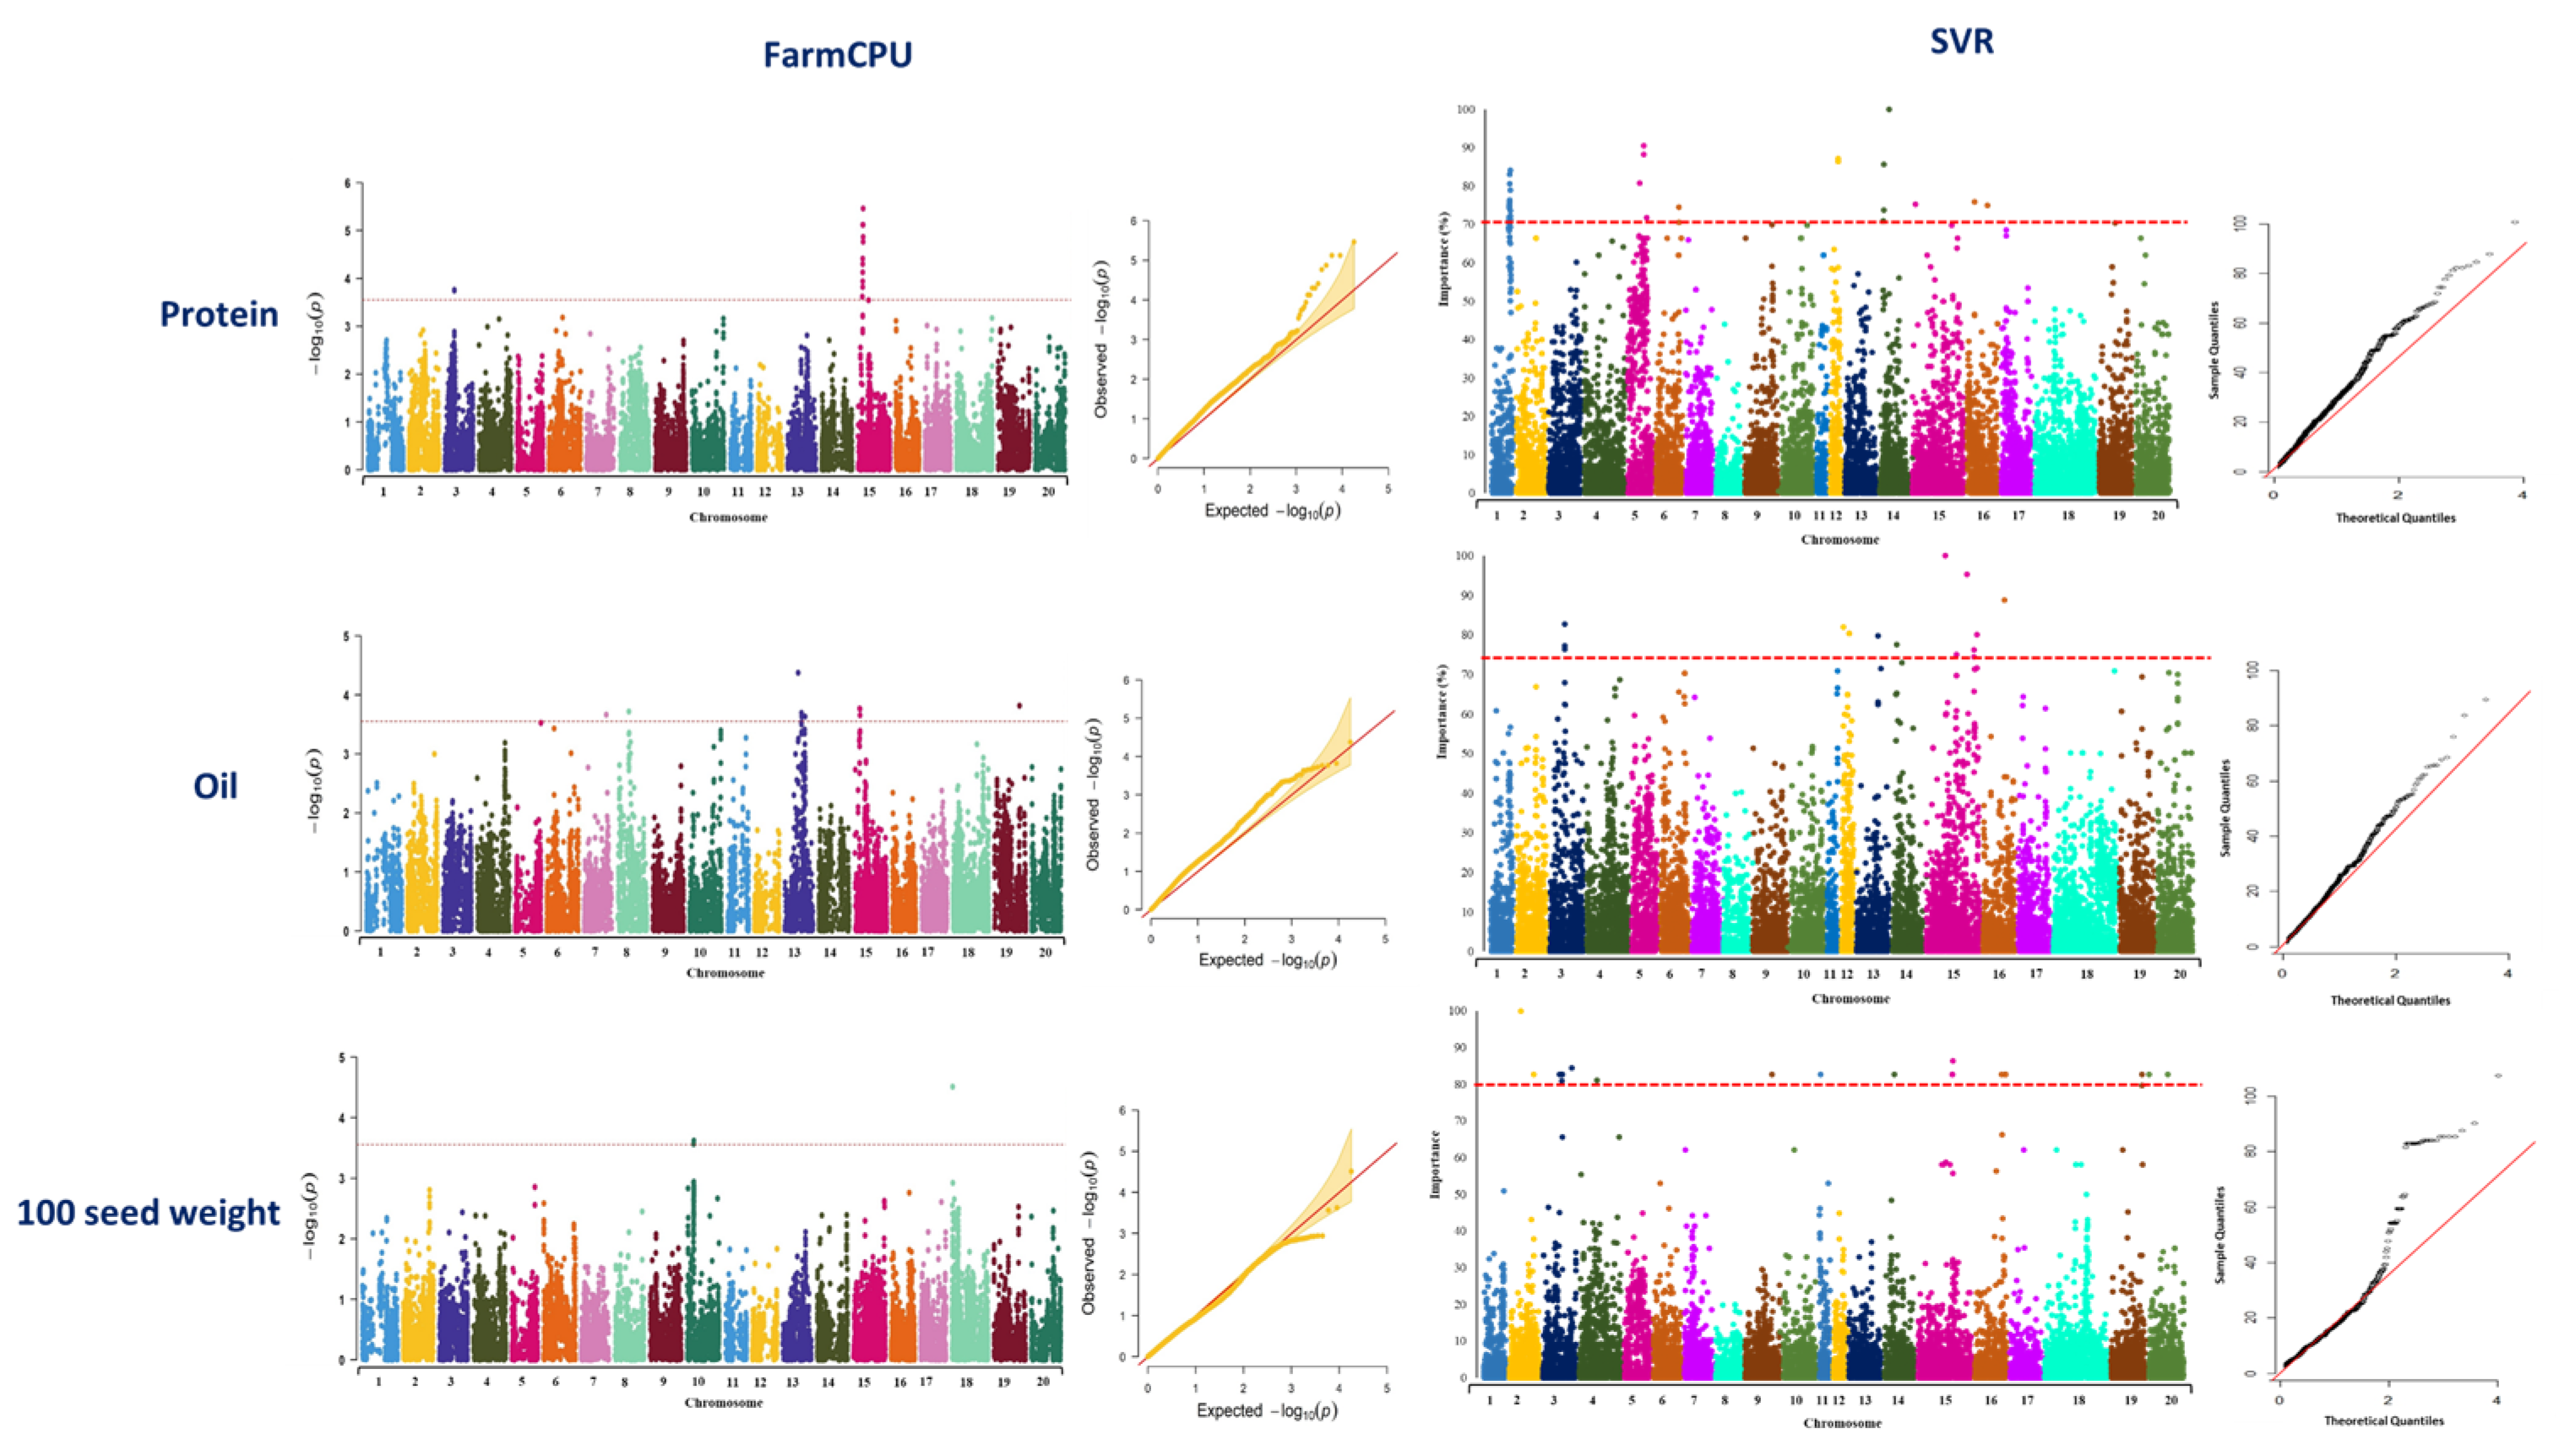
2.1.3. GWAS Analysis

GWAS analysis using the FarmCPU method identified 15 associated SNP markers for seed protein located on chromosomes 3 and 15 (Figure 4, Table S1). Using SVR-mediated GWAS, a total of 27 SNP markers located on chromosomes 1, 5, 6, 12, 14, 15, and 16 were identified to be associated with soybean protein (Figure 4, Table S2). Genomic regions of chromosome 15 were found to be associated with seed protein using both GWAS methods (Figure 4). In the FarmCPU method, the identified MTA on chromosome 15 was co-localized with previously reported QTL for seed protein (Table 1). In SVR-mediated GWAS, detected MTAs on chromosomes 5 and 16 were co-localized with previously reported QTL for seed protein (Table 1).
A total of 12 SNP markers located on chromosomes 7, 8, 13, 15, and 19 were identified to be associated with seed oil using FarmCPU (Figure 4, Table S3), while using SVR-mediated GWAS, 13 SNP markers located on chromosomes 3, 12, 13, 14, 15, and 16 were found to be associated with this trait (Figure 4, Table S4). Chromosome 15 was the only chromosome in which some of the MTAs were found associated with the trait using both GWAS methods (Figure 4). Most of the detected MTAs by SVR-mediated GWAS were co-localized with six previously reported oil-related QTL such as seed long-chain fatty acid and seed stearic (Table 2). However, most of the detected MTAs by FarmCPU were co-localized with QTL related to leaf carotenoid content, soybean cyst nematode, seed protein, water use efficiency, and soybean sudden death syndrome (Table 2).
For 100-seed weight, totals of 3 and 22 SNP markers were identified underlying the trait using FarmCPU and SVR-mediated GWAS methods, respectively (Figure 4). Detected SNP markers using FarmCPU were located on chromosomes 10 and 18 (Figure 4, Table S5), whereas identified SNP markers using SVR-mediated GWAS were located on chromosomes 2, 3, 4, 9, 11, 14, 15, 16, 19, and 20 (Figure 4, Table S6). Most of the detected MTAs using SVR-mediated GWAS were co-localized with previously reported QTL related to the first flower formation, number of nodes, plant height, soybean cyst nematode, water use efficiency, and maturity date (Table 3). Most of the detected MTAs using the FarmCPU method were co-localized with previously reported QTL related to soybean cyst nematode and water use efficiency (Table 3). Most of the detected chromosomes using SVR-mediated GWAS were similarly detected for yield in the previous study [58].

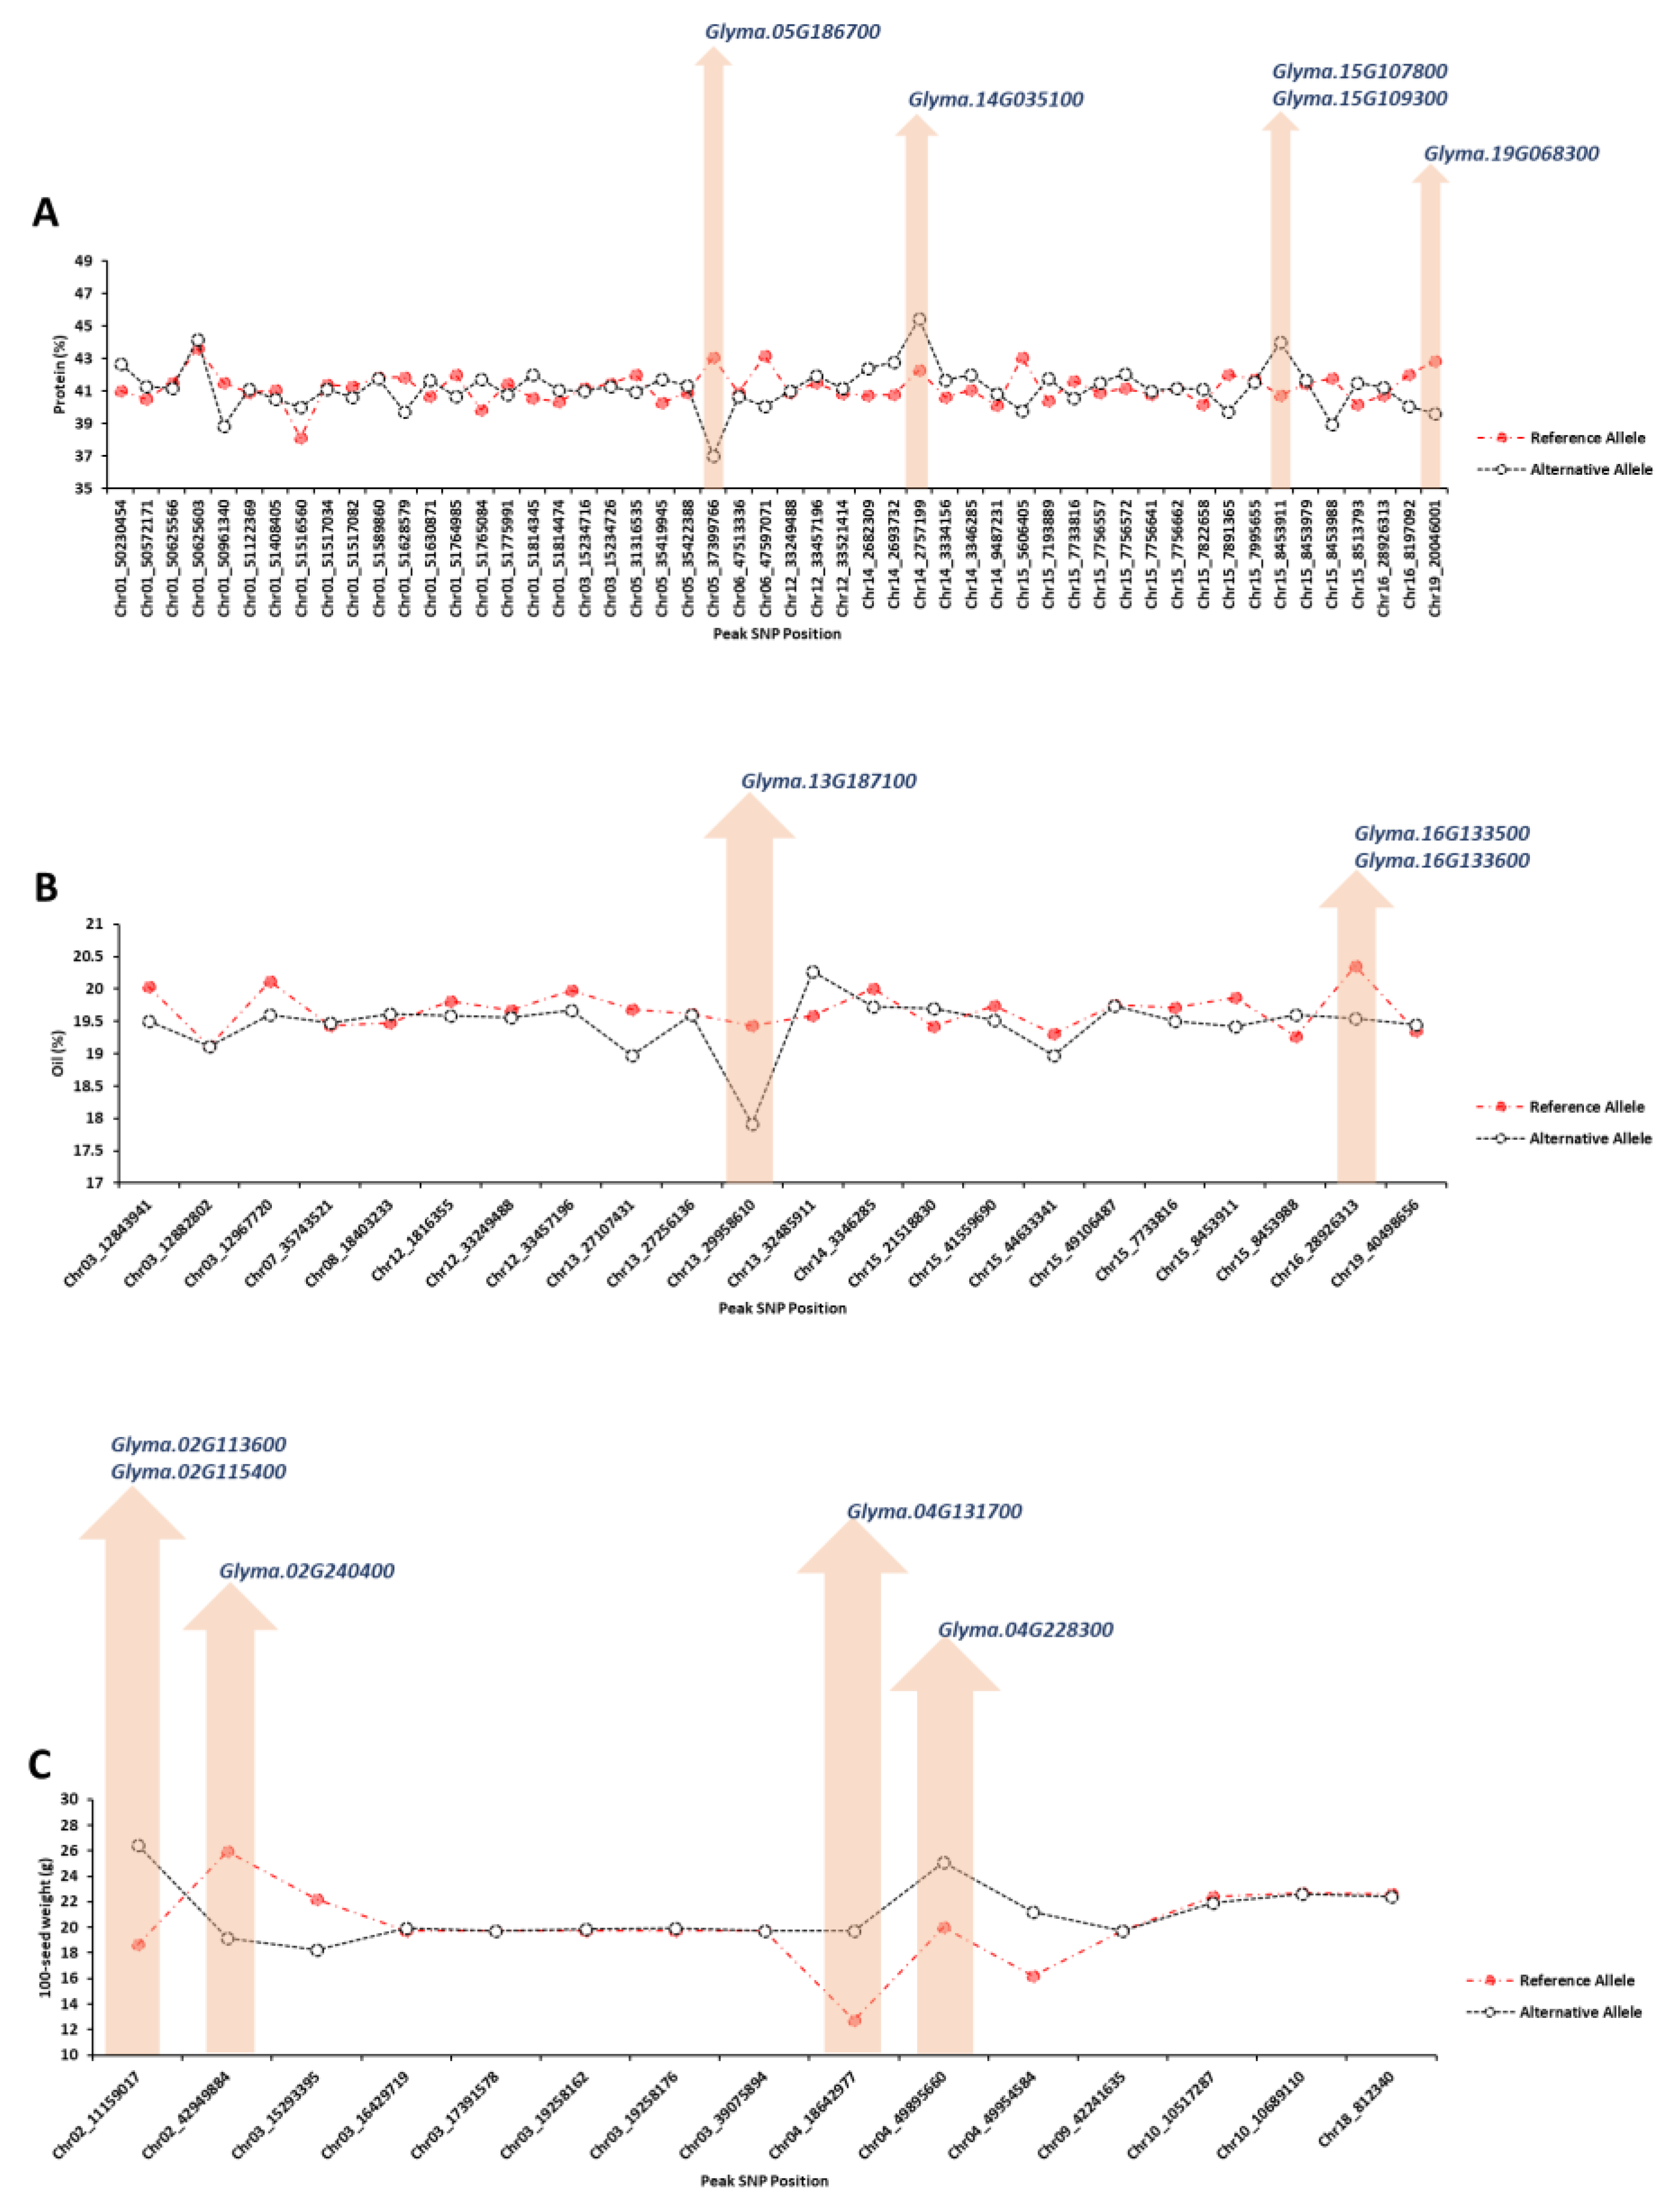
2.1.4. Extracting Candidate Genes Undelaying Detected QTLs

Considering the 150 kbp upstream and downstream flanking regions for each peak SNP with high allelic effect, the potential candidate genes were identified using gene annotation, previous studies, and enrichment tools. For seed protein concentration, four peak SNPs (Chr05_37399766, Chr14_2757199, Chr15_8453911, and Chr19_20046001) had the highest allelic effect compared to other identified peak SNPs (Figure 5A). Five candidate genes, Glyma.05G186700 (GO:0006865), Glyma.14G035100 (GO:0009888), Glyma.15G107800 (GO:0016926), Glyma.15G109300 (GO:0009658), and Glyma.19G068300 (GO:0010099), were detected as the strong candidate genes governing seed protein, which encode amino acid transport, tissue development, protein desumoylation, chloroplast organization, and regulation of photomorphogenesis, respectively (Figure 5). For soybean seed oil, two peak SNPs, Chr13_29958610 and Chr16_28926313, had the highest allelic effect compared to other detected peak SNPs (Figure 5B). Based on the gene annotation and expression within QTL, Glyma.13G187100 (GO:0008168), Glyma.16G133500 (GO:0009697), and Glyma.16G133600 (GO:0016887) were identified as the strong candidate genes underlying soybean seed oil, which encode methyltransferase activity, salicylic acid biosynthetic process, and ATPase activity, respectively (Figure 5B). The peak SNPs of Chr02_11159017, Chr02_42949884, Chr04_18642977, and Chr04_49895660 had the highest allelic effect for 100-seed weight among all the identified peak SNP (Figure 5C). The candidate genes of Glyma.02G113600 (GO:0042631), Glyma.02G115400 (GO:0006007), Glyma.02G240400 (GO:0005986), Glyma.04G131700 (GO:0010182), and Glyma.04G228300 (GO:0005982) were selected as the strong candidate genes associated with 100-seed weight, which encode cellular response to water deprivation, glucose catabolic process, sucrose biosynthetic process, sugar mediated signaling pathway, and starch metabolic process, respectively (Figure 5C).

3. Discussion

Improving soybean seed composition traits has been an important criterion in most soybean breeding programs [62]. It has been well documented that soybean seeds contain a significant percentage of protein among all other legumes, with a range of 35–40% depending on the growing conditions and used cultivars [63]. However, the major impediment of developing high-seed protein soybeans is the negative correlation between yield and seed oil concentration. The linear Pearson correlation between soybean seed protein and seed oil was estimated to be −0.67 in this study. Soybean seed compositions are derived from glycolysis intermediates, which fuel the biosynthesis of protein and oil [64]. Glycolysis is known as the most important metabolic pathway that provides free energy by converting glucose into pyruvic acid to form the reduced nicotinamide adenine dinucleotide (NADH) and adenosine triphosphate (ATP) [65,66]. NADH and ATP are finally used to supply the required acetyl-CoA available for oil and protein synthesis [67]. Several studies reported that the seed oil and protein are synthesized at the seed development stage, and there is significant competition between these two traits in receiving acetyl-CoA [64,68]. Although simultaneous improvement in soybean seed protein and oil is still an important challenge in cultivar development programs, better identification of associated molecular markers with seed protein and oil is pivotal to breaking the existed negative correlations between both traits to some extent [3].
GWAS is currently considered as the most common way to discover MTAs for complex traits of interest [58]. However, more and more research is required to investigate the transferability and reproducibility of GWAS results across different genetic backgrounds and environments [69]. Several studies have reported inconsistent QTL identified for quantitative traits in different genetic backgrounds and across different environments. More specifically, several QTL have been found and reported for soybean seed protein, oil, and 100-seed weight [3,70], whereas a limited number of the detected QTL are currently used for marker-assisted selection in plant breeding programs due mainly to their inconsistent effects on the traits [69]. In general, there are several gaps in the use of the conventional GWAS methods for detecting MTAs for complex traits [71]. One of the major challenges with conventional statistical procedures is the “large p, small n” problem, which occurs when these methods are applied to datasets in which the number of markers is larger than the number of genotypes [16,69]. It is widely acknowledged that conventional GWAS methods are in general powerful for detecting common SNPs with large main effects that reach the level of significance [28]. Therefore, current conventional GWAS approaches are underpowered for discovering SNPs with minor effects underlying a given trait [72]. This study confirmed the efficiency of using an SVR-mediated machine learning algorithm in GWAS to detect reliable SNP markers associated with soybean seed composition traits. The use of SVR was investigated in predicting soybean yield and fresh biomass [73], wheat resistance [74], and in vitro breeding base methods [75]. The effectiveness of SVR in detecting more relevant MTAs for a trait of interest was demonstrated by de Oliveira et al. [38]. They compared different kernel types in SVR with other GWAS methods for detecting associated SNPs using simulation and real data in milk-related traits in cattle. The results showed that SVR had high potential to select associated SNPs markers for a trait of interest [38].
There are probable reasons why SVR was able to better detect the genomic regions associated with a trait of interest than FarmCPU. One of the important reasons is the ability of SVR to estimate significance levels for identifying SNP–trait associations using variable importance methods instead of the statistical methods used in conventional GWAS [71]. Variable importance allows for the consideration of interaction effects between SNPs, which is advantageous in identifying associations for complex traits. Conventional GWAS methods are better at detecting SNPs with large main effects on traits but are not as effective in considering the complex biological processes that shape these traits [23]. Recent studies have shown that SNPs with high importance scores may not necessarily have significant p-values from single SNP analyses [71,76,77]. Therefore, using variable importance values in SVR can improve the power of GWAS in discovering variant–trait associations with higher resolution [13].
In this study, SVR-mediated GWAS detected MTAs that were co-localized with two QTL directly related to soybean seed protein [48,55]. Most of the detected QTL for seed protein were also detected in separate environments. By selecting an appropriate GWAS method, the rate of detecting unstable MTAs will decrease, which can pave the way for using more MTAs in the MAS breeding strategy [78,79]. For soybean oil, most of the co-localized QTL with detected MTAs using SVR-mediated GWAS were related to the seed long-chain fatty acids reported previously by Fang et al. [55]. Seed long-chain fatty acids commonly contain 18–20 carbons, which can be categorized into different families based on the position of their first double-bound methyl end groups [80]. Triacylglycerols (TAGs), as important components of seed oil, are mostly composed of long-chain fatty acids [81]. Recent studies revealed the TAG biosynthesis pathway in soybean seeds [67,82,83]. Therefore, regulating the long-chain fatty acids may affect the overall seed oil percentage. In soybean 100-seed weight, SVR-mediated GWAS could find different MTAs co-localized with previously reported QTL related to this trait. 100-seed weight can be affected by several intrinsic and extrinsic factors, such as abiotic and biotic stresses, the total number of nodes and pods, and nutrition uptake [84,85]. Therefore, many genomic regions were involved in determining the ultimate 100-seed weight [84]. This study found that SCN and WUE related QTL in 100-seed weight, which shows the importance of biotic and biotic stresses in shaping this trait. It can be hypothesized that by improving the resistance to abiotic and biotic stress in new genotypes, a significant improvement in 100- seed weight can be achieved.
Several candidate genes related to seed protein (Glyma.05G186700, Glyma.14G035100, Glyma.15G107800, Glyma.15G109300, and Glyma.19G068300) were detected via SVR-mediated GWAS, which seems to have a direct influence in seed protein concentration. As an example, Glyma.05G186700 encodes amino acid transport, which plays an important role in distributing essential nitrogen for plant growth and development [86]. Glyma.14G035100 encodes tissue development which depends on the nitrogen distribution as encoded by Glyma.05G186700. Glyma.15G107800 and Glyma.15G109300 were other candidate genes for seed protein, which encode protein desumoylation and chloroplast organization, respectively. Those genes play important roles in maintaining energy production sites for supplying the required energy for storing seed compositions [87,88]. Three candidate genes (Glyma.13G187100, Glyma.16G133500, and Glyma.16G133600) were found to be strong candidate genes for soybean seed oil. Glyma.13G187100 encodes methyltransferase activity, which plays a vital role in regulating tocopherols, an important component in the stability of soybean seed oil [89]. Another strong candidate gene for oil was Glyma.16G133500, which encodes salicylic acid biosynthetic process. Salicylic acid regulates the nitrate reductase activity in the plant, which plays an important role in increasing the protein and decreasing the oil percentages in seed [90,91]. Therefore, this gene may be useful in breaking the negative correlations between seed protein and oil percentage. From all the detected candidate genes for 100-seed weight, Glyma.02G113600, Glyma.02G115400, Glyma.02G240400, Glyma.04G131700, and Glyma.04G228300 were selected as the strong candidate genes governing the trait. The candidate genes seem to be involved in glucose metabolism, specifically sugar catabolic processes. The breakdown of sugars is essential for providing energy during seed maturation and development. This gene may play a role in regulating the balance between glucose and other sugar molecules in the seed, contributing to the overall 100-seed weight. During the soybean seed maturity stages, the glucose level decreases significantly, while the levels of sucrose, sugar, and starch increase in the full mature soybean seed yield [92]. Glyma.02G113600 encodes the glucose catabolic process responsible for breaking down the glucose to produce the primary sources of energy for the cellular production of ATP [93]. The produced ATP may be used in different biosynthesis (e.g., starch, sugar, and sucrose) and physiological processes [94,95].
Overall, the detected candidate genes for 100-seed weight are mostly involved in sugar, glucose, and starch metabolism. This suggests that the regulation of carbohydrate metabolism is crucial for determining seed size and weight. The breakdown of glucose and starch molecules provides the necessary energy and building blocks for seed development and growth. The balance between these different carbohydrate molecules is important for achieving optimal seed weight and size. Such information can be useful for soybean breeders to selectively breed for plants carrying favorable alleles of these candidate genes, resulting in soybean varieties with desired seed weight characteristics. Further research can be conducted to elucidate the precise roles of these genes in regulating carbohydrate metabolism and seed weight. This knowledge can contribute to a better understanding of plant physiology and can potentially be applied to other crops as well.

4. Materials and Methods

4.1. Plant Materials and Field Experiments

The GWAS panel, which consisted of 250 soybean genotypes, was grown in field conditions at the University of Guelph, Ridgetown campus in four environments (two locations × two years) in 2018–2019 at Ridgetown (42°27′14.8″ N 81°52′48.0″ W, 200 m above sea level) and Palmyra (42°25′50.1″ N 81°45′06.9″ W, 195 m above sea level), Ontario, Canada. The tested genotypes were derived from the core soybean germplasm, Ridgetown soybean breeding programs, that have been used for genetic studies and cultivar development activities. Field experiments were conducted using randomized complete block designs (RCBDs), with two replications in each tested environment. Each phenotypic plot consisted of five rows, which were 4.2 m long each, and the seeding rate was 50–57 seeds per m2. Nearest-neighbor analysis (NNA), as one of the well-known error control methods [96,97,98], was used to reduce the spatial variation and increase the accuracy of measured phenotypic data in each phenotypic plot.

4.2. Phenotypic Data and Analysis

Soybean seed yield (ton ha−1) was measured by harvesting three middle rows of each plot and adjusted based on days to maturity and 13% seed moisture. The total percentage of oil and protein in soybean seeds was measured via near-infrared reflectance (NIR) using a DA 7250 NIR analyzer (Perten Instruments Canada, Winnipeg, MB, Canada) on a dry weight basis. The used instrument was calibrated based on Perten Instruments [99,100]. Each NIR measurement was achieved by averaging three technical replicates. 100-seed weight was also measured based on adjusting to zero percent moisture (The raw phenotypic data is available at https://github.com/MohsenYN/Available-Datasets (accessed on 15 July 2023)). In order to estimate the average phenotype of the tested traits, the best linear unbiased prediction (BLUP) was used for each soybean genotype [101] using packages lme4 [102] and AllInOne Pre-processing [103] in R software version 4.1.1. The possible outliers were detected using the proposed protocol by Bowley [98] and treated as missing data points. Overall, the following statistical model was used in this study (Equation (1)):
Y = μ + A x + B z + C i + ε i j  
where Y stands for the trait of interest as a function of an intercept μ; μ is equal to the overall mean (fixed); x stands for the vector of block effects; z is the vector of the genotype effects (random), in which z ~ N(0, σ2G); i stands for the vector of random GxE interaction effects; and ε is equal to the vector of residuals, in which e ~ N(0, σ2E). A, B, and C represent the incidence matrices of x, z, and i effects, respectively.
In addition, the heritability (Equation (2)) of each tested trait was calculated based on the following equation:
H 2 = σ G 2 σ G 2 + σ E 2
where σ 2G is the genotypic variance and σ 2E stands for the environmental variance.

4.3. Genotyping

For extracting DNA, the collected trifoliate leaf tissues from the first rep of phenotyping plots at the Ridgetown location were freeze-dried for 72 h using a Savant ModulyoD Thermoquest (Savant Instruments, Holbrook, NY, USA). DNA of each soybean genotype was extracted using NucleoSpin Plant II kit (Macherey–Nagel, Düren, Germany), followed by a quality check through a Qubit® 2.0 fluorometer (Invitrogen, Carlsbad, CA, USA). The genotyping-by-sequencing (GBS) step was performed using ApeKI [104] as one of the most common enzymatic digestions for soybean genotypes. Achieved SNPs were called from a total of 210 M single-end Ion Torrent reads using the Fast GBS pipeline [105], considering Gmax_275_v2 as the reference genome. The filtering process for SNPs was assessed using the (1) Markov model, (2) minor allele frequency less than 0.05, and (3) removing SNPs with more than 50% heterozygosity.

4.4. Analysis of Population Structure

The population structure analysis for the tested 227 soybean genotypes was conducted from a total of 17,958 high-quality SNPs using fastSTRUCTURE [106]. For this aim, five runs were performed for the number of population (K) from 1 to 15, and the optimum number of populations was selected via the K tool in fastSTRUCTURE software. Additionally, kinship was estimated and considered between genotypes to reduce the confounding in the tested GWAS population.

4.5. Association Analysis

Different GWAS methods may provide different results based on the population diversity, number of SNPs, and statistical power linked with each method [107]. Therefore, two different GWAS methods were tested to investigate their efficiency in detecting the most relevant MTAs for traits of interest. FarmCPU, as the most common GWAS method, divides the multi-locus mixed model into a random effect model (REM) and a fixed-effect model (FEM), then employs them iteratively to achieve the best results in a given dataset [108]. For setting a threshold in the FarmCPU method, the FDR was used properly [109]. A, rMVP package [110] in R software version 3.6.1 was used for all FarmCPU analyses. In general, FEM and REM equations are as follows:
F E M ( Y i ) = C i 1 D 1 + C i 2 D 2 + C i 3 D 3 + + C i t D t + M i j K j + e i
R E M ( Y i ) = U i + e i
where Yi represents the observation on the ith sample; Ci1, Ci2, …, Cit is equal to the genotypes of the t pseudo-QTNs; D1, D2, D3, …, Dt stands for the corresponding effect for the pseudo-QTNs; Mij is equal to the genotype of the jth SNPs and ith sample; Kj stands for the corresponding effect of the jth SNPs; Ui is the total genetic effect of the ith sample; and ei is the residual.
SVR is based on creating a set of hyperplanes used in regression problems [32]. This algorithm was implemented in GWAS based on estimating the variable importance proposed by Weston et al. (2001) [111], where SNPs and traits of interest consider as input and output variables, respectively (Equation (5)):
Y = W β ( c ) + b
where Y stands for the output, W is the weight for each high-dimensional input variable ( β ) which is considered non-linearly on the input space of (c). The lower and upper borderlines are created as Y = W β ( c ) + b e and Y = W β ( c ) + b + e , respectively.
For SVR-mediated GWAS, the scaled method (0–100) was used for estimating the importance of each SNP associated with traits of interest. In order to implement the SVR method in GWAS, a five-fold cross-validation strategy with ten repetitions was applied to estimate the variable importance of each SNP [112]. Still, there is no confirmed way to set the significance threshold in the SVR-mediated GWAS. Therefore, the global empirical threshold [113,114] was used based on fitting the SVR algorithm, storing SNPs with the highest variable importance score, repeating the process 1000 times, and selecting the associated SNPs based on α = 0.5. SVR-mediated GWAS was conducted using the Caret package [115] in R software version 3.6.1.

4.6. Extracting Candidate Genes Undelaying Detected QTLs

One of the most common ways to verify QTL and candidate genes co-localized with MTAs detected using the tested GWAS methods is to investigate the functional annotation of candidate genes. The potential genes and QTL were retrieved based on the G. max William 82 reference gene models 2.0 in SoyBase (https://www.soybase.org (accessed on 15 July 2023)) on 150 k bp flanking regions of each MTA, identified using LD decay distance (Figure 6). Previous studies, gene ontology, and Go term enrichment (https://www.soybase.org (accessed on 15 July 2023)) were used as three criteria to detect the most relevant over-represented QTL and genes with a trait of interest.

5. Conclusions

This study suggests that improved GWAS methods, such as SVR-mediated GWAS, can enhance the understanding of the genetic basis of seed composition traits in soybeans. This understanding can be used by food-grade soybean breeders to develop more reliable and efficient cultivars. The study also identified a candidate gene, Glyma.16G133500, that could potentially break the negative correlation between seed oil and protein concentrations. Further investigation of the identified candidate genes and their differential gene expressions could lead to the development of gene-specific markers for marker-assisted selection (MAS) in soybean breeding programs. Overall, the results highlight the potential of advanced computational methods for improving the accuracy and efficiency of identifying MTAs and developing new soybean varieties with desired seed composition traits.

Supplementary Materials

The following supporting information can be downloaded at: https://www.mdpi.com/article/10.3390/plants12142659/s1, Table S1: The full list of detected MTAs for seed protein using FarmCPU in the tested soybean population. Table S2: The full list of detected MTAs for seed protein using SVR in the tested soybean population. Table S3: The full list of detected MTAs for seed oil using FarmCPU in the tested soybean population. Table S4: The full list of detected MTAs for seed oil using SVR in the tested soybean population. Table S5: The full list of detected MTAs for seed oil using FarmCPU in the tested soybean population. Table S6: The full list of detected MTAs for 100-seed weight using SVR in the tested soybean population.

Author Contributions

Conceptualization, M.E.; methodology, M.E.; software, M.Y.-N.; validation, M.Y.-N., S.T., D.T., I.R. and M.E.; formal analysis, M.Y.-N.; investigation, M.Y.-N.; resources, M.E.; data curation, M.Y.-N.; writing—original draft preparation, M.Y.-N.; writing—review and editing, M.Y.-N., S.T., D.T., I.R. and M.E.; visualization, M.Y.-N.; gene extraction analysis, M.Y.-N. and S.T.; supervision, M.E.; project administration, M.E.; funding acquisition, M.E. All authors have read and agreed to the published version of the manuscript.

Funding

This project was funded in part by Grain Farmers of Ontario (GFO) and SeCan (fund number 054013). The funding bodies did not play any role in the design of the study and collection, analysis, or interpretation of data or in writing the manuscript.

Data Availability Statement

All datasets will be freely available upon request.

Acknowledgments

The authors are grateful to the past and current members of Eskandari Laboratory at the University of Guelph, Ridgetown, Robert Brandt, Bryan Stirling, and John Kobler for their technical support.

Conflicts of Interest

The authors declare no conflict of interest.

References

  1. Liu, X.; Jin, J.; Wang, G.; Herbert, S.J. Soybean yield physiology and development of high-yielding practices in Northeast China. Field Crops Res. 2008, 105, 157–171. [Google Scholar] [CrossRef]
  2. Joshi, V.; Kumar, S. Meat Analogues: Plant based alternatives to meat products-A review. Int. J. Food Ferment. Technol. 2015, 5, 107. [Google Scholar] [CrossRef]
  3. Eskandari, M.; Cober, E.R.; Rajcan, I. Genetic control of soybean seed oil: II. QTL and genes that increase oil concentration without decreasing protein or with increased seed yield. Theor. Appl. Genet. 2013, 126, 1677–1687. [Google Scholar] [CrossRef]
  4. Hong, H.; Yoosefzadeh Najafabadi, M.; Rajcan, I. Correlations between soybean seed quality traits using a genome-wide association study panel grown in Canadian and Ukrainian mega-environments. Can. J. Plant Sci. 2022, 102, 1040–1052. [Google Scholar] [CrossRef]
  5. Yoosefzadeh-Najafabadi, M.; Rajcan, I. Six decades of soybean breeding in Ontario, Canada: A tradition of innovation. Can. J. Plant Sci. 2022. [Google Scholar] [CrossRef]
  6. Zhu, X.; Leiser, W.L.; Hahn, V.; Würschum, T. Identification of seed protein and oil related QTL in 944 RILs from a diallel of early-maturing European soybean. Crop J. 2021, 9, 238–247. [Google Scholar] [CrossRef]
  7. Hong, H.; Najafabadi, M.Y.; Torkamaneh, D.; Rajcan, I. Identification of quantitative trait loci associated with seed quality traits between Canadian and Ukrainian mega-environments using genome-wide association study. Theor. Appl. Genet. 2022, 135, 2515–2530. [Google Scholar] [CrossRef] [PubMed]
  8. Liu, X.; Qin, D.; Piersanti, A.; Zhang, Q.; Miceli, C.; Wang, P. Genome-wide association study identifies candidate genes related to oleic acid content in soybean seeds. BMC Plant Biol. 2020, 20, 399. [Google Scholar] [CrossRef]
  9. Zhang, T.; Wu, T.; Wang, L.; Jiang, B.; Zhen, C.; Yuan, S.; Hou, W.; Wu, C.; Han, T.; Sun, S. A combined linkage and GWAS analysis identifies QTLs linked to soybean seed protein and oil content. Int. J. Mol. Sci. 2019, 20, 5915. [Google Scholar] [CrossRef] [Green Version]
  10. Bhat, J.A.; Yu, D. High-throughput NGS-based genotyping and phenotyping: Role in genomics-assisted breeding for soybean improvement. Legume Sci. 2021, 3, e81. [Google Scholar] [CrossRef]
  11. Yoosefzadeh-Najafabadi, M.; Eskandari, M.; Belzile, F.; Torkamaneh, D. Genome-Wide Association Study Statistical Models: A Review. In Genome-Wide Association Studies; Humana: New York, NY, USA, 2022; pp. 43–62. [Google Scholar]
  12. Alqudah, A.M.; Sallam, A.; Baenziger, P.S.; Börner, A. GWAS: Fast-forwarding gene identification and characterization in temperate Cereals: Lessons from Barley—A review. J. Adv. Res. 2020, 22, 119–135. [Google Scholar] [CrossRef]
  13. Yoosefzadeh Najafabadi, M.; Hesami, M.; Eskandari, M. Machine Learning-Assisted Approaches in Modernized Plant Breeding Programs. Genes 2023, 14, 777. [Google Scholar] [CrossRef]
  14. Tibbs Cortes, L.; Zhang, Z.; Yu, J. Status and prospects of genome-wide association studies in plants. Plant Genome 2021, 14, e20077. [Google Scholar] [CrossRef]
  15. Bush, W.S.; Moore, J.H. Genome-wide association studies. PLoS Comput. Biol. 2012, 8, e1002822. [Google Scholar] [CrossRef] [Green Version]
  16. Kaler, A.S.; Gillman, J.D.; Beissinger, T.; Purcell, L.C. Comparing different statistical models and multiple testing corrections for association mapping in soybean and maize. Front. Plant Sci. 2020, 10, 1794. [Google Scholar] [CrossRef] [PubMed] [Green Version]
  17. Eltaher, S.; Baenziger, P.S.; Belamkar, V.; Emara, H.A.; Nower, A.A.; Salem, K.F.; Alqudah, A.M.; Sallam, A. GWAS revealed effect of genotype× environment interactions for grain yield of Nebraska winter wheat. BMC Genom. 2021, 22, 2. [Google Scholar] [CrossRef]
  18. Li, S.; Zhang, C.; Yang, D.; Lu, M.; Qian, Y.; Jin, F.; Liu, X.; Wang, Y.; Liu, W.; Li, X. Detection of QTNs for kernel moisture concentration and kernel dehydration rate before physiological maturity in maize using multi-locus GWAS. Sci. Rep. 2021, 11, 1764. [Google Scholar] [CrossRef]
  19. Yoosefzadeh Najafabadi, M. Using Advanced Proximal Sensing and Genotyping Tools Combined with Bigdata Analysis Methods to Improve Soybean Yield. Ph.D. Thesis, University of Guelph, Guelph, ON, Canada, 2021. [Google Scholar]
  20. Somegowda, V.K.; Rayaprolu, L.; Rathore, A.; Deshpande, S.P.; Gupta, R. Genome-Wide Association Studies (GWAS) for Traits Related to Fodder Quality and Biofuel in Sorghum: Progress and Prospects. Protein Pept. Lett. 2021, 28, 843–854. [Google Scholar] [CrossRef]
  21. Yoosefzadeh-Najafabadi, M.; Torabi, S.; Tulpan, D.; Rajcan, I.; Eskandari, M. Genome-Wide Association Studies of Soybean Yield-Related Hyperspectral Reflectance Bands Using Machine Learning-Mediated Data Integration Methods. Front. Plant Sci. 2021, 12, 777028. [Google Scholar] [CrossRef] [PubMed]
  22. Li, D.; Gaquerel, E. Next-Generation Mass Spectrometry Metabolomics Revives the Functional Analysis of Plant Metabolic Diversity. Annu. Rev. Plant Biol. 2021, 72, 867–891. [Google Scholar] [CrossRef] [PubMed]
  23. Yoosefzadeh Najafabadi, M.; Hesami, M.; Rajcan, I. Unveiling the Mysteries of Non-Mendelian Heredity in Plant Breeding. Plants 2023, 12, 1956. [Google Scholar] [CrossRef]
  24. Leonelli, S. Scientific Research and Big Data; Stanford Encyclopedia of Philosophy: Stanford, CA, USA, 2020. [Google Scholar]
  25. Yoosefzadeh-Najafabadi, M.; Rajcan, I.; Eskandari, M. Optimizing genomic selection in soybean: An important improvement in agricultural genomics. Heliyon 2022, 8, e11873. [Google Scholar] [CrossRef] [PubMed]
  26. Nasser, T.; Tariq, R. Big data challenges. J. Comput. Eng. Inf. Technol. 2015, 4, 3. [Google Scholar] [CrossRef]
  27. Yoosefzadeh-Najafabadi, M.; Singh, K.D.; Pourreza, A.; Sandhu, K.S.; Rajcan, I. Remote and proximal sensing: How far has it come to help plant breeders? In Advances in Agronomy; Elsevier: Amsterdam, The Netherlands, 2023. [Google Scholar]
  28. Lee, S.; Liang, X.; Woods, M.; Reiner, A.S.; Concannon, P.; Bernstein, L.; Lynch, C.F.; Boice, J.D.; Deasy, J.O.; Bernstein, J.L. Machine learning on genome-wide association studies to predict the risk of radiation-associated contralateral breast cancer in the WECARE Study. PLoS ONE 2020, 15, e0226157. [Google Scholar] [CrossRef]
  29. Yoosefzadeh-Najafabadi, M.; Tulpan, D.; Eskandari, M. Application of machine learning and genetic optimization algorithms for modeling and optimizing soybean yield using its component traits. PLoS ONE 2021, 16, e0250665. [Google Scholar] [CrossRef]
  30. Pepe, M.; Hesami, M.; Jones, A.M.P. Machine learning-mediated development and optimization of disinfection protocol and scarification method for improved in vitro germination of cannabis seeds. Plants 2021, 10, 2397. [Google Scholar] [CrossRef]
  31. Vapnik, V.N. The support vector method. In Proceedings of the International Conference on Artificial Neural Networks, Lausanne, Switzerland, 8–10 October 1997; pp. 261–271. [Google Scholar]
  32. Drucker, H.; Burges, C.J.; Kaufman, L.; Smola, A.; Vapnik, V. Support vector regression machines. Adv. Neural Inf. Process. Syst. 1997, 9, 155–161. [Google Scholar]
  33. Yoosefzadeh-Najafabadi, M.; Earl, H.J.; Tulpan, D.; Sulik, J.; Eskandari, M. Application of Machine Learning Algorithms in Plant Breeding: Predicting Yield From Hyperspectral Reflectance in Soybean. Front. Plant Sci. 2021, 11, 624273. [Google Scholar] [CrossRef]
  34. Pirooznia, M.; Han, S.; Lee, R.S. Machine Learning and Network-Driven Integrative Genomics. Front. Genet. 2021, 12, 327. [Google Scholar] [CrossRef]
  35. Hesami, M.; Yoosefzadeh Najafabadi, M.; Adamek, K.; Torkamaneh, D.; Jones, A.M.P. Synergizing off-target predictions for in silico insights of CENH3 knockout in cannabis through CRISPR/CAS. Molecules 2021, 26, 2053. [Google Scholar] [CrossRef]
  36. Jafari, M.; Daneshvar, M.H.; Jafari, S.; Hesami, M. Machine learning-assisted in vitro rooting optimization in passiflora caerulea. Forests 2022, 13, 2020. [Google Scholar] [CrossRef]
  37. Shen, X.; Gong, X.; Cai, Y.; Guo, Y.; Tu, J.; Li, H.; Zhang, T.; Wang, J.; Xue, F.; Zhu, Z.-J. Normalization and integration of large-scale metabolomics data using support vector regression. Metabolomics 2016, 12, 89. [Google Scholar] [CrossRef]
  38. de Oliveira, F.C.; Borges, C.C.H.; Almeida, F.N.; e Silva, F.F.; da Silva Verneque, R.; da Silva, M.V.G.; Arbex, W. SNPs selection using support vector regression and genetic algorithms in GWAS. BMC Genom. 2014, 15, S4. [Google Scholar] [CrossRef] [Green Version]
  39. Dhanapal, A.P.; Ray, J.D.; Smith, J.R.; Purcell, L.C.; Fritschi, F.B. Identification of Novel Genomic Loci Associated with Soybean Shoot Tissue Macro and Micronutrient Concentrations. Plant Genome 2018, 11, 170066. [Google Scholar] [CrossRef] [PubMed]
  40. Li, Y.H.; Shi, X.H.; Li, H.H.; Reif, J.C.; Wang, J.J.; Liu, Z.X.; He, S.; Yu, B.S.; Qiu, L.J. Dissecting the genetic basis of resistance to soybean cyst nematode combining linkage and association mapping. Plant Genome 2016, 9. [Google Scholar] [CrossRef] [PubMed] [Green Version]
  41. Zhang, D.; Lü, H.; Chu, S.; Zhang, H.; Zhang, H.; Yang, Y.; Li, H.; Yu, D. The genetic architecture of water-soluble protein content and its genetic relationship to total protein content in soybean. Sci. Rep. 2017, 7, 5053. [Google Scholar] [CrossRef] [PubMed] [Green Version]
  42. Dhanapal, A.P.; Ray, J.D.; Singh, S.K.; Hoyos-Villegas, V.; Smith, J.R.; Purcell, L.C.; King, C.A.; Fritschi, F.B. Association mapping of total carotenoids in diverse soybean genotypes based on leaf extracts and high-throughput canopy spectral reflectance measurements. PLoS ONE 2015, 10, e0137213. [Google Scholar] [CrossRef] [Green Version]
  43. Kaler, A.S.; Dhanapal, A.P.; Ray, J.D.; King, C.A.; Fritschi, F.B.; Purcell, L.C. Genome-wide association mapping of carbon isotope and oxygen isotope ratios in diverse soybean genotypes. Crop Sci. 2017, 57, 3085–3100. [Google Scholar] [CrossRef]
  44. Zhang, J.; Song, Q.; Cregan, P.B.; Nelson, R.L.; Wang, X.; Wu, J.; Jiang, G.-L. Genome-wide association study for flowering time, maturity dates and plant height in early maturing soybean (Glycine max) germplasm. BMC Genom. 2015, 16, 217. [Google Scholar] [CrossRef] [Green Version]
  45. Xavier, A.; Hall, B.; Hearst, A.A.; Cherkauer, K.A.; Rainey, K.M. Genetic architecture of phenomic-enabled canopy coverage in Glycine max. Genetics 2017, 206, 1081–1089. [Google Scholar] [CrossRef] [Green Version]
  46. Zhang, J.; Wang, X.; Lu, Y.; Bhusal, S.J.; Song, Q.; Cregan, P.B.; Yen, Y.; Brown, M.; Jiang, G.-L. Genome-wide Scan for Seed Composition Provides Insights into Soybean Quality Improvement and the Impacts of Domestication and Breeding. Mol. Plant 2018, 11, 460–472. [Google Scholar] [CrossRef] [PubMed] [Green Version]
  47. Hu, Z.; Zhang, D.; Zhang, G.; Kan, G.; Hong, D.; Yu, D. Association mapping of yield-related traits and SSR markers in wild soybean (Glycine soja Sieb. and Zucc.). Breed. Sci. 2014, 63, 441–449. [Google Scholar] [CrossRef] [Green Version]
  48. Sonah, H.; O’Donoughue, L.; Cober, E.; Rajcan, I.; Belzile, F. Identification of loci governing eight agronomic traits using a GBS-GWAS approach and validation by QTL mapping in soya bean. Plant Biotechnol. J. 2015, 13, 211–221. [Google Scholar] [CrossRef]
  49. Moellers, T.C.; Singh, A.; Zhang, J.; Brungardt, J.; Kabbage, M.; Mueller, D.S.; Grau, C.R.; Ranjan, A.; Smith, D.L.; Chowda-Reddy, R. Main and epistatic loci studies in soybean for Sclerotinia sclerotiorum resistance reveal multiple modes of resistance in multi-environments. Sci. Rep. 2017, 7, 3554. [Google Scholar] [CrossRef] [Green Version]
  50. Wen, Z.; Tan, R.; Yuan, J.; Bales, C.; Du, W.; Zhang, S.; Chilvers, M.I.; Schmidt, C.; Song, Q.; Cregan, P.B. Genome-wide association mapping of quantitative resistance to sudden death syndrome in soybean. BMC Genom. 2014, 15, 809. [Google Scholar] [CrossRef] [Green Version]
  51. Chang, H.-X.; Lipka, A.E.; Domier, L.L.; Hartman, G.L. Characterization of disease resistance loci in the USDA soybean germplasm collection using genome-wide association studies. Phytopathology 2016, 106, 1139–1151. [Google Scholar] [CrossRef] [Green Version]
  52. Vuong, T.; Sonah, H.; Meinhardt, C.; Deshmukh, R.; Kadam, S.; Nelson, R.; Shannon, J.; Nguyen, H. Genetic architecture of cyst nematode resistance revealed by genome-wide association study in soybean. BMC Genom. 2015, 16, 593. [Google Scholar] [CrossRef] [PubMed] [Green Version]
  53. Mamidi, S.; Lee, R.K.; Goos, J.R.; McClean, P.E. Genome-wide association studies identifies seven major regions responsible for iron deficiency chlorosis in soybean (Glycine max). PLoS ONE 2014, 9, e107469. [Google Scholar] [CrossRef]
  54. Mamidi, S.; Chikara, S.; Goos, R.J.; Hyten, D.L.; Annam, D.; Moghaddam, S.M.; Lee, R.K.; Cregan, P.B.; McClean, P.E. Genome-wide association analysis identifies candidate genes associated with iron deficiency chlorosis in soybean. Plant Genome 2011, 4. [Google Scholar] [CrossRef] [Green Version]
  55. Fang, C.; Ma, Y.; Wu, S.; Liu, Z.; Wang, Z.; Yang, R.; Hu, G.; Zhou, Z.; Yu, H.; Zhang, M. Genome-wide association studies dissect the genetic networks underlying agronomical traits in soybean. Genome Biol. 2017, 18, 161. [Google Scholar] [CrossRef] [Green Version]
  56. Kan, G.; Zhang, W.; Yang, W.; Ma, D.; Zhang, D.; Hao, D.; Hu, Z.; Yu, D. Association mapping of soybean seed germination under salt stress. Mol. Genet. Genom. 2015, 290, 2147–2162. [Google Scholar] [CrossRef] [PubMed]
  57. Kumar, M.; Lal, S. Molecular analysis of soybean varying in water use efficiency using SSRs markers. J. Environ. Biol. 2015, 36, 1011–1016. [Google Scholar]
  58. Yoosefzadeh-Najafabadi, M.; Eskandari, M.; Torabi, S.; Torkamaneh, D.; Tulpan, D.; Rajcan, I. Machine-Learning-Based Genome-Wide Association Studies for Uncovering QTL Underlying Soybean Yield and Its Components. Int. J. Mol. Sci. 2022, 23, 5538. [Google Scholar] [CrossRef]
  59. Copley, T.R.; Duceppe, M.-O.; O’Donoughue, L.S. Identification of novel loci associated with maturity and yield traits in early maturity soybean plant introduction lines. BMC Genom. 2018, 19, 167. [Google Scholar] [CrossRef] [Green Version]
  60. Korir, P.C.; Zhang, J.; Wu, K.; Zhao, T.; Gai, J. Association mapping combined with linkage analysis for aluminum tolerance among soybean cultivars released in Yellow and Changjiang River Valleys in China. Theor. Appl. Genet. 2013, 126, 1659–1675. [Google Scholar] [CrossRef] [PubMed]
  61. Priolli, R.H.G.; Campos, J.; Stabellini, N.; Pinheiro, J.; Vello, N. Association mapping of oil content and fatty acid components in soybean. Euphytica 2015, 203, 83–96. [Google Scholar] [CrossRef]
  62. Zhang, S.; Hao, D.; Zhang, S.; Zhang, D.; Wang, H.; Du, H.; Kan, G.; Yu, D. Genome-wide association mapping for protein, oil and water-soluble protein contents in soybean. Mol. Genet. Genom. 2021, 296, 91–102. [Google Scholar] [CrossRef]
  63. Alaswad, A.A.; Song, B.; Oehrle, N.W.; Wiebold, W.J.; Mawhinney, T.P.; Krishnan, H.B. Development of soybean experimental lines with enhanced protein and sulfur amino acid content. Plant Sci. 2021, 308, 110912. [Google Scholar] [CrossRef]
  64. Wang, J.; Zhou, P.; Shi, X.; Yang, N.; Yan, L.; Zhao, Q.; Yang, C.; Guan, Y. Primary metabolite contents are correlated with seed protein and oil traits in near-isogenic lines of soybean. Crop J. 2019, 7, 651–659. [Google Scholar] [CrossRef]
  65. Chen, B.; Zhang, G.; Li, P.; Yang, J.; Guo, L.; Benning, C.; Wang, X.; Zhao, J. Multiple GmWRI1s are redundantly involved in seed filling and nodulation by regulating plastidic glycolysis, lipid biosynthesis and hormone signalling in soybean (Glycine max). Plant Biotechnol. J. 2020, 18, 155–171. [Google Scholar] [CrossRef] [Green Version]
  66. Oh, M.; Komatsu, S. Characterization of proteins in soybean roots under flooding and drought stresses. J. Proteom. 2015, 114, 161–181. [Google Scholar] [CrossRef] [PubMed]
  67. Bates, P.D.; Stymne, S.; Ohlrogge, J. Biochemical pathways in seed oil synthesis. Curr. Opin. Plant Biol. 2013, 16, 358–364. [Google Scholar] [CrossRef] [PubMed] [Green Version]
  68. Baud, S.; Dubreucq, B.; Miquel, M.; Rochat, C.; Lepiniec, L. Storage reserve accumulation in Arabidopsis: Metabolic and developmental control of seed filling. Arab. Book/Am. Soc. Plant Biol. 2008, 6, e0113. [Google Scholar] [CrossRef] [PubMed] [Green Version]
  69. Mohammadi, M.; Xavier, A.; Beckett, T.; Beyer, S.; Chen, L.; Chikssa, H.; Cross, V.; Moreira, F.F.; French, E.; Gaire, R. Identification, Deployment, and Transferability of Quantitative Trait Loci from Genome-Wide Association Studies in Plants. Curr. Plant Biol. 2020, 24, 100145. [Google Scholar] [CrossRef]
  70. Li, S.; Xu, H.; Yang, J.; Zhao, T. Dissecting the genetic architecture of seed protein and oil content in soybean from the Yangtze and Huaihe River valleys using multi-locus genome-wide association studies. Int. J. Mol. Sci. 2019, 20, 3041. [Google Scholar] [CrossRef] [Green Version]
  71. Szymczak, S.; Biernacka, J.M.; Cordell, H.J.; González-Recio, O.; König, I.R.; Zhang, H.; Sun, Y.V. Machine learning in genome-wide association studies. Genet. Epidemiol. 2009, 33, S51–S57. [Google Scholar] [CrossRef] [Green Version]
  72. Zhou, W.; Bellis, E.S.; Stubblefield, J.; Causey, J.; Qualls, J.; Walker, K.; Huang, X. Minor QTLs mining through the combination of GWAS and machine learning feature selection. BioRxiv 2019, 2019, 712190. [Google Scholar]
  73. Yoosefzadeh-Najafabadi, M.; Tulpan, D.; Eskandari, M. Using Hybrid Artificial Intelligence and Evolutionary Optimization Algorithms for Estimating Soybean Yield and Fresh Biomass Using Hyperspectral Vegetation Indices. Remote Sens. 2021, 13, 2555. [Google Scholar] [CrossRef]
  74. González-Camacho, J.M.; Ornella, L.; Pérez-Rodríguez, P.; Gianola, D.; Dreisigacker, S.; Crossa, J. Applications of machine learning methods to genomic selection in breeding wheat for rust resistance. Plant Genome 2018, 11, 170104. [Google Scholar] [CrossRef] [Green Version]
  75. Hesami, M.; Jones, A.M.P. Modeling and optimizing callus growth and development in Cannabis sativa using random forest and support vector machine in combination with a genetic algorithm. Appl. Microbiol. Biotechnol. 2021, 105, 5201–5212. [Google Scholar] [CrossRef]
  76. Ziliak, S. P values and the search for significance. Nat. Methods 2017, 14, 3–4. [Google Scholar]
  77. Di Leo, G.; Sardanelli, F. Statistical significance: P value, 0.05 threshold, and applications to radiomics—Reasons for a conservative approach. Eur. Radiol. Exp. 2020, 4, 18. [Google Scholar] [CrossRef] [PubMed] [Green Version]
  78. Patil, G.; Mian, R.; Vuong, T.; Pantalone, V.; Song, Q.; Chen, P.; Shannon, G.J.; Carter, T.C.; Nguyen, H.T. Molecular mapping and genomics of soybean seed protein: A review and perspective for the future. Theor. Appl. Genet. 2017, 130, 1975–1991. [Google Scholar] [CrossRef] [PubMed] [Green Version]
  79. Yoosefzadeh-Najafabadi, M.; Rajcan, I.; Vazin, M. High-throughput plant breeding approaches: Moving along with plant-based food demands for pet food industries. Front. Vet. Sci. 2022, 9, 991844. [Google Scholar] [CrossRef]
  80. Abedi, E.; Sahari, M.A. Long-chain polyunsaturated fatty acid sources and evaluation of their nutritional and functional properties. Food Sci. Nutr. 2014, 2, 443–463. [Google Scholar] [CrossRef]
  81. Torabi, S.; Sukumaran, A.; Dhaubhadel, S.; Johnson, S.E.; LaFayette, P.; Parrott, W.A.; Rajcan, I.; Eskandari, M. Effects of type I Diacylglycerol O-acyltransferase (DGAT1) genes on soybean (Glycine max L.) seed composition. Sci. Rep. 2021, 11, 2556. [Google Scholar] [CrossRef]
  82. Napier, J.A.; Haslam, R.P.; Beaudoin, F.; Cahoon, E.B. Understanding and manipulating plant lipid composition: Metabolic engineering leads the way. Curr. Opin. Plant Biol. 2014, 19, 68–75. [Google Scholar] [CrossRef] [Green Version]
  83. Kanai, M.; Yamada, T.; Hayashi, M.; Mano, S.; Nishimura, M. Soybean (Glycine max L.) triacylglycerol lipase GmSDP1 regulates the quality and quantity of seed oil. Sci. Rep. 2019, 9, 8924. [Google Scholar] [CrossRef] [Green Version]
  84. Pádua, G.P.d.; Carvalho, M.L.M.D.; França-Neto, J.D.B.; Guerreiro, M.C.; Guimarães, R.M. Response of soybean genotypes to the expression of green seed under temperature and water stresses. Rev. Bras. Sementes 2009, 31, 140–149. [Google Scholar] [CrossRef]
  85. Veas, R.E.; Ergo, V.V.; Vega, C.R.; Lascano, R.H.; Rondanini, D.P.; Carrera, C.S. Soybean seed growth dynamics exposed to heat and water stress during the filling period under field conditions. J. Agron. Crop Sci. 2021, 208, 472–485. [Google Scholar] [CrossRef]
  86. Yao, X.; Nie, J.; Bai, R.; Sui, X. Amino acid transporters in plants: Identification and function. Plants 2020, 9, 972. [Google Scholar] [CrossRef] [PubMed]
  87. Li, Y.; Wang, G.; Xu, Z.; Li, J.; Sun, M.; Guo, J.; Ji, W. Organization and regulation of soybean SUMOylation system under abiotic stress conditions. Front. Plant Sci. 2017, 8, 1458. [Google Scholar] [CrossRef] [PubMed] [Green Version]
  88. Kandasamy, P.; Gyimesi, G.; Kanai, Y.; Hediger, M.A. Amino acid transporters revisited: New views in health and disease. Trends Biochem. Sci. 2018, 43, 752–789. [Google Scholar] [CrossRef]
  89. Clemente, T.E.; Cahoon, E.B. Soybean oil: Genetic approaches for modification of functionality and total content. Plant Physiol. 2009, 151, 1030–1040. [Google Scholar] [CrossRef] [Green Version]
  90. Ghassemi-Golezani, K.; Farhangi-Abriz, S. Changes in Oil Accumulation and Fatty Acid Composition of Soybean Seeds under Salt Stress in Response to Salicylic Acid and Jasmonic Acid. Russ. J. Plant Physiol. 2018, 65, 229–236. [Google Scholar] [CrossRef]
  91. Singh, B.; Usha, K. Salicylic acid induced physiological and biochemical changes in wheat seedlings under water stress. Plant Growth Regul. 2003, 39, 137–141. [Google Scholar] [CrossRef]
  92. Stevenson, D.G.; Doorenbos, R.K.; Jane, J.L.; Inglett, G.E. Structures and functional properties of starch from seeds of three soybean (Glycine max (L.) Merr.) varieties. Starch-Stärke 2006, 58, 509–519. [Google Scholar] [CrossRef]
  93. Potts, R.O.; Tamada, J.A.; Tierney, M.J. Glucose monitoring by reverse iontophoresis. Diabetes/Metab. Res. Rev. 2002, 18, S49–S53. [Google Scholar] [CrossRef]
  94. Geigenberger, P.; Stitt, M.; Fernie, A. Metabolic control analysis and regulation of the conversion of sucrose to starch in growing potato tubers. Plant Cell Environ. 2004, 27, 655–673. [Google Scholar] [CrossRef]
  95. Lee, S.-K.; Jeon, J.-S. Crucial role of inorganic pyrophosphate in integrating carbon metabolism from sucrose breakdown to starch synthesis in rice endosperm. Plant Sci. 2020, 298, 110572. [Google Scholar] [CrossRef] [PubMed]
  96. Stroup, W.; Mulitze, D. Nearest neighbor adjusted best linear unbiased prediction. Am. Stat. 1991, 45, 194–200. [Google Scholar]
  97. Katsileros, A.; Drosou, K.; Koukouvinos, C. Evaluation of nearest neighbor methods in wheat genotype experiments. Commun. Biometry Crop Sci. 2015, 10, 115–123. [Google Scholar]
  98. Bowley, S. A Hitchhiker’s Guide to Statistics in Plant Biology; Any Old Subject Books: Guelph, ON, Canada, 1999. [Google Scholar]
  99. Hurburgh, C.R. Measurement of fatty acids in whole soybeans with near infrared spectroscopy. Lipid Technol. 2007, 19, 88–90. [Google Scholar] [CrossRef]
  100. Bellaloui, N.; Mengistu, A.; Walker, E.R.; Young, L.D. Soybean seed composition as affected by seeding rates and row spacing. Crop Sci. 2014, 54, 1782–1795. [Google Scholar] [CrossRef]
  101. Goldberger, A.S. Best linear unbiased prediction in the generalized linear regression model. J. Am. Stat. Assoc. 1962, 57, 369–375. [Google Scholar] [CrossRef]
  102. Bates, D.; Mächler, M.; Bolker, B.; Walker, S. Fitting linear mixed-effects models using lme4. arXiv 2014, arXiv:1406.5823. [Google Scholar]
  103. Najafabadi, M.Y.; Heidari, A.; Rajcan, I. AllInOne Pre-processing: A comprehensive preprocessing framework in plant field phenotyping. SoftwareX 2023, 23, 101464. [Google Scholar] [CrossRef]
  104. Kaur, P.; Bayer, P.E.; Milec, Z.; Vrána, J.; Yuan, Y.; Appels, R.; Edwards, D.; Batley, J.; Nichols, P.; Erskine, W. An advanced reference genome of Trifolium subterraneum L. reveals genes related to agronomic performance. Plant Biotechnol. J. 2017, 15, 1034–1046. [Google Scholar] [CrossRef] [Green Version]
  105. Torkamaneh, D.; Laroche, J.; Bastien, M.; Abed, A.; Belzile, F. Fast-GBS: A new pipeline for the efficient and highly accurate calling of SNPs from genotyping-by-sequencing data. BMC Bioinform. 2017, 18, 5. [Google Scholar] [CrossRef] [Green Version]
  106. Raj, A.; Stephens, M.; Pritchard, J.K. fastSTRUCTURE: Variational inference of population structure in large SNP data sets. Genetics 2014, 197, 573–589. [Google Scholar] [CrossRef] [Green Version]
  107. Yang, J.; Yeh, C.-T.E.; Ramamurthy, R.K.; Qi, X.; Fernando, R.L.; Dekkers, J.C.; Garrick, D.J.; Nettleton, D.; Schnable, P.S. Empirical comparisons of different statistical models to identify and validate kernel row number-associated variants from structured multi-parent mapping populations of maize. G3 Genes Genomes Genet. 2018, 8, 3567–3575. [Google Scholar] [CrossRef] [PubMed] [Green Version]
  108. Liu, X.; Huang, M.; Fan, B.; Buckler, E.S.; Zhang, Z. Iterative usage of fixed and random effect models for powerful and efficient genome-wide association studies. PLoS Genet. 2016, 12, e1005767. [Google Scholar] [CrossRef] [PubMed]
  109. Benjamini, Y.; Hochberg, Y. Controlling the false discovery rate: A practical and powerful approach to multiple testing. J. R. Stat. Soc. Ser. B (Methodol.) 1995, 57, 289–300. [Google Scholar] [CrossRef]
  110. Yin, L.; Zhang, H.; Tang, Z.; Xu, J.; Yin, D.; Zhang, Z.; Yuan, X.; Zhu, M.; Zhao, S.; Li, X. rmvp: A memory-efficient, visualization-enhanced, and parallel-accelerated tool for genome-wide association study. Genom. Proteom. Bioinform. 2021, 19, 619–628. [Google Scholar] [CrossRef]
  111. Weston, J.; Mukherjee, S.; Chapelle, O.; Pontil, M.; Poggio, T.; Vapnik, V. Feature selection for SVMs. In Advances in Neural Information Processing Systems; MIT Press: Cambridge, MA, USA, 2000; pp. 668–674. [Google Scholar]
  112. Siegmann, B.; Jarmer, T. Comparison of different regression models and validation techniques for the assessment of wheat leaf area index from hyperspectral data. Int. J. Remote Sens. 2015, 36, 4519–4534. [Google Scholar] [CrossRef]
  113. Doerge, R.W.; Churchill, G.A. Permutation tests for multiple loci affecting a quantitative character. Genetics 1996, 142, 285–294. [Google Scholar] [CrossRef] [PubMed]
  114. Churchill, G.A.; Doerge, R.W. Empirical threshold values for quantitative trait mapping. Genetics 1994, 138, 963–971. [Google Scholar] [CrossRef]
  115. Kuhn, M.; Wing, J.; Weston, S.; Williams, A.; Keefer, C.; Engelhardt, A.; Cooper, T.; Mayer, Z.; Kenkel, B.; Team, R.C. Package ‘caret’. R J. 2020. Available online: https://github.com/topepo/caret/ (accessed on 10 July 2023).
Figure 1. Spatial distribution (A) of the tested GWAS panel across four different environments. The scatter plot (B) shows the observed values of each soybean genotype, and the color-coded map (C) represents the spatial variations in the performance of the genotypes across the environments.
Plants 12 02659 g001
Figure 2. The linear Pearson correlation coefficients between soybean seed protein, oil, 100-seed weight, and yield in the tested GWAS panel across four tested environments. The intensity of the colors represents the strength of the correlations, with red indicating a strong positive correlation.
Plants 12 02659 g002
Figure 3. Kinship (top) and structure (bottom) plots for the tested GWAS panel. The x-axis is the number of genotypes used in this GWAS panel, and the y-axis is the membership of each subgroup. SP1-SP7 stands for the seven subpopulations.
Plants 12 02659 g003
Figure 4. Manhattan and quantile–quantile plots showcasing the results of GWAS studies on soybean seed protein, oil, and 100-seed weight. The plots were generated using two different methods: FarmCPU and SVR. The plots are arranged in a left-to-right sequence, with FarmCPU results displayed first, followed by SVR results.
Plants 12 02659 g004
Figure 5. GWAS results of the top significant SNPs associated with soybean seed protein (A), oil (B), and 100-seed weight (C) across different environments. The y-axis represents the value of the trait of interest, and the x-axis represents the genomic position of each SNP on the soybean genome.
Plants 12 02659 g005
Figure 6. Linkage disequilibrium (LD) decay plot and the flanking regions depicting associated single nucleotide polymorphisms (SNPs) with traits of interest in a panel of 227 soybean genotypes.
Plants 12 02659 g006
Table 1. The list of MTAs for seed protein identified using FarmCPU and SVR-mediated GWAS methods in the combined environment dataset colocalized with reported QTL.
GWAS MethodChromosomeMTA (Peak SNP Position)Co-Located QTLEnvironments aReference
FarmCPUS157068549Shoot Fe 1-g43NA[39]
7288161SCN 5-g32NA[40]
7705443Seed protein 7-g13NA[41]
Leaf carotenoid content 1-g11NA[42]
WUE 2-g34NA[43]
8304621Shoot Zn 1-g24NA[39]
8554284Shoot Zn 1-g25NA[39]
8620771Shoot Zn 1-g26NA[39]
SVRS0150879523Ureide content 1-g1.1NA[42]
50933494Ureide content 1-g1.2NA[42]
50945345Ureide content 1-g1.3NA[42]
50947984Ureide content 1-g1.4NA[42]
51104169First flower 2-g1NA[44]
51797141Canopy cover 1-g1NA[45]
51104169First flower 7-g1NA[44]
51679239Seed Trp 1-g1NA[46]
S0537483313Shoot Mg 1-g42&4[39]
37414768Shoot Cu 1-g62&4[39]
31380926Seed oil 5-g12&4[42]
35536817Pod number 3-g42&4[47]
31380926Seed protein 4-g12&4[48]
37297357Shoot Zn 1-g10.12&4[39]
37347763Shoot Zn 1-g112&4[39]
37289637Shoot P 1-g72&4[39]
Shoot Zn 1-g92&4[39]
37297357Shoot P 1-g8.12&4[39]
37317508Shoot P 1-g8.22&4[39]
Shoot Zn 1-g10.22&4[39]
37347763Shoot P 1-g92&4[39]
S142919862First flower 2-g20NA[44]
3198128Sclero 3-g56NA[49]
3419976Sclero 3-g57NA[49]
S1628851611Seed protein 7-g251,2&4[41]
a Detected in separate environments in addition to the combined environment. (1) 2018Ridgetown, (2) 2019Ridgetwon, (3) 2018Palmyra, (4) 2019Palmyra, (NA) not found in any separate environment. FarmCPU: fixed and random model circulating probability unification, SVR: support vector regression.
Table 2. The list of MTAs for seed oil concentration identified by FarmCPU and SVR-mediated GWAS methods in the combined environment dataset colocalized with reported QTL.
GWAS MethodChromosomePeak SNP PositionCo-Located QTLEnvironments a Reference
FarmCPUS0818259484SDS 1-g54NA[50]
18404800SDS 1-g40NA[50]
SDS 1-g55NA[50]
S1327301888Shoot Fe 1-g33NA[39]
SCN 1-g11NA[51]
27325073Shoot Fe 1-g34NA[39]
33018554SCN 4-g11NA[52]
S157705443Seed protein 7-g13NA[41]
Leaf carotenoid content 1-g11NA[42]
WUE 2-g34NA[43]
8304621Shoot Zn 1-g24NA[39]
8554284Shoot Zn 1-g25NA[39]
S1940386502Iron deficiency chlorosis 4-g27NA[53]
40550665Iron deficiency chlorosis 2-g9NA[54]
Iron deficiency chlorosis 3-g14NA[54]
SVRS0312702388Seed long-chain fatty acid 1-g7.22[55]
12704607Seed stearic 1-g2.22[55]
12917268Seed long-chain fatty acid 1-g13.22[55]
12954110Seed stearic 1-g2.32[55]
12958942Seed long-chain fatty acid 1-g13.32[55]
12989558Seed long-chain fatty acid 1-g7.32[55]
S1330062400Hilum color 2-g5.2NA[55]
Hilum color 2-g5.3NA[55]
30080662Phytoph 3-g21NA[51]
29941996Soybean mosaic virus 1-g1NA[51]
30037573Salt tolerance 1-g9NA[56]
30062400Hilum color 2-g5.1NA[55]
S143198128Sclero 3-g563[49]
3419976Sclero 3-g573[49]
S1521479453Iron deficiency chlorosis 4-g203[53]
49067066WUE 1-g53[57]
S1628851611Seed protein 7-g253[41]
a Detected in separate environments in addition to the combined environment. (1) 2018Ridgetown, (2) 2019Ridgetwon, (3) 2018Palmyra, (4) 2019Palmyra, (NA) Not found in any separate environment. FarmCPU: Fixed and random model circulating probability unification, SVR: Support Vector Regression.
Table 3. The list of colocalized reported QTL with MTAs for 100-seed weight identified using FarmCPU and SVR GWAS methods in the combined environment dataset.
GWAS MethodChromosomePeak SNP PositionCo-Located QTLEnvironments aReference
FarmCPUS18703188WUE 2-g47NA[43]
713403SCN 1-g16NA[51]
822049SCN 1-g17NA[59]
SVRS0211045403Seed Trp 1-g52&4[46]
43004026WUE 2-g72&4[48]
S0338932768Canopy width 1-g1.1NA[55]
38936586Canopy width 1-g1.2NA[55]
39088673R8 full maturity 3-g4NA[47]
S0942132672Al tolerance 1-g9NA[60]
42351295Shoot K 1-g19NA[39]
S114572326SCN 5-g224[40]
S1536329398Ureide content 1-g42NA[42]
S1637330986Seed linolenic 1-g102[61]
37153578Shoot Cu 1-g152[39]
37330986Seed palmitic 1-g142[61]
Seed oleic 1-g232[61]
Seed linoleic 1-g192[61]
37046875WUE 2-g382[40]
Iron deficiency chlorosis 3-g102[54]
37079553Node number 1-g5.12[55]
37079569Node number 1-g5.22[55]
33018083BSR 1-g22[51]
S1947335622Node number 1-g2.3NA[55]
S20276646First flower 2-g251&2[44]
First flower 7-g251&2[44]
343016Iron deficiency chlorosis 3-g151&2[54]
376574Plant height 1-g261&2[44]
Plant height 6-g261&2[44]
a Detected in separate environments in addition to the combined environment. (1) 2018Ridgetown, (2) 2019Ridgetwon, (3) 2018Palmyra, (4) 2019Palmyra, (NA) not found in any separate environment. FarmCPU: fixed and random model circulating probability unification, SVR: support vector regression.
Disclaimer/Publisher’s Note: The statements, opinions and data contained in all publications are solely those of the individual author(s) and contributor(s) and not of MDPI and/or the editor(s). MDPI and/or the editor(s) disclaim responsibility for any injury to people or property resulting from any ideas, methods, instructions or products referred to in the content.

